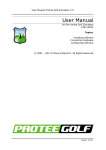
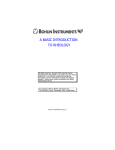
1
Babine Watershed Monitoring Framework User Manual June 2009 Prepared by Liz Osborn MRM, MSc, RPBio Current Results Nexus email: [email protected] Contents 1 Babine Watershed Monitoring Trust ....................................................................... 3 2 Monitoring Framework......................................................................................... 4 2.1 3 4 5 Land-use Plan Summary...................................................................................... 7 3.1 Babine Watershed Land Use Plans .................................................................. 7 3.2 Geographic Scope ........................................................................................ 7 3.3 Goals and Objectives .................................................................................... 7 3.4 Strategies and Indicators .............................................................................. 8 3.5 Reconciling Inconsistencies ........................................................................... 9 Knowledge Base ............................................................................................... 10 4.1 Structure and Content ................................................................................ 10 4.2 Objective's Importance ............................................................................... 11 4.3 Risk and Uncertainty .................................................................................. 12 4.3.1 Information Requirements..................................................................... 13 4.3.2 Risk ................................................................................................... 13 4.3.3 Uncertainty ......................................................................................... 14 4.3.4 Current and Future Estimates ................................................................ 15 4.4 Monitoring Difficulty ................................................................................... 15 4.5 Uncertainty About Achieving a Goal .............................................................. 17 4.6 Updating the Knowledge Base...................................................................... 17 Monitoring Priority Tables .................................................................................. 18 5.1 Overview of Prioritization Process ................................................................. 19 5.2 Determining Monitoring Candidates .............................................................. 21 5.3 Ranking Indicators That Lack Data ............................................................... 21 5.3.1 Priority for Setting Indicator Targets ....................................................... 21 5.3.2 Priority for Collecting Indicator Data ....................................................... 22 5.4 6 Using the Monitoring Framework .................................................................... 4 Ranking Indicators That Have Data............................................................... 22 5.4.1 Priority for Detecting Negative Consequences........................................... 23 5.4.2 Priority for Reducing Uncertainty ............................................................ 23 5.5 Calculating 'Secondary Score' ...................................................................... 24 5.6 Information Columns .................................................................................. 25 5.7 Additional Results ...................................................................................... 25 Glossary of Monitoring Framework Terms............................................................. 27 Acknowledgements ................................................................................................ 28 User Manual Babine Watershed Monitoring Framework 2 1 Babine Watershed Monitoring Trust The Babine Watershed Monitoring Trust (BWMT) is a registered charitable organization that independently funds and coordinates monitoring of provincial land-use plans in the Babine Watershed. The Trust was established in January, 2005 by the Bulkley Valley Community Resources Board, Babine River Foundation, Pacific Inland Resources (West Fraser Mills Ltd.), Ministry of Forests, Ministry of Water, Land and Air Protection, and Ministry of Sustainable Resource Management. The impetus behind forming the BWMT was a strong public desire to ensure the Babine Watershed's values are not degraded, while allowing its resources to be used. Covering 400,000 hectares north of Smithers BC, the Watershed is noted for its exceptional values and diversity of natural resources. Among these are wildlife, fish, forests, water and wilderness. The BWMT was designed to provide an unbiased and credible source of information to help guide management of the Babine Watershed's natural resources. Two documents are instrumental in enabling the BWMT to fulfill this role. A Trust Agreement directs and gives powers to trustees to spend Trust funds on monitoring. A Monitoring Framework facilitates impartial priority-setting and cost-benefit analysis for selecting monitoring projects. Together, these form an innovative governance structure for independent oversight of public resource management. Volunteer trustees are appointed to manage the Trust in accordance with the Trust Agreement and Monitoring Framework. The BWMT focuses on monitoring initiatives that strategically address critical aspects of land-use plans approved by the provincial government for managing the Babine Watershed. Plans for and results of monitoring projects are publicly available. The Trust's primary aim, though, is to offer monitoring results that allow for improvement or validation of the Babine's land-use plans, through an adaptive management process. The trust is funded by some resource users in the Babine Watershed along with matching contributions from the provincial government. In its first five years, the BWMT operated on an annual budget of between $40,000 and $56,000. Further information about the Babine Watershed Monitoring Trust is at their website, www.babinetrust.ca. User Manual Babine Watershed Monitoring Framework 3 2 Monitoring Framework The Babine Watershed Monitoring Framework is a tool for efficiently identifying strategic priorities for monitoring the condition and management of the Watershed's natural resources. When the Babine Watershed Monitoring Trust was formed, those involved recognized that the Trust would need to allocate its funds strategically. It had to focus its monitoring on the factors most critical to guiding sustainable resource management in the Babine Watershed. Being effective meant the trustees faced difficult decisions about what to monitor, decisions that involved assessing copious information and reconciling competing values. To assist the trustees in making optimal monitoring choices, the Babine Watershed Monitoring Framework was developed by consultants Karen Price and Dave Daust. Trustees are required to use the Monitoring Framework, available online at www.babinetrust.ca/documents.html, to efficiently make sound selections of the most effective monitoring projects to initiate. The Framework fulfills several functions, culminating in a ranking of priorities for monitoring. The Trust's projects need to be chosen with impartiality and clarity from among competing resource values and goals. To focus limited funds on the most relevant issues, the Framework prioritizes monitoring for all types of values and goals in a disciplined, transparent and comprehensive manner. To make a difference in the Babine Watershed, monitoring results must inform resource management in a legitimate and credible manner. That is why the Framework directly ties monitoring to the goals and objectives contained in the land-use plans governing the Babine Watershed. Furthermore, the Framework explicitly links management strategies to the plans' objectives. Monitoring conducted by the BWMT should efficiently produce the most relevant information about the status and likely fate of the Watershed's high-value natural resources. To identify knowledge needs and facilitate feedback to resource users, the Framework summarizes existing knowledge in a way that is readily updated and rapidly communicated to managers and planners. The Monitoring Framework is a tool that compiles the necessary information and assesses the relevant factors to identify where monitoring matters most: where there's least certainty about meeting objectives; where there's the greatest risk that objectives won't be met; and where there's simply not enough information to know the risks. Overall, the Monitoring Framework focuses on identifying the monitoring activities that can provide the results most essential for assessing how well the Babine Watershed's land-use plans are working. 2.1 Using the Monitoring Framework This manual explains the structure of and reasoning behind the Monitoring Framework, as well as how to use it for determining monitoring priorities in the Babine Watershed. The main Monitoring Framework document provides the theoretical background for the User Manual Babine Watershed Monitoring Framework 4 Framework and describes a step-by-step process for determining monitoring priorities. The working part of the Monitoring Framework, found in the appendices to that document, consists of three main components specific to the Babine Watershed: 1. Land-use Plan Summary – Compiles natural resource goals and objectives, along with management strategies and indicators, from the six land-use plans covering the Babine Watershed. 2. Knowledge Base – Summarizes background scientific information in a consistent manner to identify for each indicator any critical knowledge gaps and the risks and uncertainties associated with meeting the corresponding objective. 3. Monitoring Priority Tables – Logically rank objectives and indicators for monitoring, based upon a scoring protocol applied to information in the Knowledge Base. The three Framework components work together to arrive at a ranking of priorities for monitoring activities. Land-use plans for the Babine Watershed specify the objectives and strategies to monitor. The Knowledge Base assembles the relevant information on each objective to allow comparisons. From that, the Monitoring Priority Tables identify the objectives and indicators most beneficial to monitor. With this process, trustees can efficiently develop an Annual Monitoring Plan based upon the template in Appendix 4 of the Monitoring Framework. During its first few years, the BWMT initiated monitoring projects on fish habitat, stream crossing practices, water quality, wilderness values, grizzly bears, mountain goats, structural attributes of young forests, and spatial distribution of old forests. Results of these projects feed back to validate or improve the Babine Watershed's land-use plans, completing the cycle, as shown in Figure 2-1. Monitoring findings are forwarded to the Bulkley Valley Community Resources Board, a public group of appointed volunteers that advises government on implementation of and proposed changes to the Bulkley Land and Resource Management Plan and associated Landscape Unit Plans. The Trust's monitoring results are also provided directly to government agencies responsible for planning and managing Babine Watershed resources. User Manual Babine Watershed Monitoring Framework 5 Figure 2-1 – Babine Watershed Monitoring Framework Cycle The Monitoring Framework enables trustees to quickly reach consensus on choosing costeffective monitoring projects to address the Babine Watershed's riskiest management strategies. The Framework emphasizes filling critical gaps in existing information, and focusing on the greatest risks to achieving the goals and objectives stipulated by the Babine's land-use plans. User Manual Babine Watershed Monitoring Framework 6 3 Land-use Plan Summary To define the Monitoring Framework's scope, commitments made in the Babine Watershed's land-use plans are compiled as goals, objectives and strategies in the Land-use Plan Summary. 3.1 Babine Watershed Land Use Plans Six land-use plans, which have been agreed to at multi-stakeholder tables and approved by the provincial government, currently guide resource management within the Babine Watershed. The plans are: Bulkley Land and Resource Management Plan (LRMP) Kispiox Land and Resource Management Plan (LRMP) Babine Landscape Unit Plan (LUP) Nilkitkwa Landscape Unit Plan (LUP) West Babine Sustainable Resource Management Plan (SRMP) Babine River Corridor Park Management Direction Statement (MDS) Additional management direction comes from land-use designations made under legislation, for instance the 2007 Ungulate Winter Range Order under the Forest and Range Practices Act. The commitments in the land-use plans and designations that require monitoring are compiled in the Land-use Plan Summary in Appendix 1 of the Monitoring Framework. The plans' resource management commitments are distilled into a hierarchy of goals and objectives. Each objective is accompanied by management strategies, or indicators with targets, given in the plans that direct how the objective is to be achieved. These plan components together define the scope of the Monitoring Framework for the Babine Watershed. 3.2 Geographic Scope Where objectives, strategies or indicators apply to a specific area of the Babine Watershed, this is noted in the Land-use Plan Summary, and that information is retained throughout the Knowledge Base and displayed in the Monitoring Priority Tables. Geographic limitations arise when management direction is unique to an individual plan that only covers a specific administrative unit, such as a landscape unit or the provincial park, within the Watershed. Some strategies and indicators also have their geographic scope explicitly limited within a plan. 3.3 Goals and Objectives The Land-use Plan Summary integrates the directions from the plans and designations into a single, clear document, that consolidates the wording from different plans, while leaving the original intent unaltered. Altogether, the Plan Summary identifies 14 broad goals presented in the land-use plans. Each goal concerns maintaining or conserving a resource value, such as biodiversity, or a resource-use such as forestry, as follows: User Manual Babine Watershed Monitoring Framework 7 biodiversity wildlife grizzly bears mountain goats fish habitat and populations water quality cultural heritage opportunities for forestry soil opportunities for tourism opportunities for recreation visual quality access to mineral and energy resources habitats for botanical forest products Every goal is associated with up to eight more specific objectives that describe an intended accomplishment of resource management. Where comparable objectives exist in different Babine plans, the Plan Summary groups these under one Objective Class 1 . For example, "Maintain wilderness values of Babine River Corridor" is an Objective Class encompassing similar objectives from various plans, including: Maintain a wilderness experience in Babine River Corridor (MDS), Provide a wilderness experience by maintaining a single access point to Babine River Corridor Park (SRMP), Manage Babine River SM2 to protect wilderness setting for river-based opportunities in the Babine River Corridor (Babine LUP). The Land-use Plan Summary's Objective Classes are often referred to as 'objectives' throughout the Knowledge Base and other Framework components. 3.4 Strategies and Indicators In the plans, objectives are accompanied by statements directing how an objective can be achieved. This direction on operational implementation of objectives is expressed, depending upon the plan, as strategies or as indicators with targets. Strategies typically describe management methods, and often incorporate indicators and targets. An indicator is a specific measure, such as percentage of mature forest. This is usually accompanied by a measurable target that the land-use plan has deemed as achieving the objective, for instance retain 70% of mature forest structure within the corridor. Indicators are what monitoring focuses on to assess resource management activity in the Babine Watershed and to evaluate the likelihood that land-use goals and objectives are achieved. By measuring the status of an indicator it can be determined whether an objective 1 Words in bold are terms used by the Monitoring Framework. Key terms are also defined in this manual's Glossary. User Manual Babine Watershed Monitoring Framework 8 is in jeopardy. In some cases the plans provide measurable indicators and targets that are well-suited for monitoring. Occasionally the plans contain explicit strategies that are readily converted into indicators and targets. Sometimes however, objectives are supported by management strategies expressed in general, imprecise terms. For each Objective Class, the Plan Summary consolidates the applicable strategies, indicators and targets from the land-use plans and land-use designations. Each objective pairs with one or more strategies or indicators that direct resource management activities. Table 3-1 – Land-use Plan Components Plan Item Scope Example Goal Broadly defined aspiration Conserve grizzly bears Objective What resource management must accomplish to support the goal Reduce human–bear interactions Strategy Management method for meeting the objective Minimise open, active road networks Indicator Unit of measure used to assess the status of a strategy Km of road per km2 of land area Target Indicator value that land-use plans specify achieves the objective < 0.6 km/km2 in 80% of Shedin and Hanawald watersheds 3.5 Reconciling Inconsistencies A major function of the Plan Summary is to ensure that Babine land-use objectives correspond with strategies and indicators. Since the various land-use plans were developed with different purposes and scope, they vary in detail, clarity and approach. In some instances, objectives and strategies are not clearly linked in a plan, or a single strategy was designed to achieve several objectives. At times, inconsistencies exist among plans, arising from vague or incompatible objectives. Consequently, compiling the Plan Summary necessitated some interpretation, and so the document was reviewed and agreed upon by Babine Watershed stakeholders. The Land-use Plan Summary needs to accurately reflect the current status of plans governing resource management in the Babine Watershed. Whenever any of the six plans are revised or new land-use plans are developed for the Watershed, the Monitoring Framework ought to be updated to incorporate the changes. User Manual Babine Watershed Monitoring Framework 9 4 Knowledge Base The Knowledge Base stores the information about resource values, land-use objectives, management strategies and indicators required to drive the assessment and ranking of monitoring options. The Knowledge Base, comprising Appendix 2 of the Monitoring Framework, is designed as a transparent synthesis of current scientific knowledge that can be readily updated. It was compiled from information in the scientific literature that experts with local knowledge adapted to the Babine Watershed's situation. This information was then validated through peer review. The initial version of the Knowledge Base, completed in 2005, provided a starting point to which new knowledge, gained from further research and monitoring, can be added as it becomes available. Updating of the Knowledge Base in 2009 incorporated new land-use planning objectives, results of BWMT monitoring projects, and new information on landslides and timber salvage. This user manual explains the Knowledge Base's role in producing monitoring priorities. The theoretical background behind the Knowledge Base is described more thoroughly in the Babine Watershed Monitoring Framework document. That document also contains step-bystep procedures for constructing the Knowledge Base. 4.1 Structure and Content Contents of the Knowledge Base are organized according to the goals and objectives described in the Land-use Plan Summary. Every objective is provided with the structured set of information — to the extent that information is available — required for assessing and ranking monitoring priorities. To feed consistently into the ranking process, much of the Knowledge Base content is distilled into a rating, on a simple 3-point scale, that is accompanied by information and reasoning to support the rating. Material in the Knowledge Base for each objective is divided into three general categories that address the objective's importance, risk and uncertainty, and monitoring difficulty. Specific items of information within each category in the Knowledge Base are identified as a numbered Question and correspond to a question posed in the Procedures section of the Monitoring Framework. Table 4-1 lists the functional contents of the Knowledge Base, along with their role in determining monitoring priorities. Subsequent sections in this manual then describe how each item contributes to the priority-setting process. User Manual Babine Watershed Monitoring Framework 10 Table 4-1 – Functional Contents of the Knowledge Base Knowledge Base Content Addresses Use in Monitoring Priority Tables Influence of goal on other goals (Q 2) Objective's Importance Secondary Score Relative influence of objective on goal (Q 3) Objective's Importance Secondary Score Recovery period for objective (Q 4) Objective's Importance Secondary Score Available data (Q 6) Information Requirements Collect Data Estimated current risk and uncertainty (Q 7) Risk and Uncertainty Current Priority Estimated future risk and uncertainty (Q 8) Risk and Uncertainty Future Priority Ease of collecting indicator data (Q 15) Monitoring Difficulty Ease of Monitoring Ease of improving the risk curve (Q 16) Monitoring Difficulty Ease of Monitoring Ease of detecting negative consequences (Q 17) Monitoring Difficulty Ease of Monitoring Uncertainty about achieving goal if objectives achieved (Q 1) Achieving Goal Not Applicable 4.2 Objective's Importance The degree to which an objective warrants monitoring depends upon how much that objective influences the achievement of land-use goals. The Knowledge Base provides three individual ratings, described below, to assess the relative importance of an objective. Sometimes termed Secondary Features, these are later combined to form each objective's Secondary Score that contributes to ranking monitoring priorities. Influence of Goal on Other Goals (Question 2) Description: The extent that the objective's goal affects accomplishing any other Babine Watershed goals. The highest priority goals to monitor are those that influence numerous goals. Example: Maintaining water quality influences goals to maintain fish, biodiversity, recreation and tourism, whereas conserving mountain goats does not substantially affect any other land-use goals. Ratings: High = over 3 dependent goals Medium = 2 or 3 dependent goals Low = 0 or 1 dependent goal Relative Influence of Objective on Goal (Question 3) Description: The extent that the objective affects whether its goal is achieved, as User Manual Babine Watershed Monitoring Framework 11 compared to other objectives associated with the goal. Example: Achievement of the goal to 'maintain biodiversity' is influenced considerably more by the objective to 'maintain a natural seral stage distribution' than the objective to 'attain a natural landscape pattern'. Ratings: High = highest influence Medium = average influence Low = lowest influence Recovery Period for Objective (Question 4) Description: The approximate period of time it takes for an objective to recover from negative impacts. Objectives that recover very slowly, or not at all, are considered more important to monitor because failing to achieve them has lasting consequences. Example: The visual quality of a harvested landscape recovers more quickly than does old forest structure. Ratings: Long = over 100 years Medium = 10 to 100 years Short = less than 10 years In summary, those objectives that warrant the highest priority for monitoring are characterized by contributing to a goal that influences many other goals, exerting the greatest influence on its own goal, and requiring a long time to recover. 4.3 Risk and Uncertainty Monitoring aims at catching weak points in the connections between implementing resource management strategies and achieving land-use goals and objectives. To do so efficiently, monitoring focuses on those strategies for which there is the least amount of confidence about their success. The Monitoring Framework identifies these low-confidence strategies by evaluating risk and uncertainty. Risk is the chance that a management strategy will not achieve its objective. Uncertainty is whether enough information exists to actually determine risk. Monitoring aims either to detect early on any negative consequences to the Babine's natural resources arising out of management strategies, or to reduce uncertainty about the relationship between an indicator's values and the risks to achieving its objective. In other words, each strategy is assessed for 1) how likely it is to succeed (risk), and 2) how sure we are of this likelihood (uncertainty). Information on risk and uncertainty is contained in the Knowledge Base under the title Information to Determine Monitoring Priority for Objective Based on Risk and Uncertainty and comprises answers to questions 6 to 14, as described in the Procedures section of the Monitoring Framework. It forms a substantial part of the Knowledge Base, and includes detailed explanations and supporting analysis. User Manual Babine Watershed Monitoring Framework 12 4.3.1 Information Requirements To monitor management strategies, they must be measureable. Where possible, the Framework uses indicators as a measurable representation of each strategy. As explained in 3.4 Strategies and Indicators, some Babine Watershed land-use plans explicitly contain measureable indicators with target values that serve as strategies in support of objectives. When management strategies lack measureable indicators, the Knowledge Base derives, if reasonable, an indicator based on the strategy stated in the land-use plan. Otherwise, a strategy has no relevant indicator and cannot be monitored. To answer questions about risk and uncertainty, indicators require values for both the current and future condition of the indicator. For the Babine Watershed's current situation, an indicator value might be determined from resource inventories. The future condition of an indicator is its target value given in a land-use plan. In some cases, an unmeasured indicator value can be estimated based upon existing knowledge. When an indicator value is missing and cannot be estimated for either or both the current or future condition, then risk and uncertainty cannot be assessed. The Knowledge Base begins the evaluation of risk and uncertainty for each objective's strategies with Available Data (Question 6) that assesses whether enough indicator information exists, and if not, whether indicator values can be estimated. Whether these data exist is pivotal to determining what type of monitoring applies to the indicator and objective, as described in this manual's section 5 on Monitoring Priority Tables. Wherever current or future indicator values are unavailable and cannot be estimated, these indicators receive a high priority for acquiring the missing data. For objectives whose current and future indicator values are known or can be estimated, monitoring priorities are based foremost on the analysis of risk and uncertainty. 4.3.2 Risk Risk is defined by the Monitoring Framework as the likelihood that a management strategy may not achieve its land-use objective. High-risk strategies have the greatest probability of not accomplishing their objective, thereby placing them high in the rankings of priorities for monitoring. The Framework often refers to the result of a management strategy not achieving its objective as 'negative consequences', which might entail, for example, a precipitous decline in a fish population. The success of management strategies is monitored through their indicators. The Monitoring Framework uses line graphs, wherever possible, to display how different values of an indicator are related to the risk of not meeting the objective. The diagram represents the best guess, based on scientific understanding, of what an indicator's value reveals about the degree of risk. For instance, risk to conserving soil productivity is low when the indicator of degraded area is at 0%, but becomes high as the degraded area approaches 100%. The risk curve is essentially an hypothesis about a cause and effect relationship. Levels of risk are divided into three broad categories: low, medium and high, where high risk means that meeting an objective is least likely and negative consequences are most likely. The graphs plot the risk of not achieving an objective on the vertical Y-axis against User Manual Babine Watershed Monitoring Framework 13 indicator values on the horizontal X-axis. The example in Figure 4-1 shows the risk curve for the example of land-use plan components regarding grizzly bears listed previously in Table 3-1. Figure 4-1 – Example Risk Graph Ð future value Ð current value Risk of not reducing human-bear interactions High Ñ risk curve Med Risk that objective will not be achieved Low 0.6 Road Density km/km2 Indicator Value Risk of not reducing human–bear interactions based on road density within a watershed This consistent method of assessing risk for all the land-use objectives allows comparison of risk levels among the various values and resources in the Babine Watershed. The consistency is necessary for setting monitoring priorities among objectives that would otherwise be difficult to compare. The Monitoring Framework applies the following definitions to the three levels of risk: High risk – Most monitoring studies will detect negative consequences to the objective, showing the objective cannot be achieved. Medium risk – Some monitoring studies will detect consequences, while others will not. Low risk – Even well-designed monitoring studies are unlikely to detect any negative consequences to the objective. 4.3.3 Uncertainty Because of incomplete information about the Babine Watershed's natural resources, it is seldom known exactly what level of risk is associated with a particular indicator value. The User Manual Babine Watershed Monitoring Framework 14 Monitoring Framework not only explicitly acknowledges uncertainty, but uses it to rank the priorities for monitoring activities. Uncertain strategies may be good candidates for monitoring to improve knowledge about the accuracy of risk estimates. If uncertainty is high, an indicator value with a low estimated risk could actually pose a high risk to attaining an objective. The range of uncertainty regarding the estimated risk to meeting an objective can be envisioned as the risk curve being widened into a band. Actual risk levels associated with an indicator's values may fall anywhere within the uncertainty band, but most likely sit closer to the risk curve. As uncertainty increases, the band thickens, and other risk levels become more likely. In the Knowledge Base, bands depicting estimates of uncertainty are sometimes drawn onto risk graphs. However, uncertainty is seldom well-enough defined for graphical display, so uncertainty levels and their causes are more often discussed in the text. As with risk, uncertainty is measured by three general classes of low, medium and high, based on the following definitions: High uncertainty – Has a wide band, meaning that the actual risk level could fall into any risk category, from low to high, regardless of the estimated risk level, although the most likely level is that shown by the curve. Medium uncertainty – Actual risk could end up at a level adjacent to the estimated risk, for instance, estimated low risk might actually be medium risk. Low uncertainty – Has the narrowest band, showing that actual risk is likely no different from the estimated risk class; the risk estimate is relatively reliable. 4.3.4 Current and Future Estimates The actual value of an indicator typically changes over time as planned management strategies get implemented. When the indicator value changes, so can the level of risk to meeting objectives, as shown by the graphed risk curve. To capture these changes, the Monitoring Framework estimates risk and uncertainty for both current and future conditions. The Knowledge Base includes information on the current and future indicator values and their associated levels of risk and uncertainty. The current indicator value is based on present inventory data, while the future indicator value is determined by the targets given in the Babine Watershed's land-use plans. Both current and future levels for risk and uncertainty are instrumental in setting monitoring priorities, as explained later under 5.4 Ranking Indicators That Have Data. 4.4 Monitoring Difficulty As indicators and objectives vary, so do the costs and difficulties of monitoring them. Some monitoring projects can be relatively quick and simple to complete, while others could User Manual Babine Watershed Monitoring Framework 15 involve experimental designs and field work that are prohibitively expensive and timeconsuming. To help trustees screen project choices based on the costs and practicalities of monitoring, the Knowledge Base provides Ease of Monitoring assessments. Information on monitoring ease for the higher-priority indicators is contained in the Knowledge Base under the title Information to Assess Costs and Benefits of Monitoring Projects and involves questions 15 to 17. The monitoring ease ratings reflect a rough estimate of monitoring complexity and costs, supported by a rationale. The ratings are derived from a subjective analysis which considers new data requirements, study size and duration for obtaining meaningful results, and any specialized skills and equipment needed. These factors are evaluated and tallied according to a straightforward formula to arrive at a score, as shown in Table 4-2 below. That score is then converted to a rating of easy, moderate, difficult or very difficult according to Table 43. While this cursory assessment is sufficient to aid in selecting what to monitor, the analysis should, of course, be reconsidered more thoroughly prior to implementing a monitoring project. Table 4-2 – 'Ease of Monitoring' Step 1 – Estimating Score Factor Estimate – Score Equivalents Score Range 0 1 2 3 Obtaining new data: remote sensing None Easy Difficult – 0-2 Obtaining new data: field study None Easy Medium Difficult 0-3 Obtaining new data: study design None Retrospective Experimental – 0-2 Appropriate scale: time – < 2 years 2 – 10 years > 10 years 1-3 Appropriate scale: space – < 1 watershed > 1 watershed Outside Babine 1-3 Special skills or equipment None Some Much – 0-2 Data analysis – Simple Medium Complex 1-3 Total Ease of Monitoring Score 3 - 18 Table 4-3 – 'Ease of Monitoring' Step 2 – Converting Score to Rating Score Rating 3–6 Easy 7 – 11 Moderate 12 – 16 Difficult 17 – 18 Very Difficult The two tables are used to generate for the Knowledge Base individual ease ratings for up to three types of monitoring activities: collecting indicator data, improving the risk curve, User Manual Babine Watershed Monitoring Framework 16 and detecting negative consequences. These ratings also appear in the Monitoring Priority Tables under Ease of Monitoring or Ease of Collecting Data columns. Although not used directly to rank monitoring priorities, the ease ratings aid trustees in making decisions about which projects to fund. 4.5 Uncertainty About Achieving a Goal One additional piece of information that the Knowledge Base provides for each goal, located under Information to Assess Goal, concerns the Uncertainty About Achieving Goal if Objectives are Achieved (Question 1), rated as low, medium or high. A high rating here usually indicates that external factors, beyond those affected by the land-use plan objectives, heavily influence the goal. For instance, the Babine's grizzly bears also range outside the Watershed, where factors affecting mortality fall beyond the scope of any objectives in the Babine's land-use plans. The Knowledge Base's assessment of the likelihood of achieving a goal is not used for ranking or evaluating monitoring priorities. Instead, the information assists in determining whether the scope of monitoring studies needs expanding to include factors not covered by the goal's objectives. 4.6 Updating the Knowledge Base The Knowledge Base is intended to be a living document that is improved upon as better information emerges. It needs periodic updates to incorporate new information that comes from local research and monitoring, and to include relevant results published in the scientific literature. Instructions for updating the Knowledge Base are provided in the Monitoring Framework. User Manual Babine Watershed Monitoring Framework 17 5 Monitoring Priority Tables By compiling and scoring content from the Knowledge Base, indicators can be logically ranked according to the benefits and costs of monitoring them. The Monitoring Priority Tables in Appendix 3 of the Monitoring Framework contain the final results of the Framework's information compilations, assessments and ratings for indicators and objectives. To rank monitoring priorities, information in the Knowledge Base is scored and sorted by following set procedures to identify which pairs of indicators and objectives most need attention. The prioritization process treats all goals as equal, since they reflect planning decisions reached by consensus of government and stakeholders. Additionally, all objectives are considered necessary to achieve their goal, although the objectives' importance ratings, as Secondary Scores, reflect the different extents to which objectives influence the attainment of goals. Monitoring Priority Tables rank the need to collect different kinds of information for each indicator and associated objective. Indicators which are so deficient in data that the level of risk or uncertainty cannot be assigned end up as top monitoring priorities. An objective attains a high priority for monitoring if there is a high level of risk about its achievement. Relationships between indicators and objectives rank as top monitoring priorities when uncertainty is high. The different information needs require four different types of activities, which the Monitoring Framework separates into these four priority lists: Setting indicator targets – (Planning) Priorities for refining land-use plans to designate a target value for an indicator. [eg: Specify the target road length per km2 of land area that applies to the indicator of road density in high-value grizzly bear habitat.] Collecting indicator data – (Implementation Monitoring) Priorities for measuring an indicator's current state. [eg: Determine the actual length of road already built in high-value bear habitat.] Detecting negative consequences – (Effectiveness Monitoring) Priorities for examining whether land-use objectives are being met. [eg: Measure the trend in number of humanbear interactions.] Improving the risk curve – (Validation Monitoring) Priorities for reducing uncertainty about the relationship between an indicator's values and the associated levels of risk to achieving its objective. [eg: Assess how the frequency of human-bear interactions changes as road density increases or decreases.] As a default, these four categories of activities are assumed to be equally important. One activity, setting indicator targets, is addressed by the land-use planning process rather than BWMT monitoring. Selecting from among the other three lists which monitoring projects to undertake is left to the trustees' discretion. User Manual Babine Watershed Monitoring Framework 18 5.1 Overview of Prioritization Process The priority-setting process, shown in Figure 5-1, begins by filtering indicators based upon the availability of data for their current and future values. This step identifies candidates for each type of monitoring. Once all indicators are assigned to the relevant Monitoring Priority Tables, the indicators are sorted and ranked at two levels. Each of the four Monitoring Priority Tables uses unique criteria for ranking priorities at the first level. To accomplish this, selected information from the Knowledge Base is converted into numerical scores by using simple formulas. The indicators receive scores calculated for table columns grouped under Collect Data, Detect Consequences, and Reduce Uncertainty. Throughout, lower scores rank as higher priority. The second level of ranking, which is the same for all tables, is determined by the objective's importance. Each indicator receives a Secondary Score that aggregates ratings about the objective's importance, based upon information in the Knowledge Base. The Monitoring Priority Tables also have columns summarizing additional information from the Knowledge Base, such as Ease of Monitoring, that can be useful for making decisions about which monitoring projects to initiate. The steps and scoring protocols for identifying priorities are explained more fully in the following sections. User Manual Babine Watershed Monitoring Framework 19 Figure 5-1 – Process For Developing Monitoring Priority Tables User Manual Babine Watershed Monitoring Framework 20 5.2 Determining Monitoring Candidates Each indicator needs two values for monitoring how well it is performing: 1) the current condition, often an inventory, and 2) the future condition, specified as a target in a land-use plan. Whether either of these two measures is available determines what kind of information gathering, and therefore which Monitoring Priority Tables, apply to the indicator. When the Knowledge Base was constructed in 2005, over half of the indicators lacked one or both values. If an indicator is missing one or both values, then the indicator becomes a candidate for collecting indicator data, or setting targets, or both. Only if current and future indicator values both exist, do indicators become candidates for monitoring to detect negative consequences and to reduce uncertainty. Determining priorities for these latter two types of monitoring requires that indicators have actual or estimated values. The information for determining the availability of indicator values is found in the Knowledge Base under Available Data (Question 6), which answers "Are there sufficient data about current and future indicator levels to estimate risk?" The question receives separate responses for each time period: current state and future target. For each there are three possible answers: data are available, the value can be estimated, or no data exist and a value cannot be estimated. 5.3 Ranking Indicators That Lack Data The responses to Available Data (Question 6) are translated into ratings in the Knowledge Base, and then scored in the Priority Tables under the Collect Data section, in columns Current Priority and Future Priority. The ratings and scorings are related as follows: Table 5-1 – Converting the Availability of an Indicator Value to a 'Collect Data' Score Indicator Data Availability Priority Rating Collect Data Score (Knowledge Base) (Monitoring Priority Table) No data High 1 Value estimated Medium 2 Data available Not applicable 9 Whenever an indicator is missing either or both its current or future values, or a value was estimated rather than based on solid information, then the indicator has acquired a 1 or 2 for a Collect Data score and becomes a candidate for filling in the missing data. There is one Monitoring Priority Table for each indicator value required. Indicators with a missing value for current condition are candidates for collecting indicator data, while a missing future target places an indicator in the ranking of priorities for setting targets. 5.3.1 Priority for Setting Indicator Targets Only the indicators lacking a target identified in the land-use plans fit into the table of priorities for setting indicator targets. Since their future value is unavailable, these User Manual Babine Watershed Monitoring Framework 21 indicators all have a Future Priority score of 1 or 2 for Collect Data. Missing a measureable target means that the risk and uncertainty regarding the indicator's impact on achieving an objective cannot be determined. For instance, there is no target in the land-use plans for the amount of bull trout habitat to be protected, in support of the objective to maintain bull trout. The priorities for setting indicator targets are not about monitoring. Instead, developing targets for indicators involves planning and so falls outside the mandate of the Babine Watershed Monitoring Trust. The Trust forwards these information gaps along to those concerned with the Watershed's planning needs. Indicators in the table are divided into two lists, according to Future Priority scores for Collect Data. Of highest priority for acquiring target values are indicators with no available value for a target, scored 1. Indicators whose target was estimated in the Knowledge Base, rather than made explicit in the land-use plan, are of medium priority, scoring 2. Within these two lists, priorities are ranked by the Secondary Score that gauges the objective's importance. 5.3.2 Priority for Collecting Indicator Data This table functions similarly to the one for setting indicator targets, but instead addresses the current indicator value. Only indicators deficient in data on their current state, as identified by a Current Priority score for Collect Data of 1 or 2, fit here. This is another situation where risk and uncertainty cannot be estimated since an indicator value is not known. In this case, indicators require implementation monitoring to measure their present situation. Indicators in the table are divided into two lists, according to Current Priority scores for Collect Data. Of highest priority for acquiring current values are indicators with no data available on their present condition, scored 1. Indicators whose current value was estimated in the Knowledge Base, rather than provided by actual measurements, are of medium priority, scoring 2. Within these two lists, priorities are ranked by the Secondary Score that rates the objective's importance. 5.4 Ranking Indicators That Have Data When the Monitoring Framework was first developed, 50 of the 106 indicators had sufficient information to be included in two sets of monitoring priorities, detecting negative consequences and reducing uncertainty. These indicators have known or estimated values for their current state and future target. Only indicators that do not have a Collect Data score of 1, a high-priority rating, for collecting missing current or future data qualify for these two tables. For both tables, monitoring priorities are first ranked using the same basic two-step process: evaluate priority based on current and future probabilities of achieving an objective and then combine the current and future priorities to produce an Overall Priority rating. The difference between the two tables of priorities lies in the emphasis being placed on risk for User Manual Babine Watershed Monitoring Framework 22 monitoring to detect negative consequences versus emphasis placed on uncertainty for monitoring to reduce uncertainty. Thus each table uses a different scoring system, obtained from interpretive tables, to arrive at Overall Priority, as described next. 5.4.1 Priority for Detecting Negative Consequences The table of Priorities For Detecting Negative Consequences ranks highly those objectives at highest risk of not being achieved, coupled with low or medium uncertainty. Otherwise known as effectiveness monitoring, these projects are aimed at catching when things are beginning to go wrong for a resource value. Overall Priority for detecting negative consequences is also weighted towards current rather than future priority because imminent undesirable impacts are considered more urgent for monitoring. In the Monitoring Framework's procedures, Questions 12 to 14 produce scores for the Detect Consequences columns of the Monitoring Priority Table. To begin, ratings of high, medium or low for each indicator's current risk and uncertainty and future risk and uncertainty are taken from the Knowledge Base. Then, by combining risk and uncertainty ratings according to Table 5-2, the current ratings are converted to a Current Priority score and future ratings are converted to a Future Priority score. Table 5-2 – Priority for Detecting Negative Consequences – Step 1 Current and Future Priority Scores Uncertainty Risk High Medium Low High 2 2 2 Medium 1 2 3 Low 1 2 3 Next, the future and current priority scores obtained above are combined, using the matrix in Table 5-3, to arrive at an Overall Priority score that is used to rank monitoring priorities for detecting negative consequences. Within each level of ranking under Overall Priority, the indicators are then ranked by the Secondary Score that gauges the objective's importance. Table 5-3 – Priority for Detecting Negative Consequences – Step 2 Overall Priority Score Future Priority Current Priority 1 2 3 1 1 2 3 2 1 2 3 3 2 3 4 5.4.2 Priority for Reducing Uncertainty The Reducing Uncertainty table ranks priorities for monitoring to improve confidence in the risk curve by better defining the relationship between an indicator and its objective. This User Manual Babine Watershed Monitoring Framework 23 type of monitoring is termed validation monitoring, and can be addressed through scientific research. Indicators with the highest uncertainty receive high priority, with weighting more on future than current conditions, because refining a future target could potentially improve a management strategy to avert negative impacts. The procedure for producing this table follows the same general scoring approach as the previous table, Detecting Negative Consequences, to set priorities, although different criteria are used for converting ratings to numerical scores. In the Monitoring Framework's procedures, Questions 9 to 11 produce scores for the Reduce Uncertainty columns of this table. To begin, ratings of high, medium or low for each indicator's current risk and uncertainty and future risk and uncertainty are taken from the Knowledge Base. Then, by combining risk and uncertainty ratings according to Table 5-4, the current ratings are converted to a Current Priority score and future ratings are converted to a Future Priority score. Table 5-4 – Priority for Reducing Uncertainty – Step 1 Current and Future Priority Scores Uncertainty Risk High Medium Low High 1 1 1 Medium 2 1 2 Low 3 3 3 Next, the future and current priority scores obtained above are combined, using the matrix in Table 5-5, to arrive at an Overall Priority score that is used to rank monitoring priorities for reducing uncertainty. Within each level of ranking under Overall Priority, the indicators are then ranked by the Secondary Score that rates the objective's importance. Table 5-5 – Priority for Reducing Uncertainty – Step 2 Overall Priority Score Future Priority Current Priority 1 2 3 1 1 1 2 2 2 2 3 3 3 3 4 5.5 Calculating 'Secondary Score' The second level of sorting in all the Priority Tables uses Secondary Score, a rating of an objective's importance based upon three criteria: the goal's influence on other goals, the objective's influence on its goal, and the objective's recovery period. Ratings for these criteria are given in the Knowledge Base under questions 2, 3 and 4, as described earlier under 4.2 Objective's Importance. The 3-level ratings, such as high, medium and low, are User Manual Babine Watershed Monitoring Framework 24 converted into a Secondary Score, ranging from 3 to 9, according to Table 5-6. As with all scores in the Monitoring Priority Tables, a lower Secondary Score has higher priority for monitoring. Table 5-6 – Calculating 'Secondary Score' From Ratings in Knowledge Base Question Feature Score Rating – Score Equivalents Range 1 2 3 1-3 2 Influence of goal on other goals High Medium Low 3 Influence of objective on goal High Medium Low 4 Recovery period for objective Long Medium Short Total Secondary Score 3-9 5.6 Information Columns Additional columns in the Monitoring Priority Tables provide information that is not used directly in the rankings, but is still helpful for evaluating monitoring options. Scope identifies the geographic area within the Babine Watershed that applies to an indicator. The area is determined either by the jurisdiction of the land-use plan in which the indicator originated, or is specified within a land-use plan. Ease of Monitoring assessments, rated as easy, moderate or difficult, help trustees screen land-use objectives based on the costs and practicalities of monitoring. The ratings come directly from the Knowledge Base, as explained earlier under 4.4 Monitoring Difficulty. Other informational columns, such as those for Risk ± Uncertainty, contain information from the Knowledge Base that supports the priority rankings. Definitions of the table columns are found in the Monitoring Framework and in the Key to Table Headings located at the beginning of Appendix 3. 5.7 Additional Results The risk and uncertainty analysis presented in the Monitoring Framework can provide useful insights, even without monitoring, about whether management strategies will achieve plan objectives. This arises particularly where there is considerable confidence in how indicator values relate to the risks of achieving an objective; where uncertainty is low. Notably, when low uncertainty exists, it may already be evident whether a management strategy can attain its objective. For example, if an indicator and target poses high risk with low uncertainty, then meeting a land-use plan's target is unlikely to successfully achieve its objective, and amending the objective or target in the plan should be considered. Conversely, if risk to achieving an objective is low, with low uncertainty, then the plan's direction is confirmed and implementation monitoring is sufficient to ensure that the strategy or target is being followed. User Manual Babine Watershed Monitoring Framework 25 Another situation to watch for is when an indicator's risk curve consists of a straight, horizontal line. That means the risk level does not change, regardless of the indicator's value. This shows that the indicator has no bearing on the likelihood of achieving the objective, and is therefore not a useful indicator. User Manual Babine Watershed Monitoring Framework 26 6 Glossary of Monitoring Framework Terms Collect Data Score indicating whether information is available for a current or future indicator value. Current Priority Score for Collect Data, based on availability of current indicator value. Also a score derived from risk and uncertainty ratings for the current value of an indicator, used to determine the Overall Priority. Current Value Present condition measured or estimated for an indicator. Ease of Monitoring Rating summarizing the general costs and difficulties of monitoring an indicator. Future Priority Score for Collect Data, based on availability of future indicator value. Also a score derived from risk and uncertainty ratings for the future value of an indicator, used to determine the Overall Priority. Future Value Target measurement for an indicator, as specified in a land-use plan. Indicator Unit of measure that represents a strategy. Goal Broad, socially defined aspiration for a resource value or opportunity, contained in a land-use plan. Objective What resource management must accomplish to support a goal, as prescribed in a land-use plan. Objective Class Group of similar objectives from land-use plans. Overall Priority Score derived from Current Priority and Future Priority scores for risk and uncertainty, used to rank indicators for monitoring to Detect Consequences and Reduce Uncertainty. Risk The chance that a management strategy, as represented by an indicator value, will not achieve its objective. Risk Curve Graph showing the relationship between an indicator's values and the risk of not achieving an objective. Secondary Features Characteristics that make up an objective's importance and used to calculate Secondary Score. Secondary Score Numerical rating of an objective's relative importance derived from ratings of three Secondary Features. Strategy Management method specified in a land-use plan for meeting an objective. Target Indicator value representing a land-use plan strategy and used as the future value for an indicator. Uncertainty Degree of confidence in the level of risk for an objective that is assigned to an indicator value. User Manual Babine Watershed Monitoring Framework 27 Acknowledgements In addition to the Babine Watershed Monitoring Framework itself, information for this user manual was gleaned from the following sources, with permission of the authors: Dave Daust, Karen Price and Stephen Tyler. 2009. Adaptive Management Framework for the Central and North Coast of British Columbia. Guide to the Knowledge Summary and Prioritization Procedure. Final report. Jan 29, 2009. Prepared for the Ecosystem Based Management Working Group. Karen Price and Dave Daust. [2009]. Making Monitoring Manageable: A Framework to Guide Learning. Submitted. Karen Price, Dave Daust and Liz Osborn. 2005. Babine Watershed Monitoring Framework – Overview. Babine Watershed Monitoring Trust. Thanks also goes to Karen Price, Dave Daust, Richard Overstall and Rosemary Fox for reviewing a draft version of the user manual. User Manual Babine Watershed Monitoring Framework 28