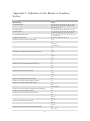
1
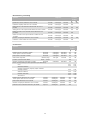
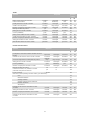
User guide to the Economic Tendency Survey Foreword This manual presents the background to the NIER’s monthly Economic Tendency Survey of Swedish consumers and firms and how it is conducted. It explains the process from sampling and data collection to calculation methods and the end results. There are also tips on what should be borne in mind when interpreting the results of the survey. Section 1 presents the background, purpose and administrative information such as reference periods and frequencies. Sections 2-4 then look in greater depth at how the samples are chosen and how data are collected and processed. Finally, Sections 5-8 run through how the results are presented and interpreted. 2 Contents Foreword............................................................................................................................................................. 2 1 Administrative information .......................................................................................................................... 4 1.1 Background and purpose ...................................................................................................................... 4 1.2 Frequency ................................................................................................................................................ 4 1.3 Reference periods ................................................................................................................................... 4 1.4 Confidentiality and duty of disclosure ................................................................................................ 4 1.5 Official statistics ..................................................................................................................................... 5 1.6 EU harmonisation .................................................................................................................................. 5 1.7 Comparison with quantitative statistics .............................................................................................. 5 2 The Business Tendency Survey’s sample ................................................................................................... 5 2.1 Population................................................................................................................................................ 6 2.2 Sampling frame ....................................................................................................................................... 6 2.3 Sample units ............................................................................................................................................ 6 2.4 Industry classification according to SNI 2007................................................................................... 6 2.5 Other composites ................................................................................................................................... 6 2.6 Size categories ......................................................................................................................................... 7 2.7 Number of firms and cut-offs ............................................................................................................. 7 2.8 Coverage .................................................................................................................................................. 8 3 The Business Tendency Survey’s implementation .................................................................................... 8 3.1 Data collection ........................................................................................................................................ 8 3.2 Calculation ............................................................................................................................................. 10 3.3 Weights ................................................................................................................................................... 12 3.4 Response frequency ............................................................................................................................. 12 4 The Consumer Tendency Survey’s sample and implementation..........................................................13 5 Concepts and definitions ............................................................................................................................13 5.1 Net balances .......................................................................................................................................... 13 5.2 Gross values .......................................................................................................................................... 14 5.3 Confidence indicators .......................................................................................................................... 14 5.4 Micro Index and Macro Index ........................................................................................................... 15 5.5 Situation ................................................................................................................................................. 15 5.6 Seasonally-adjusted time series ........................................................................................................... 16 5.7 Trended time series .............................................................................................................................. 16 5.8 Normalised time series ........................................................................................................................ 16 6 Points to note when interpreting the results............................................................................................17 6.1 Industry structure ................................................................................................................................. 17 6.2 Zero line................................................................................................................................................. 17 6.3 Comparability over time ...................................................................................................................... 17 7 Economic Tendency Indicator ..................................................................................................................18 7.1 Purpose and history ............................................................................................................................. 18 7.2 Calculation ............................................................................................................................................. 19 7.3 Interpretation ........................................................................................................................................ 19 8 Availability .....................................................................................................................................................20 Appendix 1. Industries in the Business Tendency Survey ........................................................................21 Appendix 2. Coverage in the Business Tendency Survey .........................................................................24 Appendix 3. Questions in the Business Tendency Survey........................................................................25 Appendix 4. Questions in the Consumer Tendency Survey.....................................................................28 3 1 Administrative information 1.1 Background and purpose The Economic Tendency Survey is a survey of Swedish firms and consumers conducted by the National Institute of Economic Research (NIER) to capture trends in various economic variables. The questions look partly at recent trends and the present situation and partly at expectations of the future. The survey is qualitative, which means that it does not ask for absolute numbers (such as amounts of money or numbers of units). Respondents reply solely using qualitative response options, such as increased/unchanged/decreased. The questionnaires do not include detailed definitions. The questions contain well-known concepts such as “number of employees” without defining what exactly is meant by employees – for example, whether this includes full-time and part-time positions, temporary staff, etc. The idea is that the questions can be answered without a great deal of research. The need for a rapid response is reflected throughout the survey. Speed is important so that the results are as close as possible to the current situation. This enables the results to be published before the corresponding traditional statistics in order to provide an early indication of the possible outcome. The NIER began conducting quarterly business surveys on a limited scale (the textile industry) back in the 1950s. The entire manufacturing industry has been covered since 1964, and these days almost all sectors of industry are included. The main exceptions are agriculture & forestry and mining & quarrying. Since 1996 there have also been monthly surveys, which were introduced when Sweden joined the EU and are a requirement of the European Commission’s Directorate-General for Economic and Financial Affairs (DG ECFIN). The Consumer Tendency Survey began in 1973 on a quarterly basis and has been performed monthly since 1993. 1.2 Frequency The Economic Tendency Survey is conducted monthly. Every third month, the business surveys contain additional questions. To distinguish between the different surveys, they are referred to as the quarterly and monthly tendency surveys. The results of the quarterly surveys are published in April (first quarter), July (second quarter), October (third quarter) and January (fourth quarter). 1.3 Reference periods The questions in the Business Tendency Survey relate to the past three months and the next three months (apart from a few questions concerning expectations for the next six months). In the consumer survey, the reference periods are the past 12 months and the next 12 months. 1.4 Confidentiality and duty of disclosure The disclosure of information for the Economic Tendency Survey is voluntary, and the information is privileged under chapter 24, section 8 of the Public Access to Information and Secrecy Act (2009:400). The automated processing of personal data is covered by the rules of the Personal Data 4 Act (1998:204), and there are also special rules on the processing of personal data for statistical purposes in the Official Statistics Act (2001:99) and Official Statistics Ordinance (2001:100). 1.5 Official statistics The government has made the NIER responsible for the statistics in the Consumer Tendency Survey. Official statistics must always be available in electronic form. This responsibility for official statistics includes ensuring that the statistics are objective, documented and quality-assured. Statistics Sweden’s website (www.scb.se) contains more information on the country’s official statistics. 1.6 EU harmonisation The Economic Tendency Survey forms part of DG ECFIN’s Joint Harmonised EU Programme of Business and Consumer Surveys. This entails a common framework across the EU for conducting these surveys in terms of the timing of data collection, the industries covered, and the formulation of questions. All EU member states conduct monthly tendency surveys. A complete list of all questions and industries presented by DG ECFIN can be found in the Joint Harmonised EU Programme of Business and Consumer Surveys User Guide (DG ECFIN, 2007). Each month the NIER submits the results of its monthly survey to DG ECFIN in accordance with the latter’s guidelines for questions and industry classification. The results for the EU as a whole are published monthly on DG ECFIN’s website. DG ECFIN co-finances the member states’ tendency surveys. The time series published by the NIER may differ from the corresponding series from DG ECFIN, because the two use different methods to seasonally adjust the time series. The NIER uses X-12-ARIMA, while the EU uses Dainties. 1.7 Comparison with quantitative statistics While quantitative statistics show changes in objective measures and levels, the results of the Economic Tendency Survey show how different economic actors interpret and assess these changes. Quantitative statistics are often published with a significant time lag, whereas outcome data from the tendency survey for recent developments are available much more quickly. Compared with quantitative statistics, which usually cover variables reflecting just one aspect of a firm’s activity, the tendency surveys gather information on multiple variables to obtain a more complete picture of a sector of the economy. The Economic Tendency Survey measures nonquantifiable variables, such as assessments of current order book and stocks, as well as variables that illustrate departures from the desired level, such as various limiting factors for supply or demand. This type of survey is also unique because it includes questions on plans and expectations. 2 The Business Tendency Survey’s sample The Economic Tendency Survey is a panel survey for which a random sample of around 6,500 firms is selected each year. However, all firms with more than 100 employees are automatically 5 selected, which means that these firms are included in every sample. Only firms that come below this threshold for automatic inclusion, in other words small businesses, are replaced when the sample is updated, but all firms are then assigned new weights (read more about weights in Section 3.3 below). The sample is stratified by size and industry. 2.1 Population The population that the Business Tendency Survey aims to cover is firms with activities in Sweden in the relevant industries (see Appendix 1) with a certain number of employees (see Table 2.7.1). 2.2 Sampling frame The sampling frame (the source from which the sample is drawn) is Statistics Sweden’s Business Register (FDB), a comprehensive database of all firms in the country. 2.3 Sample units Kind-of-activity unit (KAU) is the sample unit in all industries, with the exception of “Operating of own real estate” (SNI 68.2) where the sample unit is the enterprise. In most cases, the KAU is the same as the enterprise, except for the largest conglomerates where a KAU may be just part of the enterprise. Reporting at kind-of-activity level ensures a more industry-specific picture. 2.4 Industry classification according to SNI 2007 The industries in the Economic Tendency Survey are defined on the basis of the Swedish Standard Industrial Classification (SNI). SNI 2007 is the standard used by Statistics Sweden since January 2008 to assign a firm’s activities to one or more industries. SNI 2007 corresponds to the international classification NACE Rev. 2. The Business Tendency Survey switched from SNI 2002 to SNI 2007 in May 2010. The industry classification is based on four main sectors: • • • • Manufacturing industry (SNI 10-33) Construction industry (SNI 41-43) Retail trade (SNI 45-47) Private service sector (SNI 49-96) A list of all industries and their SNI codes can be found in Appendix 1. 2.5 Other composites 2.5.1 TOTAL TRADE/PRIVATE SERVICE SECTOR To calculate the results for the entire trade and the entire service sector, the results for the constituent sub-sectors are weighted together on the basis of the number of employees in the population in 6 each sub-sector. These population weights are obtained from Statistics Sweden’s Business Register. In this way, the results for the sub-sectors are weighted according to each sub-sector’s relative size in the overall population. 2.5.2 TOTAL BUSINESS SECTOR Some questions are the same for all four main sectors: manufacturing, construction, trade and private service sector. These questions are used to produce a weighted result for the total business sector. The weighting is based on the number of employees in the population in each sector. The questions that are calculated for the total business sector are: Confidence indicator Number of employees, outcome and expectations Demand, assessment of present situation1 Labour shortages (quarterly questions) Prices, outcome and expectations (quarterly questions) 2.6 Size categories Firms are assigned to size categories based on the number of employees. Table 2.6.1 Size categories Size category Number of employees 3 5–9 4 10–19 5 20–49 6 50–99 7 100–199 8 >200 2.7 Number of firms and cut-offs Certain limits are set for how many employees a firm in a particular industry must have for it to be included in the population and so eligible for inclusion in the sample. These cut-offs depend on the structure of the industry. The number of firms in the sample varies somewhat from year to year. 1 Consists of the net balances for total order book in the manufacturing industry, order book in the construction industry, sales situation in the retail trade, and volume of assignments on hand in the private service sector. 7 Table2.7.1 Cut-offs and number of firms 2013 NACE REV. 2 Number of employees Manufacturing 10–33 ≥20 Construction 41–43 ≥201 Trade 45-47 Trade and repair of motor vehicles and motorcycles Wholesale trade Retail trade , except of motor vehicles and motorcykles Retail sale of food, beverages and tobacco Private service sector Number of firms 1594 486 1 592 45 ≥20 199 46 ≥10 319 47.3–9, 47.19 ≥5 600 47.2, 47.11 ≥50 474 49–96 ≥ 202 Total business sector 2 799 6 471 1 Public works (civil engineering), Nace 43, has a cut off of 10 employyes. 2 Restaurants, architects and letting of own property have different cut-offs. 2.8 Coverage In the manufacturing industry, around 43 per cent of firms in Statistics Sweden’s Business Register are included in the survey sample.2 The corresponding figures for the construction industry, retail trade and private service sector are 11, 12 and 38 per cent. If we also take account of firms’ size in terms of number of employees, coverage rises to 82 per cent for the manufacturing industry, 52 per cent for the construction industry, 59 per cent for the retail trade and 81 per cent for the private service sector. The size categories covered vary somewhat from sector to sector. A table showing coverage by sector and size category can be found in Appendix 2. It is possible that there is a risk of a degree of under-coverage, in other words that the survey misses firms that are not included in the sampling framework due to them being misclassified or not being registered. There is also a risk of over-coverage due the inclusion of misclassified firms or “dead” firms that have not yet been removed. These firms do not receive the questionnaire but remain part of the sample and are treated as non-responders. 3 The Business Tendency Survey’s implementation 3.1 Data collection 3.1.1 QUESTIONNAIRE The questionnaire is addressed to the firm’s management and designed in such a way that it can be answered quickly and easily. The covering letter sent out together with the questionnaire contains a brief description of the purpose of the survey, an instruction to ignore seasonal variations, and an assurance that the answers will be kept anonymous. The questionnaire also specifies the response deadline and states that participation is voluntary. 2 Percentage calculated on the basis of the firms included in the survey’s population (see table showing cut-offs in Section 2.7). 8 The survey uses different questionnaires for each main sector. Every third month, the questionnaires contain additional questions. 3.1.2 QUESTIONS The questions asked are of three types: Outcomes and expectations The first type of question concerns outcomes and expectations. One example of such a question is whether the firm’s output volume has increased, been unchanged or decreased over the past three months. These questions contain well-known concepts and do not ask for quantities; respondents are instead allowed to make their own interpretations. Assessments The second type of question concerns assessments, where the answers will normally be the respondent’s own subjective assessment of a particular economic variable. One example of such a question is whether the firm’s order book is relatively large, sufficient or too small. Quantitative questions The last type of question is quantitative questions. One example is the question on capacity utilisation, as it needs to be answered with a percentage. Again respondents are allowed to make their own interpretations. Appendix 3 contains a full list of the questions in the Business Tendency Survey. 3.1.3 COMPOSITE QUESTIONS The questions on selling prices and new orders in the manufacturing survey are divided into the domestic market and the export market. The results for these questions are then weighted together to obtain total selling prices and total new orders. The weights used are the percentages of the firm’s sales at home and abroad. 3.1.4 INFLATION EXPECTATIONS The quarterly survey also includes a question on firms’ expectations for prices in general. The question is forward-looking and formulated in the same way as the equivalent question in the Consumer Tendency Survey. It has two parts and is worded as follows: 1. How do you expect prices in general (i.e. Swedish consumer prices) to develop in the next 12 months? - increase - unchanged - decrease 2. By what percentage do you expect them to increase/decrease? (An interval may be stated) .....% 9 The values reported are calculated as unweighted means of firms’ responses. Where an interval is given, the average of the upper and lower values is used. If a firm replies “decrease” to the first question and gives a positive percentage in the second question, the percentage is interpreted as negative. If a firm replies “unchanged” to the first question and does not answer the second, this is interpreted as a response of 0 per cent. If a firm answers the second question with a percentage below -5 or above 15, the response is treated as extreme and filtered out when calculating the mean. 3.1.5 COLLECTION METHOD Responses to the surveys are collected both by post and by e-mail (electronically). Electronic questionnaires were introduced in the year 2000, and around 50 per cent of the questionnaires are now completed electronically. From the time the questionnaires are sent out, respondents normally have just over a week to reply before a reminder is sent. After a further week, the largest firms are given a telephone reminder. All in all, the responses are collected over a period of almost three weeks. 3.1.6 CHECKS AND VERIFICATION Questionnaires are checked during registration/scanning to ensure that the respondent has not selected more than one answer to a particular question. If so, an assessment is made of which answer is most likely. Various logical checks are also performed. When responding electronically, it is not possible to select more than one answer to a particular question. Answers are not systematically verified or inspected for consistency, except for the question on firms’ inflation expectations (see Section 3.1.4 above). However, uncertainties and major deviations in the processed results are always investigated. 3.2 Calculation 3.2.1 WEIGHTED RESPONSES Firm size The significance of a firm’s responses is assumed to be related to the firm’s size. Responses from a large firm are given more weight than those from a small firm. Once a firm’s responses have been received, they are therefore weighted according to the firm’s size. Imagine that the distribution of responses to a question is as follows: Response Number of firms Relative response frequency (%) Increase 108 27 Unchanged 216 54 Decrease Sum 76 19 400 100 If we assume that the question concerns the change in output volume, and that the firms answering “decreased” are, on average, three times the size of those replying “increased”, and that those responding “unchanged” are twice the size of those replying “increased”, it is reasonable to conclude that the average decrease in output for those answering “decreased” is larger than the average in10 crease in output for those replying “increased”. The relative response frequencies above do not, therefore, give an accurate picture of the change in output volume. If, however, we assume that, on average, the changes are proportional to firms’ size, and weight the responses received according to firms’ size, the unweighted response frequency above is transformed as follows: Response Weight of firm Weighted relative response frequency (%) Increase 1 27 * 1/(27*1+54*2+19*3) = 14 Unchanged 2 54 * 2/(27*1+54*2+19*3) = 56 Decrease 3 19 * 3/(27*1+54*2+19*3) = 30 Sum 100 The weighted responses thus give a slightly different picture to the unweighted responses. Non-responders The weighted responses for each size category and industry are added together and then extrapolated to the level they would have been if all firms in the sample had responded to the question. If, for example, the question is answered by firms with a combined weight of 90 per cent (90/100) of the weight of the entire sample (for a particular size category in a particular industry), the firms’ weighted responses will be multiplied by a factor of 100/90. Extrapolation As firms in different strata are selected with different probabilities, responses need to be extrapolated to the level they would have been if all firms in the population in a particular stratum had been surveyed. A larger weight is given to small sample units, as they represent other small units that were not included in the sample. The inverted value of the respective stratum’s sampling fraction is used here, in other words the inverted probability of each sample element being selected (N/n, where N is the number of firms in the population and n is the number of firms in the sample). The results for all industries are calculated in the same way before being added together. 3.2.2 FORMULA The formula used for the sub-sectors is: nj Nj n W * nj W j i 1 nj W i 1 ij i 1 ij ,, nj * Wij i 1 ij = Total weight for stratum j for response + nj W i 1 nj W i 1 = Total weight for all firms in the sample for stratum j ij ij ,, = Total weight for all firms in stratum j answering the question 11 Nj = Number of firms in the population for stratum j, nj = Number of firms in the sample for stratum j 3.3 Weights The weights used to weight answers according to firms’ size vary between industries and questions. In the manufacturing industry, the main weight used is value added, but number of employees is used to weight questions on employment. In the other sectors, number of employees is used, with the exception of “Operating of own real estate” (SNI 68.2) where the taxable value of the properties is used. The weights are updated annually when the sample is updated. It might seem most natural to use different weights for different questions, in other words for questions on output to be weighted according to firms’ share of output in their industry, and questions on employment to be weighted by number of employees, and so on. This procedure is used by tradition in the manufacturing industry, but not in the other sectors. However, it has turned out that the net balances are not especially sensitive to the choice of weighting variable, and in practice it is sufficient to use a single variable that reflects the general economic significance of a firm when weighting all questions. 3.4 Response frequency A weighted response frequency is calculated for all sectors. The sum of the responding firms’ weights is divided by the sum of the weights for all firms in the sample. n" Response frequency = Wi i 1 n 100 Wi i 1 where n″= number of firms responding n = number of firms in the sample Wi = weight for firm i The weighted response frequency is normally around 70 per cent for the manufacturing industry and the construction industry, and around 50-60 per cent for the retail trade and the private service sector. For each survey, a check is made that the very largest firms have responded. In industries dominated by one particular firm or a small number of firms, a check is made that these firms have responded. All units that do not respond are treated as a non-responders – even units that no longer have any activities or have left the sampling frame for another reason. 12 4 The Consumer Tendency Survey’s sample and implementation The Consumer Tendency Survey interviews 1,500 Swedish households each month. The questions cover consumers’ assessment of their personal finances and the Swedish economy, expectations for interest rates and inflation, and plans for major purchases and savings. The target population is the Swedish general public aged 16-84. Interviews are conducted in the first 15 days of each month and are evenly distributed over this period. The sample of households is selected randomly each month from the PAR Konsument consumer database, which covers around 4.5 million individuals divided into around 3.6 million households. The records are based on information from the country’s telecommunications operators and include both landline and mobile telephone numbers. The records are updated daily. Telephone interviews are conducted using computer-assisted telephone interviewing (CATI) software, which permits logic checks on responses and manages all call-backs. With each monthly sample, a comparison is made with the population statistics in the PAR Spar database, which contains information on all individuals registered in Sweden. Any differences between the samples are corrected by creating a matrix based on the gender, age and regional distribution in PAR Spar. This matrix is then used during data collection to ensure that age, gender and region are correctly represented. Once a quota is filled, data collection in that group is discontinued. The survey continues until 1,500 responses have been received. It is not therefore possible to perform any analysis of non-response. When the selected individuals are contacted, the database records are checked. With landline calls, the next-birthday method is then used to decide who will represent the household. Where the selected individual is part of a multi-person household, the person interviewed is the next person in the household aged 16-84 to have a birthday. This is done to avoid bias due to who is responsible for the telephone account, tendency to answer the phone, etc. The results of the Consumer Tendency Survey are reported both as an aggregate for all consumers and broken down by gender, age and region. 5 Concepts and definitions 5.1 Net balances Net balances are used to make it easier to present and analyse the results of the tendency survey. The net balance is the difference between the percentages of respondents responding positively and negatively to a question. 13 For example, if 40 per cent of firms reply that output volume has increased, 10 per cent that it has decreased and 50 per cent that it has been unchanged, the net balance will be 40-10 = 30. The net balance is therefore always between -100 (all respondents responding negatively) and +100 (all respondents responding positively). Where the only possible answers to a question are yes and no, the net balance is the percentage of firms answering yes. In this case, the net balance will be a value between 0 (all respondents answering no) and 100 (all respondents answering yes). In the consumer survey, where the questions generally contain more than three possible answers, the net balances are calculated on the basis of the following response options: Table 5.1.1 Calculation of balances in the Consumer Tendency Survey Question Balance 1–4 a lot better + a little better – a little worse – a lot worse 5 very much higher + quite a bit higher + a little higher – lower 6 increase faster – increase at a slower rate – stay about the same – fall slightly 7 increase sharply + increase slightly – fall slightly – fall sharply 8 yes, now is the right time – no, it is the wrong time, purchase should be postponed 9 much more + a little more – a little less – much less 10 a very good time to save + quite a good time to save – rather an unfavourable time to save – a very unfavourable time to save 11 very likely + fairly likely – fairly unlikely – very unlikely 12 we are saving a lot + we are saving a little –wWe have to draw on our savings – we are running into debt 13, 15 very likely + fairly likely – fairly unlikely – very unlikely 14 yes, definitely + possibly – probably not – definitely not 16 a lot greater + a little greater – a little less – a lot less The results of the consumer survey’s questions on perceived and expected inflation/deflation as a percentage rate and on expected wage increases and mortgage rates are reported as means, including and excluding extreme values. 5.2 Gross values The gross value is the percentage of respondents giving a particular answer. For example, if 40 per cent of firms reply that output volume has increased, 10 per cent that it has decreased and 50 per cent that it has been unchanged, the gross values will be 40, 10 and 50. 5.3 Confidence indicators Confidence indicators are used as an aggregate measure of the situation in each industrial sector and the household sector. The confidence indicator is a mean of the net balances (seasonally adjusted and standardised) for selected questions. Finally, this time series is standardised into a new series with a mean of 100 and a standard deviation of 10 for the period since 1996. The choice of questions included in each confidence indicator has been harmonised with EU guidelines and is designed to obtain the greatest possible correlation with a particular reference series. This does not apply to the Consumer Confidence Indicator, however, which is defined slightly differently to EU guidelines. 14 Table 5.3.1 Questions included in the confidence indicators Sector Questions Manufacturing Order books (present situation assessment) – stock of finished goods (present situation assessment) + production volume (expectations) Construction Order books (present situation assessment) + number of employed (expectations) Trade Selling volume (outcome) – stock of goods (present situation assessment) + selling volume (expectations) Private service sector The firm’s business situation (outcome) + Demand for the firm’s services (outcome) + Demand for the firm’s services (expectations) Consumers Financial situtation of the household now + Financial situtation of the household within 12 months + Swedish economy now + Swedish economy within 12 months + good time to buy consumer durables now 5.4 Micro Index and Macro Index The Micro Index summarises consumers’ view of their personal finances and is calculated as the mean of the net balances (seasonally adjusted and standardised) for the following questions: financial position of household (assessment of present situation) + financial position of household (expectations) + right time to make major purchases (assessment of present situation) + major purchases by household (expectations). The Macro Index summarises consumers’ view of the Swedish economy and is calculated as the mean of the net balances (seasonally adjusted and standardised) for the following questions: Swedish economy (assessment of present situation) + Swedish economy (expectations) – unemployment (expectations). Finally, these time series are standardised into new series with a mean of 100 and a standard deviation of 10 for the period since 1996. 5.5 Situation The term “situation” is used as a simple way of showing an upturn or downturn in an industry. Assuming a normal distribution, around 68 per cent of observations will be within one standard deviation of the mean, and around 95 per cent within two standard deviations of the mean. Against this background, the indicator for the month in question is assigned a sign of ++, +, =, or --. Table 5.5.1 The situation Sign ++ + Explenation The situation is very strong, the confidence indicator is above 110 The situation is strong, the confidence indicator is between 101.1 and 110 = The situation is normal, the confidence indicator is between 99 and 101 - The situation is weak, the confidence indicator is between 90 and 98.9 -- The situation is very weak, the confidence indicator is below 90 The probability of + and - is then 30 per cent each, and the probability of ++ and -- is 16 percent each. The probability of = is 8 percent. Note that the validity of the assumption that the time series are normally distributed has not been subjected to detailed analysis. The “situation” in the private service sector should be interpreted with particular caution, as the time series here are significantly shorter than in the other sectors, and “situation” may take on a different meaning to the other sectors. 15 Many of the questions included in the confidence indicators concern changes, such as the expected change in output. As a result, the “situation” will to a great extent describe the size of a change (growth) relative to the average. In other words, the “situation” does not describe the level of output relative to normal output so much as the level of growth relative to normal growth. The “situation” does not, therefore, describe the economic situation as defined by the NIER in other contexts. The economic situation reflects the level of output relative to normal output. 5.6 Seasonally-adjusted time series Respondents to the business survey are asked to ignore seasonal variations. With some industries and some questions, however, respondents find it difficult to distinguish between seasonal and cyclical patterns. This means that respondents’ own allowance for seasonal variations is not always adequate, and so the data may contain seasonal variations. All time series in the Business Tendency Survey other than the price questions are therefore seasonally adjusted. The seasonal adjustment of time series involves eliminating variations and effects in the time series that are due to seasonal factors. All results of the Business Tendency Survey presented in charts are seasonally adjusted (except for the price questions). The Business Tendency Survey is seasonally adjusted using X-12-Arima. When seasonally adjusting questions with two possible answers (yes/no) where a negative value is not reasonable, a method is used whereby the time series is transformed prior to seasonal adjustment and the seasonally adjusted series is then transformed back. This process avoids negative seasonally adjusted values. Net balances running from -100 to +100 are similarly transformed so that the seasonally adjusted values do not fall outside this interval. Non-seasonally-adjusted time series are submitted to the EU, which uses a different software package, Dainties, for seasonal adjustment. One of the big differences when using Dainties is that the time series are not revised retrospectively as new observations are added. The argument in favour of this is that the answer reflects the respondent’s view at a certain point in time and cannot be corrected in hindsight. The advantage of X-12-Arima is that the estimation of seasonal factors can be performed using more information and so attain greater precision. These differing seasonal adjustment methods mean that the seasonally-adjusted time series published by the NIER may differ from the equivalent series from the EU. 5.7 Trended time series A trended time series shows the long-term trend in a series, removing more “noise” than the seasonally-adjusted series. The trended series are relatively smooth, and the reduction in noise makes it easier to identify turning points in the business cycle, for example. The trended series in the Business Tendency Survey are calculated at the same time as the seasonally-adjusted series using X-12Arima. 5.8 Normalised time series A normalised time series is a time series that has been transformed in such a way that it has a mean of 0 and a standard deviation of 1. 16 6 Points to note when interpreting the results 6.1 Industry structure When interpreting the results for an industry, it is important to take account of the industry’s structure. An ideal sample would consist of large numbers of equal-sized firms, but most industries do not look like this. Some consist of a small number of large firms, while others feature a relatively large number of small firms but are dominated by a small number of larger ones. In the ideal sample, there is a clear connection between the size of a net balance and the size of the quantitative increase in a variable. In industries with a small number of large firms, this relationship is less certain. In the pulp industry or the supermarket trade, for example, which meet these criteria and also have a relatively uniform product range, large net balances do not necessarily mean large changes in volumes or prices. 6.2 Zero line Another factor to be borne in mind when interpreting the results is the zero line in the charts. If the curve for a flow variable (such as new orders) is rising and above the zero line, this means that new orders are increasing and are increasing more quickly than before. If, however, the curve is rising but below the zero line, this means that new orders are decreasing, only not as quickly as before. With some variables, the zero line should not be assigned its absolute value. This applies particularly to the questions where firms are asked to assess their own order book and stocks. Here, their assessment should be compared with a historic average rather than the zero line. 6.3 Comparability over time 6.3.1 BUSINESS TENDENCY SURVEY Past changes that may affect the time series include: • SNI updates: Most SNI updates have brought only minor changes and had little impact on the industry classification in the tendency survey. However, the latest update, from SNI 2002 to SNI 2007 in May 2010, entailed more extensive changes. • The change of sample unit from enterprise (business registration number) to kind-of-activity unit from the year 2000 sample update. • Minor changes to the questions in the business survey: In this type of survey, which is intended to show developments in economic variables over time, changes to the questions need to be limited. Sometimes, however, it is necessary to make changes. Only minor alterations were made from the 1960s to the 1990s: the questions about shortages of other professional staff and other technical salaried staff were merged into a single question about shortages of other 17 staff, a sixth answer was added to the question about the main obstacles to increased production in the manufacturing industry and the construction industry, and the question about the number of employees in the construction industry and the manufacturing industry was altered (previously it was divided into number of workers and number of salaried staff). • Major changes to the questionnaires and merging of time series: In 2002-2005, there was a major review of the survey, and the questionnaires for all of the sectors were revised. There was also a separate questionnaire for the wholesale trade (SNI 46) up until the third quarter of 2005, which was then integrated with the questionnaire for the retail trade as part of the overhaul. This overhaul of the questionnaires was performed partly to increase harmonisation within the EU and partly to simplify the questions and make it easier to complete the questionnaires. • Enlarged monthly sample: In May 2010, the monthly sample was enlarged by just over 50 per cent from around 4,000 firms to just over 6,000. The change was made to obtain better coverage at industry level and have the same sample size for the monthly and quarterly surveys. Before May 2010, the sample for the quarterly surveys was substantially larger than that for the monthly surveys. 6.3.2 CONSUMER TENDENCY SURVEY This survey was originally conducted by Statistics Sweden but was taken over by GfK Sverige AB in 2002. The results for 1993-2001 have been adjusted by the NIER to increase comparability with the results for 2002 onwards. Since October 2009, the survey has been conducted by CMA Research AB. From October to December 2009, CMA and GfK carried out parallel surveys. The time series reported from October 2009 onwards are CMA’s figures, while the net balances for December 2001 to September 2009 are the result of GfK’s surveys. Results for the questions on the Swedish economy, personal finances and unemployment in the next year are available only a quarterly basis from 1973 to 1976. 7 Economic Tendency Indicator 7.1 Purpose and history The Economic Tendency Indicator aims to measure current sentiment in the Swedish economy using information from the NIER’s various tendency surveys and presenting it in a transparent manner. The questions included and the weights used have been chosen to ensure a high degree of correlation with GDP growth. The Economic Tendency Indicator was first published in February 2007. The model is the European Commission’s Economic Sentiment Indicator (ESI). The EU also publishes an ESI for Sweden, but the Economic Tendency Indicator is not based on exactly the same values as the ESI, mainly for technical reasons. Not only is the Consumer Confidence Indicator defined differently, but the seasonal adjustment method also differs. 18 7.2 Calculation 7.2.1 SEASONAL ADJUSTMENT AND STANDARDISATION OF NET BALANCES The starting point for the Economic Tendency Indicator is the questions in the monthly Business Tendency Survey and the Consumer Tendency Survey. These questions are also included in the individual confidence indicators in the tendency surveys. The Economic Tendency Indicator is based on the questions’ net balances. All net balances are seasonally adjusted using X-12-Arima and then transformed (standardised) to a mean of zero and a standard deviation of 1. 7.2.2 AGGREGATION OF SECTOR NET BALANCES In the next step, the standardised series are aggregated using a weighting system where the net balances for the manufacturing industry are weighted at 40 per cent, the private service sector at 30 per cent, the retail trade and the construction industry at 5 per cent each, and consumers at 20 per cent. Note that the weights for each question depend on how many questions are included in each sector. For example, there are five questions from the consumer survey, which are each assigned a weight of (20/100)/5 = 0.04. Three questions are used for the manufacturing industry, which means that each question is given a weight of (40/100)/3 = 0.13. Note that some net balances are included in the aggregation with reversed signs. 7.2.3 FURTHER STANDARDISATION Finally, this time series is standardised into a new series with a mean of 100 and a standard deviation of 10.3 7.3 Interpretation 7.3.1 ECONOMIC GROWTH The Economic Tendency Indicator is constructed in such a way that it has a mean of 100 and a standard deviation of 10. Assuming a normal distribution, values between 90 and 110 will be seen in 68 per cent of cases, while values above 110 and below 90 will each occur in 16 per cent of cases. The interpretation of the results of the Economic Tendency Indicator is then that values over 100 correspond to stronger economic growth than normal, and values over 110 to much stronger growth than normal. Similarly, values below 100 and 90 will be interpreted, respectively, as weaker and much weaker growth than normal. This is also illustrated by the plus and minus signs shown under “situation” (read more about this concept in Section 5.5 above). 7.3.2 HIGH LEVEL OF TRANSPARENCY One important role of the Economic Tendency Indicator is to summarise the underlying business and consumer surveys in a way that is as easy as possible to interpret. The net balances underlying the Economic Tendency Indicator are therefore the same as those underlying the individual confidence indicators in the different surveys. After processing, the net balances are aggregated using the weighting system described above, which means a high level of transparency. 3 The mean is already 100, but the standard deviation may differ from 10. A linear combination of variables with a mean of 100 will also have a mean of 100, but the standard deviation will differ because it is based on a non-linear (quadratic) calculation. 19 7.3.3 COVARIANCE WITH GDP The Economic Tendency Indicator is intended to provide an overall measure of current sentiment in the Swedish economy. The starting point for the indicator – the questionnaire surveys of firms and consumers – provides a broad base of information, but not sufficiently broad to cover the entire economy. For example, there is no information on the public sector. The NIER has analysed how the Economic Tendency Indicator can be used to assess GDP growth. The change in GDP has been chosen as the yardstick because the Economic Tendency Indicator provides information on a calendar quarter between two and five months before GDP figures for the same quarter are published by Statistics Sweden. The quantitative relationship between the Economic Tendency Indicator and the change in GDP is interpreted such that an increase in the indicator of 10 points in a quarter corresponds to an increase in the estimated annual rate of GDP growth of just over 1 percentage point. The general conclusion is that the Economic Tendency Indicator exhibits relatively strong covariance with the change in GDP. 8 Availability The results are published at the end of the month, roughly a week after data collection is completed. All of the tendency series are available as time series on the NIER’s website, www.konj.se. There are also various charts for each sub-sector. The entire report is available in PDF format together with an English summary, and newsletters are sent to users when new results are published. Firms responding to the Business Tendency Survey are sent results and analysis for their particular industry, and those responding by e-mail are sent an e-mail message at the time of publication with a link to the results. The results of the Consumer Tendency Survey are also available through Statistics Sweden, www.scb.se. 20 Appendix 1. Industries in the Business Tendency Survey Industry SNI 2007 Manufacturing 10–33 Intermediate goods 10.6, 10.9, 13.1-3, 16.1-2, 17.11-12, 17.2, 20.1-3, 20.5-6, 22-23, 24.1-5, 25.5-9, 26.1, 26.8, 27.1-4, 27.9 Investment goods 25.1-4, 26.2-3, 26.5-6, 28-29, 30.1-4, 32.5 Consumer goods 10.1-5, 10.7-8, 11-12, 13.9, 14-15, 18, 20.4, 21, 26.4-7, 27.5, 30.9, 31, 32.1-4, 32.9 Non-durable consumer goods 10.1-5, 10.7-8, 11-12, 13.9, 14-15, 18, 20.4, 21, 32.3-4, 32.9 Durable consumer goods 26.4-7, 27.5, 30.9, 31, 32.1-2 Manufacture of food, beverages and tobacco 10-12 10 10.6+10.9 10.1-5+10.7-8 11 12 Manufacture of textiles, clothing and leather products 13-15 13 13.1-3 13.9 14 15 Industry for wood and products of wood and cork 16 16.1 16.2 Industry for paper and paper products 17 17.11 17.12 17.2 Printers; other industry for recorded media 18 Industry for coke and refined petroleum products 19 Industry for chemicals and chemical products 20 20.4 20.1-3+20.5-6 Industry for basic pharmaceutical products and preparations 21 Industry for rubber and plastic products 22 Industry forother non-metallic mineral products 23 24 24.1-3 24.4-5 Industry for fabricated metal products 25 25.1-4 25.5–9 Industry for computer, electronic and optical products 26 26.4 + 26.7 21 26.1 + 26.8 26.2–3 + 26.5–6 Industry for electrical equipment 27 27.5 27.1–4 + 27.9 Industry for machinery and equipment n.e.c. 28 Industry for motor vehicles, trailers and semi-trailers 29 Industry for other transport equipment 30 30.9 30.1–4 Furniture industry 31 Other manufacturing industry 32 32.5 32.1–2 32.3–4 + 32.9 Repair shops and installation companiesfor machinery and equipment 33 Construction 41-43 Building and civil engineering 41-42 Construction of buildnings 41 Civil engineering 42 Specialised construction activities 43 Trade 45-47 Retail trade (incl. wholesale and retail trade and repair of motor vehicles) 45+47 Wholesale and retail trade and repair of motor vehicles 45 45.1 45.2-4 Wholesale trade (except of motor vehicles and motorcykles) 46 Wholesale of agricultural raw materials and live animals 46.2 Wholesale of food, beverages and tobacco 46.3 Wholesale of household goods 46.4 Wholesale of information and communication equipment 46.5 Wholesale of other machinery, equipment and supplies 46.6 Other specialised wholesale 46.7 Retail sale of non-durable goods 47.11+47.2 Retail trade, except of motor vehicles and motorcykles and retail sale of non-durable goods 47.19+47.3-7 (exkl. 47.73)+47.9 Other retail sale in non-specialised stores 47.19 Retail sale of automative fuel 47.3 Specialised stores for information and communication equipment 47.4 Specialised stores for other household equipment 47.5 Specialised stores for cultural and recreation goods 47.6 Specialised stores for other goods 47.7 Retail trade not in stores, stalls or markets 47.9 Private service sectors 49–96 Lnad transport and transport via pipelines 49 exkl. 49.5 Road haulage companies and removal companies 49.4 49.1–3 Water transport 50 Air transport 51 22 Warehousing and support activities for transportation 52 Postal and courier activities 53 Hotels and restaurants 55.1 + 56 (exkl. 56.3) Hotels 55.1 Restaurants 56.1–2 Publishers 58 Motion picture, video and television programme production, sound recording and music publishing activities 59 Programming and broadcasting activities 60 Telecommunications 61 Computer programming and consultancy companies etc. 62 Information service activities 63 Financial institutions and insurancecompanies 64–66 64 65 66 Companies for renting and operating own or leased real estate 68.2 (exkl. 68.204) Real estate activities on a fee or contact basis 68.3 Legal and accounting firms 69 Management consultancy companies 70 Architectural and engineering activities; technical testing and analysis 71 Technical consultancy companies and architects’s 71.1 Architects’s 71.11 Technical consultancy companies 71.12 Technical testing and analysis 71.2 Advertising and market research companies 73 Other professional, scientific and technical activities 74 Renting companies 77 Employment placement agencies, temporary employment agencies etc. 78 Activities of employment placement agencies 78.1 Provision of personell activities 78.2–3 Travel agencies and tour operatiors 79 Security and investigation activities 80 Services to buildings and landscape activities 81 Office administrative and office support companies 82 Other service companies 95–96 Repair of computers and personal and household goods 95 Other personal activities 96 23 Appendix 2. Coverage in the Business Tendency Survey Size category (Number of employees) Number of firms in population Number of firms in sample Share in percent Number of employed in population Number of employed in sample Share in percent Construction 5-9 - - - - - - 10–191 2 387 54 2 31 936 714 2 20–49 1 581 151 10 45 998 4 546 10 50–99 294 133 45 19 469 8 976 46 89 89 100 11 673 11 673 100 100–199 >199 59 59 100 65 500 65 500 100 Total 4 410 486 11 174 576 91 409 52 5-9 - - - - - - 10-19 - - - - - - 20–49 2 112 484 23 65 088 15 221 23 50–99 770 266 35 53 309 18 192 34 100–199 429 429 100 59 462 59 462 100 Manufacturing >199 415 415 100 295 095 295 095 100 Total 3 726 1 594 43 472 954 387 970 82 Trade (Nace Rev. 45-47) exkl. retail sale in non-durable goods (Nace Rev 47.11+47.2)2 5-9 3 484 156 4 22 411 1 036 5 10-19 3 078 108 4 40 552 1 360 3 20-49 1 876 169 9 55 616 4 852 9 50-99 525 271 52 36 088 18 735 52 100-199 211 211 100 28 537 28 537 100 >199 203 203 100 133 746 133 746 100 Total 9 377 1 118 12 316 950 188 266 59 Private service sectors (Nace Rev. 49-96 exkl. Nace Rev. 55-563 and 68.24) 5-9 - - - - - - 10-19 67 67 100 897 897 100 20–49 3 379 710 21 100 697 21 186 21 50–99 1 072 372 35 73 401 25 871 35 507 507 100 70 253 70 253 100 100–199 >199 446 446 100 432 107 432 107 100 Total 5 471 2 102 38 677 355 550 314 81 1 SNI 43 2 NIER divides some larger firms in Retail Sale in non-durable goods (SNI 47.11 + 47.2) and creates a panel including both Kind-of-activity units and Local Kind-of-activity units. 3 NIER also makes a further division of the largets hotels and restaurands (SNI 55-56) on the basis of their Local Kind-of-activity units. 4 SNI 68.2 has a different sample unit, read more in chapter 2.3 24 Appendix 3. Questions in the Business Tendency Survey Manufacturing Question Responses Question number Q M increased unchanged decreased 101 101 The production capacity in the last 3 month increased unchanged decreased 102 Current production capacity more than sufficient Sufficient not sufficient 103 Current capacity utilization ca ……percent increased unchanged decreased 105 increased unchanged decreased 106 Orders received on the domestic market in the last 3 month increased unchanged decreased 107 102 Orders received on the export market in the last 3 month increased unchanged decreased 108 103 Total orderbooks at present relatively large just enough to small 109 104 Export orderbooks at present relatively large just enough to small 110 105 The production volume in the last 3 month Selling prices on the domestic market in the last 104 3 month Selling prices on the export market in the last 3 month Number of production weeks covered by current orderbooks 111 about…weeks How has the firms competitive situation changed over the last 3 months: on the domestic market improved unchanged worsened 112 on the EU-market improved unchanged worsened 113 outside the EU improved unchanged worsened 114 good satisfactory poor 115 increased unchanged decreased 116 Current profitability Number of employees in the last 3 months 107 Shortage of (at present): skilled workers yes no 117 technical employees yes no 118 other employees yes no Stocks of raw materials at present too large just enough too small 120 Stocks of finished goods in the last 3 month increased unchanged decreased 121 Stocks of finisched goods at present too large just enough too small 122 119 Factor currently limiting the firms production (one alternative): none 123 insufficient demand 124 shortage of capacity or materials 125 shortage of labour 126 financial constraints 127 other factors 128 The table continues on the next page. 25 106 Manufacturing continuing Question Response Question number Q M 201 Pproduction volume within the next 3 months increase unchanged decrease 201 Production capacity within the next 3 months increase unchanged decrease 202 Selling prices on the domestic market within the next 3 months increase unchanged decrease 203 202 Selling prices on the export market within the next 3 months increase unchanged decrease 204 203 Orders received on the domestic market within the next 3 months increase unchanged decrease 205 Orders received on the export market en within the next 3 months increase unchanged decrease 206 Number of employees within the next 3 months increase unchanged decrease 207 Production volume within the next 6 months increase unchanged decrease 208 204 Construction Question Response Question number Q M Building activity in the last 3 months increased unchanged decreased 101 101 Tender prices in the last 3 months increased unchanged decreased 102 102 Order books in the last 3 months increased unchanged decreased 103 103 Order books at present relatively large Just right too small 104 104 Duration of assured order books about ……weeks Number of employees in the last 3 months increased 105 unchanged decreased 106 106 none 1071 1071 insufficient demand 1072 1072 shortage of labour 1074 1074 weather conditions 1075 1075 financial constraints 1076 1076 Factor currently limiting the firms production (one alternative): shortage of machinery capacity and/or materials 1077 1077 Building activity within the next 3 months increase unchanged decrease 201 201 Tender prices within the next 3 months increase unchanged decrease 202 202 Order books within the next 3 months increase unchanged decrease 203 203 Number of employees within the next 3 months increase unchanged decrease 204 204 Outlook for the construction market a year ahead improve unchanged get worse 205 other factors 26 Trade Question Response Question number Q Selling volume in the last 3 months Present sales situation increased unchanged M decreased 101 101 102 good satisfactory bad 102 increased unchanged Decreased 103 Goods in stock at present too large large enough too small 104 103 Number of employees in the last 3 months increased unchanged decreased 105 104 yes no Goods purchases in the last 3 months Shortage of labour at present Selling prices in the last 3 months 106 increased unchanged decreased 107 good satisfactory poor 108 Selling volume within the next 3 months increase unchanged decrease 201 201 Goods purchases within the next 3 months increase unchanged decrease 202 203 Number of employees within the next 3 months increase unchanged decrease 203 204 Selling prices within the next 3 months increase unchanged decrease 204 202 get better unchanged get worse 205 205 Current profitability Sales situation within the next 6 months Private service sector Question Response Question number Q M Development of the firms business situation the last 3 months improved unchanged worsened 101 101 Demand for the firms services in the last 3 months increased unchanged decreased 102 102 Volume of assignments on hand\orders at present relatively large large enough too small 103 103 Selling prices in the last 3 months increased unchanged decreased 104 104 good satisfactory poor 105 decreased 106 Current profitability Number of employees in the last 3 months increased unchanged Shortage of labour at present yes no 107 If demand increases, is it possible to increase production with present resources? yes no 108 If yes, how much ……percent 105 109 Main factor currently limiting the firms activity (one alternative): none 110 insufficient demand 111 shortage of labour 112 shortage of space and/or equipment 113 financial restrictions 114 other factors 115 Demand for the firms services within the next 3 months increase unchanged decrease 201 201 Selling prices within the next 3 months increase unchanged decrease 202 202 Number of employees within the next 3 months increase unchanged decrease 203 203 Demand for the firms services within the next 6 months increase unchanged decrease 204 27 Appendix 4. Questions in the Consumer Tendency Survey 1. How does the financial situation of your household now compare with what it was 12 months ago? Has it…? Got a lot better Got a little better Stayed the same Got a little worse Got a lot worse Don’t know 2. How do you think the financial position of your household will change over the next 12 months? Will it…? Get a lot better Get a little better Stay the same Get a little worse Get a lot worse Don’t know 3. How do you think the general economic situation in this country has changed over the last 12months? Has it…? Got a lot better Got a little better Stayed the same Got a little worse Got a lot worse Don’t know 4. How do you think the general economic situation in this country will develop over the next 12 months? Will it…? Get a lot better Get a little better Stay the same Get a little worse Get a lot worse Don’t know 5. Compared with 12 months ago, do you find that prices in general are …? Very much higher Quit a bit higher A little higher About the same Lower Don’t know 5a-b. Compared with 12 months ago, how much higher in percent do you think that prices are now? (Average) Including extreme values Excluding extreme values 28 6. Compared to the situation today, do you think that at in the next 12 months prices in general will …? Increase faster Increase at the same rate Increase at a slower rate Stay about the same Fall slightly Don’t know 6a-b. Compared with today, how much in percent do you think that prices will go up (i.e. the rate of inflation 12 months from now)? Including extreme values Excluding extreme values 7. How do you think the level of unemployment in the country will change over the next 12 months? Will it…? Increase sharply Increase slightly Remain the same Fall slightly Fall sharply Don’t know 8. Do you think there is an advantage for people to make major purchases (furniture, washing machines, TV sets etc.) at the present time? Yes, now is the right time It is neither the right time or the wrong time No, it is the wrong time, purchase should be postponed Don’t know 9. Over the next 12 months, how do you think the amount of money you will spend on major purchases will compare with what you spent over the last 12 months? Will it be…? Much more A little more About the same A little less Much less Don’t know 10. In the view of the general economic situation, do you thing this is:…? A very good time to save Quite a good time to save Neither a good, nor an unfavourable time to save Rather an unfavourable time to save A very unfavourable time to save Don’t know 11. Over the next 12 months, how likely are you to be able to save any money? Very likely Fairly likely 29 Fairly unlikely Very unlikely Don’t know 12. Which of these statements best describe the present financial situation of your household? We are saving a lot We are saving a little We are just managing to make ends meet on our income We have to draw on our savings We are running into debt Don’t know 13. How likely are you to buy a car within the next 12 months? Very likely Fairly likely Fairly unlikely Very unlikely Don’t know 14. Are you planning to purchase or build a home within the next 12 months (to live in yourself, for a member of your family, as a holiday home, to let etc.)? Yes, definitely Possibly Probably not Definitely not Don’t know 15. Over the next 12 months, how likely are you to spend any large sums of money on home improvements such as central heating, sanitary ware etc.? Very likely Fairly likely Fairly unlikely Very unlikely Don’t know 16. Compared with 12 months ago, is the risk that You will become unemployed…? A lot greater A little greater About the same A little less A lot less No opinion 30 National Institute of Economic Research, Kungsgatan 12 - 14, Box 3116, SE - 103 62 Stockholm, Sweden Phone: +46 8 453 59 00, Fax: +46 8 453 59 80, E-mail: [email protected], Website: www.konj.se