1
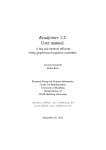
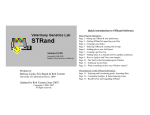
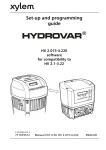
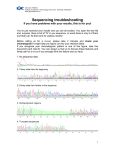
Sanger Sequencing: Troubleshooting Guide Description If you need help analysing your Sanger sequencing output, this guide can help. CONTENTS 1 Introduction ...................................................................................................... 2 2 Sequence Data Evaluation .............................................................................. 2 3 Troubleshooting .............................................................................................. 4 3.1 Reviewing the Sequence ..................................................................................... 4 3.1.1 Electropherogram ............................................................................................ 4 3.1.2 Raw Sequence ................................................................................................ 4 3.2 Result Evaluation ................................................................................................ 5 3.2.1 Failed sequence .............................................................................................. 5 3.2.2 Weak sequence ............................................................................................... 6 3.2.3 Short sequence (or shorter than expected) ...................................................... 7 3.2.4 Multiple sequences .......................................................................................... 8 3.2.5 Artifacts............................................................................................................ 9 4 Review AGRF submission ............................................................................ 10 5 Reviewing Experimental Setup of SEQ Reaction ........................................ 10 6 5.1 DNA Template Review ...................................................................................... 10 5.2 Primer Design Review ....................................................................................... 11 Contact AGRF Sequencing ........................................................................... 11 Page 1 of 11 Sanger Sequencing Troubleshooting Guide (GNGFM00346) v1.1 Approved By: Ken McGrath Release Date: 11/12/2014 Sanger Sequencing: Troubleshooting Guide Description 1 Introduction This document highlights some common problems associated with DNA sequencing as well as the possible causes and solutions for these problems. Pictures of sequence traces are provided where possible along with the information describing the problem, how to identify the problem, the cause, and the potential solution for the problem. Other problems can occur with sequence data, but the following are those seen most commonly. Use this guide as the AGRF recommended data review/troubleshooting process. 2 Sequence Data Evaluation For each sample processed, the following are provided: Filename.ab1: The raw chromatogram trace file Filename.seq: A text file of the sequence, as generated by the sequencing instruments Filename.fa: A quality trimmed FASTA formatted text file Filename.bn: A BLAST file (GenBank) of the quality trimmed FASTA file The filename .ab1 file contains annotation of the sample, the raw data trace and the analysed electropherogram. Basecalling and analysis algorithms are applied to the raw data to create the analysed data trace. When evaluating or trouble-shooting sequence data, it is important to look at the raw, and analysed data traces. The raw data trace should show an even distribution of peaks across the read and no residual dyes (Figure 1). The analysed data trace should show sharp, evenly spaced peaks across the read and a clear baseline (Figure 2). AGRF recommends the use of Applied Biosystem’s free “Sequence Scanner” software (available for download at - www.appliedbiosystems.com/sequencescanner) Figure 1: Raw Data Page 2 of 11 Sanger Sequencing Troubleshooting Guide (GNGFM00346) v1.1 Approved By: Ken McGrath Release Date: 11/12/2014 Sanger Sequencing: Troubleshooting Guide Description Figure 2: Analysed data It is equally important to look at data values displayed in the annotation file (Figure 3). It is useful to check the following: Average signal to noise ratio indicates labelling efficiency and should fall between be 100 and 750. The base call start indicates the scan point at which the read commences at and should be ~600 to 800. The end point should be ~13,000 to 14,000 or at the end of the read. The number of QV bases >=20 should be ~950 to 1000 (less for shorter PCR fragments) Figure 3: Annotation file which shows values for signal strength and start/end points Page 3 of 11 Sanger Sequencing Troubleshooting Guide (GNGFM00346) v1.1 Approved By: Ken McGrath Release Date: 11/12/2014 Sanger Sequencing: Troubleshooting Guide Description 3 Troubleshooting When troubleshooting sequencing data, follow the workflow below to try to identify the cause of your problem. The following steps in this section use Sequencing Analysis Software or Sequence Scanner Software. 3.1 Reviewing the Sequence 3.1.1 Electropherogram Select the Electropherogram tab and review the sequence for data quality. Check the following: Well-defined peak resolution – minimal fluorescence overlap from one peak to the next with a sharp peak top. Uniform peak spacing – peak spacing is consistent throughout the trace. Signal-to-noise ratios and variation in peak heights – High signal to noise ratio and even peak height characterize good quality sequence. (Please note: the analysed view is re-scaled, the peak heights are not representative of raw fluorescence detected by the AB 3730xl.) 3.1.2 Raw Sequence Select the Raw tab and review the unprocessed fluorescence data to assess the signal quality. Check the following: Artifacts – Are there any artifacts, such as four-color spikes? Peak heights – Are peaks well-resolved, with acceptable heights? Data start points – Do any data start points deviate from others in the same submission? Length of read – Was the expected length of read obtained? Does the signal stop suddenly? Baseline – Is there background noise for all the peaks? Zoom in horizontally and vertically to verify the baseline noise. Page 4 of 11 Sanger Sequencing Troubleshooting Guide (GNGFM00346) v1.1 Approved By: Ken McGrath Release Date: 11/12/2014 Sanger Sequencing: Troubleshooting Guide Description 3.2 Result Evaluation Use the following examples as a guide to try to identify an explanation of your results. Please note that this list is not exhaustive, but include the most common results seen at the AGRF. 3.2.1 Failed sequence No noticeable fluorescence peaks in raw data Only background noise seen in electropherogram Problem Probable Cause Solution No sequence detected No priming site present Confirm the primer site is present in the template. Redesign or use a different primer Primers have degraded through freeze-thaw cycles Make up new primer stocks Inefficient primer binding Redesign primer Insufficient amount of DNA template Re-quantify DNA and increase the amount of DNA if required DNA template has degraded or Inhibitory contaminant in your samples e.g. salts, phenol, EDTA, ethanol Re-extract DNA template or clean-up template. Page 5 of 11 Sanger Sequencing Troubleshooting Guide (GNGFM00346) v1.1 Approved By: Ken McGrath Release Date: 11/12/2014 Sanger Sequencing: Troubleshooting Guide Description 3.2.2 Weak sequence Very low peak height in the raw data trace Base calls fade before the end of the read and the signal-to-noise ratios are very low Problem Probable Cause Solution Low peaks throughout trace Insufficient amount of DNA template Quantitate the DNA Inhibitory contaminant in your samples (e.g. salts, phenol, EDTA, ethanol) Increase the amount of DNA template, clean-up DNA template Insufficient amount of primer or inefficient primer binding Check primer dilution and/or redesign primer Page 6 of 11 Sanger Sequencing Troubleshooting Guide (GNGFM00346) v1.1 Approved By: Ken McGrath Release Date: 11/12/2014 Sanger Sequencing: Troubleshooting Guide Description 3.2.3 Short sequence (or shorter than expected) Very high peaks in the raw data trace that fade off abruptly Poor quality sequence at start leading to shorter than expected sequence length Problem Probable Cause Sequence starts well but signal drops gradually (Ski-sloping) Primer or Template ratio is contaminant is present in template Sequence starts well but signal stops abruptly Solution incorrect or Re-examine template and primer concentration Re-extract template or clean-up Repetitive region - Repeat regions, especially GC and GT repeats, can cause the signal to fade either due to depletion or slippage or secondary structure Add (1ul) DMSO to the sequencing reaction Secondary structure - GC and AT rich templates can cause the DNA to loop and form hairpins Add (1ul) DMSO to the sequencing reaction to help relax the structure Linearized DNA - restriction enzymes may have cut the template Design primers close to the hairpin Sequence complementary strand the Run product out on an agarose gel to check Page 7 of 11 Sanger Sequencing Troubleshooting Guide (GNGFM00346) v1.1 Approved By: Ken McGrath Release Date: 11/12/2014 Sanger Sequencing: Troubleshooting Guide Description 3.2.4 Multiple sequences Overlapping peaks in all or part of the electropherogram that maintain correct base-spacing Overlapping peaks after a homopolymer region Problem Probable Cause Solution Overlapping peaks in all or part of the sequence Mixed plasmid preparation Re-isolate the the DNA from a pure colony and re-sequence Multiple PCR products Check PCR template on gel for single band Frame shift mutation Use a different primer after the mutation or sequence the complementary strand Primer-dimer contamination Optimise PCR amplification or redesign primer Multiple priming sites Make sure primer only has one priming site Multiple primers in reaction Ensure only one primer has been used Primer with N-1 contamination Re-synthesize primer PAGE purification Enzyme slippage occurs giving varying lengths of the same sequence after this region (n-1, n-2 and n-3 populations) Sequence the complementary strand Overlapping peaks following stretch of mononucleotide sequence with Page 8 of 11 Sanger Sequencing Troubleshooting Guide (GNGFM00346) v1.1 Approved By: Ken McGrath Release Date: 11/12/2014 Sanger Sequencing: Troubleshooting Guide Description 3.2.5 Artifacts Peaks of excess dye present in the raw data trace Large broadened peaks that obscure the sequence Problem Probable Cause Solution Large peaks obscuring the real sequence Dye blobs caused by unincorporated BigDye Terminator (BDT) and are typically seen at 70bp and 120bp. For CS submissions, review cleanup method used and/or add more DNA template and less BDT. Usually seen in failed or weak sequences. For PD submissions, please notify AGRF staff and a free re-run will be provided. Real sequence can still be read underneath these blobs Sample peaks become lumpy and increasingly unreadable early in the sequence (before 500bp) If related to individual samples this is due to a contaminant in the sample Clean up template DNA Page 9 of 11 Sanger Sequencing Troubleshooting Guide (GNGFM00346) v1.1 Approved By: Ken McGrath Release Date: 11/12/2014 Sanger Sequencing: Troubleshooting Guide Description 4 Review AGRF submission Take some time to review the samples in each submission batch. 5 For example, does the problem occur in: o Specific samples o Specific submissions o Samples extracted during the same process, or different processes o Samples stored under similar conditions or under different conditions etc. Is the symptom present in other samples of the same submission? Are there any differences in how the templates of other samples in the same submission were prepared? Was the same primer used in all samples of the submission? How was the template stored after preparation for this submission? Reviewing Experimental Setup of SEQ Reaction Based on the results from Sequence Data Evaluation, use the tables below to review your experimental setup. 5.1 DNA Template Review Recommendation Comment Run an agarose gel to detect any contaminating DNA or RNA. Purified DNA should run as a single band on an agarose gel. Note: Uncut plasmid DNA can run as three bands: supercoiled, nicked, and linear. Note: RNA contamination up to 1 μg can be tolerated in the sequencing reaction, but it affects DNA quantitation greatly. Measure the A260/A280 ratio of your samples. For pure preparations of DNA (in TE), the A260/A280* ratio is 1.8. Very clean samples in pure water can give a ratio of 1.5 to 1.6. Smaller ratios may indicate the presence of protein or organic contaminants. Ratios less than 1.8 may still produce high quality results. Quantitate the DNA template using the absorbance at 260 nm (A260). Quantitation by agarose gel electrophoresis may not be accurate because ethidium bromide incorporation is not consistent and the method of comparing the standard and sample brightness is subjective. Dilute or concentrate the DNA as needed to obtain an A260 reading between 0.05 and 1.00. A260 values below 0.05 or above 1.00 are not accurate because Beer’s law generally applies only within a certain concentration range. Outside of this concentration range, the relationship between absorbance and concentration is nonlinear. *A260 and A280 are the optical spectrometer measurement of absorbance at the wavelengths of 260 nm and 280 nm respectively. A260 is frequently used to measure DNA/RNA concentration and A280 is used to measure protein concentration. A ratio of A260/A280 > 1.8 suggests little protein contamination in a DNA/RNA sample. Page 10 of 11 Sanger Sequencing Troubleshooting Guide (GNGFM00346) v1.1 Approved By: Ken McGrath Release Date: 11/12/2014 Sanger Sequencing: Troubleshooting Guide Description 5.2 Primer Design Review Recommendation Comment Ensure that the primer has Tm >45 °C. If the Tm is too low, it may result in poor priming and low or no signal Ensure that primers are at least 18 bases long. Primers that are too short may have Tms that are too low. Ensure that there are no known secondary hybridization sites on the target DNA. Secondary hybridization sites on the target DNA can result in double peaks throughout the sequence Choose primers that do not have runs of identical nucleotides, especially 4 or more Gs. Runs of identical nucleotides in primers can cause n+1 or n-1 effects. Also, these primers may be more difficult to synthesize. Choose primers with G-C content in the range of 30 to 80%, preferably 50 to 55%. If the G-C content is too low, the Tm may be too low. If so, increase the primer length beyond 18 bases to obtain a Tm>45 °C. Design primers to minimize the potential for secondary structure and/or hybridization Primer-dimer formation from hybridization can result in mixed sequence at the beginning of the sequence. Secondary structure in the primer, particularly at the 3′ end can result in poor priming and low or no signal. Purify primers by HPLC to reduce the quantity of n-1 primers. Primers containing contaminants or synthesized primers of the wrong length can cause problems in sequencing reactions, such as failed reactions, noisy data, or poor sequencing results. If the primer is a short oligo that contains n-1 primers, HPLC cannot always remove the n-1 contaminants. 6 Contact AGRF Sequencing If you have not resolved your problem, please contact AGRF Sequencing for further support. Contact Details Email: [email protected] Phone: 07 3365 8815 Page 11 of 11 Sanger Sequencing Troubleshooting Guide (GNGFM00346) v1.1 Approved By: Ken McGrath Release Date: 11/12/2014