1
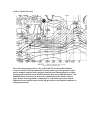
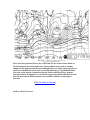
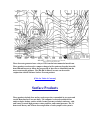
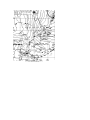
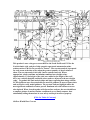
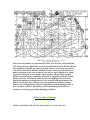
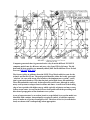
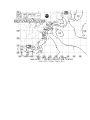
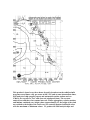
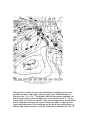
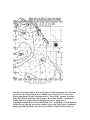
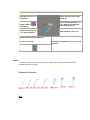
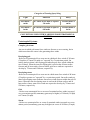
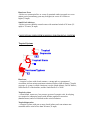
Ocean Prediction Center's
Radiofacsimile Charts
User's Guide
Ocean Prediction Center Home Page; URL: http://www.opc.ncep.noaa.gov/
Last Updated: February 12, 2007
Table of Contents
Introduction to Ocean Prediction Center's (OPC) Radiofacsimile Program
500 MB Products
6-Hour 500-mb Forecasts
24-Hour 500-mb Forecasts
36-Hour 500-mb Forecasts
48-Hour 500-mb Forecasts
96-Hour 500-mb Forecasts
Surface Products
Surface Analysis
48-Hour Surface Forecast
96-Hour Surface Forecast
Sea State Products
Sea State Analysis
48-Hour Wind & Wave Forecast
48-Hour and 96-Hour Wave Period & Direction/Ice Accretion Forecast
Regional Products
Regional Sea State Analysis
Regional 24-Hour Surface Forecast
Regional 24-Hour Wind/Wave Forecasts
Oceanographic Products
Ocean Prediction Center's OFB Atlantic and Pacific Radiofacsimile Schedules
Description of Tropical Prediction Center's (TPC) Radiofacsimile Program
Summary
Ocean Prediction Center Radiofacsimile
Program
The National Weather Service (NWS) has the responsibility for issuing warnings
and forecasts to protect life and property in the maritime community. The area of
responsibility covers most of the North Atlantic and North Pacific N of 30N with
graphical products covering the marine areas S to 15N. Most of these products are
in graphical format and prepared by the NWS's National Centers For Enviromental
Prediction (NCEP) by its Ocean Prediction Center (OPC). The Ocean Forecast
Branch (OFB) a unit of OPC at Camp Springs, MD, near Washington D.C. is
responsible for the issuance of various marine products. These products are
distributed by high-frequency (HF) Radiofacsimile broadcast via the US Coast
Guard Communications Centers at Boston, MA, and Pt Reyes, CA, for the North
Atlantic and North Pacific Oceans, respectively. Also, these products are available
on the internet on the Ocean Prediction Center's Home Page.
High Seas Products
Vessels engaged in national and international trade routinely conduct transoceanic
voyages with fast turn around times between ports of call. Ships require timely and
accurate presentation of meteorological and oceanographic information for a large
geographical area to plan for safe and economical operations. This information is
most user friendly when presented in graphic form. The OPC recognizes HF
Radiofacsimile as the most widely used medium by ships for receipt of graphically
displayed environmental analyses and forecasts.
The following suite of products addresses the common needs and requirements of
professional mariners engaged in transoceanic crossings and offers the maritime
community complete and timely graphic products to support navigation safety and
operating efficiency. Three primary types of products are issued: upper air 500
millibar (mb) charts, surface pressure, and sea state charts. Additional charts
include sea surface temperatures (SST), tropical streamline and surface analyses,
and meteorological satellite imagery. Users whose specific or specialized
requirements for high seas information are not met by these general safety-oriented
products are referred to the private meteorological and oceanographic sector for
assistance.
Base Maps
There are two types of base maps. The larger scale ocean base map is a mercator
projection and has latitude and longitude marked in 10 degree increments. The
second type of base map is the regional which encompasses the west and east coasts
of the US covering subsections of the Atlantic and Pacific high seas areas in the
mercator projection. In addition the regional Pacific has a polar stereographic
which is for the Alaska region.
[Click for Table of Contents]
Upper Air 500-MB Products
The 500-mb charts are produced from a computer model of the atmosphere. These
products are automated unmodified computer outputs that depict height contours
above the earth's surface (geopotential heights) at 60 meter intervals. Wind speeds
of 30 knots and greater are shown with wind barb increments of 5 or 10 knots.
Embedded within the 500-mb height field are short wave troughs, generally 50
degrees or less in longitude. These are drawn on the charts as bold dashed lines.
These short wave troughs will assist the mariner in locating surface low pressure
systems or developing lows on frontal waves. The 500-mb winds approximate the
speed of motion of surface extra-tropical lows (often about 1/3 to 1/2 of the 500-mb
wind speed) and surface wind force (approximately 50 percent), particularly in the
colder SW quadrant. The 5640 meter height contour is highlighted since this height
contour is widely used by the professional mariner for general surface storm track
direction and the southern extent of Beaufort Force 7 (28-33 knot) or greater
surface winds in the winter, and force 6 (22-27 knot) winds in summer. The 500-mb
products are not intended to be used alone. The mariner is strongly advised to
examine other Radiofacsimile products described in this User's Guide in order to
derive a complete picture of weather and sea state conditions.
[Click for Table of Contents]
6-Hour 500-mb Forecasts
These 6-hour forecasts are generated twice a day for 00Z and 12Z. They depict
synoptic scale flow patterns, location, and amplitude of long and short waves. These
synoptic scale features can be compared with previous analyses to determine the
movement and trends of the upper air pattern. They can be used in conjunction
with the surface analyses, sea state analyses, and meteorological satellite imagery,
which are valid at the same synoptic time. These forecasts come from the numerical
model forecast 6 hours earlier.
[Click for Table of Contents]
24-Hour 500-mb Forecasts
These forecasts generated twice a day at 00Z and 12Z for the regional Atlantic
ocean are based on the latest numerical forecast model run. These products can be
used to compare changes in flow patterns from the latest 500-mb analyses to follow
the progression of short waves identified from the most recent 500-mb analyses. The
500-mb 24-Hour Forecasts can be used in conjunction with the Surface and Sea
State 24-hour forecast products. Comparison or verification of previous 24-hour
500-mb Forecasts with the most current 500-mb analysis can establish confidence in
subsequent forecasts.
36-Hour 500-mb Forecasts
These forecasts generated twice a day at 00Z and 12Z for the Atlantic ocean are
based on the latest numerical forecast model run. See 48-Hour 500-mb Forecast for
further details.
[Click for Table of Contents]
48-Hour 500-mb Forecasts
These forecasts generated twice a day at 00Z and 12Z for each ocean are based on
the latest numerical forecast model run. These products can be used to compare
changes in flow patterns from the latest 500-mb analyses to follow the progression of
short waves identified from the most recent 500-mb analyses. The 500-mb 48-Hour
Forecasts can be used in conjunction with the Surface and Wind/Wave 48-hour
forecast products. Comparison or verification of previous 48-hour 500-mb Forecasts
with the most current 500-mb analysis can establish confidence in subsequent
forecasts.
[Click for Table of Contents]
96-Hour 500-mb Forecasts
These forecasts generated once a day at 12Z from the latest numerical model run.
These products can be used to compare changes in flow patterns from the latest 48hour 500-mb forecast to follow the progression of short waves identified from the
most recent model guidance. The 500-mb 96-Hour Forecasts can be used in
conjunction with the 96-hour Surface Forecast product.
[Click for Table of Contents]
Surface Products
These products include four surface analyses per day transmitted in two parts and
two 48-Hour Surface Forecasts daily. The computer workstation aided surface
analyses depict isobars, surface winds, frontal systems (occluded, stationary, cold,
and warm), low and high pressure center positions, and central pressure. The 24
hour track history and 24 hour forecast position of each synoptic scale system's
position and central pressure are displayed on 48-hour surface forecasts. Systems
having or expected to have synoptic scale "Gale", "Storm", or "hurricane force"
conditions are labeled in bold capital letters. Similarly systems expected to develop
"Gale", "Storm" or "hurricane force" conditions in 24 hours have labels of
"Developing Gale" , "Developing Storm" or "Developing Hurricane Force".
Surface low pressure falls of 24 mb or greater during a 24 hour period are denoted
in large capital letters as "RAPIDLY INTENSIFYING".
NOTE: It can be difficult to determine the central pressures of tropical depressions,
tropical storms, and hurricanes/typhoons and at times no estimates or
measurements is provided by a hurricane or typhoon specialist. Therefore, an XX is
used for forecast central pressure.
Standard abbreviations:
DSIPT - DISSIPATE
STNRY - STATIONARY
WKNG - WEAKENING
RPDLY - RAPIDLY
FRMG - FORMING
MOVG - MOVING
INLD - INLAND
DVLPG - DEVELOPING
COMB - COMBINED
DCRS - DECREASE
INCRS - INCREASE
INTSFY - INTENSIFY
Q-STNRY - QUASI-STATIONARY
For further information on terms or abbreviations used on surface products go to
the section Key terms & Symbols listed below.
For tropical cyclones, the alphanumeric description of the analyses or forecast time
are displayed in bold capital letters adjacent to the tropical cyclone's position with
the appropriate cyclone symbol.
TYPHOON or HURRICANE or TROPICAL STORM "NAME"
LATITUDE ___ LONGITUDE ___
MAX WINDS___ KT G (GUST) ___KT
MOV DIR ___ (DEGREES) AT __KT
A 24-hour tropical cyclone symbol forecast position will be depicted on all surface
analyses. Both 24-hour and 72-hour tropical cyclone positions will appear on the 48hour surface forecasts. Mariners are strongly advised to rely on the latest warnings
from the Tropical Prediction Center's (TPC) National Hurricane Center (NHC) ,
which covers the Atlantic and the Eastern Pacific Oceans east of 140W, and the
Central Pacific Hurricane Warning Center (PHNL) covering the Eastern and
Central Pacific Ocean west of 140W to the international dateline (180), and the Joint
Typhoon Warning Center (JTWC), covering the Western Pacific west of 180.
The surface forecasts produced by our marine meteorologists are derived by
comparing several U.S. and foreign government agencies forecast models. As a
result of the blending of these different model solutions, the surface forecasts may
not exactly coincide with the corresponding automated 500 mb forecasts.
[Click for Table of Contents]
Surface Analyses (Parts 1&2)
+
+
The surface analyses are generated four times per day (00Z, 06Z, 12Z, and 18Z) for
each ocean. The analyses consist of isobaric pressure analyses at 4 mb contour
interval spacing, labeled every 8 MB. The central pressure mb values of low and
high pressure systems are depicted in bold 3 or 4 digits and underlined and placed
adjacent to or under the "H" or "L". The surface analyses also consist of
abbreviated automated ship plots of wind direction (8 points on the compass rose),
wind speed (in knots) and present reported weather (using current standard
symbols). The product is issued in two parts, which overlap by some 10 degrees of
longitude. Both parts will project the low or high pressure system's forecast position
by drawing an arrow to the 24-hour position labeled as an "X" for lows and a circle
with an "X" in the middle for highs with a bold two digit millibar central pressure
value underlined under or adjacent to the 24-hour position label (e.g.,1050 mb high
would be written as a 50 and a 960 mb low would have 60). Significant weather
systems have labels depicting whether the system has "gale", "storm" or "hurricane
force" conditions as observed by ship and buoy observations, Special Sensor
Microwave Imagery (SSM/I), QuikSCAT, satellite, or computer model guidance. If
24 hour forecast gale, storm or hurricane force conditions are expected, the
appropriate area has the label "developing gale", "developing storm" or
"developing hurricane force". The surface analyses have been doubled in size and
issued as a two part product to allow the mariner to use the surface analyses as a
work chart. The mariner can also have the option to use the appropriate Parts 1 or
2 if operating only in that part of the ocean which will impact the vessel. The
mariner can also compare the ship's current barometric pressure reading and
Beaufort Wind Scale force conditions or anemometer readout of winds observed at
the vessel to determine the product's validity. NOTE: It can be difficult to determine
the central pressures of tropical depressions, tropical storms, and
hurricanes/typhoons and at times no estimates or measurements is provided by a
hurricane or typhoon specialist. An estimate of central pressure may be provided
over the Atlantic. Otherwise an XXX is used in place of actual or estimated
pressures associated with these systems and an XX is used for forecast central
pressure.
Mariners can then make their own inferences on how specific weather systems will
impact their vessels. Used in conjunction with a 500 mb analysis, the 24 hour
forecast position of synoptic scale weather systems will aid in determining a weather
system's motion and intensity trends, thus extending the usefulness of the product.
The surface analyses will also be broadcast in a very timely manner, less than 3 1/2
hours from the valid synoptic time. This product is an important tool that can
substantially aid in the independent decision making process for crew safety,
protection of the ship, prevention of cargo damage, and maintaining schedules.
[Click for Table of Contents]
48-Hour Surface Forecasts
These surface forecast products generated twice each day for each ocean based on
the 00Z and 12Z Global Forecast System (GFS) forecast model run outputs with
additional guidance from other government agencies such as the NAVYs Navy
Operational Global Atmospheric Prediction System (NOGAPS). Also, other foreign
governments/university numerical model guidance is used such as the Canadian
Regional Model (GEM). The use of several numerical models allows adjustments to
be made to the final forecast product. The products show surface isobars every 4 mb
with labeling of 2 digits in increments of 8 mb. The central pressure millibar values
of synoptic scale lows and highs in bold 3 or 4 digits are underlined adjacent to or
under the "L" or "H". The 24-hour forecast position and future 72-hour forecast
position of lows and highs have vector arrows with an "X" for low centers and a
"circle with an X inside" by the head for high centers. An underlined bold two digit
mb central pressure value will be placed under or adjacent to the 24/72 hour
position label (e.g.,1050 mb high would be written as a 50 and a 960 mb low would
have 60). The 48-hour surface forecast depicts wind speeds in knots (wind barbs in
increments of 5 or 10 knots) for areas of wind in excess of 33 knots, and frontal
systems (occluded, warm, and cold). Significant systems have labels depicting
whether the system is expected to have "gale" , "storm" or "hurricane force"
conditions. If 72 hour forecast gale, storm or hurricane force conditions are
expected, the appropriate area has the label "developing gale" , "developing storm"
or "developing hurricane force" . If a tropical system such as a hurricane or
typhoon is anticipated the 48-hour position will be indicated as a "tropical symbol"
with the pressure as "XXX" for an unknown pressure. The 24-hour and 72-hour
position will correspond to the latest official forecast from the Joint Typhoon
Warning Center (JTWC) or Central Pacific Hurricane Center (CPHC) in the
Pacific or the National Hurricane Center (TPC) in Miami, Florida which has
responsibilities in the Atlantic and Pacific. The very timely issuance of the 48-hour
surface forecasts, when used in conjunction with the 48-hour 500 mb and wind/wave
forecast products can help vessels make course and speed adjustments to avoid the
heaviest forecast wind and wave conditions or minimize the ship's exposure to heavy
weather. The tracking history and forecast projection of highs and low from 24
hours through 72 hours will serve to extend the time usage of the product, thus
aiding a vessel's Master in the determination of crew safety, minimizing ship or
cargo damage, fuel economy, and maintaining schedules.
[Click for Table of Contents]
96-Hour Surface Forecasts
These extended surface forecast products are generated once each day. The product
is based on the 12Z Global Forecast System (GFS) model for each ocean with
additional guidance from other government agencies such as the Navy's Navy
Operational Global Atmospheric Prediction System (NOGAPS). Also, other foreign
goverments numerical model guidance is used such as the European Center for
Medium Range Weather Forecasts (ECMWF) and Canadian Regional Model. The
use of several numerical models allows adjustments to be made to the final forecast
product. The products show surface isobars every 4 mb with labeling of 2 digits in
increments of 8 mb. The central pressure millibar values of synoptic scale lows and
highs in bold 3 or 4 digits are underlined adjacent to or under the "L" or "H". The
72-hour forecast position and future 120-hour forecast position of lows and highs
have vector arrows with an "X" for low centers and a "circle with an X inside" by
the head for high centers. An underlined bold two digit mb central pressure value
will be placed under or adjacent to the 72/120 hour position label (e.g.,1030 mb high
would be written as a 30 and a 980 mb low would have 80). The 96-hour surface
forecast depicts wind speeds in knots greater than or equal to 34 kt (wind barbs in
increments of 5 or 10 knots), and frontal systems (occluded, warm, and cold).
Significant systems have labels depicting whether the system is expected to have
"gale" , "storm" or "hurricane force" conditions. If by 120 hours forecast gale,
storm or hurricane force conditions are expected, the appropriate area has the label
"developing gale", "developing storm" or "developing hurricane force". If a
tropical system such as a hurricane or typhoon is anticipated the 96-hour position
will be indicated as a "tropical symbol" with the pressure as "XXX" for an
unknown pressure. The 72-hour and 120-hour position will correspond to the latest
official forecast from the Joint Typhoon Warning Center (JTWC) or Central
Pacific Hurricane Center (CPHC) in the Pacific or the National Hurricane Center
(TPC) in Miami, Florida which has responsibilities in the Atlantic and Pacific. The
issuance of the 96-hour surface forecasts, when used in conjunction with the 96-hour
500 mb, can help vessels make course and speed adjustments to avoid the heaviest
forecast wind conditions or minimize the ship's exposure to heavy weather. The
tracking history and forecast projection of highs and lows from 72 hours through
120 hours will serve to extend the time usage of the product.
[Click for Table of Contents]
Sea State Products
One of the greatest hazards to a vessel's safety and seakeeping capability is having
to maneuver around and through changeable sea state conditions. Masters have the
awesome responsibility to make transoceanic crossings with crew safety the highest
in priority and then ensuring that the ship and its valuable cargo arrive at
destination ports safely while meeting tight schedules. The duration of adverse or
slowing seas must be minimized since turn around time in each port is usually less
than 24 hours. OPC issues one sea state analysis for both the Atlantic and Pacific
oceans on a daily basis. The OPC issues two 48-Hour Wind/Wave Forecasts and one
96-Hour Wind/Wave Forecast each day. In addition two 48-Hour Period Forecasts
and one 96-Hour Period Forecast are prepared each day. During the winter cold
season, the ice edge is depicted as a bold jagged line. The contours for these
products is in one meter intervals with a relative maximum and minimum combined
wave height values centrally displayed and inside a box. Forecast of all wind speeds
is also depicted. The sea state forecast when viewed with the 48-hour surface
forecasts will help vessels make course and speed adjustments to avoid hazardous
conditions and minimize exposure to slowing conditions.
[Click for Table of Contents]
Sea State Analysis
This product is once a day per ocean at 00Z for the North Pacific and 12Z for the
North Atlantic with analysis of ship synoptic reports and automated weather
stations such as CMANs for sea state in "meters". The sea state analysis is prepared
for each ocean at the time of day when the greatest quantity of observations are
taken. The sea state analysis has solid 1 meter contour intervals. Where
appropriate, relative maxima and minima combined wave height values
(approximately 1/3 the height of the wind wave added to the height of the swell
wave) are centrally depicted and inside a box under or adjacent to the wave height
value. To produce the final analysis ships and buoys reporting data along with the
NCEP significant wave forecast models are used for guidance in areas of sparse data
and are used to verify model guidance. The sea state analyses highlight where the
most significant combined sea states prevail. Dominant wave direction arrows are
also depicted. When viewed together with the surface analyses, the user should have
a complete picture of surface weather conditions in a very timely manner, thus
substantially aiding the mariner in crew safety and the protection of property.
[Click for Table of Contents]
48-Hour Wind&Wave Forecast
These forecast products are generated twice daily. The forecasts valid at 00Z and
12Z are based on the significant wave forecast model runs from NCEP WaveWatch.
The combined sea heights are depicted in solid contours of one meter increments
with relative maxima or minima combined sea state values enclosed inside a box
under or adjacent to the area of interest. Also, the ice edge is displayed as a bold
jagged line during the winter months. These products will provide a complete
picture of forecast surface conditions when used in conjunction with the 48-hour
surface forecasts. The 48-hour wind/wave forecasts highlight where the most
significant combined sea heights prevail. Also, forecast wind speed in knots are
plotted on this chart. The wind/wave forecasts products are issued in a timely
manner and will significantly aid in the independent decision-making process of
heavy weather avoidance, thus aiding vessels in minimizing the duration of
encounter of slowing or potentially damaging conditions.
[Click for Table of Contents]
48-Hour and 96-Hour Wave Period & Direction/Ice Accretion Forecast
Computer generated chart is generated twice a day from the 00Z and 12Z NCEP
computer model runs for 48 hours and once a day from 12Z for 96 hours. The 48hour and 96-hour graphics are manually edited ( 00Z Pacific 48-Hour Wave Period
Forecast [TIF|GIF| B/W GIF].
The forecast relies on guidance from the NCEP WaveWatch with forecasts for the
Atlantic and Pacific Oceans. The peak period identifies either the locally generated
`wind sea' (in cases with strong local winds) or the dominant wave system (`swell')
that is generated elsewhere. Note that the peak period field shows discontinuities.
These discontinuities can loosely be interpreted as swell fronts, although in reality
many swell systems overlap at most locations and times. A swell front is the leading
edge of wave periods with higher energy which typically originates and moves away
from a storm center. Arrows on the forecast chart point toward the prevailing swell
direction of propagation of the dominant wave system.
Areas of superstructure ice accretion, based on a specialized ice accretion model, are
identified with a unique, internationally recognized, symbol. A bold line separates
areas of moderate or greater from light or less. The areas of fast ice (ice attached to
land) are shown with a scalloped edge when appropriate.
[Click for Table of Contents]
Regional Products
Regional surface graphic products target coastal, offshore and high-seas users.
These products produced on mercator map backgrounds encompass the western
Atlantic Ocean west of 40W and north of 20N, including the US east coast and much
of the Gulf of Mexico. Also covered on the mercator projection is the eastern North
Pacific Ocean, from the Baja peninsula, just south of Cabo San Lucas, and north to
the Gulf of Alaska, including Prince William Sound as far west as 155W. On the
polar stereographic map backgrounds which includes Alaska and covers the area
from 40N to 70N and to as far west as 165E. The regional products consist of
mercator sea state analysis and 24-hour forecasts of the mercator/polar
stereographic surface and wind/wave. The Ocean Prediction Center issues the
regional sea state analysis and forecast products several times daily per ocean for
00Z, 12Z, and other intermediate times. The sea state analysis shows ship
observations with observed winds (knot) and sea state in feet. The short range
forecast products depict synoptic and mesoscale features of surface low and high
pressure systems and isobars with frontal features, areas of reduced visibility, wind
speeds, and significant wave height as generated by the synoptic and mesoscale
weather systems within 1000 miles of the U.S. east and west coasts. The process of
product preparation includes using wind speeds derived from Special Sensor
Microwave Imagery (SSM/I), and QuikSCAT received from polar orbiting satellite
from oceanic areas. This high state of the art technology of data input represents a
significant enhancement in analyzing wind conditions in the marine environment.
SSM/I and QuikSCAT is especially noteworthy in data sparse areas where there are
no ship or buoy reports. SSM/I and QuikSCAT aids in short range prediction of the
24-hour forecast products by enabling marine meteorologists to compare initial data
from forecast model output and making the necessary adjustments to the near term
forecast solutions.
[Click for Table of Contents]
Regional Sea State Analysis
This product is issued every three hours for and is broadcast on the radiofacsimile
program several times a day per ocean at 00Z, 12Z, and at some intermediate times,
with analysis of ship synoptic reports and automated weather stations such as
CMANs for sea state in "feet" and observed windspeed (knot). The sea state
analysis has solid three foot contour intervals. Where appropriate, relative maxima
and minima combined wave height values (approximately 1/3 the height of the wind
wave added to the height of the swell wave) are centrally depicted and inside a box
with the maximum or minimum values. To produce the final analysis ships and
buoys reporting data along with the NCEP significant wave forecast models are
used for guidance in areas of sparse data and are used to verify model guidance. The
sea state analyses highlight where the most significant combined sea states prevail.
When viewed together with the surface analyses, the user will have a complete
picture of surface weather conditions in a very timely manner, thus substantially
aiding the mariner in crew safety and the protection of property.
[Click for Table of Contents]
Regional 24-Hour Surface Forecast
This product is a surface forecast chart featuring low and high pressure center
positions with bold 3-and 4-digit central pressure values underlined under or
adjacent to the "L" or "H". The 00-hour (FROM: time) position and future 48hour forecast position of lows and highs have vector arrows with an "X" for low
centers and a "circle with an X inside" by the head for high centers. An underlined
bold two digit mb central pressure value will be placed under or adjacent to the
recent analyzed pressure of lows and highs and for the 48 hour position label (e.g.,
1050 mb high would be written as a 50 and a 960 mb low would have 60). The 24-
hour surface forecast also depicts wind speeds in knots (wind barbs in increments of
5 or 10 knots) for areas of wind in excess of 33 knots. Significant systems have
labels depicting whether the system is expected to have gale, storm or hurricane
force conditions. If 24 hour forecast "gale", "storm" or "hurricane force"
conditions are expected the system is labeled with the appropriate warning. If
"gale" , "storm" or "hurricane force" conditions are expected by 48 hours the
appropriate area has the label "developing gale" , "developing storm" or
"hurricane force". Also displayed on this surface forecast chart are frontal systems
(occluded, warm, and cold) and when appropriate, associated areas of fog,
signifying areas of potential restriction to visibility. The frontal systems themselves
imply regions of visibility-reducing precipitation, which for the sake of clarity and
brevity are not depicted. Isobars (lines of equal surface pressure) are depicted in
increments of 4 mb except 8 mb for deep systems (i.e., 960 mb). The 1000 mb
contour will be dashed to separate 4 mb from 8 mb contour spacing. If a tropical
system such as a hurricane or typhoon is anticipated the 24-hour position will be
indicated as a "tropical symbol" with the pressure as "XXX" for an unknown
pressure. The 48-hour position will correspond to the latest official forecast from the
responsible Typhoon Warning Center in the Pacific or the National Hurricane
Center in Miami, Florida.
[Click for Table of Contents]
Regional 24-Hour Wind/Wave Forecast
This forecast product depicts 24-hour forecasts of wind (increments of 5 knots) and
significant wave heights (isopleths of combined sea and swell in 3 foot intervals).
During appropriate weather conditions such as "North Wall" episodes occurring
along the northern wall of the Gulf Stream in the western Atlantic, substantially
higher wind/wave height values are highlighted. Arrows will point to a
superimposed hatched area of the Gulf Stream. The "North Wall" event is normally
confined to the adjacent areas of the northern edge of the Gulf Stream. In addition
during especially significant NE winds the statement "Winds and Waves may be
significantly higher than indicated in the Gulf Stream. Another item that may be
highlighted on the forecast is "Swell fronts" which may originate from tropical
systems. These "Swell fronts" can be hazardous conditions to marine operations
and those in coastal areas. A scalloped line is used to depict the front and is labeled
appropriately such as "SWELL FRONT FROM HURRICANE DEBBY" Arrows
will be from the text to the leading edge of the "Swell front" Forecast guidance to
prepare this product are provided by wave height and wave period models from
NCEP. The wave height values are depicted by solid contours in increments of three
feet. Superstructure icing, displayed by a half moon with one or two lines crossing
through the center, will depend on the forecast for light or heavy accumulation.
[Click for Table of Contents]
Oceanographic Products
Oceanographic Operational Products-Sea Surface Temperature (SST)
There are two ocean charts available on the Pacific Radiofacsimile program. Each
of the charts is updated once a day with automated Sea Surface Temperature (SST)
analyses derived from (IR) Infrared Satellite. The northern chart includes the
nearshore waters of Washington and Oregon as well as the coastal waters of
Vancouver Island and Queen Charlotte Sound in Canada; SST Analysis (40N-53N,
east of 136W). The southern chart includes all of California, the Baja peninsula, and
most of the coastal waters of western Mexico, south to near Puerto Vallarta; SST
Analysis (23N-42N, east of 136W).
+
NOTE: Like weather charts, oceanographic charts depict operational data that are
part of the total data set of the National Oceanic and Atmospheric Administration.
The charts reflect a basic analysis of the data to support safe and efficient
operations in the marine environment. If these products do not meet their specific
operational requirements, users should consult the private meteorological and
oceanographic community for further assistance.
[Click for Table of Contents]
Key terms and Symbols
FRONTS
Cold front
-The leading edge of a relatively colder air mass which separates two air masses
in which the gradients of temperature and moisture are maximized. In the
northern hemisphere winds ahead of the front will be southwest and shift into the
northwest with frontal passage.
Frontogenesis
-The formation of a front occurs when two adjacent air masses with different
densities and temperatures meet and strengthen the discontinuity between the air
masses. It occurs most frequently over continental land areas such as over the
Eastern US when the air mass moves out over the ocean. It is the opposite of
frontolysis.
Frontolysis
-The weakening or dissipation of a front occurs when two adjacent air masses lose
contrasting properties such as the density and temperature. It is the opposite of
frontogenesis.
Occluded front
- The union of two fronts, formed as a cold front overtakes a warm front or quasistationary front refers to a cold front occlusion. When a warm front overtakes a
cold front or quasi-stationary front the process is termed a warm front occlusion.
These processes lead to the dissipation of the front in which there is no gradient in
temperature and moisture.
Ridge
- an elongated area of relatively high pressure that is typically associated with a
anticyclonic wind shift.
Stationary front
- A front that has not moved appreciably from its previous analyzed position.
Trough
- [trof], an elongated area of relatively low pressure that is typically associated
with a cyclonic wind shift.
Warm front
- The leading edge of a relatively warmer surface air mass which separates two
distinctly different air masses. The gradients of temperature and moisture are
maximized in the frontal zone. Ahead of a typical warm front in the northern
hemisphere, winds are from the southeast and behind the front winds will shift to
the southwest.
LOW & HIGH PRESSURE SYSTEMS AND MISCELLANEOUS KEY
TERMINOLOGY USED
Low pressure with a number such as 99 means 999 mb and with 03 means 1003 mb. High pressure with a number such
as 25 means 1025 mb.
Extratropical low
- A low pressure center which refers to a migratory frontal cyclone of middle and
higher latitudes. Tropical cyclones occasionally evolve into extratropical lows
losing tropical characteristics and become associated with frontal discontinuity.
Low pressure
- An area of low pressure identified with counterclockwise circulation in the
northern hemisphere and clockwise in the southern hemisphere. Also, defined as a
cyclone.
High pressure
- An area of higher pressure identified with a clockwise circulation in the northern
hemisphere and a counterclockwise circulation in the southern hemisphere. Also,
defined as an anticyclone.
New
- The term "NEW" may be used in lieu of a forecast track position of a high or
low pressure center when the center is expected to form by a specific time. For
example, a surface analysis may depict a 24-hour position of a new low pressure
center with an "X" at the 24-hour position followed by the term "NEW", the date
and time in UTC which indicates the low is expected to form by 24 hours.
Rapidly intensifying
- Indicates an expected rapid intensification of a cyclone with surface pressure
expected to fall by at least 24 millibar (mb) within 24 hours.
Station plot
Information on coding used with the surface preliminary analysis or for a list of
"present weather" symbols.
Station ID = KPZH
temperature (F or C) = 70
= 70 degree F
Station Pressure (mb) = 048 =
1004.8 mb
present weather =
thunderstorm
3 hour pressure tendency = -7 \
= -0.7 mb pressure decrease
with steady pressure f
=
dew point temperature (F
or C) = 68= 68 degree F
wave height (ft or m) = 11 ft
wind speed & direction = SSW 25 kt
sky cover = overcast
Sea Surface Temperature (F or C) = 75 = 75
degrees F
Squall
- A sudden wind increase characterized by a duration of minutes and followed by
a sudden decrease in winds.
Windspeed & Direction
FOG
Fog
- Over the marine environment the term fog refers to visibility greater than or
equal to 1/2 NM and less than 3 NM. Fog is the visible aggregate of minute water
droplets suspended in the atmosphere near the surface.
Dense fog
-Over the marine environment the term dense fog refers to visibility less than 1/2
NM. Fog is the visible aggregate of minute water droplets suspended in the
atmosphere near the surface. Usually dense fog occurs when air that is lying over
a warmer surface such as the Gulf Stream is advected across a colder water
surface and the lower layer of the airmass is cooled below its dew point.
Sea fog
- Common advection fog caused by transport of moist air over a cold body of
water.
FREEZING SPRAY
Freezing spray
- Spray in which supercooled water droplets freeze upon contact with exposed
objects below the freezing point of water. It usually develops in areas with winds
of at least 25 knots.
Categories of Freezing Spray/Icing
Light
Moderate
Heavy
Less than 0.7
cm/hr
0.7 cm/hr to less than or equal to
2.0 cm/hr
Greater than 2.0
cm/hr
Less than 0.3
ins/hr
0.3 ins/hr to less than or equal to
0.8 ins/hr
Greater than 0.8
ins/hr
CONVENTIONS USED WITH WARNINGS FOR EXTRATROPICAL
SYSTEMS
Extratropical Systems
Complex gale/storm
-An area in which gale/storm force winds are forecast or are occurring, but in
which more than one center is the generating these winds.
Developing gale
-Refers to an extratropical low or an area in which gale force winds of 34 knots
(39 mph) to 47 knots (54 mph) are "expected" by a certain time period. On
surface analysis charts a developing gale indicates gale force winds within the
next 24 hours. When the term developing gale is used on the 48 hour surface
forecast and 96 hour surface forecast charts, gale force winds are expected to
develop by 72 hours and 120 hours, respectively.
Developing storm
-Refers to an extratropical low or an area in which storm force winds of 48 knots
(55 mph) or greater are "expected" by a certain time period. On surface analysis
charts a developing storm indicates storm force winds forecast within the next 24
hours. When the term developing storm is used on the 48 hour surface and 96
hour surface charts, storm force winds are expected to develop by 72 hours and
120 hours, respectively.
Gale
- Refers to an extratropical low or an area of sustained surface winds (averaged
over a ten minute period, momentary gusts may be higher) of 34 knots (39 mph)
to 47 knots (54 mph).
Storm
- Refers to a extratropical low or a area of sustained winds (averaged over a ten
minute period, momentary gusts may be higher) in excess of 48 knots (55 mph).
Hurricane Force
- Refers to a extratropical low or a area of sustained winds (averaged over a ten
minute period, momentary gusts may be higher) in excess of 64 knots or
higher(74 mph).
Small Craft Advisory
- Refers to areas within the coastal waters with sustained winds of 18 knots (21
mph) to 33 knots (38 mph).
CONVENTIONS USED WITH WARNINGS FOR TROPICAL SYSTEMS
Tropical Systems
Hurricane
- A tropical cyclone with closed contours, a strong and very pronounced
circulation, and one minute maximum sustained surface winds 64 knots (74 mph)
or greater. A system is called a hurricane over the North Atlantic, Gulf of Mexico,
North Pacific E of the dateline, and the South Pacific E of 160E.
Tropical cyclone
- A non-frontal, warm-core, low pressure system of synoptic scale, developing
over tropical or subtropical waters with definite organized convection
(thunderstorms) and a well defined surface wind circulation.
Tropical depression
- A tropical cyclone with one or more closed isobars and a one minute max
sustained surface wind of less than 34 knots (39 mph).
Tropical storm
- A tropical cyclone with closed isobars and a one minute max sustained surface
wind of 34 knots (39 mph) to 63 knots (73 mph).
Typhoon
- Same as a hurricane with exception of geographical area. A tropical cyclone
with closed contours, a strong and very pronounced circulation, and one minute
maximum sustained surface winds of 64 knots (74 mph) or greater. A system is
defined as a typhoon over the North Pacific W of the dateline.
NOTE: It can be difficult to determine the central pressures of tropical
depressions, tropical storms, and hurricanes/typhoons and at times no estimates or
measurements is provided by a hurricane or typhoon specialist. An estimate of
central pressure may be provided over the Atlantic. Otherwise an XXX is used in
place of actual or estimated pressures associated with these systems and an XX is
used for forecast central pressure.
SEAS
Combined seas
-The combination of both wind waves and swell which is generally referred to as
"seas".
Primary swell direction
- Prevailing direction of swell propagation.
Significant wave height
- The average height (trough to crest) of the 1/3rd highest waves. An experienced
observer will most frequently report the highest 1/3rd of the waves observed.
The generation of waves on water results not in a single wave height but in a
spectrum of waves distributed from the smallest capillary waves to larger waves.
Within this spectrum there is a finite possibility of each of the wave heights to
occur with the largest waves being the least likely. The wave height most
commonly observed and forecast is the significant wave height. This is defined as
the average of the one third highest waves. The random nature of waves implies
that individual waves can be substantially higher than the significant wave height.
In fact, observations and theory show that the highest individual waves in a
typical storm with typical duration to be approximately two times the significant
wave height. Some reported rogue waves are well within this factor of two
envelope. Waves higher than roughly twice the significant wave height fall into
the category of extreme or rogue waves.
Swell
- Wind waves that have moved out of their fetch or wind generation area. Waves
generated by swell exhibit a regular and longer period than wind waves.
MISCELLANEOUS TERMINOLOGY
High Seas
- That portion of the Atlantic and Pacific oceans which is the area of
responsibility of the Ocean Prediction Center that extends off the Western and
Eastern US coasts and extends to 35W in the Atlantic ocean and to 160E in the
Pacific Ocean. The area includes both the coastal and offshore waters.
Offshore waters
- That portion of oceans, gulfs, and seas beyond coastal waters extending to a
specified distance from the coastline, to a specified depth contour, or covering an
area defined by a specific latitude and longitude points.
[Click for Table of Contents]
Ocean Prediction Center's OFB
Radiofacsimile Schedule
The Atlantic and Pacific Radiofacsimile schedules list product times of transmission,
request for comments on products, and product notice bulletins. During periods of
lost or bad data, transmission problems, etc., information on the nature of the
problem will be substituted for the scheduled product or substituted in the
beginning of each broadcast cycle in place of the test pattern, as time and resources
permit. If there are available time slots with the U.S. Coast Guard transmission
schedule and lesser schedules priorities, and the U.S. Coast Guard agrees, every
attempt will be made to rebroadcast the product. Most likely, the retransmission
will occur at the end of the scheduled broadcast cycle.
[Click for Table of Contents]
Tropical Prediction Center's
Radiofacsimile Program
The counterpart to the Ocean Prediction Center is the Tropical Prediction Center's
Tropical Analysis and Forecast Unit which has responsibility for marine forecasts in
the tropics and subtropics for the area S of 30N to the equator and E of 140W in the
Pacific and S of 30N to the equator W of 35W in the Atlantic. The TAFB
Radiofacsimile Program consists of two product suites: surface analysis products
and marine forecast products. A east Pacific Wind/Seas Analysis (example 18Z
[TIF|GIF]) is prepared by TAFB and is broadcast with forecast products from OPC
through transmitters of the U.S. Coast Guard at Point Reyes, California with charts
for 12Z and 18Z . The graphic includes winds in knots and seas state values in feet.
The chart also includes Tropical systems with the latest analyzed position and wind
speed. Refer to the latest OPC Pacific Radiofacsimile schedule for transmission
times and broadcast frequencies of this product.
For further information on the Tropical Prediction Center's TAFB Radiofacsimile
program and its latest schedule please E-mail your comments to the Tropical
Prediction Center. Additional information can be obtained by phone: (305)-2294430, fax: (305)-553-1264, or writing to:
Chief, TAFB
Tropical Prediction Center
11691 SW 17th St.
Miami, FL 33165-2149
[Click for Table of Contents]
Summary
In consultation with its users, OPC has designed a timely product suite of graphics
and high seas marine warnings and forecasts. When displayed together and
organized the charts provide the mariner with a complete meteorological and
oceanographic picture. Prudent decision making dictates the mariner use all
available information from as many sources as possible.
The OPC's Marine Radiofacsimile Charts and Warning Forecasts program is
designed to assist mariners in making decisions regarding the protection of the crew
from injury, prevention of ship and cargo damage, fuel economy, and meeting fixed
schedules, as well as serving the commercial fishing and recreational communities.
The product suite is based on user feedback and input, and is always subject to
review and revision. We strongly encourage input from the marine user community.
[Click for Table of Contents]
For additional information contact:
National Weather Service
National Centers for Environmental Prediction
Ocean Prediction Center
Washington, DC 20233
Attn: David Feit, Branch Chief, Ocean Forecast Branch, W/NP41
or
Email:[email protected]
Phone: 301-763-8441
Fax: 301-763-8592, 301-763-8085
Ocean Prediction Center Home Page; URL: http://www.opc.ncep.noaa.gov/
Last Updated: February 12, 2007