1
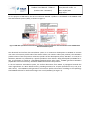
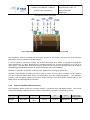
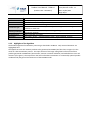
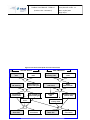
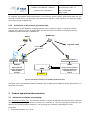
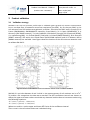
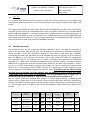
Product User Manual ‐ PUM‐14 (Product H14 – SM‐DAS‐2) Doc.No: SAF/HSAF/PUM‐14 Issue/Revision Index: 1.1 Date: 31/05/2012 Page: 1/24 EUMETSAT Satellite Application Facility on Support to Operational Hydrology and Water Management Product User Manual (PUM) for product H14 – SM‐DAS‐2 Soil Moisture Profile Index in the roots region by scatterometer data assimilation Reference Number: Issue/Revision Index: Last Change: SAF/HSAF/PUM‐14 1.1 31 May 2012 Product User Manual ‐ PUM‐14 (Product H14 – SM‐DAS‐2) Doc.No: SAF/HSAF/PUM‐14 Issue/Revision Index: 1.1 Date: 31/05/2012 Page: 2/24 DOCUMENT CHANGE RECORD Issue / Revision Date 1.0 20/01/2012 Baseline version prepared for ORR1 Part 3 31/05/2012 Updated release for CDOP2 ORR1 Part3 Close‐out: • Removal of the discussions on product status (RID 1) • Removal of the FTP user credentials from section 4 (RID18) • Correction of editorial errors (RID19) • Correction of the reported number of stations (RID14 on PVR14) 1.1 Description Product User Manual ‐ PUM‐14 (Product H14 – SM‐DAS‐2) Doc.No: SAF/HSAF/PUM‐14 Issue/Revision Index: 1.1 Date: 31/05/2012 Page: 3/24 INDEX ..................................................................................................................................................... 5 1 Introduction 2 Product operational characteristics ............................................................................................................... 11 3 Product validation .......................................................................................................................................... 13 4 Product availability ......................................................................................................................................... 16 Product User Manual ‐ PUM‐14 (Product H14 – SM‐DAS‐2) Doc.No: SAF/HSAF/PUM‐14 Issue/Revision Index: 1.1 Date: 31/05/2012 Page: 4/24 List of Tables Table 1 Current status of MetOP, as of January 2012........................................................................................7 Table 2 Main features of ASCAT..........................................................................................................................8 Table 3 Comparisons of normalised soil moisture between in situ observations and SM‐DAS‐2 for 2010.....15 Table 4 H‐SAF Product List................................................................................................................................20 List of Figures Figure 1 SM‐DAS‐2 production chain based on ASCAT surface soil moisture data assimilation in the ECMWF Land Data Assimilation System...........................................................................................................................6 Figure 2 Hydrology Tiled ECMWF Scheme for Surface Exchanges over Land....................................................7 Figure 3 Flow chart of the liquid root zone soil moisture..................................................................................9 Figure 4 Conceptual architecture of SM‐DAS‐2 production chain....................................................................11 Figure 5 Conceptual scheme of the EUMETSAT Application Ground Segment................................................18 Figure 6 Current composition of the EUMETSAT SAF Network (in order of establishment)...........................19 Figure 7 Required H‐SAF coverage: 25‐75°N lat, 25°W ‐ 45°E..........................................................................20 Figure 8 H‐SAF central archive and distribution facilities.................................................................................21 Product User Manual ‐ PUM‐14 (Product H14 – SM‐DAS‐2) Doc.No: SAF/HSAF/PUM‐14 Issue/Revision Index: 1.1 Date: 31/05/2012 Page: 5/24 1 Introduction 1.1 Purpose of the document Product User Manuals are available for each operational H‐SAF product, for open users, and also for demonstrational products, as necessary for beta‐users. Each PUM contains: • Product introduction: principle of sensing, Satellites utilized, Instrument(s) description, Highlights of the algorithm, Architecture of the products generation chain, Product coverage and appearance; • Main product operational characteristics: Horizontal resolution and sampling, Observing cycle and time sampling, Timeliness; • Overview of the product validation activity: Validation strategy, Global statistics, Product characterisation • Basic information on product availability: Access modes, Description of the code, Description of the file structure An annex also provides common information on Objectives and products, Evolution of H‐SAF products, User service and Guide to the Products User Manual. Although reasonably self‐standing, the PUM’s rely on other documents for further details. Specifically: • ATDD (Algorithms Theoretical Definition Document), for extensive details on the algorithms, only highlighted here; • PVR (Product Validation Report), for full recount of the validation activity, both the evolution and the latest results. These documents are structured as this PUM, i.e. one document for each product. They can be retrieved from the CNMCA site on HSAF web page at User Documents session. On the same site, to obtain user and password please contact the Help Desk) it is interesting to consult, although not closely connected to this PUM, the full reporting on hydrological validation experiments (impact studies): • HVR (Hydrological Validation Report), spread in 10 Parts, first one on requirements, tools and models, then 8, each one for one participating country, and a last Part with overall statements on the impact of H‐SAF products in Hydrology. 1.2 Introduction to product SM‐DAS‐2 1.2.1 Principle of sensing Product SM‐DAS‐2 (Root zone soil moisture index in the root zone by scatterometer data assimilation) results from assimilating the SM‐OBS‐1 product distributed by the EUMETSAT CAF. Product SM‐OBS‐1 is based on the radar scatterometer ASCAT embarked on MetOp satellites. The instrument scans the scene in a push‐broom mode by six side‐looking antennas, three left‐hand, three right‐hand. On each side, the three antennas, looking aside, + 45 degrees and ‐ 45 degrees respectively, provide three views of each earth location under different viewing angles measuring three backscattering coefficients at slightly different time. Each antenna triplet provides a side swath of 550 km. The two swaths leave a gap (close to the sub‐satellite track) of ~ 670 km. Global coverage over Europe is achieved in ~ 1.5 days. The basic instrument sampling distance is 12.5 km. The primary ASCAT observation, sea‐surface wind, is processed at 50 km resolution. For soil moisture, processing is performed at 50 km (operational) and 25 km (research) resolution. Product User Manual ‐ PUM‐14 (Product H14 – SM‐DAS‐2) Doc.No: SAF/HSAF/PUM‐14 Issue/Revision Index: 1.1 Date: 31/05/2012 Page: 6/24 For the purpose of SM‐DAS‐2, the 25‐km resolution SM‐OBS‐1 product is assimilated in the ECMWF Land Data Assimilation System (LDAS), as shown in Figure 1. Figure 1 SM‐DAS‐2 production chain based on ASCAT surface soil moisture data assimilation in the ECMWF Land Data Assimilation System The advanced land surface data assimilation system is in continuous development at ECMWF to retrieve root zone soil moisture profile index from ASCAT surface soil moisture index (CAF product). The SM‐DAS‐2 product inherits from the previous volumetric product of the development phase, SM‐ASS‐1. In contrast to SM‐ASS‐1, SM‐DAS‐2 is produced by a specific production chain which is being developed by ECMWF for H‐ SAF. Its production is based on a Simplified Extended Kalman Filter (EKF). ECMWF generates SM‐DAS‐2 (Liquid Root zone soil moisture), thereafter ZAMG disseminates the products. In the soil moisture assimilation system, the surface observation from ASCAT is propagated towards the roots region down to 2.89 m below surface, providing estimates for 4 layers (thicknesses 0.07, 0.21, 0.72 and 1.89 m). The ECMWF model generates soil moisture profile information according to the Hydrology Tiled ECMWF Scheme for Surface Exchanges over Land (HTESSEL) (see Figure 2). Product User Manual ‐ PUM‐14 (Product H14 – SM‐DAS‐2) Doc.No: SAF/HSAF/PUM‐14 Issue/Revision Index: 1.1 Date: 31/05/2012 Page: 7/24 Figure 2 Hydrology Tiled ECMWF Scheme for Surface Exchanges over Land The assimilation scheme constrains the first guess forecast of soil moisture on any point of the Gaussian grid to be as close as possible to all observations. In the soil moisture assimilation system, the surface observation from ASCAT is propagated towards the roots region down to 2.89 m below surface, providing estimates for 4 layers (thicknesses 0.07, 0.21, 0.72 and 1.89 m). The Land Data Assimilation System generates soil moisture profile information according to the Hydrology Tiled ECMWF Scheme for Surface Exchanges over Land (HTESSEL). SM‐DAS‐2 is available at a 24‐hour time step, with a global daily coverage at 00:00 UTC. SM‐DAS‐1 is produced in a continuous way in order to ensure the time series consistency of the product (and also to provide values when there is no satellite data, from the model propagation). The SM‐DAS‐2 product is the first global product of consistent surface and root zone soil moisture available NRT for the NWP, climate and hydrological communities. 1.2.2 Status of satellites and instruments The EUMETSAT Global surface soil moisture product is generated from the MetOp ASCAT. The current status of the MetOp satellite is shown in Table 1 and ASCAT characteristics are shown in Table 2. Satellite MetOp‐A Launch 19 Oct 2006 End of service Height LST Status expected ≥ 817 km 09:30 d Operational 2011 Table 1 Current status of MetOP, as of January 2012 Instruments used in H‐SAF ASCAT Product User Manual ‐ PUM‐14 (Product H14 – SM‐DAS‐2) ASCAT Satellites Status Mission Instrument type Scanning technique Coverage/cycle Resolution Resources Doc.No: SAF/HSAF/PUM‐14 Issue/Revision Index: 1.1 Date: 31/05/2012 Page: 8/24 Advanced Scatterometer MetOp‐A, MetOp‐B, MetOp‐C Operational ‐ Utilised in the period: 2006 to ~ 2021 Sea surface wind vector. Also large‐scale soil moisture Radar scatterometer ‐ C‐band (5.255 GHz), side looking both left and right. 3 antennas on each side Two 550‐km swaths separated by a 700‐km gap along‐track. 3 looks each pixel (45, 90 and 135° azimuth) Global coverage in 1.5 days Best quality: 50 km – standard quality: 25 km – basic sampling: 12.5 km Mass: 260 kg ‐ Power: 215 W ‐ Data rate: 42 kbps Table 2 Main features of ASCAT 1.2.3 Highlights of the algorithm The baseline algorithm for SM‐ASS‐1 processing is described in ATBD‐14. Only essential elements are highlighted here. The liquid root zone soil moisture product to be generated at ECMWF (see flow chart in Figure 3) is the result of a data assimilation process. The input consists of the large‐scale global surface soil moisture product generated at EUMETSAT (‘observation’; Section 3 Product validation) and modelled root zone soil moisture (‘first guess’). The output from the land surface data assimilation is a statistically optimal product conditioned by the general characteristics of the ECMWF model. Product User Manual ‐ PUM‐14 (Product H14 – SM‐DAS‐2) Doc.No: SAF/HSAF/PUM‐14 Issue/Revision Index: 1.1 Date: 31/05/2012 Page: 9/24 Figure 3 Flow chart of the liquid root zone soil moisture OFF-LINE ERS-1/2 REAL-TIME ASCAT Pre-processing chain Surface soil moisture index Operational processing chain chain Surface soil moisture index Static bias correction CDF matching Daily surface soil moisture fields (grib) Adaptive bias correction (CDF based) BUFR Observation file Corrected soil moisture fields Daily modelled soil moisture fields (grib) observation errors Off-line SDAS / EKF Feedback files Modelled first guess (‘internal’ data) Corrected soil moisture fields Root zone soil moisture Operational IFS SDAS / EKF Liquid root zone soil moisture Product User Manual ‐ PUM‐14 (Product H14 – SM‐DAS‐2) Doc.No: SAF/HSAF/PUM‐14 Issue/Revision Index: 1.1 Date: 31/05/2012 Page: 10/24 To integrate the satellite based observations in the forecast system, ASCAT swath based data sets are archived in BUFR format. For developing the observation operators, daily composite soil moisture images were also archived in GRIB format. 1.2.4 Architecture of the products generation chain The architecture of the SM‐DAS‐2 product generation chain is shown in Figure 4. The figure includes mention of the primary source of satellite data, the Global surface soil moisture product generated by EUMETSAT and disseminated via EUMETCast. EUMETCast MetOp TO GLOB AL U SER S Leve l-0 Global surface soil moisture CDA & EARS EUM ETCa st rec eption EUM ETC ast EUMETSAT ECMWF Global surface soil moisture generated and distributed in NearReal-Time ZAMG SM-DAS-2 Liquid root zone soil moisture generated by assimilation of the Global surface soil moisture Figure 4 Conceptual architecture of SM‐DAS‐2 production chain The figure shows that ECMWF produces SM‐DAS‐2 that is addressed to ZAMG for further dissemination in the H‐SAF community. 2 Product operational characteristics 2.1 Horizontal resolution and sampling The horizontal resolution ( Δ x) . The effective resolution is driven by SM‐DAS‐2 production chain resolution which is ~ 25 km. For land surfaces processes are resolved on a discrete grid which determines the effective soil moisture product resolution. The discreet grid is a Gaussian reduced grid at T799. Conclusion: • horizontal resolution: Δx ~ 25 km. Product User Manual ‐ PUM‐14 (Product H14 – SM‐DAS‐2) Doc.No: SAF/HSAF/PUM‐14 Issue/Revision Index: 1.1 Date: 31/05/2012 Page: 11/24 The accuracy is completed by temporal correlation against ground measurements which validates the accuracy of the product in terms of temporal variability. SM‐DAS‐2 is evaluated a‐posteriori by means of the validation activity. See section 5 “Examples of SM‐DAS‐2 product”. 2.1.1 Vertical resolution if applicable The soil moisture profile is computed for four layers: surface to 7 cm, 7 cm to 28 cm, 28 cm to 100 cm, and 100 cm to 289 cm. 2.1.2 Observing cycle and time sampling The SM‐DAS‐2 product is produced daily at 00UTC, based on assimilation of the global CAF surface soil moisture index product (SM‐OBS‐1) in the ECMWF H‐TESSEL Land Surface Model. Although the ASCAT CAF product observing cycle over European latitudes is ~ 36 h, the assimilation process leading to the SM‐DAS‐2 product has its own time evolution. The product is outputted at 24‐hour intervals, thus: • observing cycle: Δt ~ 24 h 2.1.3 Timeliness For a continuous assimilation process it is difficult to identify the time lag between the observation and the product output. By considering the time needed by the model to “digest” soil moisture observation, the SM‐DAS‐2 timeliness will be: • timeliness δ ~ 36 h. Product User Manual ‐ PUM‐14 (Product H14 – SM‐DAS‐2) Doc.No: SAF/HSAF/PUM‐14 Issue/Revision Index: 1.1 Date: 31/05/2012 Page: 12/24 3 Product validation 3.1 Validation strategy SM‐DAS‐2 root zone soil moisture profile index is validated against ground soil moisture measurements from in situ data from 15 networks across four continents (see PVR). So, for the year 2010, in situ soil moisture from 295 stations was gathered, as follow : 93 within the HSAF area in Europe [23 in France (SMOSMANIA, SMOSMANIA‐E networks, Grand Morin), 21 in Spain (REMEDHUS), 9 in Germany (UDC‐SMOS network), 7 in Italy (UMSUOL, CDR‐Umbria, Perugia), 30 in Denmark (HOBE), 1 in Luxembourg (BIB), 1 in Finland (Maws / FMI) and 1 in Poland (SWEX POLAND)], 38 in Australia (OZNET network), 154 within the United States (NCRS‐SCAN network) and 10 in Western Africa (AMMA network) are available. Next figure shows the location of the soil moisture networks used to validate SM‐DAS‐2. Figure 5 Location of the different in situ soil moisture stations used to validate SM‐DAS‐2 SM‐DAS‐2 is an index between 0 and 1 while in situ measurements of soil moisture are in m 3m‐3. To enable a fair comparison the data were rescaled. The 90% confidence interval was chosen to define the upper and lower values to exclude any abnormal outliers due to instrument noise using the following equations: Int + (insitu ) = μ (insitu ) + 1.64σ (insitu ) Int − (insitu ) = μ (insitu ) − 1.64σ (insitu ) Where Int+ and Int‐ are the upper and lower 90% limits of the confidence interval. Then a new in situ soil moisture data set is obtained using: Product User Manual ‐ PUM‐14 (Product H14 – SM‐DAS‐2) SM = Doc.No: SAF/HSAF/PUM‐14 Issue/Revision Index: 1.1 Date: 31/05/2012 Page: 13/24 SM − Int − Int + − Int − It is assumed that SM‐DAS‐2 data set does not have such outliers problem and is rescaled using the maximum and the minimum values of each individual times series considering the whole 2010 period. The comparison between the observation data and the H14/SM‐DAS‐2 product uese the following statistical scores: mean bias, Standard Deviation (SD), Correlation Coefficient (CC) and Root Mean Square Difference (RMSD). In situ data contain errors (instrumental and representativeness), so they are not considered as ‘true’ soil moisture. This is underlined here by using the RMS Difference terminology instead of RMS Error. The correlation significance is ensured by retaining results only when the p‐value is lower than 0.05 (95% confidence interval). 3.2 Summary of results The statistical scores for the comparison between SM‐DAS‐2, and in situ SSM are presented in Table 3 for the whole 2010 period. Only the configurations associated to significant correlation values (p‐value < 0.05) are considered leading to 264 stations used (over 295 available). Considering the HSAF area, 89 stations over 93 available are used. On average, for all the stations, bias, SD, RMSD ([‐], [m3m‐3]) and CC are 0.049, 0.243, 0.263, 0.061 m3m‐3 and 0.70, respectively. For 9 networks over 15, CC is higher than 0.7 which is considered as a good level of correlation (Albergel et al., 2008, 2011). Excepted the AMMA network in western Africa, all networks present RMSD value in agreement with the threshold value defined in the PRD, also reported in Table 1 (0.1 m3m‐3), 10 over 15 are below the target value (0.06 m 3m‐3) and 2 are below the optimal value (0.04 m3m‐3). If on average a value of 0.061 is found, an in depth looks to Table 3 permits to see that the stations of the AMMA network increase this value. Considering only the stations within ‐3 the HSAF area, on average, for all the stations, bias, SD, RMSD ([‐], [m 3 m ]) and CC are ‐0.043, 0.246, 0.203, 0.047 m 3 m ‐3 and 0.71, respectively . The averaged RMSD value of 0.047 m3m‐3 is below the target value of 0.06 m3m‐3 and very close to the optimal value of 0.04 m3m‐3. Best CC values (0.88) are obtained with stations in France (Grand Morin), Luxembourg and western Africa. Lower level of CC are found in Poland and Finland (0.61 and 0.60, respectively), however, for those 2 stations, winter and late summer data are filtered due to temperature below +3°. On average, biases of ‐0.043 (in situ minus SSM products, dimensionless) are observed for Europe. Country France France France Spain Region (Network*) SMOSMANIA (12 stations) SMOSMANIA‐E (9 stations) Grand Morin (2 stations) REMEDHUS (18 stations) Product acronym Period Bias (‐) Standard deviation (‐) RMSD (‐)/[m3m‐3] CC H14 2010 ‐0.060 0.259 0.210 / 0.056 0.79 H14 2010 ‐0.093 0.295 0.232 / 0.071 0.76 H14 2010 ‐0.130 0.235 0.197 /0.053 0.88 H14 2010 0.021 0.313 0.218 / 0.048 0.74 Product User Manual ‐ PUM‐14 (Product H14 – SM‐DAS‐2) Country Italy Italy Italy Germany Denmark Finland Poland Luxembourg Australia USA Western Africa Region (Network*) UMSUOL (1 station) PERUGIA (1 station) Central Italy (5 stations) UDC SMOS (9 stations) HOBE (29 stations) Maws (1 station) SWEX‐Poland (1 station) BIB (1 station) OZNET (36 stations) NCRS‐SCAN (137 stations) AMMA (5 stations) Doc.No: SAF/HSAF/PUM‐14 Issue/Revision Index: 1.1 Date: 31/05/2012 Page: 14/24 Product acronym Period Bias (‐) Standard deviation (‐) RMSD (‐)/[m3m‐3] CC H14 2010 ‐0.150 0.233 0.247 / 0.046 0.76 H14 2010 ‐0.154 0.257 0.229 / 0.048 0.83 H14 2010 ‐0.179 0. 210 0.266 / 0.067 0.77 H14 2010 ‐0.095 0.167 0.275 / 0.053 0.55 H14 2010 ‐0.005 0.217 0.225 / 0.030 0.67 H14 2010 0.038 0.153 0.249 / 0.026 0.60 H14 2010 ‐0.026 0.187 0.240 / 0.076 0.61 H14 2010 ‐0.187 0.210 0.242 / 0.037 0.88 H14 2010 0.108 0.252 0.215 / 0.052 0.83 H14 2010 0.103 0.236 0.292 / 0.069 0.67 H14 2010 ‐0.368 0.362 0.481 / 0.340 0.88 EUROPE 89 H14 2010 ‐0.043 0.246 0.230 / 0.047 0.71 ALL 264 H14 2010 0.049 0.243 0.263 / 0.061 0.70 Table 3 Comparisons of normalised soil moisture between in situ observations and SM‐DAS‐2 for 2010 In the table above, mean bias (in situ minus products), correlation, standard deviation and root mean square difference (RMSD, [‐] and [m3m‐3]) are given for each network and for each product. Scores are presented for significant correlations with p‐values < 0.05. Product User Manual ‐ PUM‐14 (Product H14 – SM‐DAS‐2) Doc.No: SAF/HSAF/PUM‐14 Issue/Revision Index: 1.1 Date: 31/05/2012 Page: 15/24 4 Product availability 4.1 Site SM‐DAS‐2 (h14) is available on the CNMCA FTP site, whose URL is ftp://ftp.meteoam.it 4.1.1 Directory “products” The data are loaded in the directory: • products, for near‐real‐time dissemination and data holding for nominally 1‐2 months, often more. 4.1.2 Directory “from_archive” Older data are stored in the permanent H‐SAF archive, and can be recovered on request. Anyway, they also are held at ECMWF. The record starts from 1st January 2010. 4.1.3 Directory “utilities” 4.2 Formats and codes Tow type of files are provided for SM‐DAS‐2: • • the digital data, coded in GRIB1; the image‐like maps, coded in PNG. In the directory “utilities”, the folder Bufr_decode provides the instructions for reading the digital data. In addition, the output description of PR‐OBS‐2 is provided in Appendix. 4.3 Description of the files URL: ftp://ftp.meteoam.it Username/password: ask Help Desk directory: products h14_cur_mon_grb digital data of current months Product identifier: h14 Folders under h14 H14_cur_mon_png images of current months H14_yyyymmdd00.grib.gz digital data Files description of current month: H14_yyyymmdd00.png image data yyyymmdd: year, month, day L: Layer, 1 to 4 - 1: 0-7 cm; 2: 7-28 cm; 3: 28-100 cm; 4: 100-289 cm Product User Manual ‐ PUM‐14 (Product H14 – SM‐DAS‐2) i. Doc.No: SAF/HSAF/PUM‐14 Issue/Revision Index: 1.1 Date: 31/05/2012 Page: 16/24 SM‐DAS‐2 Output description The SM‐DAS‐2 product is provided in GRIB1 format, on a Gaussian grid at the resolution T799, corresponding to N400 (~25 km). There are several tools available to read grib files. Three applications and examples are provided to read grib files and extract data on specific location (e.g. on validation test sites). Use GRIB API We recommend to use the GRIB API software to read grib files. GRIB API can be downloaded from the ECMWF GRIB API web page. It needs to be used under Linux or UNIX systems. For example if your SM‐DAS‐2 grib file is named h14_2010122700.grib, the command to extract data from the four nearest grid points from latitude YLAT and longitude XLON is: - grib_ls ‐p step,shortName ‐l XLAT,XLON h14_2010122700.grib For any further question concerning this example or on how to read SM‐DAS‐2 using GRIB API, please contact [email protected] or [email protected]. Use Metview Metview is also recommended to be used to extract data from grib files, to plot and map data as well as to compute statistics. Metview can be downloaded and installed on Linux and Unix systems from the ECMWF Metview web page. For any further question concerning this example or on how to read or map SM‐ASS‐1 using Metview, please contact [email protected] or [email protected]. Using Matlab It is also possible to read GRIB files using Matlab, which can be used on Unix, Linux and Windows systems. Library can be downloaded from ftp://polar.ncep.noaa.gov/pub/ofs/reference/ (also available in read_grib_1.5.tar.gz) . In the framework of the H‐SAF Visiting Scientist programme, tool to read SM‐DAS‐2 with Matlab has been developped by Luca Brocca (Research Institute for Geo‐Hydrological Protection National Research Council, Iyaly). For any further question on how to read SM‐DAS‐1 using Matlab, please contact [email protected], or [email protected] or [email protected] Product User Manual ‐ PUM‐14 (Product H14 – SM‐DAS‐2) ii. Doc.No: SAF/HSAF/PUM‐14 Issue/Revision Index: 1.1 Date: 31/05/2012 Page: 17/24 Introduction to H‐SAF The EUMETSAT Satellite Application Facilities H‐SAF is part of the distributed application ground segment of the “European Organisation for the Exploitation of Meteorological Satellites (EUMETSAT)”. The application ground segment consists of a “Central Application Facility (CAF)” and a network of eight “Satellite Application Facilities (SAFs)” dedicated to development and operational activities to provide satellite‐derived data to support specific user communities. See next figure: Product User Manual ‐ PUM‐14 (Product H14 – SM‐DAS‐2) Doc.No: SAF/HSAF/PUM‐14 Issue/Revision Index: 1.1 Date: 31/05/2012 Page: 18/24 Next figure reminds the current composition of the EUMETSAT SAF network (in order of establishment). H‐SAF objectives and products The H‐SAF was established by the EUMETSAT Council on 3 July 2005; its Development Phase started on 1st September 2005 and ended on 31 August 2010. The SAF is now in its first Continuous Development and Operations Phase (CDOP) which started on 28 September 2010 and will end on 28 February 2012. The H‐SAF objectives are: a. to provide new satellite‐derived products from existing and future satellites with sufficient time and space resolution to satisfy the needs of operational hydrology; identified products: • • • precipitation; soil moisture; snow parameters; b. to perform independent validation of the usefulness of the new products for fighting against floods, landslides, avalanches, and evaluating water resources; the activity includes: • • downscaling/upscaling modelling from observed/predicted fields to basin level; fusion of satellite‐derived measurements with data from radar and raingauge networks; • • assimilation of satellite‐derived products in hydrological models; assessment of the impact of the new satellite‐derived products on hydrological applications. This document (the PUM, Product User Manual) is concerned only with the satellite‐derived products. The list of products to be generated by H‐SAF is shown in next table: Acronym Identifier Name PR‐OBS‐1 H‐01 Precipitation rate at ground by MW conical scanners (with indication of phase) PR‐OBS‐2 H‐02 Precipitation rate at ground by MW cross‐track scanners (with indication of phase) PR‐OBS‐3 H‐03 Precipitation rate at ground by GEO/IR supported by LEO/MW PR‐OBS‐4 H‐04 Precipitation rate at ground by LEO/MW supported by GEO/IR (with flag for phase) PR‐OBS‐5 H‐05 Accumulated precipitation at ground by blended MW and IR PR‐OBS‐6 H‐15 Blended SEVIRI Convection area/ LEO MW Convective Precipitation Product User Manual ‐ PUM‐14 (Product H14 – SM‐DAS‐2) Acronym Doc.No: SAF/HSAF/PUM‐14 Issue/Revision Index: 1.1 Date: 31/05/2012 Page: 19/24 Identifier Name PR‐ASS‐1 H‐06 Instantaneous and accumulated precipitation at ground computed by a NWP model SM‐OBS‐2 H‐08 Small‐scale surface soil moisture by radar scatterometer SM‐OBS‐3 H‐16 Large‐scale surface soil moisture by radar scatterometer SM‐DAS‐2 H‐14 Soil Moisture Profile Index in the roots region retrieved by scatterometer assimilation method SN‐OBS‐1 H‐10 Snow detection (snow mask) by VIS/IR radiometry SN‐OBS‐2 H‐11 Snow status (dry/wet) by MW radiometry SN‐OBS‐3 H‐12 Effective snow cover by VIS/IR radiometry SN‐OBS‐4 H‐13 Snow water equivalent by MW radiometry Table 4 H‐SAF Product List The work of precipitation products generation is shared in the H‐SAF Consortium as follows: • • Precipitation products (pre‐fix: PR) are generated in Italy by the CNMCA, in its premises at Pratica di Mare (Rome). CNMCA also manages the Central Archive and the Data service. • CNR develops and upgrades the algorithm. Product coverage Figure of this section shows the required geographic coverage for H‐SAF products. Figure 7 Required H‐SAF coverage: 25‐75°N lat, 25°W ‐ 45°E This area is fully covered by the Meteosat image (although the resolution sharply decreases at higher latitudes) each 15 min. For polar satellites, the area is covered by strips of swath approximately 1500 km (conical scanners) or 2200 km (cross‐track scanners) at about 100 min intervals. Swaths intercepting the Product User Manual ‐ PUM‐14 (Product H14 – SM‐DAS‐2) Doc.No: SAF/HSAF/PUM‐14 Issue/Revision Index: 1.1 Date: 31/05/2012 Page: 20/24 acquisition range of direct‐read‐out stations provide data in few minutes; for swaths outside the acquisition range the delay may be several tens of minutes if the satellite/instrument data are part of the EARS / EUMETCast broadcast , some hours otherwise (e.g., by ftp). The time resolution (observing cycle) is controlled by the number of satellites concurring to perform the observation, and the instrument swath. Data circulation and management Next figure shows the data circulation scheme in H‐SAF. All products from the generating centres are concentrated at CNMCA (except that certain can go directly to the user by dedicated links: example, GTS, Global Telecommunication System connecting operational meteorological services). From CNMCA the data are sent to EUMETSAT to be broadcast by EUMETCast in near‐real‐time. All data also go to the H‐SAF Archive where they can be accessed through the EUMETSAT Data Centre via a Client. Therefore, the H‐SAF products may be accessed: • • via EUMETCast in near‐real‐time (primary access mode); off‐line via the EUMETSAT Data Centre (most common access mode for the scientific community). It is noted that this scheme is valid only for operational products. For products in development disseminated to beta‐users only, or demonstrational products, the distribution ordinarily utilises the ftp servers of the product generation centres, or the CNMCA server. CNMCA also re‐disseminate the products generated in other centres, therefore all products can be retrieved from the CNMCA server. The ftp dissemination stream will continue to be active even after the EUMETCast dissemination becomes effective, both for redundancy purpose, and for users not equipped for EUMETCast reception. The H‐SAF web site The address of the H‐SAF web site is: http://hsaf.meteoam.it/. The web site provides: • • general public information on H‐SAF H‐SAF products description Product User Manual ‐ PUM‐14 (Product H14 – SM‐DAS‐2) Doc.No: SAF/HSAF/PUM‐14 Issue/Revision Index: 1.1 Date: 31/05/2012 Page: 21/24 • rolling information on the H‐SAF implementation status • an area for collecting/updating information on the status of satellites and instruments used in H‐SAF an area to collect Education and Training material an area for “forums” (on algorithms, on validation campaigns, etc.) indication of useful links (specifically with other SAF’s) an area for “Frequently Asked Questions” (FAQ) to alleviate the load on the Help desk. • • • • The web site supports operations by providing: • • daily schedule of H‐SAF product distribution administrative messages on changes of product version (new algorithms, etc.). The web site contains some basic H‐SAF documents (the ATDD, Algorithms Theoretical Definition Document; this Product User Manual, …). However, most working documents (REP‐3: Report of the Products Validation Programme; REP‐4: Report of the Hydrological Validation Programme; etc.), programmatic documents (PP: Project Plan; URD: User Requirements Documents; etc.) and engineering documents are to be found in the CNMCA ftp server (restricted access; see later for the URL). The User Support For any question that cannot be solved by consulting the web site, users have two different possibilities: - To send an email through the “Contact Us” functionality of the web‐site, in charge of forwarding the request to an help desk. This functionality is also available to unregistered users ; - To compose a specific question/request to the help‐desk available only to registered users; in this case, the user should specify in the “Subject” one of the following codes: MAN PRE SMO SNO HYD ARC GEN (management) (precipitation) (soil moisture) (snow) (hydrology) (archive) (general). Condition for use of H‐SAF products All H‐SAF products are owned by EUMETSAT, and the EUMETSAT SAF Data Policy applies. They are available for all users free of charge. Users should recognise the respective roles of EUMETSAT, the H‐SAF Leading Entity and the H‐SAF Consortium when publishing results that are based on H‐SAF products. EUMETSAT’s ownership of and intellectual property rights into the SAF data and products is best safeguarded by simply displaying the words “© EUMETSAT” under each of the SAF data and products shown in a publication or website. iii. Acronyms AMSU AMSU‐A AMSU‐B ATDD AU Advanced Microwave Sounding Unit (on NOAA and MetOp) Advanced Microwave Sounding Unit ‐ A (on NOAA and MetOp) Advanced Microwave Sounding Unit ‐ B (on NOAA up to 17) Algorithms Theoretical Definition Document Anadolu University (in Turkey) Product User Manual ‐ PUM‐14 (Product H14 – SM‐DAS‐2) BfG CAF CDOP CESBIO CM‐SAF CNMCA CNR CNRS DMSP DPC EARS ECMWF EDC EUM EUMETCast EUMETSAT FMI FTP GEO GRAS‐SAF HDF HRV H‐SAF IDL© IFOV IMWM IPF IPWG IR IRM ISAC ITU LATMOS LEO LSA‐SAF LST Météo France METU MHS MSG MVIRI MW NEΔT NESDIS NMA NOAA NWC‐SAF NWP NWP‐SAF O3M‐SAF OMSZ ORR OSI‐SAF PDF PEHRPP Pixel PMW PP Doc.No: SAF/HSAF/PUM‐14 Issue/Revision Index: 1.1 Date: 31/05/2012 Page: 22/24 Bundesanstalt für Gewässerkunde (in Germany) Central Application Facility (of EUMETSAT) Continuous Development‐Operations Phase Centre d'Etudes Spatiales de la BIOsphere (of CNRS, in France) SAF on Climate Monitoring Centro Nazionale di Meteorologia e Climatologia Aeronautica (in Italy) Consiglio Nazionale delle Ricerche (of Italy) Centre Nationale de la Recherche Scientifique (of France) Defense Meteorological Satellite Program Dipartimento Protezione Civile (of Italy) EUMETSAT Advanced Retransmission Service European Centre for Medium‐range Weather Forecasts EUMETSAT Data Centre, previously known as U‐MARF Short for EUMETSAT EUMETSAT’s Broadcast System for Environmental Data European Organisation for the Exploitation of Meteorological Satellites Finnish Meteorological Institute File Transfer Protocol Geostationary Earth Orbit SAF on GRAS Meteorology Hierarchical Data Format High Resolution Visible (one SEVIRI channel) SAF on Support to Operational Hydrology and Water Management Interactive Data Language Instantaneous Field Of View Institute of Meteorology and Water Management (in Poland) Institut für Photogrammetrie und Fernerkundung (of TU‐Wien, in Austria) International Precipitation Working Group Infra Red Institut Royal Météorologique (of Belgium) (alternative of RMI) Istituto di Scienze dell’Atmosfera e del Clima (of CNR, Italy) İstanbul Technical University (in Turkey) Laboratoire Atmosphères, Milieux, Observations Spatiales (of CNRS, in France) Low Earth Orbit SAF on Land Surface Analysis Local Satellite Time (if referred to time) or Land Surface Temperature (if referred to temperature) National Meteorological Service of France Middle East Technical University (in Turkey) Microwave Humidity Sounder (on NOAA 18 and 19, and on MetOp) Meteosat Second Generation (Meteosat 8, 9, 10, 11) Meteosat Visible and Infra Red Imager (on Meteosat up to 7) Micro Wave Net Radiation National Environmental Satellite, Data and Information Services National Meteorological Administration (of Romania) National Oceanic and Atmospheric Administration (Agency and satellite) SAF in support to Nowcasting & Very Short Range Forecasting Numerical Weather Prediction SAF on Numerical Weather Prediction SAF on Ozone and Atmospheric Chemistry Monitoring Hungarian Meteorological Service Operations Readiness Review SAF on Ocean and Sea Ice Probability Density Function Pilot Evaluation of High Resolution Precipitation Products Picture element Passive Micro‐Wave Project Plan Product User Manual ‐ PUM‐14 (Product H14 – SM‐DAS‐2) PR PUM PVR RMI RR RU SAF SEVIRI SHMÚ SSM/I SSMIS SYKE TBB TKK TMI TRMM TSMS TU‐Wien U‐MARF UniFe URD UTC VIS ZAMG Doc.No: SAF/HSAF/PUM‐14 Issue/Revision Index: 1.1 Date: 31/05/2012 Page: 23/23 Precipitation Radar (on TRMM) Product User Manual Product Validation Report Royal Meteorological Institute (of Belgium) (alternative of IRM) Rain Rate Rapid Update Satellite Application Facility Spinning Enhanced Visible and Infra‐Red Imager (on Meteosat from 8 onwards) Slovak Hydro‐Meteorological Institute Special Sensor Microwave / Imager (on DMSP up to F‐15) Special Sensor Microwave Imager/Sounder (on DMSP starting with S‐16) Suomen ympäristökeskus (Finnish Environment Institute) Equivalent Blackbody Temperature (used for IR) Teknillinen korkeakoulu (Helsinki University of Technology) TRMM Microwave Imager (on TRMM) Tropical Rainfall Measuring Mission UKMO Turkish State Meteorological Service Technische Universität Wien (in Austria) Unified Meteorological Archive and Retrieval Facility University of Ferrara (in Italy) User Requirements Document Universal Coordinated Time Visible Zentralanstalt für Meteorologie und Geodynamik (of Austria)