1
DAta Mining & Exploration
Program
Self Organizing Map
&
2-stage Clustering
User Manual
DAME-MAN-NA-0020
Issue: 1.2
Author: M. Brescia, F. Esposito
Doc. : SOM2stageClustering_UserManual_DAME-MAN-NA-0020-Rel1.22
1
DAMEWARE SOM+2stage Clustering Model User Manual
This document contains proprietary information of DAME project Board. All Rights Reserved.
DAta Mining & Exploration
Program
Index
1
2
Introduction ................................................................................................................................................ 4
SOM and 2-Stage clustering theoretical overview ..................................................................................... 5
2.1 The model SOM .................................................................................................................................. 6
2.1.1
SOM output grid visualization (U-matrix) .................................................................................. 8
2.2 2-stage clustering (SOM post-processing) .......................................................................................... 8
2.2.1
Post-SOM with K-Means............................................................................................................. 9
2.2.2
Post-SOM with Umat-CC .......................................................................................................... 10
2.2.3
Post-SOM with TWL ................................................................................................................. 12
2.3 SOM quality indicators ..................................................................................................................... 14
2.3.1
Quantization error ...................................................................................................................... 14
2.3.2
SOM Topographic error............................................................................................................. 14
2.4 Clustering quality indicator ............................................................................................................... 15
3 Use of the SOM and 2-stage Clustering models ...................................................................................... 16
3.1 Input .................................................................................................................................................. 16
3.2 Output ............................................................................................................................................... 17
3.3 Experiment parameter setup.............................................................................................................. 18
4 Examples .................................................................................................................................................. 19
4.1 First Example: Iris dataset................................................................................................................. 19
4.1.1
Train Use Case ........................................................................................................................... 19
4.1.2
Test Use Case ............................................................................................................................ 21
4.2 Second Example: choice of second stage.......................................................................................... 22
5 Appendix – References and Acronyms .................................................................................................... 24
TABLE INDEX
Table 1 – Output file list .................................................................................................................................. 17
Table 2 – List of model parameter setup web help pages available ................................................................ 18
Table 3 – Abbreviations and acronyms ........................................................................................................... 24
Table 4 – Reference Documents ...................................................................................................................... 25
Table 5 – Applicable Documents ..................................................................................................................... 26
2
DAMEWARE SOM+2stage Clustering Model User Manual
This document contains proprietary information of DAME project Board. All Rights Reserved.
DAta Mining & Exploration
Program
FIGURE INDEX
Figure 1 - Flow chart of a generic unsupervised neural network ..................................................................... 5
Figure 2 – Self Organizing Map architecture ................................................................................................... 6
Figure 3 – Activation rule of a node with the “Mexican Hat” function............................................................ 7
Figure 4 - Learning diagram with vectors (X input, K1 and K2 neurons) ......................................................... 7
Figure 5 – Examples of U-Matrix...................................................................................................................... 8
Figure 6 – 2-Stage Clustering (general diagram) ............................................................................................. 9
Figure 7 – K-Means algorithm .......................................................................................................................... 9
Figure 8 – 2-Stage Clustering (SOM + K-Means) .......................................................................................... 10
Figure 9 – On the left the standard U-Matrix and on the right the nodes connected by Umat-CC ................ 10
Figure 10 – 2-Stage Clustering (Som + Umat-CC) ........................................................................................ 11
Figure 11 – Use of blurring level. An excessive blurring may produce mistakes as shown on the left. ......... 11
Figure 12 – External node (on red) on U-Matrix ............................................................................................ 12
Figure 13 – External nodes on the U-Matrix identifying low density areas of data space ............................. 12
Figure 14 – External node as outliers identifier ............................................................................................. 13
Figure 15 – External nodes as clusters dividers ............................................................................................. 13
Figure 16 – Example of external node to individuate separation zone and/or outliers .................................. 13
Figure 17 – The starting point, with a Workspace (somExp) created and input dataset uploaded ................ 19
Figure 18 – Selection of functionality and use case ........................................................................................ 19
Figure 19 – The SomKmeansIris experiment configuration tab ..................................................................... 20
Figure 20 – Experiment finished message ....................................................................................................... 20
Figure 21 – List of output file produced .......................................................................................................... 21
Figure 22 – Moving configuration file in the Workspace and uploading of target clusters file ..................... 21
Figure 23 – The SomKmeansIris test configuration tab.................................................................................. 22
Figure 24 – Automatic post-processing functionaliy....................................................................................... 22
Figure 25 – Behavior of the automatic post-processing ................................................................................. 22
Figure 26 – SOM single stage functionality .................................................................................................... 23
Figure 27 – Clustering_SOM_Kmeans in Run use case ................................................................................. 23
3
DAMEWARE SOM+2stage Clustering Model User Manual
This document contains proprietary information of DAME project Board. All Rights Reserved.
DAta Mining & Exploration
Program
1 Introduction
T
he present document is the user guide of the data mining model Self Organizing Maps (SOM) and
other post-SOM clustering models (hereinafter 2-Stage clustering), as implemented and integrated
into the DAMEWARE web application. It is a suite of hierarchical models that can be used to execute
scientific experiments for clustering on massive data sets, formatted in one of the supported types: ASCII
(columns separated by spaces), CSV (comma separated values), FITS-Table (numerical columns embedded
into the fits file), VOTable, GIF, JPG and FITS-Image.
This manual is one of the specific guides (one for each data mining model available in the webapp) having
the main scope to help user to understand theoretical aspects of the model, to make decisions about its
practical use in problem solving cases and to use it to perform experiments through the webapp, by also
being able to select the right functionality associated to the model, based upon the specific problem and
related data to be explored, to select the use cases, to configure internal parameters, to launch experiments
and to evaluate results.
The documentation package consists also of a general reference manual on the webapp (useful also to
understand what we intend for association between functionality and data mining model) and a GUI
user guide, providing detailed description on how to use all GUI features and options.
So far, we strongly suggest to read these two manuals and to take a little bit of practical experience
with the webapp interface before to explore specific model features, by reading this and the other
model guides.
All the cited documentation package is available from the address
http://dame.dsf.unina.it/beta_info.html, where there is also the direct gateway to the webapp.
As general suggestion, the only effort required to the end user is to have a bit of faith in Artificial
Intelligence and a little amount of patience to learn basic principles of its models and strategies.
By merging for fun two famous commercial taglines we say: “Think different, Just do it!”
(casually this is an example of data (text) mining...!)
4
DAMEWARE SOM+2stage Clustering Model User Manual
This document contains proprietary information of DAME project Board. All Rights Reserved.
DAta Mining & Exploration
Program
2 SOM and 2-Stage clustering theoretical overview
The goal of this guide is to show the use of the following data mining tools, available through DAMEWARE
web application:
•
•
unsupervised model for clustering/dimensional reduction: Self Organizing Maps (SOM);
a library of clustering model to be used as refining (post-processing) of SOM;
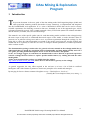
Figure 1 - Flow chart of a generic unsupervised neural network
The theory of neural network is based on computational models, introduced in 40s by McCulloch & Pitts
(1943), which reproduced in a simplified way the behaviour of a biological neuron. The neural networks are
self-adaptive computational models, based on the concept of learning from examples (supervised) or selforganizing (unsupervised).
The self-organizing neural networks are suitable for the solution of different problems compared to networks
with supervised training. The main use of these networks is precisely the data analysis in order to found
groups having similarities (pre-processing and data clustering) or form classification (recognition of images
or signals).
The supervised learning consists in the training of a network by input/target pairs that, obviously, are knows
solutions of optimization problems in specific points of data space (parameters space) of problem itself
(classification, approximation or functions regression). Sometimes there is not the possibility to have data
relative to solution of problems but data to analyse without specific information on them (unsupervised
training). A typical problem of such type is the research of class or groups of data with similar features
within an unordered group of data (clustering).
5
DAMEWARE SOM+2stage Clustering Model User Manual
This document contains proprietary information of DAME project Board. All Rights Reserved.
DAta Mining & Exploration
Program
2.1 The model SOM
The most well-known self-organizing neural network model take its name from the author: Kohonen (2001).
It is composed of a two layers network one of which is the input layer while the other is the output layer. The
neurons of the two layers are completely connected to each other, while the neurons of output layer are
connected, each one of them, with a “neighborhood” of neurons. The connection weights in the output layer,
or Kohonen layer as it is commonly called, are not subject to training, but they are constant and positive in
the neighborhood of each neuron.
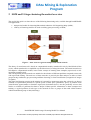
Figure 2 – Self Organizing Map architecture
Only one neuron of the output layer must be winner for each one of pattern given as input to the network.
This neuron identify a class to which the input belongs. Each neuron of the Kohonen layer receives a
stimulus equal to sum of input multiplied by the respective synaptic weight:
,
∗
(1)
The neuron of output layer with the greatest activation value is chosen as winner and assumes value 1 while
all the other assumes the value 0, following the classic WTA rule (Winner Takes All). Generally, a softer
version of this rule is used: the WTM (Winner Takes Most). Applying this rule, we can consider the output
layer nodes connected following a lateral inhibition system called “Mexican Hat”. The Mexican Hat link,
leads to the creation of activity bubbles, which identify similar input. The goal of a Kohonen network is to
have near winning neuron for similar input, so that every activation bubble represents a class of input with
similar features.
The behaviour just described is reached after the presentation of many input pattern to the network for a
number of times, modifying, at each input presentation, only the weights which connect the winner neuron
(in the output layer) with the neurons of input layer. This according to the following equation:
,
∗
,
(2)
where:
, ,
! " # $%& '""
,
%" (*"$% ( "*
,
&" * #* ", * #"+0,1.
,
" # '$* $$)%( ! $
"" ( )
"* $)"
6
DAMEWARE SOM+2stage Clustering Model User Manual
This document contains proprietary information of DAME project Board. All Rights Reserved.
DAta Mining & Exploration
Program
Practically, the weights to update at each input presentation are as many as input neurons. In several cases,
are updated, with the same criterion, using decreasing values of η (learning decay), also the weights of
neurons within an appropriate neighborhood (dimensionally comparable with the positive part of Mexican
Hat).
Figure 3 – Activation rule of a node with the “Mexican Hat” function
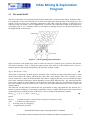
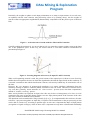
Carefully reading the equation (2), we can see that its role is to rotate the synaptic weights vector to the input
one, in the parameters space. In this way, the winner neuron is even more trained to identification of
presented input Figure 4.
Figure 4 - Learning diagram with vectors (X input, K1 and K2 neurons)
When a self-organizing network is used, the grid of neurons of the output layers is shown as a set of activity
bubbles that correspond to the class in which the algorithm has divided the input, based on their similarity. If
a network is trained on data which classification is known, each activity bubble may be associated to one of
the class.
However, the very attractive of unsupervised paradigms is to extract similarity information from the
manifold, working on Massive Datasets (MDS), measured in the real world. This kind of network shows
very well how generally, neural networks are “data intensive” process (more data than computations)
instead of “number crunching” process.
More activity bubbles can represent an input class: this may be due to heterogeneity of a class or to his
extension in the space of possible shapes (in this case two input pattern placed in the extremes of the class
may led to creation of different activity bubble).
The input data can be normalized in a range (usually [0,1] or [-1,1] as implemented in this software). In order
to do this, a pre-processing phase on input data, is required. The normalization or the pre-processing of data
can be done in various way, according to problem type: in such case is important the shape of input pattern
(recognition of signal or images), while in other cases is important to keep intact a dimensional relationship
7
DAMEWARE SOM+2stage Clustering Model User Manual
This document contains proprietary information of DAME project Board. All Rights Reserved.
DAta Mining & Exploration
Program
between input pattern (to distinguish the point defined by coordinates x / y within an area). The weights
vector are generated always in the range [-1,1].
2.1.1
SOM output grid visualization (U-matrix)
The U-Matrix (Unified Distance Matrix) is the standard for the evaluation and interpretation of a SOM.
During the training of the network the weights vectors of neurons are computed in such a way that elements
near on the map will be near also in the weights space. In this way, the Kohonen layer can represents multidimensional data on a map of two or three dimensions, preserving the topology.
Let it be:
, "(*$ $ /
00 , " $% $)" ) !" $ $ "/
, " # 1"! $*$% "(*$ ‖
, / ‖,"(!& )" )
!"'" "" " #
34 5647 ,
1 &(" $! ") $ "(*$ 1"! $* $% "(*$ )/
According to the following equation, a value will be assigned to each node of Kohonen layer:
34
5647
∑9∈;;
‖
,
/ ‖
(3)
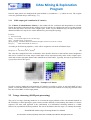
The value thus computed becomes an identifier of the distance between a node and his nearest neighbours
and can be visualized on a heat map in which light colours represents nearby nodes in the weights space,
while dark colours represents distant nodes (Moutarde & Ultsch 2005). Typically, the map is represented on
a greyscale as shown in Figure 5.
Figure 5 – Examples of U-Matrix
In order to increase further the interpretability of U-Matrix is possible to overlay to each node BMU of some
pattern, a colour that identify the relative cluster. Obviously, the nodes without an overlaying coloured round
have never been BMU of some input pattern.
2.2 2-stage clustering (SOM post-processing)
The goal of a 2-stage clustering method is to overcome the major problems of the conventional methods as
the sensibility to initial prototypes (proto-cluster) and the difficulty of determining the number of clusters
expected. The most used approach is the combination of a hierarchical clustering method or a SOM,
followed by a partitional clustering method. The aim of the SOM at the first stage is to identify the number
8
DAMEWARE SOM+2stage Clustering Model User Manual
This document contains proprietary information of DAME project Board. All Rights Reserved.
DAta Mining & Exploration
Program
of clusters and relative centroids, overcame, the problems described above. In the second stage, a partitional
clustering method will assign each pattern to the definitive cluster. (Chi & Yang 2008).
Alternatively is possible to use the SOM to map the input data onto Kohonen layer, which nodes will be used
in next clustering stage, which could be a SOM again, a hierarchical or partitional method.
The main advantage of the second described approach is to make a clustering of nodes (proto-cluster) of
Kohonen layer, which are generally less than input pattern. Therefore, this method led to an advantage from
the computational point of view. However, in this case, the choice of a number of expected clusters may be
required (partitional clustering).
Figure 6 – 2-Stage Clustering (general diagram)
From the above it is evident a well-known dichotomy of approach that distinguishes hierarchical and
partitional clustering. In both cases, it is always necessary to distinguish between the different types of
metrics used.
There are three post-processing methods actually implemented. The first one is the classic K-Means
algorithm (Hartigan & Wong 1979), which belongs to class of partitional clustering methods. The second is
the U-Matrix with connected components (Umat-CC; Hamel & Brown 2011), a hierarchical algorithm with
bottom-up approach. The third one is a model created by DAME group, inspirited by an agglomerative
method based on dynamics SOM, hereinafter defined as Two Winners Linkage (TWL).
2.2.1
Post-SOM with K-Means
The K-Means is the classic example of partitional clustering.
Figure 7 – K-Means algorithm
In order to exclude completely the pattern from analysis carried out in this phase, the initial cluster centres
are not selected based on the distribution of points in the dataset, but between the BMU calculated by the
SOM. This type of approach allows reducing the sensitivity to noise, because the BMU are local averages of
the data and therefore less sensitive to their variations. Even the outliers are not a problem because, by
definition, represents only a small percentage of the number of data and are unable to influence the process.
However, if our aim was to find outliers, then the use of this approach would be counterproductive.
9
DAMEWARE SOM+2stage Clustering Model User Manual
This document contains proprietary information of DAME project Board. All Rights Reserved.
DAta Mining & Exploration
Program
Figure 8 – 2-Stage Clustering (SOM + K-Means)
As already said, the subdivision into partitions occurs between BMU nodes of Kohonen layer. In order to
execute this process, it is therefore necessary to identify a number of clusters minor than the expected
number of BMU identified by the SOM.
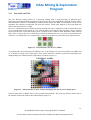
2.2.2
Post-SOM with Umat-CC
In massive multi-dimensional dataset, the visualization of clusters on U-Matrix can be difficult. Hamel and
Brown (2011) propose a method to improve the interpretability of Kohonen map, imagining the nodes as the
vertices of a graph in which the connected components (CC) identify the clusters. The procedure to identify
CC is based on concept that, for each one of them, will be exists a node, defined CC internal node, which
gradient will be minor then all other nodes in the same CC. The gradient of a node is computed as output of
equation (3).
For each node on the map, the gradients of adjacent nodes will be evaluated. If the gradient of the examined
node is not the minimum, then will exits a path along the node with minimum gradient, which connects the
nodes of a CC. The procedure stops on an internal node and the next node will be examined. Showing on the
top of U-Matrix the CC thus created, the membership of a node to a specific cluster becomes evident, as can
be seen in the example proposed by authors in Figure 9.
Figure 9 – On the left the standard U-Matrix and on the right the nodes connected by Umat-CC
The visualization method proposed by Hamel & Brown (2001) was not implemented because the method the
method proposed by us was considered more effective.
10
DAMEWARE SOM+2stage Clustering Model User Manual
This document contains proprietary information of DAME project Board. All Rights Reserved.
DAta Mining & Exploration
Program
Figure 10 – 2-Stage Clustering (Som + Umat-CC)
Experimentally, the authors observed that the use of a technique capable of eliminating unnecessary
fragmentation of the U-Matrix and making it more homogeneous, improves the results obtained in the search
of the CC. This effect is obtainable through the application to the map, of a blur filter commonly used in
different graphics software. The basic idea of this filter is that each pixel becomes a weighted average of the
pixels around it. The weight of each pixel is greater in proportion to the proximity to the pixel that is
currently blurring. The Gaussian equation used for the calculation of the weights is the following:
< ,
‖CDE‖
=
B
" AFA >?@ A
(4)
where:
,!(**" '&(*") "&
, "&$%
! " *"!$/ ( # " # ‖
‖,"(!& )" )
!"$ "#* )'" "" "(*$ )
G, ) $%# (
%( ! $ ! )"% " "'&(* #&"1"&
The application of this function, to all the pixels surrounding the pixel considered for the blur, will provide a
matrix of weights. The size of this matrix will depend on the number of pixels considered neighbours of the
current node. This parameter, known as kernel, can be the whole image or have a smaller radius. The new
value of the currently analysed pixel will be the sum of the values of the pixels included in the blur radius,
multiplied by the respective weight.
Note that the results obtained with the Umat-CC method may vary, in some details, according to the blurring
level applied (parameter σ of the equation (4)). There is not a rule for the calculation of this parameter,
because it depends on the characteristics of the specific experiment configured. Therefore, it will have to be
manually set if the result obtained is not considered satisfactory.
This adjustment procedure can be done looking the U-Matrix, which will be shown in output without
applying the filter. In this way, when the user find possible errors, will repeat the post-processing setting a
blur level lower or higher depending on the case.
Figure 11 – Use of blurring level. An excessive blurring may produce mistakes as shown on the left.
11
DAMEWARE SOM+2stage Clustering Model User Manual
This document contains proprietary information of DAME project Board. All Rights Reserved.
DAta Mining & Exploration
Program
2.2.3
Post-SOM with TWL
The Two Winners Linkage (TWL) is a clustering method, used as post-processing of Kohonen layer,
inspired by the neighbourhood computation technic used in Evolving SOM model (Deng & Kasabov 2003).
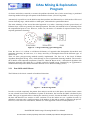
This mechanism consists of establishing a connection between the two BMU of each pattern. At the end of
algorithm, the connected components will show the clusters. Unlike what happens in Evolving SOM, the
connections does not have a weight.
However, a mechanism to prevent the connection of nodes far away is required. In order to obtain this result,
we can use the dual of the concept of a CC internal node, seen in the previous paragraph. The CC internal
node was defined as a node that results to have a gradient on the U-Matrix minor than all the other adjacent
nodes. This occurs in the case in which the previously mentioned nodes are very close to the internal node.
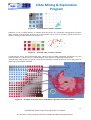
Therefore, we could define a CC external node, a node whose gradient is greater than all its adjacent nodes.
Figure 12 – External node (on red) on U-Matrix
An external node can be interpreted in different ways. In the simplest case, the external node is not BMU and
so, it identify an empty area of data space. These nodes make the U-Matrix a powerful visualization tool,
distinguishing areas characterised by high density of pattern (Figure 13).
EXTERNAL NODES
Figure 13 – External nodes on the U-Matrix identifying low density areas of data space
If the external node is a BMU, there are two possible interpretations. The node may identify outliers and so
the isolation of the node leads to their individuation (Figure 14).
12
DAMEWARE SOM+2stage Clustering Model User Manual
This document contains proprietary information of DAME project Board. All Rights Reserved.
DAta Mining & Exploration
Program
Figure 14 – External node as outliers identifier
Otherwise, in very complex dataset, an external node may derive by a particular configuration of pattern.
When clusters are note clearly divisible, the external nodes can be seen as “dividers” placed between two
clusters, making possible their division (Figure 15).
Figure 15 – External nodes as clusters dividers
Considering the above, the Gaussian Blur filter, shown in the preceding paragraph, should take very low
values in order to avoid the excessive standardization of the map, not recognizing external nodes.
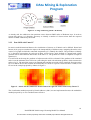
The following image (Figure 16) shows clearly the role that these external nodes may have in the process of
clustering by the method explained.
Figure 16 – Example of external node to individuate separation zone and/or outliers
13
DAMEWARE SOM+2stage Clustering Model User Manual
This document contains proprietary information of DAME project Board. All Rights Reserved.
DAta Mining & Exploration
Program
2.3 SOM quality indicators
To evaluate the quality of a SOM obtained as first stage of a clustering process, we can use criteria suggested
by Kiviluoto (1996):
i.
ii.
What is the degree of continuity for the map topology?
What is the resolution of the map topology?
A quantification of these two properties can be obtained by computation of quantization error and
topographic error (Chi & Yang 2008).
2.3.1
Quantization error
The quantization error is used to the computation of similarity of pattern assigned to the same BMU,
according to the following formula:
HI
= ;
∑ ‖NNNNNNNNNNNNO
JKLM
; 5P=
NNNO‖
M
(5)
where:
NNNNNNNNNNNNO,
" # 1"! $*$%QR3
JKLM
0,
(/'"*$%
"* $%)
"
NNNO,M
( 1"! $* # ") $!(**" QR3
The equation (5) corresponds to the average of distance of each pattern form its BMU.
2.3.2
SOM Topographic error
The topographic error is used to the computation of dissimilarity of pattern assigned to different BMU,
according to the following formula:
SI
= ;
∑ (
; 5
NNNNOM
(6)
where:
0, (/'"*$%
"* $%)
"
1,iffirstandsecondBMUofpatterniaredadiacentonmap
u xNNNOV
W
0, otherwise
14
DAMEWARE SOM+2stage Clustering Model User Manual
This document contains proprietary information of DAME project Board. All Rights Reserved.
DAta Mining & Exploration
Program
2.4 Clustering quality indicator
The results of the second stage of clustering process can be evaluated using the Davies-Bouldin (DB) index.
This index measures the ratio of intra-cluster and extra-cluster distances, measured from centroids (Davies &
Bouldin, 1979).
The internal scatter of a cluster Ci can be written as:
5,j
=
∑qr Cm|NNNOM
|lC | NNNO∈l
nO|j o=/j ,
1…t
(7)
where |u5 | is the number of pattern assigned to cluster i; xi and z are respectively a pattern of cluster i and his
centroid; q is an absolute value; K is total number of clusters.
The distance between two clusters can be written as:
)5
,7
vnNNOM
nNNOv
w 7
x∑z
yP=vny5
7 =/7
ny v {
(8)
where zi e zj represent respectively centroids of clusters i and j; zsi e zsj denotes the absolute value of the
difference between vectors zi and zj computed on dimension s; D is the total number of pattern; t is an
absolute value. So the DB index can be written as:
|Q
• ••
= „
∑ max , ~5 W C,€ E,€ ƒ
} 5P=
CE,‚
(9)
Low values of this index indicate a better clustering. However, note that on non-linearly divisible dataset
could not be objective.
A more objective evaluation can be obtained if the cluster of each input data is known. In such case is
possible to computes the Index of Clustering Accuracy (ICA) and the Index of Clustering Completeness
(ICC).
Let it be:
0u7 , (/'"*$% " $*" ! &!&( "*
0u… , (/'"*$%!&( "* %$( )
0u , (/'"*$%) $ !&( "*
Two theoretical clusters are disjoint if the intersection of the label assigned by clustering process in the two
clusters is the empty set.
†u
|;l‡ B;l‚ |
†uu
1
(10)
;l‡ •;l‚
;lˆ
;l‚
(11)
Low values of these indices reflects best results.
15
DAMEWARE SOM+2stage Clustering Model User Manual
This document contains proprietary information of DAME project Board. All Rights Reserved.
DAta Mining & Exploration
Program
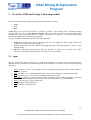
3 Use of the SOM and 2-stage Clustering models
For the user the SOM and 2-stage clustering systems offer three use cases:
•
•
•
Train
Test
Run
Additionally to use cases just described, is possible to perform a Train starting form a previously trained
network. This use case is called Resume Training. Note that, if the network is too much trained (final
learning rate is greater than initial one), the software will perform a tuning phase in which only the winning
node will be update after each pattern presentation.
A typical complete experiment consists of the following steps:
1. Train the network with a dataset as input; then store as output the final weight matrix (best
configuration of trained network weights);
2. Test the trained network with a dataset containing both input and target features, in order to verify
training quality;
3. Run the trained and tested network with new datasets. The Run use case implies the simple
execution of the trained and tested model, like a generic static function.
3.1 Input
We also remark that massive datasets to be used in the various use cases are (and sometimes must be)
different in terms of internal file content representation. Remind that it is possible to use one of the following
data types:
•
•
•
•
•
•
•
ASCII (extension .dat or .txt): simple text file containing rows (patterns) and columns (features)
separated by spaces;
CSV (extension .csv): Comma Separated Values files, where columns are separated by commas;
FITS (extension .fits or .fit): fits files containing images and/or tables;
VOTABLE (extension .votable): formatted files containing special fields separated by keywords
coming from XML language, with more special keywords defined by VO data standards;
JPEG (extension .jpg or .jpeg): image files;
PNG (extension .png): image files;
GIF (extension .gif): image files;
16
DAMEWARE SOM+2stage Clustering Model User Manual
This document contains proprietary information of DAME project Board. All Rights Reserved.
DAta Mining & Exploration
Program
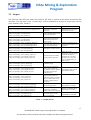
3.2 Output
The following table shows the output file produced. The table is valid for all the models described in this
document, so in the name of file, <second stage> will be substituted by the type of second stage selected
(Auto, Kmeans, TWL, UmatCC).
FILE
SOM_<second stage>_Train_Network_Configuration.txt
SOM_<second stage>_Train_Status.log
SOM_<second stage>_Test_Status.log
SOM_<second stage>_Run_Status.log
DESCRIPTION
File containing the
parameters of a trained
network.
REMARKS
Must be moved to File
Manager tab to be used for
test and run use cases
File containing details on the
executed experiment
SOM_<second stage>_Train_Results.txt
SOM_<second stage>_Test_Results.txt
SOM_<second stage>_Run_Results.txt
SOM_<second stage>_Train_Normalized_Results.txt
SOM_<second stage>_Test_Normalized_Results.txt
SOM_<second stage>_Run_Normalized_Results.txt
SOM_<second stage>_Train_Histogram.png
SOM_<second stage>_Test_Histogram.png
SOM_<second stage>_Run_Histogram.png
File that, for each pattern,
reports ID, features, BMU,
cluster and activation of
winner node
File with same structure of
precedent described file, but
with normalized features
Histogram of clusters found
SOM_<second stage>_Train_Validity_indices.txt
SOM_<second stage>_Test_Validity_indices.txt
SOM_<second stage>_Run_Validity_indices.txt
File that reports the validity
indices of the experiment.
SOM_<second stage>_Train_U_matrix.png
SOM_<second stage>_Test_U_matrix.png
SOM_<second stage>_Run_U_matrix.png
U-Matrix image
File that, for each node of
output layer, reports ID,
coordinates, clusters, number
of pattern assigned and
Uheight value.
File that, for each clusters,
reports label, number of
pattern assigned, percentage
of association respect total
number of pattern and its
centroids.
SOM_<second stage>_Train_Output_Layer.txt
SOM_<second stage>_Test_Output_Layer.txt
SOM_<second stage>_Run_Output_Layer.txt
SOM_<second stage>_Train_Clusters.txt
SOM_<second stage>_Test_Clusters.txt
SOM_<second stage>_Run_Clusters.txt
SOM_<second stage>_Train_Clustered_Image.png
SOM_<second stage>_Test_Clustered_Image.png
SOM_<second stage>_Run_Clustered_Image.png
SOM_<second stage>_Train_Clustered_Image.txt
SOM_<second stage>_Test_Clustered_Image.txt
SOM_<second stage>_Run_Clustered_Image.txt
SOM_<second stage>_Train_Datacube.zip
SOM_<second stage>_Test_Datacube.zip
SOM_<second stage>_Run_Datacube.zip
The file is produced only if
normalization of dataset was
requested.
Image that show the effect of
the clustering process
File that, for each pixel,
reports ID, coordinates,
features and cluster assigned
Archive that includes the
clustered images of each
slice of a datacube
Quantization and
topographic error are always
produced. DB index is
produced only in 2-Stage
Clustering case. ICA and
ICC are produced only in
Test use case.
The Uheight value is used to
generate the U-Matrix
The file is produced only if
input dataset is an image
The file is produced only if
input dataset is an image
The file is produced only if
input dataset is a datacube
Table 1 – Output file list
17
DAMEWARE SOM+2stage Clustering Model User Manual
This document contains proprietary information of DAME project Board. All Rights Reserved.
DAta Mining & Exploration
Program
3.3 Experiment parameter setup
There are several parameters to be set to achieve training, specific for network topology and learning
algorithm setup. In the experiment configuration there is also the Help button, redirecting to a web page
dedicated to support the user with deep information about all parameters and their default values.
We remark that all parameters labeled by an asterisk are considered as required. In all other cases the fields
can be left empty (default values are used and shown in the help web pages).
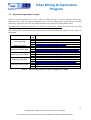
The following table reports the web page addresses for all clustering models and related use cases, subject of
this manual.
Functionality+Model
Clustering_SOM
Clustering_2-stage
Clustering_SOM+K-means
Clustering_SOM+UmatCC
Clustering_SOM+TWL
Clustering_SOM+automatic
USE
CASE
ALL
train
test
run
ALL
train
test
run
train
test
run
train
test
run
train
test
run
SETUP HELP PAGE
http://dame.dsf.unina.it/clustering_som.html
http://dame.dsf.unina.it/clustering_som.html#train
http://dame.dsf.unina.it/clustering_som.html#test
http://dame.dsf.unina.it/clustering_som.html#run
http://dame.dsf.unina.it/clustering_2stagesom.html
http://dame.dsf.unina.it/clustering_2stagesom.html#som+kmeans_train
http://dame.dsf.unina.it/clustering_2stagesom.html#som+kmeans_test
http://dame.dsf.unina.it/clustering_2stagesom.html#som+kmeans_run
http://dame.dsf.unina.it/clustering_2stagesom.html#som+umatcc_train
http://dame.dsf.unina.it/clustering_2stagesom.html#som+umatcc_test
http://dame.dsf.unina.it/clustering_2stagesom.html#som+umatcc_run
http://dame.dsf.unina.it/clustering_2stagesom.html#som+twl_train
http://dame.dsf.unina.it/clustering_2stagesom.html#som+twl_test
http://dame.dsf.unina.it/clustering_2stagesom.html#som+twl_run
http://dame.dsf.unina.it/clustering_2stagesom.html#som+auto_train
http://dame.dsf.unina.it/clustering_2stagesom.html#som+auto_test
http://dame.dsf.unina.it/clustering_2stagesom.html#som+auto_run
Table 2 – List of model parameter setup web help pages available
18
DAMEWARE SOM+2stage Clustering Model User Manual
This document contains proprietary information of DAME project Board. All Rights Reserved.
DAta Mining & Exploration
Program
4 Examples
This section is dedicated to show some practical examples of the correct use of the web application.
Not all aspects and available options are reported, but a significant sample of features useful for beginners of
DAME suite and with a poor experience about data mining methodologies with machine learning algorithms.
In order to do so, very simple and trivial problems will be described.
Further complex examples will be integrated here in the next releases of the documentation.
4.1 First Example: Iris dataset
This example shows the use of the SOM model, with K-Means at the second stage, applied to the dataset Iris.
Note that the following guide is also valid for all the other models described in this document. Models
are slightly different only for some input parameter. More information about input parameters can be
found in the paragraph 3.3.
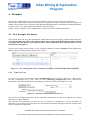
The first step consists in the creation of a new workspace named for example somExp and the input dataset,
iris.txt, must be uploaded in the workspace just created.
Figure 17 – The starting point, with a Workspace (somExp) created and input dataset uploaded
4.1.1
Train Use Case
Let suppose we create an experiment named SomKmeansIris and we want to configure it. After creation,
the new configuration tab is open. Here we select Clustering_SOM_Kmeans, which indicates the
functionality, the model and the type of second stage selected. We select also Train as use case.
Figure 18 – Selection of functionality and use case
Now we have to configure parameters for the experiment. In particular, we will leave empty the not required
fields (labels without asterisk).
The meaning of the parameters for this use case are described in paragraph 3.3 of this document. As
alternative, you can click on the Help button to obtain detailed parameter description and their default values
directly from the web application.
19
DAMEWARE SOM+2stage Clustering Model User Manual
This document contains proprietary information of DAME project Board. All Rights Reserved.
DAta Mining & Exploration
Program
We give iris.txt as training dataset, specifying:
• dataset type: 0, which is the value indicating an ASCII file
• input nodes: 4, because 4 are the columns in input dataset;
• output rows: 5
• output columns: 5
• expected clusters: 7, K parameter of Kmeans
Figure 19 – The SomKmeansIris experiment configuration tab
After submission, the experiment will be executed and a message will be shown when the execution is
completed.
Figure 20 – Experiment finished message
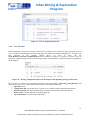
The list of output files, obtained at the end of the experiment (available when the status is “ended”), is shown
in the dedicated section. Each file can be downloaded or moved in the Workspace.
20
DAMEWARE SOM+2stage Clustering Model User Manual
This document contains proprietary information of DAME project Board. All Rights Reserved.
DAta Mining & Exploration
Program
Figure 21 – List of output file produced
4.1.2
Test Use Case
In this paragraph is shown how execute a Test Use Case starting from a Train previously executed. Test use
case is useful to evaluating the executed clustering by the indices described in paragraph 2.4. In order to do
this,
referring
to
the
example
shown
above,
we
have
to
move
the
file
SOM_Kmeans_Network_Configuration.txt in the Workspace. Moreover, in order to execute a Test, we
need a file with one single column, with the target clusters of each pattern. Also this file must be uploaded in
the Workspace.
Figure 22 – Moving configuration file in the Workspace and uploading of target clusters file
Now we have to create a new experiment and choose the functionality, Clustering_SOM_Kmeans, and
select Test as use case. For this model, test has only five mandatory parameters:
• input file: iris.txt
• configuration file: file produced by a Train use case, which contains experiment parameters
• dataset target file: file that report the cluster of each pattern present in the input dataset
• dataset type: 0, which indicates and ASCII input file
• expected clusters: 3, K parameter of K-Means
21
DAMEWARE SOM+2stage Clustering Model User Manual
This document contains proprietary information of DAME project Board. All Rights Reserved.
DAta Mining & Exploration
Program
Figure 23 – The SomKmeansIris test configuration tab
After submission, the experiment will be executed and will produced the output file expected.
4.2 Second Example: choice of second stage
As often happens, is difficult to determine a priori the best post-processing method of SOM, assuming we
want to use one of them. In this case, a good solution is proposed by the Clustering_SOM_Auto
functionality.
Figure 24 – Automatic post-processing functionaliy
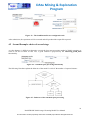
The following flowchart explain the behavior of the model. Let it be K the number of expected clusters.
Figure 25 – Behavior of the automatic post-processing
22
DAMEWARE SOM+2stage Clustering Model User Manual
This document contains proprietary information of DAME project Board. All Rights Reserved.
DAta Mining & Exploration
Program
If some knowledge on the number of expected cluster is available, it can be used. Otherwise, heuristically,
the expected number of cluster will be the square root of the number of patterns in the input dataset.
Obviously, in order the use the K-Means as post-processing method, remembering the behavior describe in
paragraph 2.2.1, the number of expected cluster must be less than the number of BMU found by the SOM at
first stage. Otherwise will be use the Umat-CC method that is independent from the number of clusters and
BMU. However, this process does not allow evaluating the best method to apply in relation to the input
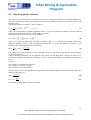
problem. In order to do this we can proceed as shown in the following example, in which an astronomical
image in FITS format will be used as input dataset. After the creation of the Workspace and the uploading of
the input dataset m101.fits, an experiment must be created, selecting Clustering_SOM as functionality and
Train as use case.
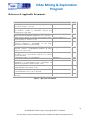
Figure 26 – SOM single stage functionality
A the end of the experiment will obtain a trained network to which apply any one of the post-processing
method by creating another experiment and selecting Clustering_SOM_Kmeans,
Clustering_SOM_UmatCC or Clustering_SOM_TWL and being careful to select Run as use case.
Figure 27 – Clustering_SOM_Kmeans in Run use case
The Run use case ensure that the network parameters read form the configuration file will be not modified
and so, starting from the configuration file obtained from the SOM single-stage, every post-processing
method will work on the same trained network and the results can be compared.
23
DAMEWARE SOM+2stage Clustering Model User Manual
This document contains proprietary information of DAME project Board. All Rights Reserved.
DAta Mining & Exploration
Program
5 Appendix – References and Acronyms
Abbreviations & Acronyms
A&A
AI
Meaning
Artificial Intelligence
A&A
KDD
Meaning
Knowledge Discovery in Databases
ANN
Artificial Neural Network
IEEE
Institute of Electrical and Electronic
Engineers
ARFF
Attribute Relation File Format
INAF
Istituto Nazionale di Astrofisica
ASCII
American Standard Code for
Information Interchange
JPEG
Joint Photographic Experts Group
BoK
Base of Knowledge
LAR
Layered Application Architecture
BP
Back Propagation
MDS
Massive Data Sets
BLL
Business Logic Layer
MLC
Multi Layer Clustering
CC
Connected Components
MLP
Multi Layer Perceptron
CSOM
Clustering SOM
MSE
Mean Square Error
CSV
Comma Separated Values
NN
Neural Network
DAL
Data Access Layer
OAC
Osservatorio
Capodimonte
DAME
DAta Mining & Exploration
PC
Personal Computer
DAMEWARE
DAME Web Application REsource
PI
Principal Investigator
DAPL
Data Access & Process Layer
REDB
Registry & Database
DL
Data Layer
RIA
Rich Internet Application
DM
Data Mining
SDSS
Sloan Digital Sky Survey
DMM
Data Mining Model
SL
Service Layer
DMS
Data Mining Suite
SOFM
Self Organizing Feature Map
FITS
Flexible Image Transport System
SOM
Self Organizing Map
FL
Frontend Layer
SW
Software
FW
FrameWork
TWL
Two Winners Linkage
GRID
Global Resource Information Database
UI
User Interface
GSOM
Gated SOM
URI
Uniform Resource Indicator
GUI
Graphical User Interface
VO
Virtual Observatory
HW
Hardware
XML
eXtensible Markup Language
Astronomico
di
Table 3 – Abbreviations and acronyms
24
DAMEWARE SOM+2stage Clustering Model User Manual
This document contains proprietary information of DAME project Board. All Rights Reserved.
DAta Mining & Exploration
Program
Reference & Applicable Documents
Title / Code
Author
Bruske J., Sommer G.
Date
1995
A Two-stage Clustering Method Combining Ant Colony SOM
and K-means. Journal of Information Science and
Engineering 24, 1445-1460
Chi S-C., Yang C-C.
2008
A cluster separation measure”. IEEE Transactions on
Pattern Analysis and Machine Intelligence. Vol. 1, 224-227
Davies D.L., Bouldin D.W.
1979
On-line pattern analysis by evolving self-organizing maps.
Neurocomputing 51, Elsevier, 87-103
Deng D., Kabasov N
2003
Improved interpretability of the unified distance matrix with
connected components”. Proceedings of the 2011
International Conference on Data Mining
Hamel L., Brown C.W
2011
Extending the Kohonen self-organizing map networks for
clustering analysis”. Computational Statistics & Data
Analysis. Vol. 38, 161-180
Kiang M. Y
2001
Topology
preservation
in
self-organizing
maps”.
Proceedings of the International Conference on Neural
Networks. 294-299
Kiviluoto K
1996
Self-Organizing Maps”. 3rd ed., Springer
Kohonen T
2001
U*F Clustering: A new performant cluster-mining method on
segmentation of self-organizing map”. Proceedings of
WSOM '05, September 5-8, Paris, France, 25-32
Moutarde F., Ultsch A.
2005
Clustering with SOM: U*C. Proc. Workshop on SelfOrganizing Maps, Paris, France. 75-82
Ultsch, A
2005
Clustering of the Self-Organizing Map”. IEEE Transactions
on neural networks. Vol. 11, No. 3, 586-600
Vesanto J., Alhoniemi E
2000
A K-means clustering algorithm”. Applied Statistics, 28,
100–108
Hartigan, J. A., Wong, M. A
1979
Dynamic cell structure learns perfectly topology preserving
map. Neural Comput. 7 845–865
Table 4 – Reference Documents
25
DAMEWARE SOM+2stage Clustering Model User Manual
This document contains proprietary information of DAME project Board. All Rights Reserved.
DAta Mining & Exploration
Program
ID
A1
Title / Code
SuiteDesign_VONEURAL-PDD-NA-0001-Rel2.0
Author
DAME Working Group
Date
15/10/2008
A2
project_plan_VONEURAL-PLA-NA-0001-Rel2.0
Brescia
19/02/2008
A3
statement_of_work_VONEURAL-SOW-NA-0001-Rel1.0
Brescia
30/05/2007
A4
mlpGP_DAME-MAN-NA-0008-Rel2.0
Brescia
04/04/2011
A5
pipeline_test_VONEURAL-PRO-NA-0001-Rel.1.0
D'Abrusco
17/07/2007
A6
scientific_example_VONEURAL-PRO-NA-0002-Rel.1.1
D'Abrusco/Cavuoti
06/10/2007
A7
frontend_VONEURAL-SDD-NA-0004-Rel1.4
Manna
18/03/2009
A8
FW_VONEURAL-SDD-NA-0005-Rel2.0
Fiore
14/04/2010
A9
REDB_VONEURAL-SDD-NA-0006-Rel1.5
Nocella
29/03/2010
A10
driver_VONEURAL-SDD-NA-0007-Rel0.6
d'Angelo
03/06/2009
A11
dm-model_VONEURAL-SDD-NA-0008-Rel2.0
Cavuoti/Di Guido
22/03/2010
A12
ConfusionMatrixLib_VONEURAL-SPE-NA-0001-Rel1.0
Cavuoti
07/07/2007
A13
softmax_entropy_VONEURAL-SPE-NA-0004-Rel1.0
Skordovski
02/10/2007
A14
Clustering con Modelli Software Dinamici. Seminario Dip.
di Informatica, Università degli Studi di Napoli Federico
II,
http://dame.dsf.unina.it/documents.html
Esposito F.
2013
A15
dm_model_VONEURAL-SRS-NA-0005-Rel0.4
Cavuoti
05/01/2009
A16
DMPlugins_DAME-TRE-NA-0016-Rel0.3
Di Guido, Brescia
14/04/2010
A17
BetaRelease_ReferenceGuide_DAME-MAN-NA-0009Rel1.0
Brescia
28/10/2010
A18
BetaRelease_GUI_UserManual_DAME-MAN-NA-0010Rel1.0
Brescia
03/12/2010
A19
SOM and 2-stage clustering models
Requirements.
som_DAME-SPE-NA-0014-Rel4.0
Esposito, Brescia
Design
and
2013
Table 5 – Applicable Documents
26
DAMEWARE SOM+2stage Clustering Model User Manual
This document contains proprietary information of DAME project Board. All Rights Reserved.
DAta Mining & Exploration
Program
__oOo__
27
DAMEWARE SOM+2stage Clustering Model User Manual
This document contains proprietary information of DAME project Board. All Rights Reserved.
DAta Mining & Exploration
Program
DAME Program
“we make science discovery happen”
28
DAMEWARE SOM+2stage Clustering Model User Manual
This document contains proprietary information of DAME project Board. All Rights Reserved.