1
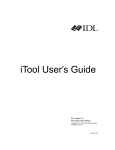
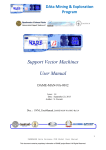
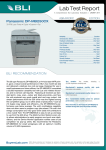
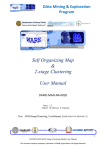
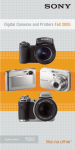
AL
Part I
MA
TE
RI
Getting Star ted
Chapter 1: Introducing Reporting Services
TE
D
Chapter 2: Business Intelligence Solutions
GH
Chapter 3: Reporting Services Installation
CO
PY
RI
Chapter 4: Reporting Services Architecture
Introducing
Repor ting Ser vices
What a long, strange trip it’s been. . . . SQL Server Reporting Services is all grown up now. This
product has matured quite a lot over the past five years or so since enjoying a favorable start in the
industry. This is our third edition of this book, about a product in its third version. We’ve seen it
grow from what was essentially a free download for SQL Server 2000, to a substantial but
relatively untested component of SQL Server 2005, to a serious force in the industry — and a very
capable, enterprise-ready reporting tool.
Since we started writing about Reporting Services for the first edition of this book in 2003, there is
much more to say about this product and the rest of the integrated Microsoft SQL Server Business
Intelligence platform. There are stories to tell about IT projects, training classes, and consulting
engagements. Along the way, we’ve learned quite a lot from other members of the IT community
about the many creative ways to use Reporting Services. We’ll tell some of those stories and
discuss our experience with the past three generations of this product. But for now, let’s focus our
attention on the fundamental applications and capabilities. In other words, What can you do with
Reporting Services? Who should use it, and for what purpose?
The topics introduced in this short chapter are explored in greater detail in the next chapter
and throughout this book. The purpose of this chapter is to provide a high-level introduction only
to the concepts and capabilities of this powerful reporting tool and the data analysis platform of
Microsoft SQL Server 2008. This chapter introduces common reporting scenarios, beginning with
the most basic and then moving to the more advanced. In subsequent chapters, you will explore
these capabilities in depth and learn to use them in your own reporting solutions.
Part I: Getting Started
The Reporting Services Revolution
It was during my morning commute that my life and career took a different path
because of this product. In 2003, my daily trek to downtown Seattle was by passenger
ferry with a group of fellow co-commuters. I had been working on a side project that
had a substantial reporting element. It was a web application with a lot of database
work that I was developing on my laptop during every spare minute I could muster.
I was trying to use the version of Crystal Reports included with Microsoft Visual Studio,
and according to some of the documentation, it should have been possible to integrate
Crystal into an ASP.NET web site. Whether or not it was possible, it certainly wasn’t
easy. After weeks of frustration, a friend on the boat, who worked as a data warehouse
architect for the Walt Disney company, handed me a CD-R with a beta 1 copy of SQL
Server Reporting Services. By the next day, I had working reports deployed to my web
site. I was hooked.
In 2003 and 2004, we wrote the first edition of Professional SQL Server Reporting Services.
At that time, I knew that Reporting Services was going to be a big deal, and I also knew
that writing a book on something as substantial as this new product wasn’t going to be
a walk in the park. In the coming years, my employer, Hitachi Consulting, took on
many reporting projects. We had several people with deep business intelligence and
report design experience. Companies, large and small, migrated their business
reporting to Reporting Services. They recognized its elegant architecture, which made
it adaptable and capable of meeting a range of needs from out-of-the-box reporting
solutions to tightly integrated application design. It was an overnight sensation.
Reporting Services became a staple product for us, and many large companies wanted
to convert their reports from other, less scalable and more expensive products. In 2005
and 2006, we wrote the second edition of this book for SQL Server 2005 — this time,
with a few more years of substantial project experience and having learned many of
the best practices for report design and solution deployment.
Not Your Father ’s Repor ting Tool
Since 2003, when users were first able to work with Reporting Services, the way you use this product has
changed substantially. Rather than just a simple tool used to create tabular reports, it has become a
foundation upon which you can construct complete report, scorecard, and dashboard solutions for
business users and consulting customers. This is not your father ’s reporting tool. Today, it does
everything from simple, ad hoc data reporting to delivering enterprise-ready, integrated reporting into
business portals and custom applications. Now, in the third release for SQL Server 2008, the report
design environment is dramatically improved, with a fine-tuned product architecture and the addition of
several feature improvements. Reporting Services not only comes with a proven track record, but also is
ready to meet the needs of serious IT developers and business information workers who just need a
simple tool without a lot of complex, technical sophistication.
4
Chapter 1: Introducing Reporting Services
We authors have learned a lot about this product with each project and continue to find creative
ways to stretch its capabilities. For the first edition of this book, we worked primarily with the betarelease product. The second edition was based on our experience with Reporting Services for SQL
Server 2000 and SQL Server 2005. Over the past five years, we’ve had many conversations with
members of the Reporting Services product team at Microsoft as we put the product through its
paces to learn what Reporting Services could and couldn’t do well. We’ve also done a lot of
consulting work for Microsoft, designing integrated reports for several Microsoft products that are
currently on the market today. Over the years, we’ve presented sessions at industry conferences and
written books, white papers, and knowledge-base articles. As with most Microsoft products, we
found that there are about 18 different ways to implement each feature. Since then, we have deployed
Reporting Services in many corporate environments and trained thousands to use it. We’ve talked to
business users to understand their reporting needs and then designed reporting solutions for many
types of organizations. We’ve integrated reports into web sites and portals, intranet sites, and
desktop applications. We’ve designed reports for savings and investment banks, financial services,
support centers, software companies, sales and customer management system vendors, sportswear
companies, theme park and entertainment companies, manufacturing, construction, supply chain,
retail, wholesale, and medical, government, and telecom organizations. Having the luxury to invest
so much energy into the use of one tool, we’ve learned how to do a few things really well, but I
think we’ve also learned to keep an open mind toward using creative new methods to solve problems.
We’ve learned a lot about how not to design some reports and how to build reporting solutions more
efficiently — and which of those 18 feature options makes the most sense. This book is based on this
foundation of experience.
Who Uses Repor ting Ser vices?
Probably one of the most significant lessons of the past five years of teaching training courses on
Reporting Services is how diverse the demographics of the audiences are. The roles and backgrounds
of those who design and implement reporting solutions are diverse. As an application developer, I was
accustomed to teaching programmers and other technology professionals whose life quest is to
make the world a better place by writing program code and software. However, I quickly learned that
there wasn’t a stereotypical report designer. Some are very business-focused and aren’t necessarily in
love with technology and program code. Many are simply charged with managing or facilitating a line
of business. They need tools to get information quickly and don’t want to reinvent the wheel or work
with cumbersome tools. The figures in the following table aren’t substantiated by any kind of survey
or study but are merely this author ’s objective observation of those who attend Reporting Services
training classes:
5
Part I: Getting Started
Approximate
Percentage
Role
Description
15%
Business Managers
Those who working seriously with Reporting
Services, having attended classes or engaged in
consulting services. They are mainly interested in the
bigger picture: how reports can address their
analytical needs and help them make informed
decisions. They have little interest in the
implementation details or the technology used to
make it work. They direct people who can do the
detail work.
15%
System Administrators
Consists of server system builders, hardware
professionals, and database administrators. In smaller
organizations, they often share with the software
developer and are typically concerned with the setup
and ongoing maintenance of servers and the
infrastructure to keep reporting solutions available
and working. They typically spend their time and
energy managing security and optimizing the system
for efficiency.
20%
Software Developers
To achieve advanced reporting features, software
developers write complex queries and custom
programming code to process business rules and give
reports conditional formatting and behavior.
Developers typically feel right at home with the
report design environment because it’s very similar
to familiar programming tools.
50%
Business Information
Workers
The people in this role have strong computer user
skills, but they don’t spend their time writing code
and using tools like Visual Studio, Enterprise
Manager, or SQL Server Management Studio. They
need to design reports to run their businesses.
Wait a minute! This is a book about creating reports to display information in meaningful and interesting
ways. I can’t just display this information in a boring list, so I’ve created a simple report and put it into a
chart (an exploded, semitransparent doughnut chart, to be specific), shown in Figure 1-1.
6
Chapter 1: Introducing Reporting Services
Business Information
Workers
Software
Developers
Business
Managers
System
Administrators
Figure 1-1
As a software developer, coming to the realization that the largest group of reporting professionals is not
the software developer or other technical expert was a wake-up call. As I taught Reporting Services 2000
classes for Microsoft, I often spent a large portion of the classroom time just teaching students to use the
Visual Studio user interface. It was new to them and unlike any other application they were accustomed
to. Report designers who have been using other tools such as Crystal Reports, for example, will typically
be a little intimidated by the Reporting Services design tools because they may be unfamiliar and may
seem to be more “raw” and developer-centric than what they’re used to using. In order to take advantage
of advanced report capabilities, these individuals must either acquire some simple programming skills or
work with software developers to add custom code and expressions to their reports.
Today, Reporting Services in SQL Server 2008 meets the needs of information workers and technology
professionals with two different design tools. The stand-alone report designer is simple, focused, and
familiar — with a user interface similar to Microsoft Office applications. A more advanced report design
experience is available to application developers and other technical professionals, integrated into the
Visual Studio solution design environment shell. This tool is optimized for adding custom expressions,
complex features, and program code.
Application and Repor ting Technology
The definition of reporting is changing. Like so many components of the computer/information
industry, the lines between one thing and another have become very fuzzy. This applies to so many
concepts in our industry. For example, many traditional desktop applications now run in a web browser.
Are these client or server applications? These days it’s hard to draw a line and categorize a business
solution. Not long ago, if an application opened in a web browser, it was considered to be a server-side
application — all the processing occurred on a web server. Likewise, if an application ran from a shortcut
on your computer, it was a client-side application, where all the files and processing occurred on your
own computer. Have you attended an Internet-hosted meeting or seminar? If so, you probably navigated
to a site in your web browser, entered a meeting number, and, magically, you were looking at
PowerPoint slides and a demonstration running on the presenter ’s desktop computer. Although you
7
Part I: Getting Started
may have started from a web page and the conferencing application may have been started from your
web browser, it was actually running in a client-side application, which you allowed to be installed on
your computer, using advanced content-streaming technologies, allowing you to interact with the serverhosted conference.
What does this have to do with reporting? Quite a lot, actually.
Blurring the Application/Reporting Line
With Reporting Services, you can integrate reports into applications in such a way that users may not be
able to tell the difference between the two. With a little bit of programming code, reporting features can
be extended to look and act a whole lot like applications. Where do applications stop and reports begin?
When do reports start replacing application functionality? What, exactly, is the difference between a
report, a dashboard, and a scorecard? The lines have become quite blurred. Your task is to decide which
tool best meets the need. Many intranet sites run on web portals, rather than custom-programmed web
sites, and Reporting Services naturally plays well in practically any web portal environment — and now
it has native integration with Microsoft Office SharePoint Services.
The exciting news is that you now have a tool that can do some incredible things. As my favorite
superhero’s uncle said, “With great power comes great responsibility.” If you are a simple report
designer with simple needs, the good news for you is that using Reporting Services to design simple
reports is . . . well, simple. If you are a software developer and you intend to use this powerful
framework to explore the vast reaches of this impressive technology, welcome to the wonderful world of
creative, custom reporting.
Information, Now!
Imagine that you are sitting in a presentation meeting at the corporate office of a key customer. You are a
senior sales representative for a company that sells high-volume data backup systems, and the solution
they decide on will be implemented in several regional data centers around the world. Your team has
been preparing for this meeting for months. Your success depends on your ability to demonstrate your
competence to the customer and your clear understanding of their needs. Your team has done its
homework, and you know that the customer has a history of scanning printed medical records and
storing them as image files. Based on this information, you are certain that a particular product will
adequately provide the file backup facilities for their moderate volume of image files. You have made it a
point to familiarize yourself with the capabilities of the system that appears to be the best fit.
During your customer ’s opening presentation, they tell you that they have recently made a huge
investment in full-motion video-imaging equipment. Now they need a backup system that can handle
large file capacities. They are prepared to make an investment that is substantially larger than what you
had anticipated for a capable backup solution. Your company began to offer a large-scale solution just a
couple of weeks ago, but you aren’t very familiar with its capabilities. You’ve spent so much time
preparing to sell the smaller system that you haven’t had time to learn more about this new product.
Your associate is doing introductions, and it will be your turn in about 15 minutes.
Discreetly, you open your Pocket PC Phone and access the World Wide Web. You log in to your
company’s secure report server, select the product catalog report, choose the product category, and then
drill down to the new product. The report has a drill-through option that lets you quickly view a
detailed specification report for the new, high-volume backup system. After noting the pertinent
8
Chapter 1: Introducing Reporting Services
specifications, you save this report to a PDF file and then choose the customer sales inquiry history
report. Looking up this customer, you learn that someone named Julie from this very company made an
inquiry about two months ago regarding video media backups.
Looking around the room, you find a name card with Julie’s name on it. You explore the details of this
call, and you find that she had asked if you offer a solution comparable to a very expensive product from
a competitor. Checking the competition’s web site, you discover that the competing product Julie had
mentioned uses older technology, has a smaller capacity than the new system, and costs considerably
more. You save a report with all the pertinent specifications to your memory card, hand the card to the
administrative assistant sitting next to you, and ask that he make printed copies of the PDF file it
contains.
Your colleague finishes her presentation and then introduces you. Taking another quick glance at the
new product specs, you begin your introduction (see Figure 1-2).
Figure 1-2
You explain that one of your team’s greatest strengths is your real experience and understanding of how
business can change direction from day to day. In order to be responsive and competitive, it’s necessary
to adapt to these changes. You show the brochure for the midscale product and explain that this product
would be an excellent solution for a company that just scans documents. But for digital video, a more
capable solution is required. You share the product specification and qualify the product to meet your
customer ’s needs. During your presentation, the administrative assistant returns with the printed
specification report. Not missing a beat, you distribute copies to everyone and conclude your
presentation. You make brief eye contact with your colleague, who raises an eyebrow just before your
customer ’s chief decision-maker, Julie, aggressively shakes your hand and thanks you profusely for your
time and the extra effort you made to understand their needs. After the big sale is closed, the promotion,
the new company car, and corner office . . . you get the idea.
Solution Types
One of the things I’ve learned in the business consulting field is that giving people a lot of choices
doesn’t necessarily solve their problems. An impressive aspect of Reporting Services is that there are so
many different ways to implement it into a business environment. The fact that reports could be
9
Part I: Getting Started
integrated into a custom desktop application, web application, static web site, or a document or through
low-level programming code may appeal to programmers because of the many choices and flexibility.
However, to a business user or leader, too many choices may just be confusing and overwhelming.
At the end of the day, someone must decide how reports will be used in the business environment and
set a standard for most report designers to follow. Experience has shown that the majority of new
Reporting Services implementations will use the de facto Web-based Report Manager interface. In more
sophisticated enterprise business intranet environments, SharePoint portal integration is becoming a
common choice. Most of the other options are specialized and may be used to meet specific business
needs but are less common. For completeness, these options are all covered.
Reporting solutions come in a variety of sizes and shapes. These range from the standard Report
Manager Web interface to a completely customized application with integrated reporting features.
The types of software solutions that might incorporate reporting include:
❑
Out-of-the-box, server-based reporting features, using reports created by report designers and
deployed to a central web server
❑
Client-side ad hoc reports created by users on demand with the Report Builder tool using
predefined data models
❑
Reports integrated into web applications using URL links to open in a web browser window
❑
Reports integrated into SharePoint Portal server applications using SharePoint web parts
❑
Custom-built application features that render reports using programming code. Reports can be
displayed within a desktop or web application interface or saved to a file.
Out-of-the-Box Reports
What does Reporting Services provide if you just want to use its simplest features right out-of-the-box?
Quite a lot, actually.
Since the product was released for SQL Server 2000, Reporting Services required the Microsoft
development environment to design and deploy reports to a central web server. Compared with other
report design tools on the market, this presented a challenge. Prior to the release of SQL Server 2005, the
development environment was available only as a separate product called Microsoft Visual Studio. This
was a tool for serious application developers to create custom software. It still is, but as of SQL Server
2005, the development environment, called the Business Intelligence Development Studio (or BIDS), installs
with the SQL Server client tools and has been tailored to manage SQL Server databases, write queries,
and design reports. Using this powerful tool has likely been the most significant challenge for the new
report designer.
In the 2008 product, a simplified report design tool makes the process even easier than before. The standalone report designer serves only one purpose — keeping the interface simple and uncomplicated and
the process of report design as straightforward as possible. Experienced report designers who learned to
use the previous toolset will still have access to the Visual Studio/BIDS designer, which may be installed
with the SQL Server client tools.
Once you learn the basics of the development environment, designing reports and managing projects are
actually quite easy. Both report design tools include a simple Report Wizard that can lead you through
designing common reports. Tabular, grouped, cross-tab, and chart reports are relatively easy to build just
by following the Wizard prompts and setting a few properties.
10
Chapter 1: Introducing Reporting Services
After a new report has been designed and tested, it can be deployed to a central report server, where it
will be available to all users through a simple web browser application called the Report Manager.
Beyond Wizard-built reports, many aspects of more complex reports may be managed by creating simple
programming expressions. An expression builder guides the designer through the simple use of
functions and logical expressions that may be used to modify colors, visibility, and formatting aspects
and to perform calculations. Because the expressions in Reporting Services are based on Visual Basic
.NET, the power of conditional expressions is virtually limitless.
Server-Based Reports
It’s important to understand the difference between SQL Server Reporting Services and a desktop
reporting tool like Microsoft Access. Reporting Services isn’t an application that you would typically
install on any desktop computer but, rather, is designed for business use. It requires Microsoft SQL
Server, a serious business-class relational database management tool. For this and other reasons,
Reporting Services runs on a file server instead of a desktop computer. Therefore, you can scale this
powerful tool for use by thousands of users and report on very large sets of data stored in a variety of
database platforms. But just because Reporting Services is a business-sized product, this doesn’t mean
that reports have to be complicated or difficult to design.
Report users need to be connected to a network, or perhaps the Internet, with connectivity to the report
server. When a report is selected for viewing from a folder in the Report Manager, it is displayed as a
web page in the user ’s web browser. Optionally, the same report can be displayed in a number of
different formats including Word, Excel, Adobe PDF, or as a PNG, JPEG, GIF, or TIFF image. Reports
may be saved to files in these and other formats for offline viewing. Reports may also be scheduled for
automatic delivery by the report server by e-mail or may be saved to files. These features are standard
and require only simple configuration settings and minor user interaction.
User-Designed and Ad hoc Reports
With the stand-alone Report Builder report design tool, less-technical users can create standard reports
to be deployed beside enterprise reports developed by the IT staff. This bridges the gap to some degree
for the capable information worker. Standard reports are designed for users ahead of time and deployed
to the server for users to select and display, print, or save to a file. This may be useful for standard
reporting needs shared by most report users. However, savvy users cannot modify the design or these
reports without access to the design and development tools.
Ad hoc reporting for Reporting Services is in a state of transition. Report Builder was introduced with
SQL Server 2005 Reporting Services and remains a viable tool for non-programmers to create their own
reports. It will eventually be replaced by a new tool called Report Builder 2.0, which is being introduced
with the 2008 version of the product. Although the name is similar, the tool is very different. You can be
the judge, but for now, two options are available for creating simple reports with an easy-to-use
design tool.
Ad hoc reporting is an alternative to creating predesigned, server-side reports. The Report Builder
design tool allows users to build their own reports on the fly, using prepared queries and data models.
Using this option, the IT staff or system administrator prepares a variety of common data models to
simplify and expose the underlying data sources in a concise form. This allows users to construct ad hoc
reports using simple drag-and-drop techniques. These reports may be used once and discarded, or saved
for others to use or to be built on in later sessions.
11
Part I: Getting Started
The actual design work is performed using a client-side builder tool delivered on demand in the user ’s
web browser. The user experience is quite simple. As far as the user is concerned, a new report is created
using a simple web page selection, and Report Builder opens in a browser window without specifically
installing a software package ahead of time. These reports are stored on the server in the same folder
space as other reports. The Report Manager web interface is used to access and maintain standard
Reporting Services reports as well as Report Builder reports and their associated data models.
The advantages of Report Builder reports are that they give users the ability to design and customize
their own reports without involving a report designer or developer. Report styles and features include
standard report layouts like columnar, hierarchical, pivot/matrix, and charts but can only include one of
these data range elements, unlike standard reports that can include as many as you like. Report Builder
reports cannot contain or use custom code. Data-formatting options are more restrictive, and the
data models must be prepared ahead of time. Models may be created to mirror the details of source data
tables or may be simplified. This allows the data model designer to hide sensitive data and to simplify
complex data sources with alias columns, aggregations, and calculated data members.
Repor t Design Tools
When Reporting Services was released for use with SQL Server 2000, only one design tool could be used
to create reports. Since that time, third-party vendors began creating design tools designed specifically
for users with different needs. High-end report developers require different tools to create corporate
reporting solutions from those required by information workers to design personal and departmental
reports. Information Technology architects, database designers, and application developers who create
large-scale business intelligence solutions need a design environment that allows members of formal
teams to share and manage various files and reports. They need to write and debug program code and
shared components.
Information workers may not need to use such sophisticated tools and will benefit from a simple design
environment with familiar features and options. A simplified, stand-alone report designer will assist
users to create departmental and personal reports that need to be deployed to a central server, shared
with other users, and available for future enhancements.
An ad hoc design tool should be simple and lightweight and should require little or no installed software
on the user ’s computer. It should allow IT professionals to expose a simplified and secure view of
corporate data sources that ad hoc report designers use to simply select predefined data elements and
organize them in common report presentations.
Report Builder 2.0
Report Builder 2.0 is an addition to the report design suite for the information worker to create fully
capable, server-hosted reports. It’s a serious tool with a moderate learning curve. Unlike its predecessors
Visual Studio or the Business Intelligence Development Studio, it doesn’t expose some advanced
capabilities that may be unnecessary for someone designing typical departmental or personal reports. In
Chapter 5, you learn to use to use the Microsoft Office-like user interface to design data sources, queries,
and report layouts to meet a variety of business needs.
12
Chapter 1: Introducing Reporting Services
Report Builder 2.0 is a stand-alone application that may be installed on the desktop of any user from the
SQL Server 2008 installation media, or it may simply be launched from the central Report Manager Web
interface. Using this tool to design reports, a user will need permission to read data sources and will also
need permission to deploy reports to the report server using this tool.
Business Intelligence Development Studio
The Business Intelligence Development Studio tool (BIDS) is the most capable and sophisticated report
design tool that may be installed from the SQL Server 2008 installation media. BIDS is the more
traditional tool that report designers have been using with SQL Server 2005. It requires some project
management knowledge and has a steeper learning curve than those of the stand-alone Report Builder
2.0 or ad hoc Report Builder designers.
BIDS is very similar to all the editions of Visual Studio and allows report projects to be integrated with
other database and business intelligence projects to form a comprehensive data analytic or BI solution.
Designing Repor ts
To recap, SQL Server 2008 Reporting Services currently has three different tools for designing reports:
The first option is the new Report Builder 2.0 report designer, which is optimized for non-technical users
and has a simplified interface, similar to Microsoft Office products. The purpose of this tool is to make
report design as easy as possible and accessible to users who just need to design simple reports but don’t
need to develop applications or structure business database solutions. The second option is the
integrated Report Designer, created with the information technology professional in mind. It is an add-in
for the Microsoft Development Environment or Visual Studio. In Reporting Services for SQL Server 2000,
report design was performed exclusively using Visual Studio, which had to be purchased separately. In
SQL Server 2005 and 2008, a lighter edition of the development environment is installed with the SQL
Server client tools, called the Business Intelligence Development Studio (or BIDS). Now reports may
be designed and created using either Visual Studio or BIDS, both of which are implementations of the
development environment. The third option is the older Report Builder tool, which, although easy to
use, creates less capable reports based on a different technology standard.
Confused? You shouldn’t be. You can design reports using the Report Builder 2.0 report designer, which
is for non-technical folks who just want to design reports. The more technical tool comes in two flavors
depending on whether you have installed any edition of Microsoft Visual Studio on your computer. If
you only have the client tools for SQL Server 2008 installed, you will use BIDS. If you have Visual Studio
installed, you can use either Visual Studio or BIDS. Here’s a little secret. . . . BIDS is actually just a
shortcut to Visual Studio. If you have Visual Studio installed, they both take you to the same place
(shhh . . . don’t tell Microsoft that we figured this out). Regardless of the tool you use, your design
experience will be nearly the same, and throughout this book you are provided examples for each option.
Building standard, server-side reports in the designer can be as simple as 1, 2, 3: First, you create a data
connection to the data source and dataset (or query) for the report. The second step is to design the
report layout using simple drag-and-drop tools. Formatting attributes are set by changing properties in
the Properties sheet or Dialogs. The report may be previewed and debugged within the designer. The
third and final step is to deploy the report to the report server. This may be done using a menu action or
a button. The stand-alone Report Builder 2.0 report designer, shown in Figure 1-3, supports this
three-step paradigm with corresponding features and designer views.
13
Part I: Getting Started
Figure 1-3
The report design tools are covered in Part II. You’ll learn about the basics beginning in Chapter 5,
“Basic Report Design,” and about advanced techniques in Chapter 8, “Advanced Report Design.”
In Part III, Chapter 9, “Reporting with Analysis Service,” and Chapter 10, “Report Solutions Patterns and
Recipes,” will take you beyond the features and discuss several common business scenarios. In these
chapters, you will learn techniques for designing the best reporting and data analysis solutions to meet
some common and unique challenges.
End-user and ad hoc reporting is covered in Part IV. These are different from Reporting Services’
standard server-side reports. Because this feature is intended to give users the power to create and
modify their own reports, it does not require Visual Studio, Business Intelligence Development Studio,
or the new stand-alone Report Builder 2.0 designer to be installed on their computers. First, a data model
is prepared to support the reports users may build. These data models are stored on the report server
with shared data sources and reports. The data model serves two important purposes. First, it provides a
simplified view to hide the complexity of relational or hierarchal data. Second, it allows the data model
designer to control access to sensitive or irrelevant data stored in the database. When a user wants to
build a report from the Report Manager, the Report Builder design components are downloaded and
activated in the user ’s web browser. This design environment shares common features and
characteristics with the Report Designer but is simpler to use and specifically designed for creating these
client-side reports. Report Builder reports are automatically laid out and formatted for ease of use.
Finished reports may be stored on the server for reuse.
14
Chapter 1: Introducing Reporting Services
Part IV, including Chapter 11, “Report Models,” and Chapter 12, “Report Builder 1.0,” thoroughly covers
client-side reporting concepts, data model preparation, and the Report Builder ad hoc design
environment.
Simple Application Integration
There are a few options available for integrating reports into business solutions. Using reports from an
external application isn’t hard to do, but choosing the right technique depends on the type of application
and the desired behavior of the report interface. Even with all these options, you may still have a few
different implementation choices. There are now several different methods for rendering reports in a
custom implementation, which include:
❑
A standard web request using a Uniform Resource Locator (URL)
❑
A report embedded into a Windows or web application using an IFrame or Browser control
❑
A programmatic web request using the Simple Object Application Protocol (SOAP)
❑
The ReportViewer control integrated into Visual Studio for custom Windows Forms or Web
Forms applications
❑
The ReportViewer web part for SharePoint Portal Server or Microsoft Office SharePoint Services
The first option is much easier but may be used in a variety of ways. In its simplest form, a hyperlink is
used to open the report in the web browser. The user uses a standard toolbar to provide parameters for
filtering and other report options.
Launching Reports from an Application
Hyperlinks and application shortcuts can easily be added to documents and custom applications. Using
this simple technique, report links can be added to Windows Forms, documents, and web pages.
Much of the standard report viewing environment may be controlled using parameters passed to the
report server in the URL. By incorporating these commands into a hyperlink, reports may be displayed
with or without toolbar options and features. You can change the zoom factor and modify the rendering
format. For example, clicking a link for one report may open it as a web page in HTML, and another link
for a different report may open it in Excel or the Adobe Reader.
Reports may be designed to prompt users for parameter values used to filter data and to modify the
report format and output. These parameters may also be incorporated into a URL string. This way, one
hyperlink will display a report with one set of data, and another hyperlink will display the same report
with different data. Parameters can even be used to change display attributes such as font sizes and
colors, and to hide and show content.
15
Part I: Getting Started
User Interaction and Dynamic Reporting
There are many opportunities to use report features that provide a rich user experience. In the past,
many reports were nothing more than a list of values with totals. Now reports can be a starting point
that can guide users to the information they need to make decisions. Report elements such as text labels,
column headers, and chart points can be used to navigate to different report sections and to new reports.
Since navigation links may be data-driven and dynamically created based on program logic, report links
(see Figure 1-4) may also be used to navigate into business applications. Imagine using your reports to
launch programs and to navigate to document libraries and online content!
Figure 1-4
Dynamic reporting means that the content and layout of a report can change as the user selects
parameter values or clicks different items. Summary headers (shown in Figure 1-5) may be used to
expand and collapse detail sections, giving users the ability to drill down to more specific information.
16
Chapter 1: Introducing Reporting Services
Figure 1-5
Intranet and Internet Report Access
One of the marvelous things about the SQL Server Reporting Services architecture is that it is based on
modern Internet technologies, namely, XML Web services and the .NET Framework. The report server,
running under Windows Server Internet Information Services, is essentially a complete web portal. At its
core, Reporting Services exposes all its features and capabilities as a web service. This means that there
are virtually no practical limits to how the features of reports and the report server may be expanded to
meet specific needs.
At the simplest level, this means that reports may be accessed by privileged users who are connected
through a corporate intranet or through the World Wide Web. Reports may be made available through
the out-of-the-box Report Manager web page interface or may be built into custom applications, as you
will see in subsequent chapters.
Seamless Application Integration
How and why you would build reporting into a custom business application is a big question. Although
there are some common (and rather simple) techniques, there isn’t just one way to incorporate reports
into a business environment. Whether you want your users to simply link to a report in a standard
browser-based report viewer or to have report content seamlessly melded into a custom application user
interface, there are a handful of methods to get there. Whatever the chosen technique, users need not
17
Part I: Getting Started
even realize that they are using Reporting Services to view their content. In fact, they may not even
realize that they are viewing a report. From the users’ perspective, their experience is simply a
convenient and smooth flow of information as they navigate from one simple interface to another,
without ever leaving your business solution.
Part V will help you explore opportunities for integrating Reporting Services reports into applications
and business solutions. Chapter 12 will show you different techniques for including reporting features in
Windows and web applications. You will learn how to program the Reporting Services web service to
gain control over the report-rendering process and to manage reports through custom applications.
Web Application Integration
It’s impossible to know for sure, but by some estimates, as many as 90 percent of all desktop business
applications have been replaced by browser-based applications, most in the past five years. The power of
the Web and Internet technologies has drastically changed the way we use our computers. For this
reason, web applications have come a long way in just the past few years. Once stodgy, static web pages,
many “web sites” have been replaced with interactive information portals and dynamic application
interfaces that provide feedback and tactile response to user interaction.
The page paradigm has turned once-standard gray window dialogs into artistic-yet-efficient, fashionably
color-coordinated data input and management screens. One of the reasons that Reporting Services
integrates so easily with modern web applications is that it natively supports HyperText Markup
Language (HTML), the standard markup language used to create web pages.
Techniques may be used to incorporate reports into a web application in a variety of ways, for example:
❑
Hyperlinking to navigate the web browser window to a report
❑
Hyperlinking to open reports in a separate web browser window, with control over report
display and browser features
❑
Embedding reports into a page using a frame, IFrame, or ReportViewer web control
❑
Programmatically feeding report content to an Active Server Page (ASP or ASPX) using serverside custom code
❑
Programmatically writing reports to files available for downloading from a web site
❑
Using a web part to embed reports into a SharePoint Web portal
❑
Fully integrating the report server in SharePoint Integration mode
The fact is that there are a lot of creative ways to integrate reports into a web application. These
techniques range from very simple, requiring little more than a little HTML script, to very complex,
custom methods. And if it’s not enough to be able to embed reports into custom web pages, it’s also
possible to use custom program code to embed additional content into reports. Imagine the
possibilities . . . actually, you don’t have to imagine anything. Just keep reading!
18
Chapter 1: Introducing Reporting Services
Portal Integration
As web technologies and products have matured, a new breed of web applications has evolved. Most
web sites consist of several HTML page files, which contain mainly text content. Portal frameworks like
Microsoft Office SharePoint Services, IBM Websphere, Plumtree, and DotNetNuke have replaced many
large, complex web sites. A portal server takes much of the programming out of web-site construction by
providing a framework and the building blocks to assemble an intricate web site from modules. Most of
the content is managed in a database rather than in physical web pages.
Now your corporate reporting solution can be completely integrated into the enterprise intranet portal.
Chapter 16 covers report server integration with SharePoint. Rather than managing reports, security, and
configuration settings on a separate report server and then using a SharePoint portal to just display the
reports, SharePoint integrated mode allows all your reports and report administration to be managed
completely within SharePoint. If you choose to manage the report server separately from your
SharePoint portal, you can still use ShapePoint web parts to navigate folders and reports and to view
reports hosted on the report server running in Reporting Services Native mode.
SharePoint integrated mode is supported in Microsoft Office SharePoint. A Reporting Services report can
integrate with practically any portal site in some of the same ways that it integrates standard web
pages — by using IFrames and hyperlinks. SharePoint integration is particularly easy for non-developers
because it involves the use of simple menu options rather than writing script or program code. Adding
the report viewer web part to a portal site page is as easy as dragging and dropping it into a page zone
and then setting some simple properties. Microsoft offers a simple portal framework with limited
features with Windows Server, called Windows SharePoint Services (WSS). The full-featured, corporatescale edition — SharePoint Portal Server — is a separate product that adds features and advanced
scalability to the WSS foundation.
Windows Application Integration
Reports may be viewed in custom Windows desktop applications using one of two techniques. The
ReportViewer control or embedded web browser may be used to view server-based reports in a form.
These reports are still managed on the report server and maintain all the security settings and
configuration options defined by an administrator. Queries and data access are still performed on the
server. The other option is to embed these reports directly into the client-side application. The Windows
Forms ReportViewer controls can act as a lightweight report-rendering engine. This means that reports
built into a custom application can run independently from the report server. Figure 1-6 shows a report
rendered on a Windows Form using the ReportViewer control.
19
Part I: Getting Started
Figure 1-6
Managing and Customizing
the Repor t Ser ver
Reports may be delivered in a variety of ways (not just when a user navigates to a report in real
time). Reports may be automatically rendered to the server cache so that they open very quickly and
don’t burden data sources. They may be delivered via e-mail and to file shares on a regular schedule.
Using data-driven subscriptions, reports may be “broadcast” to a large audience during off-hours. Each
user may receive a copy of the report rendered in a different format or with data filtered differently. You
will learn to plan for, manage, and configure these features.
Chapter 14 guides you through report server administration. You learn how to optimize, back up, and
recover the ReportServer database, web service, and Windows service. You also learn to use the
management utilities, configuration files, and logs to customize the server environment and to prevent
and diagnose problems.
Chapter 17 covers programmatic extensions to the Report Server. You learn to write custom data source,
rendering, delivery, and security extensions. That chapter shows you how to build new features on top
of the Reporting Services architecture. As a report designer or business manager, you learn how these
20
Chapter 1: Introducing Reporting Services
powerful capabilities enable you to address specialized requirements and to direct application
developers to develop custom extensions. As a system administrator, you learn to enable custom
extensions and define appropriate security allowances to enable custom extensions to run on your report
server. As a custom extension developer, you learn how to use the Reporting Services object model to
extend the features of reports and your server, to solve business problems and enable advanced
capabilities.
Summar y
Different people use Reporting Services in different ways. Our goal in this book is to address the needs
of the broad community of power users, report designers, solution architects, system administrators, and
business managers. For some, the material contained in sections of this book will help them build and
deploy reporting solutions to meet their needs. For others, it may open their eyes to powerful
capabilities beyond their skill set and how to work beside other professionals as educated members of a
project team.
As a non-programmer report designer using Reporting Services, you are likely to learn to write some
custom expressions and program functions to meet specific reporting needs. Perhaps this is as far as you
will need to take Reporting Services. For the vast majority, this is enough to design, build, and deploy
reports with capabilities far greater than any other reporting tools you may have used in the past. If you
are a serious programmer, then your needs are probably a little different from those of the casual report
designer. For the custom business solution developer, there are very few boundaries set by limitations of
this product. With some creativity and the techniques you will learn in the chapters ahead, you can take
reporting further than you have before and provide your users with real business intelligence rather than
just the ability to print out data.
Reporting Services takes data accessibility to the next level. Microsoft is making good on its promise of
making information available “any time, any place, and on any device.” Reports may be designed using
specific rendering formats and page sizes to support mobile devices, the browser window, Office
documents, and — oh yes — the printed page.
21