1
MPLAB® REAL ICE™
In-Circuit Emulator
User’s Guide
For MPLAB X IDE
2013 Microchip Technology Inc.
DS52085A
Note the following details of the code protection feature on Microchip devices:
•
Microchip products meet the specification contained in their particular Microchip Data Sheet.
•
Microchip believes that its family of products is one of the most secure families of its kind on the market today, when used in the
intended manner and under normal conditions.
•
There are dishonest and possibly illegal methods used to breach the code protection feature. All of these methods, to our
knowledge, require using the Microchip products in a manner outside the operating specifications contained in Microchip’s Data
Sheets. Most likely, the person doing so is engaged in theft of intellectual property.
•
Microchip is willing to work with the customer who is concerned about the integrity of their code.
•
Neither Microchip nor any other semiconductor manufacturer can guarantee the security of their code. Code protection does not
mean that we are guaranteeing the product as “unbreakable.”
Code protection is constantly evolving. We at Microchip are committed to continuously improving the code protection features of our
products. Attempts to break Microchip’s code protection feature may be a violation of the Digital Millennium Copyright Act. If such acts
allow unauthorized access to your software or other copyrighted work, you may have a right to sue for relief under that Act.
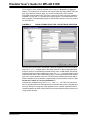
Information contained in this publication regarding device
applications and the like is provided only for your convenience
and may be superseded by updates. It is your responsibility to
ensure that your application meets with your specifications.
MICROCHIP MAKES NO REPRESENTATIONS OR
WARRANTIES OF ANY KIND WHETHER EXPRESS OR
IMPLIED, WRITTEN OR ORAL, STATUTORY OR
OTHERWISE, RELATED TO THE INFORMATION,
INCLUDING BUT NOT LIMITED TO ITS CONDITION,
QUALITY, PERFORMANCE, MERCHANTABILITY OR
FITNESS FOR PURPOSE. Microchip disclaims all liability
arising from this information and its use. Use of Microchip
devices in life support and/or safety applications is entirely at
the buyer’s risk, and the buyer agrees to defend, indemnify and
hold harmless Microchip from any and all damages, claims,
suits, or expenses resulting from such use. No licenses are
conveyed, implicitly or otherwise, under any Microchip
intellectual property rights.
Trademarks
The Microchip name and logo, the Microchip logo, dsPIC,
FlashFlex, KEELOQ, KEELOQ logo, MPLAB, PIC, PICmicro,
PICSTART, PIC32 logo, rfPIC, SST, SST Logo, SuperFlash
and UNI/O are registered trademarks of Microchip Technology
Incorporated in the U.S.A. and other countries.
FilterLab, Hampshire, HI-TECH C, Linear Active Thermistor,
MTP, SEEVAL and The Embedded Control Solutions
Company are registered trademarks of Microchip Technology
Incorporated in the U.S.A.
Silicon Storage Technology is a registered trademark of
Microchip Technology Inc. in other countries.
Analog-for-the-Digital Age, Application Maestro, BodyCom,
chipKIT, chipKIT logo, CodeGuard, dsPICDEM,
dsPICDEM.net, dsPICworks, dsSPEAK, ECAN,
ECONOMONITOR, FanSense, HI-TIDE, In-Circuit Serial
Programming, ICSP, Mindi, MiWi, MPASM, MPF, MPLAB
Certified logo, MPLIB, MPLINK, mTouch, Omniscient Code
Generation, PICC, PICC-18, PICDEM, PICDEM.net, PICkit,
PICtail, REAL ICE, rfLAB, Select Mode, SQI, Serial Quad I/O,
Total Endurance, TSHARC, UniWinDriver, WiperLock, ZENA
and Z-Scale are trademarks of Microchip Technology
Incorporated in the U.S.A. and other countries.
SQTP is a service mark of Microchip Technology Incorporated
in the U.S.A.
GestIC and ULPP are registered trademarks of Microchip
Technology Germany II GmbH & Co. & KG, a subsidiary of
Microchip Technology Inc., in other countries.
All other trademarks mentioned herein are property of their
respective companies.
© 2013, Microchip Technology Incorporated, Printed in the
U.S.A., All Rights Reserved.
Printed on recycled paper.
ISBN: 978-1-62076-490-9
QUALITY MANAGEMENT SYSTEM
CERTIFIED BY DNV
== ISO/TS 16949 ==
DS52085A-page 2
Microchip received ISO/TS-16949:2009 certification for its worldwide
headquarters, design and wafer fabrication facilities in Chandler and
Tempe, Arizona; Gresham, Oregon and design centers in California
and India. The Company’s quality system processes and procedures
are for its PIC® MCUs and dsPIC® DSCs, KEELOQ® code hopping
devices, Serial EEPROMs, microperipherals, nonvolatile memory and
analog products. In addition, Microchip’s quality system for the design
and manufacture of development systems is ISO 9001:2000 certified.
2013 Microchip Technology Inc.
Object of Declaration: MPLAB REAL ICE In-Circuit Emulator
2013 Microchip Technology Inc.
DS52085A-page 3
Emulator User’s Guide for MPLAB X IDE
NOTES:
DS52085A-page 4
2013 Microchip Technology Inc.
MPLAB® REAL ICE™ IN-CIRCUIT
EMULATOR USER’S GUIDE FOR
MPLAB X IDE
Table of Contents
Preface ................................................................................................................. 9
Part 1 – Getting Started
Chapter 1. About the Emulator
1.1 Introduction ................................................................................................... 15
1.2 Emulator Features ........................................................................................ 15
1.3 How the Emulator Helps You ....................................................................... 15
1.4 Emulator System .......................................................................................... 16
1.5 Emulator Kit Components ............................................................................ 17
Chapter 2. Device and Feature Support
2.1 32-Bit (Data Memory) Devices ..................................................................... 20
2.2 16-Bit (Data Memory) Devices ..................................................................... 21
2.3 8-Bit (Data Memory) Devices - PIC18 .......................................................... 22
2.4 8-Bit (Data Memory) Devices - PIC10/12/16 ................................................ 23
Chapter 3. Operation
3.1 Introduction ................................................................................................... 25
3.2 Tools Comparison ........................................................................................ 26
3.3 Operational Overview ................................................................................... 27
3.4 Emulator Communications with the PC and Target ..................................... 28
3.5 Target Communication Connections ............................................................ 32
3.6 Trace Connections ....................................................................................... 35
3.7 Debugging with the Emulator ....................................................................... 38
3.8 Requirements For Debugging ...................................................................... 39
3.9 Programming with the Emulator ................................................................... 41
3.10 Resources Used by the Emulator ............................................................... 41
Part 2 – Features
Chapter 4. General Setup
4.1 Introduction ................................................................................................... 45
4.2 Installation and Setup ................................................................................... 45
4.3 Common Debug Features ............................................................................ 46
4.4 Emulator-Specific Debug Features .............................................................. 46
4.5 Quick Debug/Program Reference ................................................................ 47
4.6 Debugger/Programmer Limitations .............................................................. 47
2013 Microchip Technology Inc.
DS52085A-page 5
Emulator User’s Guide for MPLAB X IDE
Chapter 5. Common Debug Functions
5.1 Introduction ................................................................................................... 49
5.2 Starting and Stopping Emulation .................................................................. 49
5.3 Viewing Processor Memory and Files .......................................................... 50
5.4 Breakpoints and Stopwatch .......................................................................... 50
5.5 External Triggers (Logic Probes) .................................................................. 51
Chapter 6. Specific Debug Functions: 8- and 16-Bit Devices
6.1 Introduction ................................................................................................... 53
6.2 Data Capture and Runtime Watches ............................................................ 53
6.3 Instrumented Trace ...................................................................................... 55
6.4 PC Sampling ................................................................................................ 62
6.5 Application In/Out ......................................................................................... 63
6.6 Additional Debug Features ........................................................................... 65
Chapter 7. Specific Debug Functions: 32-Bit Devices
7.1 Introduction ................................................................................................... 67
7.2 Data Capture and Runtime Watches ............................................................ 67
7.3 PIC32 Instruction Trace ................................................................................ 70
7.4 Instrumented Trace ...................................................................................... 75
7.5 PC Profiling .................................................................................................. 75
7.6 Application In/Out ......................................................................................... 76
7.7 Additional Debug Features ........................................................................... 78
Part 3 – Troubleshooting
Chapter 8. Troubleshooting First Steps
8.1 Introduction ................................................................................................... 81
8.2 The 5 Questions to Answer First .................................................................. 81
8.3 Top Reasons Why You Can’t Debug ........................................................... 81
8.4 Other Things to Consider ............................................................................. 82
Chapter 9. Frequently Asked Questions (FAQ)
9.1 Introduction ................................................................................................... 83
9.2 How The Emulator Works ............................................................................ 83
9.3 How Trace Works – 8 and 16 Bit Devices .................................................... 85
9.4 General Issues ............................................................................................. 87
Chapter 10. Messages
10.1 Introduction ................................................................................................. 91
10.2 Error Messages .......................................................................................... 91
10.3 General Corrective Actions ........................................................................ 96
10.4 Informational Messages ............................................................................. 97
DS52085A-page 6
2013 Microchip Technology Inc.
Table of Contents
Part 4 – Reference
Chapter 11. Emulator Function Summary
11.1 Introduction ............................................................................................... 101
11.2 Emulator Selection and Switching ............................................................ 101
11.3 Emulator Options Selection ...................................................................... 101
11.4 Emulator Windows & Dialogs ................................................................... 107
Chapter 12. Hardware Specification
12.1 Introduction ............................................................................................... 109
12.2 Highlights .................................................................................................. 109
12.3 USB Port/Power ....................................................................................... 109
12.4 Emulator Pod ............................................................................................ 110
12.5 Standard Communication Hardware ........................................................ 112
12.6 Loop-Back Test Board .............................................................................. 114
12.7 Target Board Considerations ................................................................... 114
Chapter 13. Emulator Accessories
13.1 Introduction ............................................................................................... 115
13.2 Highlights .................................................................................................. 115
13.3 High-Speed/LVDS Communication Hardware (Performance Pak) .......... 115
13.4 MPLAB REAL ICE Isolator Unit (Opto-Isolator) ....................................... 120
13.5 MPLAB REAL ICE JTAG Adaptor Board ................................................. 125
13.6 Other Accessories .................................................................................... 130
Support ...................................................................................................................... 131
Appendix A. Revision History .................................................................................. 135
Glossary ..................................................................................................................... 137
Index ........................................................................................................................... 157
Worldwide Sales and Service .................................................................................. 160
2013 Microchip Technology Inc.
DS52085A-page 7
Emulator User’s Guide for MPLAB X IDE
NOTES:
DS52085A-page 8
2013 Microchip Technology Inc.
MPLAB® REAL ICE™ IN-CIRCUIT
EMULATOR USER’S GUIDE FOR
MPLAB X IDE
Preface
NOTICE TO CUSTOMERS
All documentation becomes dated, and this manual is no exception. Microchip tools and
documentation are constantly evolving to meet customer needs, so some actual dialogs
and/or tool descriptions may differ from those in this document. Please refer to our web site
(www.microchip.com) to obtain the latest documentation available.
Documents are identified with a “DS” number. This number is located on the bottom of each
page, in front of the page number. The numbering convention for the DS number is
“DSXXXXXA”, where “XXXXX” is the document number and “A” is the revision level of the
document.
For the most up-to-date information on development tools, see the MPLAB® X IDE help. Select
the Help menu, and then Topics to open a list of available help files.
INTRODUCTION
This chapter contains general information that will be helpful to know before using the
MPLAB REAL ICE in-circuit emulator. Items discussed include:
• Document Layout
• Conventions Used in this Guide
• Recommended Reading
2013 Microchip Technology Inc.
DS52085A-page 9
Emulator User’s Guide for MPLAB X IDE
DOCUMENT LAYOUT
This document describes how to use the MPLAB REAL ICE in-circuit emulator as a
development tool to emulate and debug firmware on a target board, as well as how to
program devices. The document is organized as follows:
Part 1 – Getting Started
• Chapter 1: About the Emulator – What the MPLAB REAL ICE in-circuit emulator
is, and how it can help you develop your application.
• Chapter 2: Operation – The theory of MPLAB REAL ICE in-circuit emulator
operation. Explains configuration options.
Part 2 – Features
• Chapter 3: General Setup – How to set up MPLAB IDE to use the emulator.
• Chapter 4: Common Debug Functions – A description of basic emulator
features available in MPLAB IDE when the MPLAB REAL ICE in-circuit emulator
is chosen as the debug tool. This includes the debug features breakpoints,
stopwatch, and external triggering.
• Chapter 5: Specific Debug Functions: 8- and 16-Bit Devices – A description of
data capture, runtime watches and trace for 8- and 16-bit (data memory) devices.
Includes the types of trace available and how to setup and use trace.
• Chapter 6: Specific Debug Functions: 32-Bit Devices – A description of data
capture, runtime watches and trace for 32-bit devices. Includes hardware and
software setup for use of PIC32 instruction trace.
Part 3 – Troubleshooting
• Chapter 7: Troubleshooting First Steps – The first things you should try if you
are having issues with emulator operation.
• Chapter 8: Frequently Asked Questions (FAQ) – A list of frequently asked
questions about emulator operation and issues.
• Chapter 9: Messages – A list of error messages and suggested resolutions.
Part 4 – Reference
• Chapter 10: Emulator Function Summary – A summary of emulator functions
available in MPLAB IDE when the MPLAB REAL ICE emulator is chosen as the
debug or program tool.
• Chapter 11: Hardware Specification – The hardware and electrical
specifications of the emulator system. Includes a description of how to use the
loop-back test board.
DS52085A-page 10
2013 Microchip Technology Inc.
Preface
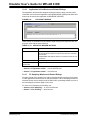
CONVENTIONS USED IN THIS GUIDE
The following conventions may appear in this documentation:
TABLE 1: DOCUMENTATION CONVENTIONS
Description
Represents
Examples
Arial font:
MPLAB® X IDE User’s Guide
Italic
Referenced books
Emphasized text
...is the only compiler...
Initial caps
A window
the Output window
A dialog
the Settings dialog
A menu selection
select Enable Programmer
Quotes
A field name in a window or
dialog
“Save project before build”
Underlined, italic text with
right angle bracket
A menu path
File>Save
Bold
A dialog button
Click OK
A tab
Click the Power tab
Text in angle brackets < >
A key on the keyboard
Press <Enter>, <F1>
Sample source code
#define START
Filenames
autoexec.bat
File paths
c:\mcc18\h
Keywords
_asm, _endasm, static
Command-line options
-Opa+, -Opa-
Bit values
0, 1
Constants
0xFF, ’A’
Italic
A variable argument
file.o, where file can be
any valid filename
Square brackets [ ]
Optional arguments
mpasmwin [options]
file [options]
Curly brackets and pipe
character: { | }
Choice of mutually exclusive
arguments; an OR selection
errorlevel {0|1}
Ellipses...
Replaces repeated text
var_name [,
var_name...]
Represents code supplied by
user
void main (void)
{ ...
}
Courier font:
Plain
2013 Microchip Technology Inc.
DS52085A-page 11
Emulator User’s Guide for MPLAB X IDE
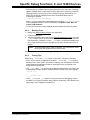
RECOMMENDED READING
This document describes how to use the MPLAB REAL ICE in-circuit emulator. Other
useful documents are listed below. The following Microchip documents are available
and recommended as supplemental reference resources.
Release Notes for MPLAB REAL ICE In-Circuit Emulator
For the latest information on using the emulator, read the release notes under “Release
Notes and Support Documentation” on the Start page. The release notes contain
update information and known issues that may not be included in this user’s guide.
Using the MPLAB REAL ICE In-Circuit Emulator (DS51749)
This poster shows you how to hook up the hardware and install the software for the
MPLAB REAL ICE in-circuit emulator.
MPLAB REAL ICE Isolation Unit Setup (DS51858)
This poster shows you how to hook up the optoisolation unit hardware for high power
applications. This information is also included in this document in
Section 13.4 “MPLAB REAL ICE Isolator Unit (Opto-Isolator)”.
Debugger Design Advisory (DS51764)
A small document on guidelines and implementation considerations to ensure proper
interfacing to the various development tools.
MPLAB REAL ICE In-Circuit Emulator Help File
A comprehensive help file for the emulator is included with MPLAB X IDE. Usage, troubleshooting and hardware specifications are covered. This may be more up-to-date
than the printed documentation. Also, emulator reserved resources and limitations are
listed for various devices.
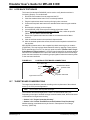
Processor Extension Pak and Header Specification (DS51292)
This booklet describes how to install and use Processor Extension Paks (PEPs) and
related debug headers to better debug selected devices without the loss of pins or
resources. See also the PEP and Header online help file.
Transition Socket Specification (DS51194)
Consult this document for information on transition sockets available for use with
headers.
DS52085A-page 12
2013 Microchip Technology Inc.
MPLAB® REAL ICE™ IN-CIRCUIT
EMULATOR USER’S GUIDE FOR
MPLAB X IDE
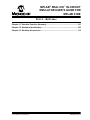
Part 1 – Getting Started
Chapter 1. About the Emulator ................................................................................... 15
Chapter 2. Device and Feature Support..................................................................... 19
Chapter 3. Operation.................................................................................................... 25
2013 Microchip Technology Inc.
DS52085A-page 13
Emulator User’s Guide for MPLAB X IDE
NOTES:
DS52085A-page 14
2013 Microchip Technology Inc.
MPLAB® REAL ICE™ IN-CIRCUIT
EMULATOR USER’S GUIDE FOR
MPLAB X IDE
Chapter 1. About the Emulator
1.1
INTRODUCTION
The MPLAB REAL ICE in-circuit emulator is a modern emulator that supports hardware
and software development for selected Microchip PIC® microcontrollers (MCUs) and
dsPIC® Digital Signal Controllers (DSCs).
An overview of the emulator is provided in this chapter:
•
•
•
•
1.2
Emulator Features
How the Emulator Helps You
Emulator System
Emulator Kit Components
EMULATOR FEATURES
The MPLAB REAL ICE emulation concept has these features:
•
•
•
•
•
•
•
Processors run at maximum speeds
Debugging can be done with the device in-circuit
No emulation load on the processor bus
Simple interconnection
Capability to incorporate I/O data
Instrumented Trace (MPLAB IDE and Compiler Assisted)
PIC32 Instruction Trace (Hardware trace)
In addition to emulator functions, the MPLAB REAL ICE in-circuit emulator system also
may be used as a production programmer.
1.3
HOW THE EMULATOR HELPS YOU
The MPLAB REAL ICE in-circuit emulator is an integral part of the development engineer's toolsuite. Application usage can vary from software development to hardware
integration, to manufacturing test, to field service.
The MPLAB REAL ICE in-circuit emulator system enables you to:
•
•
•
•
•
•
•
•
Debug an application on hardware in real time
Debug with hardware breakpoints
Debug with software breakpoints (device-dependent)
Halt, based on internal events and/or external signals
Monitor internal file registers
Emulate full speed
Program devices as a production programmer
Trace lines of code or log variable/expression values
2013 Microchip Technology Inc.
DS52085A-page 15
Emulator User’s Guide for MPLAB X IDE
1.4
EMULATOR SYSTEM
The MPLAB REAL ICE in-circuit emulator is an in-circuit emulator that is controlled by
a PC running MPLAB X IDE cross-platform software. The emulator communicates with
a device or debug header that has on-board debug/emulation circuitry. A device is usually connected directly to a target board, whereas a header may be connected directly
to or through a transition socket.
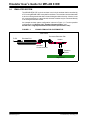
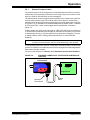
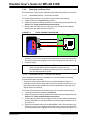
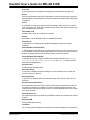
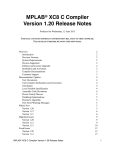
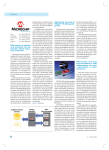
An example emulator system configuration is shown in Figure 1-1. For other possible
configurations, see Section 3.4.1 “Standard Communication” and
Section 3.4.2 “High-Speed/LVDS Communication (Performance Pak)”.
FIGURE 1-1:
EXAMPLE EMULATOR SYSTEM SETUP
SIDE VIEW
Processor Extension Pak
To PC
Emulator Pod
Header
Adapter
Standard
Communications
Transition
Socket
Target Board
DS52085A-page 16
2013 Microchip Technology Inc.
About the Emulator
1.5
EMULATOR KIT COMPONENTS
The components of the MPLAB REAL ICE in-circuit emulator system kit are listed
below.
1. Emulator pod – main unit.
2. USB cable – provides communications between the emulator and a PC and
power to the emulator.
3. Standard driver board and cable – connects the emulator pod to a header module
or target board.
4. Logic probes – used for external triggers and I/O port trace.
5. Loop-back test board – verifies emulator operation.
Additional hardware may be ordered separately. See the Microchip website
(www.microchip.com) for available items. Some popular items are:
• Processor Extension Pak – provides a debug header for standard communications. Contains an ICE header/receiver board and a standard adapter board for
debug headers with 8-pin connectors instead of 6-pin.
• Performance Pak – provides high-speed/LVDS communications. Useful for managing high data rates, noisy environments and long distances between the emulator and the target. Also supports SPI trace.
Contains a high-speed driver board, a high-speed receiver board, a high-speed to
standard converter board, and cables to connect the emulator pod to a target
board.
• Transition socket – connects the debug header to the target.
• MPLAB REAL ICE Isolator unit – optically isolates the emulator from the target. It
is useful for high-power applications.
2013 Microchip Technology Inc.
DS52085A-page 17
Emulator User’s Guide for MPLAB X IDE
NOTES:
DS52085A-page 18
2013 Microchip Technology Inc.
MPLAB® REAL ICE™ IN-CIRCUIT
EMULATOR USER’S GUIDE FOR
Chapter 2. Device and Feature Support
For the specified tools, the following topics show the current and future support for
devices, as well as the device features, depending on the selected device.
Note:
•
•
•
•
MPLAB X IDE Users: For a list of currently supported devices and related
features, click on “Release Notes” on the “Learn & Discover” tab of the Start
Page.
32-Bit (Data Memory) Devices
16-Bit (Data Memory) Devices
8-Bit (Data Memory) Devices - PIC18
8-Bit (Data Memory) Devices - PIC10/12/16
2013 Microchip Technology Inc.
DS52085A-page 19
Emulator User’s Guide for MPLAB X IDE
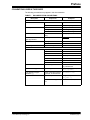
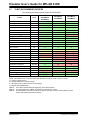
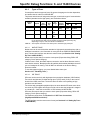
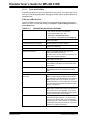
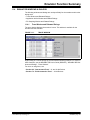
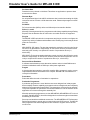
2.1
32-BIT (DATA MEMORY) DEVICES
The following table shows feature support for PIC32 MCUs.
Tools
PIC32MX5xx/
PIC32MX6xx/
PIC32MX7xx
PIC32MX3xx/
PIC32MX4xx
PIC32MX1xx/
PIC32MX2xx
Reset application
All
C
C
C
Run, Halt
All
C
C
C
Single Step
All
C
C
C
Full Speed Emulation
All
C
C
C
Hardware Breakpoints
All
C
C
C
Advanced Breakpoints
RI, ICD3
C
C
C
Software Breakpoints
RI, ICD3
C
C
N
Peripheral Freeze (1)
All
C
C
C
Break on data fetch or write
All
C
C
C
Break on Stack overflow
All
C
C
C
Stopwatch
All
C
C
C
Pass Counter
All
C
C
C
WDT overflow
All
C
C
C
PIC32 Instruction Trace - built-in
RI
D
D
D
Native Trace - built-in
RI
D
N
N
SPI Trace
RI
N
N
N
I/O Port Trace
RI
N
N
N
Trace Macros for C code
RI
D
N
N
RI
C
N
N
RI
C
C(3)
N
Application Input/Output
RI,ICD3
C
N
N
Standard Speed Comm.
All
C
C
C
High Speed Comm. (LVDS)
RI
C
C
C
Processor Pak
All
N
N
N
External triggers (logic probes)
RI
C
C
C
MPLAB REAL ICE Isolator Unit
RI
C
C
C
Feature
Data Capture
(2)
Runtime Watch (2)
Legend:
Tools = MPLAB REAL ICE in-circuit emulator (RI), MPLAB ICD 3 (ICD3), PICkit 3 (PK3), All 3 (All)
C = Current support (Green)
D = Support dependent on device (Yellow)
F = No support now, but planned in the future (Orange)
N = Support Not Available (Red)
Note 1: This feature operates differently depending on the selected device.
Note 2: At speeds higher than 15 MIPS, the Performance Pak may be needed.
Note 3: The Data Monitor and Control Interface can capture data using a form of Runtime Watch for these
devices. Not all data points will be captured.
DS52085A-page 20
2013 Microchip Technology Inc.
Device and Feature Support
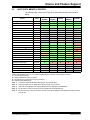
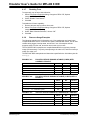
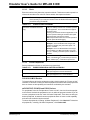
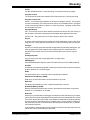
2.2
16-BIT (DATA MEMORY) DEVICES
The following table shows feature support for dsPIC30F/33F DSCs and PIC24F/H
MCUs.
Tools
dsPIC33EP,
PIC24EP
dsPIC33F,
PIC24H
PIC24F
dsPIC30F
SMPS(3)
dsPIC30F
Reset application
All
C
C
C
C
C
Run, Halt
All
C
C
C
C
C
Single Step
All
C
C
C
C
C
Full Speed Emulation
All
C
C
C
C
C
Hardware Breakpoints
All
C
C
C
C
C
Advanced Breakpoints
RI, ICD3
C
C
C
C
C
Software Breakpoints
RI, ICD3
C
C
C
C
C
Feature
Peripheral Freeze
(1)
All
C
C
C
C
C
Break on data fetch or write
All
C
C
C
C
C
Break on Stack overflow
All
N
N
F
F
N
Stopwatch
All
C
C
C
C
N
Pass Counter
All
C
C
C
C
C
All
C
C
C
C
N
WDT overflow
Native Trace - built-in
(2)
RI
C
C
C
C
N
SPI Trace
RI
F
C
C
D(4)
D(4)
I/O Port Trace
RI
F
C
C
D(5)
D(5)
Trace Macros for C code
RI
C
C
C
C
C
Data Capture (2)
RI
C
C
C
C
N
RI
C
C
C
C
N
Runtime Watch
(2)
Application Input/Output
RI,ICD3
C
N
N
N
N
High Speed Comm. (LVDS)
RI
C
C
C
C
C
Processor Pak
All
F
F
D
F
N
External triggers (logic probes)
RI
C
C
C
C
C
MPLAB REAL ICE Isolator Unit
RI
C
C
C
N
N
Legend:
Tools = MPLAB REAL ICE in-circuit emulator (RI), MPLAB ICD 3 (IICD3), PICkit 3 (PK3), All 3 (All)
C = Current support (Green)
D = Support dependent on device (Yellow)
F = No support now, but planned in the future (Orange)
N = Support Not Available (Red)
Note 1: This feature operates differently depending on the selected device.
Note 2: At speeds higher than 15 MIPS, the Performance Pak may be needed.
Note 3: dsPIC30F Switch Mode Power Supply (SMPS) devices: dsPIC30F1010/2020/2023.
Note 4: No SPI Trace for devices with SPI port pins multiplexed with PGC/PGD pins.
Note 5: No I/O Port Trace for devices without a port with a full 8 bits available for trace OR devices with pin counts
of 44 or less.
2013 Microchip Technology Inc.
DS52085A-page 21
Emulator User’s Guide for MPLAB X IDE
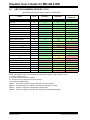
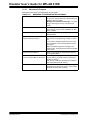
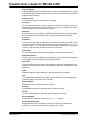
2.3
8-BIT (DATA MEMORY) DEVICES - PIC18
The following table shows feature support for PIC18 MCUs.
Tools
PIC18FxxJ
PIC18FxxK
PIC18F,
PIC18F Enh
Reset application
All
C
C
C
Run, Halt
All
C
C
C
Single Step
All
C
C
C
Full Speed Emulation
All
C
C
C
Hardware Breakpoints
All
C
C
C
Advanced Breakpoints
RI, ICD3
C
C
C
RI, ICD3
C
(3)
C
Feature
Software Breakpoints
Peripheral Freeze
(1)
D
All
C
C
C
Break on data fetch or write
All
C
C
C
Break on Stack overflow
All
C
C
C
Stopwatch
All
C
D(3)
N
Pass Counter
All
C
C
C
All
C
N
N
N
WDT overflow
RI
C
D(4)
SPI Trace
RI
C
C
C
I/O Port Trace
RI
C
C
C
Trace Macros for C code
RI
C
D(4)
C
Data Capture (2)
RI
C
D(4)
N
RI
C
D(4)
N
Application Input/Output
RI,ICD3
N
N
N
Standard Speed Comm.
All
C
C
C
High Speed Comm. (LVDS)
RI
C
C
C
Processor Pak
All
F
D
F
External triggers (logic probes)
RI
C
C
C
MPLAB REAL ICE Isolator Unit
RI
C
N
N
Native Trace - built-in
Runtime Watch
(2)
(2)
Legend:
Tools = MPLAB REAL ICE in-circuit emulator (RI), MPLAB ICD 3 (ICD3), PICkit 3 (PK3), All 3 (All)
C = Current support (Green)
D = Support dependent on device (Yellow)
F = No support now, but planned in the future (Orange)
N = Support Not Available (Red)
Note 1: This feature operates differently depending on the selected device.
Note 2: At speeds higher than 15 MIPS, the Performance Pak may be needed.
Note 3: Families not supported: PIC18F14K22, PIC18F14K50.
Note 4: Families not supported: PIC18F14K22, PIC18F14K50, PIC18F2xK20/4xK20.
DS52085A-page 22
2013 Microchip Technology Inc.
Device and Feature Support
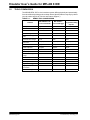
2.4
8-BIT (DATA MEMORY) DEVICES - PIC10/12/16
The following table shows feature support forPIC10/12/16 MCUs.
Feature
Tools
PIC12F/16F1xxx
PIC10F/12F/16F
Reset application
All
C
C
Run, Halt
All
C
C
Single Step
All
C
C
Full Speed Emulation
All
C
C
Hardware Breakpoints
All
C
C
Advanced Breakpoints
RI, ICD3
N
N
Software Breakpoints
RI, ICD3
C
N
Peripheral Freeze (1)
All
C
C
Break on data fetch or write
All
D
N
Break on Stack overflow
All
D
N
Stopwatch
All
D
N
Pass Counter
All
D
N
WDT overflow
All
D
N
Native Trace - built-in (2)
RI
F
N
SPI Trace
RI
N
N
I/O Port Trace
RI
N
N
Trace Macros for C code
RI
N
N
Data Capture (2)
RI
F
N
N
RI
C(3)
Application Input/Output
RI,ICD3
N
N
Standard Speed Comm.
All
C
C
High Speed Comm. (LVDS)
RI
C
C
Processor Pak
All
D
D
External triggers (logic probes)
RI
C
C
MPLAB REAL ICE Isolator Unit
RI
N
N
Runtime Watch
(2)
Legend:
Tools = MPLAB REAL ICE in-circuit emulator (RI), MPLAB ICD 3 (ICD3), PICkit 3 (PK3), All 3
(All)
C = Current support (Green)
D = Support dependent on device (Yellow)
F = No support now, but planned in the future (Orange)
N = Support Not Available (Red)
Note 1: This feature operates differently depending on the selected device.
Note 2: At speeds higher than 15 MIPS, the Performance Pak may be needed.
Note 3: Working At 8MHz or below.
2013 Microchip Technology Inc.
DS52085A-page 23
Emulator User’s Guide for MPLAB X IDE
NOTES:
DS52085A-page 24
2013 Microchip Technology Inc.
MPLAB® REAL ICE™ IN-CIRCUIT
EMULATOR USER’S GUIDE FOR
MPLAB X IDE
Chapter 3. Operation
3.1
INTRODUCTION
A simplified description of how the MPLAB REAL ICE in-circuit emulator system works
is provided here. It is intended to provide enough information so that a target board can
be designed that is compatible with the emulator for both emulation and programming
operations. The basic theory of in-circuit emulation and programming is described so
that problems, if encountered, are quickly resolved.
•
•
•
•
•
•
•
•
•
Tools Comparison
Operational Overview
Emulator Communications with the PC and Target
Target Communication Connections
Trace Connections
Debugging with the Emulator
Requirements For Debugging
Programming with the Emulator
Resources Used by the Emulator
2013 Microchip Technology Inc.
DS52085A-page 25
Emulator User’s Guide for MPLAB X IDE
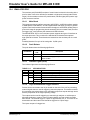
3.2
TOOLS COMPARISON
The MPLAB REAL ICE in-circuit emulator system differs physically and operationally
from other Microchip debug tools as shown below. Specific features may vary by device
(see the online help file for “Device and Feature Support”.)
TABLE 3-1:
DEBUG TOOLS COMPARISON
MPLAB REAL ICE
in-circuit emulator
PICkit 3
MPLAB ICD 3
programmer/debug
in-circuit debugger
express
USB Speed
High and Full
High and Full
Full Only
USB Driver
Microchip
Microchip
HID
USB Powered
Yes
Yes
Yes
Power to Target
No
Yes
Yes
Programmable Vpp and
Vdd
Yes
Yes
Yes
Features
DS52085A-page 26
Vdd Drain from Target
<1ma
<1ma
20ma
Overvoltage/Overcurrent
Protection
Yes (HW)
Yes (HW)
Yes (SW)
Device emulation
Full speed
Full speed
Full speed
HW Breakpoints
Complex
Complex
Simple
Stopwatch
Yes
Yes
Yes
SW Breakpoints
Yes
Yes
No
Non-Volatile Program
Image
No
No
512K bytes
Serialized USB
Yes
Yes
Yes
Trace
Yes
No
No
Data Capture
Yes
No
No
Logic Probe Triggers
Yes
No
No
High Speed/LVDS
Connection
Yes
No
No
Production Programmer
Yes
Yes
No
2013 Microchip Technology Inc.
Operation
3.3
OPERATIONAL OVERVIEW
The emulator is connected to the PC via a USB port for communication and emulator
power (but not target power).
The emulator is connected to the target application for communication and data
collection, such as trace.
Below is a summary of possible connection configurations.
TABLE 3-2:
CONNECTIONS FOR EMULATING 8-BIT AND 16-BIT DEVICES
Connection
Debug Support (1,2)
Speed
Trace Support (1,3)
Standard
Communications
15 MIPS or less
Data Capture,
Runtime Watch
Native Trace
High-Speed
Communications
Greater than 15 MIPS
Data Capture,
Runtime Watch
Native Trace,
SPI Trace
Logic Port Probes (4)
Device Dependent
N/A
I/O Port Trace
Note
Note
Note
Note
1:
2:
3:
4:
Support is device dependent. See online help.
For details see Section 6.2 “Data Capture and Runtime Watches”.
For details see .Section 6.3.3 “Types of Trace”
For details see Section 3.6.3 “I/O Port Trace Connections”.
TABLE 3-3:
CONNECTIONS FOR EMULATING 32-BIT DEVICES
Connection
Speed
Debug Support
(1,2)
Trace Support
(1,3)
Standard Communications or
High-Speed Communications
Device Dependent
Data Capture,
Runtime Watch
N/A
MPLAB REAL ICE Trace
Interface Kit (Logic Port)
Device Dependent
N/A
PIC32
Instruction
Trace
Note 1:
Note 2:
Note 3:
2013 Microchip Technology Inc.
Support is device dependent. See online help.
For details see Section 7.2 “Data Capture and Runtime Watches” and
Section 7.6 “Application In/Out”.
For details see Section 7.3 “PIC32 Instruction Trace”.
DS52085A-page 27
Emulator User’s Guide for MPLAB X IDE
3.4
EMULATOR COMMUNICATIONS WITH THE PC AND TARGET
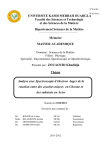
The MPLAB REAL ICE in-circuit emulator system consists of these items:
1. Emulator pod with indicator lights, push buttons and a logic probe connector
2. USB cable to connect a PC to the emulator pod and power the pod
3. Driver board and modular cable(s) to connect the emulator pod to an ICE header
or target board
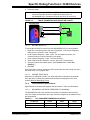
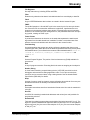
FIGURE 3-1:
BASIC EMULATOR POD
Indicator
Lights
Push Buttons
USB/Power
In-Circuit Emulator
Emulator Pod
(Top)
ACTIVE
STATUS
M
FUNCTION
RESET
Logic Probes
Connector
Driver Board
Slot
Emulator Pod
(Side)
The emulator communicates with the PC and is powered through the USB cable.
The emulator communicates with the target through the configurations discussed in the
following sections.
CAUTION
Do not connect the hardware before installing the software and USB drivers. Also, do
not change hardware connections while the pod or target is powered.
DANGER
If your application uses AC line or high voltage power not referenced to
ground, you should use an isolation circuit. See Section 13.4 “MPLAB
REAL ICE Isolator Unit (Opto-Isolator)”.
DS52085A-page 28
2013 Microchip Technology Inc.
Operation
3.4.1
Standard Communication
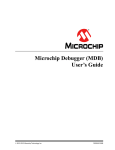
The emulator system can be configured to use the standard connection for communicating debug and programming instructions to the target. This 6-pin connection is the
same one used by other Microchip in-circuit debuggers.
The standard driver board is plugged into the emulator pod to configure the system for
communication with the target. The modular cable can be either (1) inserted into a
matching socket at the target, where the target device is on the target board, as shown
in Figure 3-2, or (2) inserted into a standard adapter/debug header combo – available
as a Processor Pak – which is then plugged into the target board, as shown in
Figure 3-3.
A debug header is a small circuit board with an -ME2/-ICE/-ICD device mounted onto
it. These devices provide debug functionality for production devices that (1) do not have
on-board debug circuitry or (2) cannot afford to lose I/O pins for debugging. For more
on debug headers, see the “Debug Header Specification“ (in “Recommended
Reading”).
Note:
Older debug headers used a 6-pin (RJ-11) connector instead of an 8-pin
connector, so these headers may be connected directly to the emulator.
To see the debug features of a device versus those of a debug header, see the Development Tools Selector on the Development Tools home page on the Microchip website
(http://www.microchip.com/dts).
For more on the hardware, see Section 12.5 “Standard Communication Hardware”.
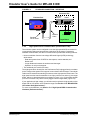
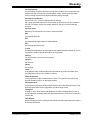
FIGURE 3-2:
STANDARD CONNECTION – DEVICE WITH ON-BOARD ICE
CIRCUITRY
Emulator Pod
ACTIVE
Target Device
or PIM
STATUS
FUNCTION
RESET
Target Board
Standard
Driver Board
2013 Microchip Technology Inc.
Modular
Cable
DS52085A-page 29
Emulator User’s Guide for MPLAB X IDE
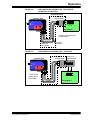
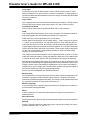
FIGURE 3-3:
STANDARD CONNECTION – ICE DEVICE
Processor Pak
Emulator Pod
Standard
Adapter
Header
Device-ICE
ACTIVE
STATUS
FUNCTION
Standard
Driver Board
3.4.2
RESET
Modular
Cable
Transition Socket
Target Board
High-Speed/LVDS Communication (Performance Pak)
The emulator system can be configured to use the high-speed/LVDS connection for
communicating debug and programming instructions to the target. Compared to
standard communication, this form of communication provides the following features.
• Noise cancellation from the low-voltage differential signal (LVDS) technology,
which allows:
- Data rates greater than 15 MIPS for data capture, runtime watches,and
Native trace.
- Longer distances between the emulator and the target.
- Operation in noisy environments.
• Two additional pins used for SPI trace.
The high-speed driver board (from the Performance Pak) is plugged into the emulator
pod to configure the system for this type of communication with the target. The modular
cables can be inserted into matching connectors at the high-speed receiver board. The
high-speed receiver board is attached via an 8-pin connector into either (1) the target
board, with an on-board target device as shown in Figure 3-4, or (2) the debug header
(from the Processor Pak), which is then plugged into the target board (Figure 3-5).
If your application is high-voltage, you will also need to replace the high-speed receiver
board with an A/C isolator unit to isolate the target. See Section 13.4 “MPLAB REAL
ICE Isolator Unit (Opto-Isolator)”.
For more on the hardware, see Section 13.3 “High-Speed/LVDS Communication
Hardware (Performance Pak)”.
DS52085A-page 30
2013 Microchip Technology Inc.
Operation
FIGURE 3-4:
HIGH-SPEED/LVDS CONNECTION – DEVICE WITH
ON-BOARD ICE CIRCUITRY
Performance Pak
High-Speed
Receiver Board*
Emulator Pod
J3
ACTIVE
J2
Target Device
or PIM
STATUS
FUNCTION
RESET
J2
Target Board
J3
* Replace with isolator unit
for high voltage.
High-Speed
Driver Board
FIGURE 3-5:
LVDS
Cables
HIGH-SPEED/LVDS CONNECTION – ICE DEVICE
Performance Pak
High-Speed
Receiver Board*
Emulator Pod
J3
ACTIVE
J2
Header from
Processor Pak
Device-ICE
STATUS
FUNCTION
RESET
J2
* Replace with
isolator unit for
high voltage.
J3
Transition Socket
Target Board
2013 Microchip Technology Inc.
DS52085A-page 31
Emulator User’s Guide for MPLAB X IDE
3.5
TARGET COMMUNICATION CONNECTIONS
There are two driver boards available to closely match most application requirements.
The standard driver board can be used to connect to the myriad of demo boards and
applications that contain the RJ11 connector. The high-speed driver/receiver board
combination can be used for high-speed communications, for additional trace features,
for large (several feet) emulator-to-target distances and for noisy environments.
3.5.1
Standard Connector
Using the standard driver board, the MPLAB REAL ICE in-circuit emulator is connected
to the target device with the modular interface (six-conductor) cable. The pin numbering for the connector is shown from the bottom of the target PC board in Figure 3-6.
Note:
Cable connections at the emulator and target are mirror images of each
other, i.e., pin 1 on one end of the cable is connected to pin 6 on the other
end of the cable. See Section 12.5.2.1 “Modular Cable Specification”.
FIGURE 3-6:
STANDARD CONNECTION AT TARGET
VDD
PGD
No Connection
2 4 6
PGC
1 3 5
VPP/MCLR
3.5.2
VSS
Bottom of
Target Board
High-Speed/LVDS Connector
Using the high-speed driver/receiver board combination, the MPLAB REAL ICE in-circuit emulator is connected to the target device with an 8-pin interface. The pin numbering for the connector is shown from the top of the target PC board in Figure 3-7.
Note:
Connections from the emulator to the target are shown in
Section 13.3 “High-Speed/LVDS Communication Hardware
(Performance Pak)”.
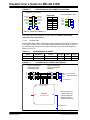
FIGURE 3-7:
HIGH-SPEED CONNECTION AT TARGET
Top of Target Board
J1
1
2
3
4
5
6
7
8
DS52085A-page 32
VPP/MCLR
VDD
VSS
PGD
PGC
No Connection
DAT*
CLK*
* Used for optional SPI trace capability.
See Section 3.6.2 “SPI Trace Connections
(High-Speed/LVDS Connection)”.
2013 Microchip Technology Inc.
Operation
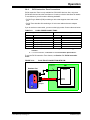
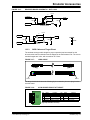
3.5.3
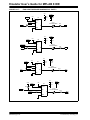
Target Connection Circuitry
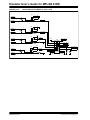
Figure 3-8 shows the interconnections of the MPLAB REAL ICE in-circuit emulator to
the connector on the target board. The diagram also shows the wiring from the connector to a device on the target PC board. A pull-up resistor (typically 10 k) is recommended to be connected from the VPP/MCLR line to VDD so that the line may be
strobed low to reset the device.
FIGURE 3-8:
STANDARD CONNECTION TO TARGET CIRCUITRY
Emulator Pod
Target VDD
STATUS
ACTIVE
FUNCTION
RESET
2
1
5
4
3
Application
PC Board
VDD
4.7K-10K
(typical)
XTAL*
VPP/MCLR
PGC
PGD
VSS AVDD**
AVSS**
Device
* Target device must be running with an oscillator for the emulator to function
as a debugger.
** If the device has AVDD and AVSS lines, they must be connected for
the emulator to operate.
In the following descriptions, only three lines are active and relevant to core emulator
operation: pins 1 (VPP/MCLR), 5 (PGC) and 4 (PGD). Pins 2 (VDD) and 3 (VSS) are
shown on the above diagram for completeness, but are only sensed, not provided or
controlled, by the emulator.
Be aware that the target VDD is sensed by the emulator to allow level translation for target low-voltage operation and to detect a device. If the emulator does not sense voltage
on its VDD line (pin 2 of the interface connector), it will not connect with the device.
Not all devices have the AVDD and AVSS lines, but if they are present on the target
device, all must be connected to the appropriate levels in order for the emulator to operate. This also applies to voltage regulator pins (e.g., ENVREG/DISVREG on PIC24FJ
MCUs).
In general, it is recommended per device data sheet that all VDD/AVDD and VSS/AVSS
lines be connected to the appropriate levels. Also, devices with a VCAP pin (e.g.,
PIC18FXXJ devices) should be connected as close to the device as possible and to the
appropriatly-valued capacitor or other internal regulator device. See your device data
sheet for proper values.
Note:
2013 Microchip Technology Inc.
The interconnection is very simple. Any problems experienced are often
caused by other connections or components on these critical lines that
interfere with the operation of the MPLAB REAL ICE in-circuit emulator system, as discussed in the next section.
DS52085A-page 33
Emulator User’s Guide for MPLAB X IDE
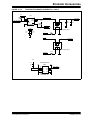
3.5.4
Circuits That Will Prevent the Emulator From Functioning
Figure 3-9 shows the active emulator lines with some components that will prevent the
MPLAB REAL ICE in-circuit emulator system from functioning.
FIGURE 3-9:
IMPROPER CIRCUIT COMPONENTS
Emulator Pod
1
VPP/MCLR
STATUS
ACTIVE
FUNCTION
RESET
No!
No!
No!
5
PGC
4
PGD
No!
No!
For the Vpp/MCLR pin:
• Do not use capacitors on MCLR – they will prevent fast transitions of VPP. A
simple pull-up resistor is generally sufficient.
For the programming pins (PGC/PGD), no componts should be connected, or more
specifically:
• Do not use pull-ups or pull-downs on PGC/PGD – they will affect the voltage
levels, since these lines already have 4.7 k pull-down resistors in the emulator.
• Do not use capacitors on PGC/PGD – they will prevent fast transitions on data
and clock lines during programming and debug communications, and may cause
debugging or programming failures
• Do not use diodes on PGC/PGD – they will prevent bidirectional communication
between the emulator and the target device.
Additional design information may be found in the “Development Tools Design Advisory” (DS51764).
For other operational issues, see:
•
•
•
•
DS52085A-page 34
Chapter 10. “Messages”
Chapter 9. “Frequently Asked Questions (FAQ)”
Section 10.3.6 “Debug Failure Actions” (Top Reasons Why You Can’t Debug)
Section 12.6 “Loop-Back Test Board”
2013 Microchip Technology Inc.
Operation
3.6
TRACE CONNECTIONS
Depending on your selected device, one or more trace capabilities may be available
when the emulator is selected as the debug tool.
3.6.1
Native Trace Connections
No additional connections are necessary to use Native trace. The communications
connection will carry the trace information using the PGD/PGC/EMUC/EMUD pins.
However, the selected device must have this feature. If it does not, one of the other
trace methods may be used.
For more on this type of trace, see Section 6.3.3.1 “Native Trace”.
3.6.2
SPI Trace Connections (High-Speed/LVDS Connection)
Serial trace is an optional trace available using the device SPI and pins 7 (DAT) and 8
(CLK). The device is connected to the target using high-speed/LVDS communication
hardware (Performance Pak) which provides the extra lines for clock and data. The
device does not have to be operating at high speeds to use this feature.
Figure 3-10 shows the proper connections. As with pins 4 (PGD) and 5 (PGC)
(Section 3.5.4 “Circuits That Will Prevent the Emulator From Functioning”), do
not use pull-up or pull-down resistors, capacitors or diodes.
FIGURE 3-10:
SERIAL TRACE CONNECTIONS
Emulator Pod
Application
PC Board
Device
STATUS
ACTIVE
FUNCTION
RESET
1-6
7 DAT
8 CLK
High-Speed/
LVDS
Connection
SPI
SDO (serial data ouptut)
SCK (serial clock)
The DAT and CLK lines are intended for use with devices that do not have built-in
debug logic that allows tracing (Native trace) to use the PGD/PGC/EMUC/EMUD pins.
The DAT line connects to either the target device SPI port SDO1 or SDO2. The CLK
line connects to SCK1 or SCK2.
When you dedicate these pins to tracing, then any multiplexed function on these pins
can no longer be used by the application.
For more on this type of trace, see Section 6.3.3.2 “SPI Trace”.
2013 Microchip Technology Inc.
DS52085A-page 35
Emulator User’s Guide for MPLAB X IDE
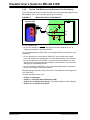
3.6.3
I/O Port Trace Connections
Parallel trace is possible using a device 8-pin I/O port and the emulator logic probes.
This provides greater trace speed and data quantity, but limits emulator-to-target distance by the length of the logic probes. Figure 3-11 shows these additional
connections.
FIGURE 3-11:
PARALLEL TRACE CONNECTIONS
Emulator Pod
5
Device
FUNCTION
STATUS
ACTIVE
RESET
10K
7
7
6:0 PORTx
Logic
Probes
(Use EXT0:7)
Application
PC Board
For this trace configuration, seven (7) lines of data and one (1) line for clock are transmitted. PORTx must be a port with 8 pins that has all 8 pins available for trace. The port
does not have to be one physical port but can be made up of pins from more than one
one port (see Project>Build Options>Project, Trace tab, “I/O Port” drop-down box, for
allowable PORTx configurations). The port pins must not be multiplexed with the
currently-used PGC and PGM pins.
A basic configuration is shown in the following table.
TABLE 3-4:
I/O PORT TRACE CONNECTION EXAMPLE
PORTx pin
Logic Probe pin(1)
Content
0
EXT0
Data
1
EXT1
Data
2
EXT2
Data
3
EXT3
Data
4
EXT4
Data
5
EXT5
Data
6
EXT6
Data
7
Note 1:
2:
EXT7
(2)
Clock
For pin descriptions, see Section 12.4.4 “Logic Probe/External Trigger
Interface”.
Use a 10K pull-down resistor for noise reduction.
As in Section 3.5.4 “Circuits That Will Prevent the Emulator From Functioning”,
do not use pull-up or pull-down resistors, capacitors or diodes on port pins, except as
specified.
For more on this type of trace, see Section 6.3.3.3 “I/O Port Trace”.
DS52085A-page 36
2013 Microchip Technology Inc.
Operation
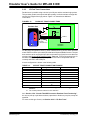
3.6.4
PIC32 Instruction Trace Connections
PIC32 Instruction Trace is only available for PIC32 MCU devices. Also, only some
PIC32 MCU devices have the trace feature. Consult your device data sheet for details.
To use this trace, you will need the following hardware:
• PIC32 Plug-In Module (PIM) containing a device that supports trace and a trace
port
• PIC32 Trace Interface Kit containing a 12-inch trace cable and a trace adapter
board
If you do not have a trace cable, you can use the logic probes. Connect them as below.
TABLE 3-5:
LOGIC PROBE CONNECTIONS
Logic Probe Port Pins(1)
No.
PIM Trace Pins(2)
Name
No.
Name
4
TCLK
1
TRCLK
12
EXT0 (TRIG1)
3
TRD0
11
EXT1 (TRIG2)
5
TRD1
10
EXT2 (TRIG3)
7
TRD2
9
EXT3 (TRIG4)
9
TRD3
Note 1:
For more information, see Section 12.4.4 “Logic Probe/External Trigger
Interface”.
For more information, see Section 7.3.4 “Trace Hardware Specifications”.
2:
To use the PIC32 Instruction Trace feature, see Section 7.3 “PIC32 Instruction
Trace”.
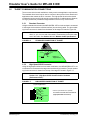
FIGURE 3-12:
PIC32 TRACE CONNECTION WITH PIM
Application
PC Board
5
STATUS
ACTIVE
FUNCTION
RESET
Emulator Pod
2013 Microchip Technology Inc.
PIM
Trace Cable
Device
5
TRD3:0
TRCLK
Trace
Adapter
DS52085A-page 37
Emulator User’s Guide for MPLAB X IDE
3.7
DEBUGGING WITH THE EMULATOR
There are two steps to using the MPLAB REAL ICE in-circuit emulator system as a
debugger. The first requires that an application be programmed into the target device.
The second uses the internal in-circuit debug hardware of the target Flash device to run
and test the application program. These two steps are directly related to the MPLAB
IDE operations:
1. Programming the code into the target and activating special debug functions
(see the next section for details).
2. Debugging the code using features such as breakpoints.
If the target device cannot be programmed correctly, the MPLAB REAL ICE in-circuit
emulator will not be able to debug.
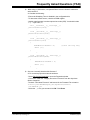
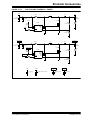
Figure 3-13 shows the basic interconnections required for programming and debugging. Note that this is the same as Figure 3-8, but for the sake of clarity, the VDD and
VSS lines from the emulator are not shown.
FIGURE 3-13:
+5V
PROPER CONNECTIONS FOR PROGRAMMING
Programming
Voltage
VDD
1
Internal Circuits
4.7 k
5
4
VPP/MCLR
PGC
PGD
4.7 k
VSS
A simplified diagram of some of the internal interface circuitry of the MPLAB REAL ICE
in-circuit emulator pod is shown. For programming, no clock is needed on the target
device, but power must be supplied. When programming, the emulator puts programming levels on VPP, sends clock pulses on PGC and serial data via PGD. To verify that
the part has been programmed correctly, clocks are sent to PGC and data is read back
from PGD. This conforms to the ICSP protocol of the device under development. See
the device programming specification for details.
DS52085A-page 38
2013 Microchip Technology Inc.
Operation
3.8
REQUIREMENTS FOR DEBUGGING
To debug (set breakpoints, see registers, etc.) with the MPLAB REAL ICE in-circuit
emulator system, there are critical elements that must be working correctly:
• The emulator must be connected to a PC. It must be powered by the PC via the
USB cable, and it must be communicating with MPLAB IDE software via the USB
cable. See Chapter 5. “Common Debug Functions” for details.
• The emulator must be connected as shown to the VPP, PGC and PGD pins of the
target device with the modular interface cable (or equivalent). VSS and VDD are
also required to be connected between the emulator and target device.
• The target device must have power and a functional, running oscillator, either
internal or external. If the target device will not run, for whatever reason, the
MPLAB REAL ICE in-circuit emulator cannot debug.
• The target device must have its configuration words programmed correctly:
- The oscillator Configuration bits should correspond to RC, XT, etc., depending
upon the target design.
- For some devices, the Watchdog Timer is enabled by default and needs to be
disabled.
- The target device must not have code protection enabled.
- The target device must not have table read protection enabled.
- For some devices with more than one PGC/PGD pair, the correct pair needs
to be configured. This is only needed for debugging since programming will
work over any PGC/PGD pair.
3.8.1
Sequence of Operations Leading to Debugging
Given that the Requirements For Debugging are met, these actions can be performed
when the MPLAB REAL ICE in-circuit emulator is set as the current tool (File>Project
Properties, Embedded category):
• When Debug>Debug Project is selected, the application code is programmed into
the device’s memory via the ICSP protocol as described earlier.
• A small “debug executive” program is loaded into the high area of program memory of the target device. Since the debug executive must reside in program memory, the application program must not use this reserved space. Some devices
have special memory areas dedicated to the debug executive. Check your device
data sheet for details.
• Special “in-circuit debug” registers in the target device are enabled by MPLAB
IDE. These allow the debug executive to be activated by the emulator. For more
on device reserved resources, see the online help file.
• The target device is run in debug mode.
2013 Microchip Technology Inc.
DS52085A-page 39
Emulator User’s Guide for MPLAB X IDE
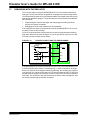
3.8.2
Debugging Details
Figure 3-14 illustrates the MPLAB REAL ICE in-circuit emulator system when it is ready
for debugging.
MPLAB® REAL ICE™ IN-CIRCUIT EMULATOR READY FOR
DEBUGGING
FIGURE 3-14:
VDD
+12V
+5V
1
VPP/MCLR
Internal Circuits
4.7 k
4.7 k
Internal
Debug
Registers
Debug
Executive
PGC
5
Program
Memory
4
Target
must
be
Running
for Debug
Executive
to Function
Area
Reserved
for Debug
Executive
PGD
Hardware
Stack Shared
by Debug Exec
Area Used by
Debug Exec
File
Registers
Typically, in order to find out if an application program will run correctly, a breakpoint is
set early in the program code. When a breakpoint is set from the user interface of
MPLAB IDE, the address of the breakpoint is stored in the special internal debug registers of the target device. Commands on PGC and PGD communicate directly to these
registers to set the breakpoint address.
Next, the Debug>Debug Project function is usually selected in MPLAB IDE. The emulator will then tell the debug executive to run. The target will start from the Reset vector
and execute until the Program Counter reaches the breakpoint address previously
stored in the internal debug registers.
After the instruction at the breakpoint address is executed, the in-circuit debug mechanism of the target device “fires” and transfers control to the debug executive (much
like an interrupt) and the user’s application is effectively halted. The emulator communicates with the debug executive via PGC and PGD, gets the breakpoint status
information and sends it back to MPLAB IDE. MPLAB IDE then sends a series of queries to the emulator to get information about the target device, such as file register contents and the state of the CPU. These queries are ultimately performed by the debug
executive.
The debug executive runs just like an application in program memory. It uses some
locations on the stack for its temporary variables. If the device does not run, for
whatever reason, such as no oscillator, a faulty power supply connection, shorts on the
target board, etc., then the debug executive cannot communicate to the MPLAB REAL
ICE in-circuit emulator and MPLAB IDE will issue an error message.
Another way to stop execution is to select Debug>Pause. This toggles the PGC and
PGD lines so that the in-circuit debug mechanism of the target device switches execution from the user’s code in program memory to the debug executive. Again, the target
application program is effectively halted, and MPLAB IDE uses the emulator
communications with the debug executive to interrogate the state of the target device.
DS52085A-page 40
2013 Microchip Technology Inc.
Operation
3.9
PROGRAMMING WITH THE EMULATOR
Use the MPLAB REAL ICE in-circuit emulator as a programmer to program a production device, i.e., a device not on a debug header. Set the MPLAB REAL ICE in-circuit
emulator as the current tool (File>Project Properties, Advanced, MPLAB Environment)
to perform these actions:
• When Run>Run Project is selected, the application code is programmed into the
device’s memory via the ICSP protocol as described above. No target oscillator
clock is required while programming, and all modes of the processor can be programmed, including code protect, Watchdog Timer enabled and table read protect.
• A small “program executive” program may be loaded into the high area of
program memory for some target device. This increases programming speeds for
devices with large memories.
• Special “in-circuit debug” registers in the target device are disabled by MPLAB
IDE, along with all debug features. This means that a breakpoint cannot be set,
and register contents cannot be seen or altered.
• The target device is run in release mode. As a programmer, the emulator can only
toggle the MCLR line to reset and start the target.
3.10
RESOURCES USED BY THE EMULATOR
For a complete list of resources used by the emulator for your device, please see the
online help file in MPLAB IDE for the MPLAB REAL ICE in-circuit emulator.
2013 Microchip Technology Inc.
DS52085A-page 41
Emulator User’s Guide for MPLAB X IDE
NOTES:
DS52085A-page 42
2013 Microchip Technology Inc.
MPLAB® REAL ICE™ IN-CIRCUIT
EMULATOR USER’S GUIDE FOR
MPLAB X IDE
Part 2 – Features
Chapter 4. General Setup ............................................................................................ 45
Chapter 5. Common Debug Functions....................................................................... 49
Chapter 6. Specific Debug Functions: 8- and 16-Bit Devices .................................. 53
Chapter 7. Specific Debug Functions: 32-Bit Devices.............................................. 67
2013 Microchip Technology Inc.
DS52085A-page 43
Emulator User’s Guide for MPLAB X IDE
NOTES:
DS52085A-page 44
2013 Microchip Technology Inc.
MPLAB® REAL ICE™ IN-CIRCUIT
EMULATOR USER’S GUIDE FOR
MPLAB X IDE
Chapter 4. General Setup
4.1
INTRODUCTION
How to get started using the MPLAB REAL ICE in-circuit emulator is discussed.
•
•
•
•
•
4.2
Installation and Setup
Common Debug Features
Emulator-Specific Debug Features
Quick Debug/Program Reference
Debugger/Programmer Limitations
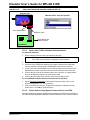
INSTALLATION AND SETUP
Refer to the Help file “Getting Started with MPLAB X IDE” for details on installing the
IDE and setting up the emulator to work with it.
In summary:
1. Install MPLAB X IDE.
2. Install the USB drivers as specified.
3. Connect to the PC. For infomation on target and trace connections, see
Chapter 3. “Operation”.
Note:
The emulator CANNOT power a target board.
4. Install the language toolsuite/compiler you want to use for development.
5. Launch MPLAB X IDE.
6. Use the New Project wizard (File>New Project) to add your “Real ICE” emulator
to your project.
7. Use the project Properties dialog (File>Project Properties) to set up emulator
options.
8. Run the project (build and run) from Run>Run Project.
Items of note are:
1. Installing USB drivers on Windows OS systems requires following specific
instructions. See MPLAB X IDE documentation for details.
2. Each emulator contains a unique identifier which, when first installed, will be
recognized by the OS, regardless of which computer USB port is used.
3. MPLAB X IDE operation connects to the hardware tool at runtime (Run or Debug
Run). To always be connected to the hardware tool (like MPLAB IDE v8), click in
the Tools>Options, Embedded button, Generic Settings tab, “Keep hardware
tool connected” checkbox.
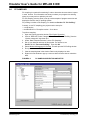
4. Configuration bits must now be set in code. They can only be viewed in the
Configuration bits window (Window>Memory, Format drop-down set as “Code”,
Memory drop-down set as “Configuration Bits”.)
2013 Microchip Technology Inc.
DS52085A-page 45
Emulator User’s Guide for MPLAB X IDE
4.3
COMMON DEBUG FEATURES
Refer to the Help file “Getting Started with MPLAB X IDE”, Debugging Code section,
for details on debug features. This section includes:
1.
2.
3.
4.
5.
6.
4.4
Debug Running the Project (build, program and run) from Debug>Debug Project.
Using Breakpoints
Stepping Through Code
Using the Watch Window
Viewing Memory, Variables and the Call Stack
Using the Call Graph
EMULATOR-SPECIFIC DEBUG FEATURES
Emulator-specific debug features can be found under:
• Chapter 5. “Common Debug Functions”
• Chapter 6. “Specific Debug Functions: 8- and 16-Bit Devices”
• Chapter 7. “Specific Debug Functions: 32-Bit Devices”
Debug features in these sections include:
•
•
•
•
Breakpoints and Stopwatch
External Triggers (Logic Probes)
Data Capture, Runtime Watches and the DMCI
Trace
If errors occur, see:
• Part 4 – “Troubleshooting”
• Section 12.6 “Loop-Back Test Board”
DS52085A-page 46
2013 Microchip Technology Inc.
General Setup
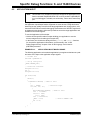
4.5
QUICK DEBUG/PROGRAM REFERENCE
The following table is a quick reference for using the MPLAB REAL ICE in-circuit emulator as either a debug or program tool. Please see previous chapters for information
on proper emulator setup and configuration.
TABLE 4-1:
DEBUG VS. PROGRAM OPERATION
Item
Debug
Needed Hardware
Program
A PC and target application (Microchip demo board or your own design.)
Emulator pod, USB cable, communication driver board(s) and cable(s).
Device with on-board debug circuitry or Device (with or without on-board debug
debug header with special
circuitry.)
-ME2/-ICE/-ICD device.
MPLAB IDE selection
Project Properties, REAL ICE as Hardware Tool
Debug>Debug Run
Program Target Project toolbar button
Program operation
Programs appliation code into the
device. Depending on the selections on
the Project Properties dialog, this can
be any range of program memory.
In addition, a small debug executive is
placed in program memory and other
debug resources are reserved.
Programs appliation code into the
device. Depending on the selections on
the Project Properties dialog, this can
be any range of program memory.
Debug features available
All for device - breakpoints, trace, etc.
N/A.
Command-line operation
N/A
Use REALICECMD, found by default
in: C:\Program Files\Microchip\MPLAB IDE\Programmer
Utilities\RealICE.
Serial Quick-Time Programming
(SQTP)
N/A
Use the MPLAB PM3 to generate the
SQTP file. Then use REALICECMD to
program the device.
4.6
DEBUGGER/PROGRAMMER LIMITATIONS
For a complete list of emulator limitations for your device, please see the online help
file in MPLAB IDE for the MPLAB REAL ICE in-circuit emulator.
2013 Microchip Technology Inc.
DS52085A-page 47
Emulator User’s Guide for MPLAB X IDE
NOTES:
DS52085A-page 48
2013 Microchip Technology Inc.
MPLAB® REAL ICE™ IN-CIRCUIT
EMULATOR USER’S GUIDE FOR
MPLAB X IDE
Chapter 5. Common Debug Functions
5.1
INTRODUCTION
Common MPLAB REAL ICE in-circuit emulator debug functions are discussed.
•
•
•
•
5.2
Starting and Stopping Emulation
Viewing Processor Memory and Files
Breakpoints and Stopwatch
External Triggers (Logic Probes)
STARTING AND STOPPING EMULATION
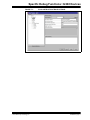
To debug an application in MPLAB X IDE, you must create a project containing your
source code so that the code may be built, programmed into your device, and executed
as specified below:
• To run your code, select either Debug>Debug Project or Debug Project from the
Run toolbar.
• To halt your code, select either Debug>Pause or Pause from the Debug toolbar.
• To run your code again, select either Debug>Continue or Continue from the
Debug toolbar.
• To step through your code, select either Debug>Step Into or Step Into from the
Debug toolbar. Be careful not to step into a Sleep instruction or you will have to
perform a processor Reset to resume emulation.
• To step over a line of code, select either Debug>Step Over or Step Over from the
Debug toolbar.
• To end code execution, select either Debug>Finish Debugger Session or Finish
Debugger Session from the Debug toolbar.
• To perform a processor Reset on your code, select either Debug>Reset or Reset
from the Debug toolbar. Additional Resets, such as POR/BOR, MCLR and
System, may be available, depending on device.
2013 Microchip Technology Inc.
DS52085A-page 49
Emulator User’s Guide for MPLAB X IDE
5.3
VIEWING PROCESSOR MEMORY AND FILES
MPLAB X IDE provides several windows for viewing debug and various processor
memory information, selectable from the Window menu. See MPLAB IDE online help
for more information on using these windows.
• Window>PIC Memory Views - View the different types of device memory.
Depending on the selected device, memory types include Program Memory
SRFs, Configuration Memory, etc.
• Window>Debugging - View debug information. Select from varibles, watches, call
stack, breakpoints, stopwatch, and trace.
Trace is discussed more thoroughly in upcoming chapters.
To view your source code, find the source code file you wish to view in the Project window and double click to open in a File window. Code in this window is color-coded
according to the processor and build tool selected. To change the style of color-coding,
select Tools>Options, Fonts & Colors, Syntax tab.
For more on the Editor, see NetBeans Help, IDE Basics>Basic File Features.
5.4
BREAKPOINTS AND STOPWATCH
Use breakpoints to halt code execution at specified lines in your code. Use the
stopwatch with breakpoints to time code execution.
• Breakpoint Resources
• Hardware or Software Breakpoint Selection
• Breakpoint and Stopwatch Usage
5.4.1
Breakpoint Resources
For 16-bit devices, breakpoints, data captures, and runtime watches use the same
resources. So, the available number of breakpoints is actually the available number of
combined breakpoints/triggers.
For 32-bit devices, breakpoints use different resources than data captures and runtime
watches. So, the available number of breakpoints is independent of the available
number of triggers.
The number of hardware and software breakpoints available and/or used is displayed
in the Dashboard window (Window>Dashboard). See the MPLAB IDE documentation
for more on this feature. Not all devices have software breakpoints.
For limitations on breakpoint operation, including the general number of hardware
breakpoints per device and hardware breakpoint skidding amounts, see “Limitations”
in the online help file.
DS52085A-page 50
2013 Microchip Technology Inc.
Common Debug Functions
5.4.2
Hardware or Software Breakpoint Selection
The following table compares hardware and software breakpoints:
TABLE 5-1:
HARDWARE VS. SOFTWARE BREAKPOINTS
Feature
HW Breakpoints
SW Breakpoints
Number of breakpoints
Limited
Unlimited
Breakpoints written to*
Debug registers
Program memory
Breakpoints applied to**
Memory registers
Code
Time to set breakpoints
Minimal
Oscillator speed dependent;
programming Flash memory
Breakpoint skidding
Most devices. See the online
help, Limitations section, for
details.
No
* Where information about the breakpoint is written in the device.
** What kind of device feature applies to the breakpoint. This is where the breakpoint is set.
To select hardware or software breakpoints:
1. Select your project in the Project window. Then select either File>Project
Properties or right click and select “Properties”.
2. In the Project Properties dialog, select “REAL ICE” under “Categories”.
3. Under “Option Categories” select “Debug Options”.
4. Check “Use software breakpoints” to use software breakpoints. Uncheck to use
hardware breakpoints.
Note:
5.4.3
Using software breakpoints for debug impacts device endurance.
Therefore, it is recommended that devices used in this manner not be
used as production parts.
Breakpoint and Stopwatch Usage
Breakpoints halt execution of code. To determine the time between the breakpoints,
use the stopwatch.
Please refer to the MPLAB X IDE Help for how to set up and use breakpoints and the
stopwatch.
5.5
EXTERNAL TRIGGERS (LOGIC PROBES)
Use external triggers to set up hardware triggers using the logic probes. All pins
(whether used or unused) should either be pulled up or grounded. Floating pins may
produce false triggers.
External triggers can be used as input to halt program execution when an external
event occurs. They can also be used as output to control external devices.
To use probe pins as inputs, you must provide the circuitry to drive them (see Table
12-3: “Logic Probe Electrical Specifications” for drive levels.)
You will not be able to use external triggers if you are using the logic probe port for
another debug feature such as:
• I/O Port trace (see Section 6.3.3.3 “I/O Port Trace”.)
• PIC32 Instruction trace (see Section 7.3 “PIC32 Instruction Trace”.)
For more on external trigger hardware, see Section 12.4.4 “Logic Probe/External
Trigger Interface”.
2013 Microchip Technology Inc.
DS52085A-page 51
Emulator User’s Guide for MPLAB X IDE
NOTES:
DS52085A-page 52
2013 Microchip Technology Inc.
MPLAB® REAL ICE™ IN-CIRCUIT
EMULATOR USER’S GUIDE FOR
MPLAB X IDE
Chapter 6. Specific Debug Functions: 8- and 16-Bit Devices
6.1
INTRODUCTION
The following debug functions are specific to 8- and 16-bit devices.
•
•
•
•
•
6.2
Data Capture and Runtime Watches
Instrumented Trace
PC Sampling
Application In/Out
Additional Debug Features
DATA CAPTURE AND RUNTIME WATCHES
Not all 8- and 16-bit devices support data capture and/or runtime watches. A list of
supported features by device is available in online help.
For 8- and 16-bit devices, breakpoints, data captures and runtime watches use the
same resources. Therefore, setting a data capture or runtime watch uses the resource
for the selected symbol. An 8-bit PIC can only watch 8-bit variables and a 16-bit PIC
can only watch 16-bit variable.
For data captures and runtime watches at speeds higher than 15 MIPS, the Performance Pak may be needed. The actual cutoff speed may vary depending on layout,
noise, and similar considerations.
• Data Capture and DMCI
• Runtime Watches and the Watch Window
2013 Microchip Technology Inc.
DS52085A-page 53
Emulator User’s Guide for MPLAB X IDE
6.2.1
Data Capture and DMCI
Data capture provides streaming data from a device to the following:
• Data Monitoring and Control Interface (DMCI) – Plug-in
To install the DMCI plug-in:
1.
2.
3.
4.
Select Tools>Plugins. The Plugins window will open.
Click on the Available Plugins tab.
Find DMCI and check the checkbox next to it.
Click Install and follow the screens.
See also the “Add Plug-in Tools” in the “Additional Tasks” section of the MPLAB X IDE
help file.
To set up data capture:
1. Build the project (In the Projects window, right click on the project name and
select “Build”). The project must be built to see the available symbols.
2. Select Window>Debugging>Watches to open the Watches window.
3. Right click in the window and select “New Watch”. Select the symbol or SFR wish
to watch in the New Watch window. Click OK.
4. Right click on the project and select “Properties” to open the Project Properties
dialog. Then click on the “Real ICE” category and select the “Clock” option
category. Enter instruction speed information.
5. Select Tools>Embedded>DMCI>DMCI Window to open the DMCI dialog.
6. Set up the DMCI for this data capture. See the DMCI help file for details
(Help>Help Contents, “Plug-In Tools” section).
7. Begin a debug session (Debug>Debug Project). Input data using DMCI controls
or view data in a DMCI graphical window.
6.2.2
Runtime Watches and the Watch Window
A runtime watch provides updating of a variable in the following windows during
program execution instead of on halt:
• Watches – Window > Debugging menu
• Memory – Window > PIC Memory Views menu
To set up runtime watches:
1. Build the project (In the Projects window, right click on the project name and
select “Build”). The project must be built to see the available symbols.
2. Select Window>Debugging>Watches to open the Watches window.
3. Right click in the window and select “New Runtime Watch”. Select the symbol or
SFR wish to watch in the New Run Time Watch window. Click OK.
4. Right click on the project and select “Properties” to open the Project Properties
dialog. Then click on the “Real ICE” category and select the “Clock” option
category. Enter instruction speed information.
5. Begin a debug session (Debug>Debug Project). Watch variable values change
in the Watch window.
6. Pause (halt) and open another window containing the watched variable. Continue the program and watch the values change in this window.
DS52085A-page 54
2013 Microchip Technology Inc.
Specific Debug Functions: 8- and 16-Bit Devices
6.3
INSTRUMENTED TRACE
This section will discuss the available types of instrumented trace and how to use them.
6.3.1
Requirements for Trace
The following is required to use trace:
• Devices that support trace. See “MPLAB X IDE Limitations” on the “Learn &
Discover” tab of the Start Page.
• In-line assembly code (assembly code within C code) cannot be traced.
6.3.2
How Trace Works
Trace for the MPLAB REAL ICE in-circuit emulator (Instrumented Trace) is a solution
for providing basic trace information. Through the use of TRACE() and LOG() macros,
you can report program locations or variable values to MPLAB IDE while the application is running and examine them via the Trace window once the application halts. You
may type these macro names in manually or right click in the editor and select the
macro to be inserted from the context menu. To log a variable value, the variable should
be highlighted before selecting from the context menu.
FIGURE 6-1:
2013 Microchip Technology Inc.
EXAMPLE OF INSERTED LOG MACRO
DS52085A-page 55
Emulator User’s Guide for MPLAB X IDE
There are three trace methods available at this time (see Section 6.3.3 “Types of
Trace”). The methods can be found on the Project Properties dialog, REAL ICE Category, Trace Options Category page. The choices include Native Trace (utilizes
PGC/PGD communication lines), SPI Trace, and I/O Port Trace. Not every method is
available on every part; i.e., the options are device specific. The Instrumented Trace
library supports C and assembly projects on PIC18F MCU devices, but only C projects
on 16-bit devices.
FIGURE 6-2:
BUILD OPTIONS TRACE TAB – NATIVE TRACE SELECTION
The trace and log information transmitted is identical regardless of the trace method
used. For TRACE(), a single value in the range of 64-127 is sent. A label generated
using this number is automatically inserted into the code, so MPLAB IDE can identify
in the trace buffer the location that sent the value. For LOG(), a two-byte header is sent
followed by the value of the variable being logged. The first byte indicates the variable
type and is a value between 0 and 63. The second byte indicates the location which
sent the variable. Here, the location is represented by a value between 0 and 127. (See
Section 6.3.9 “More on Trace/Log ID Numbers”.)
Interrupts are disabled during every TRACE() and LOG() call. This is to ensure that
trace or log statements at an interrupt level do not interfere with a trace or log statement
that may already be in progress at the application level. A similar argument holds for
protecting statements within a low priority interrupt from being corrupted by those from
a high priority interrupt.
DS52085A-page 56
2013 Microchip Technology Inc.
Specific Debug Functions: 8- and 16-Bit Devices
6.3.3
Types of Trace
Currently there are three types of trace. All types are language tool version dependent,
and stream data in real time to MPLAB IDE.
The pluses and minuses of using each trace type, as well as the type of communication
available (standard and/or high-speed), are summarized below.
Type of
Trace
Speed
(1)
Code
Size
Impact
Large
Native Trace
Fast
SPI Trace
Faster(1) Medium
I/O Port Trace Fastest
Note 1:
Note 2:
6.3.3.1
Small
Real
Time
Op
Pin
Usage
Device
Feature
Needed
Communication
Std
HS
Close
None
Built-in
debug
15 MIPS
or less
Greater than
15 MIPS
Closer
SPI
pins
SPI
No
Yes
None
Yes(2)
Yes(2)
Closest 8-pin
port
For Native trace running at speeds higher than 15 MIPS and for SPI Trace capability, the Performance Pak may be needed. The actual cutoff speed may vary
depending on layout, noise, and similar considerations.
Also requires connection from device port to emulator logic probe port.
NATIVE TRACE
Native trace can be used with either standard or high-speed communications, with no
additional connections - the information is conveyed via the PGD/PGC/EMUC/EMUD
pins. This two-wire interface uses the trace macro format (see Section 6.3.4 “Setting
Up Trace in MPLAB IDE”).
Native trace requires that you enter the clock speed (Properties dialog, REAL ICE
category, Clock options category.)
If Native trace is used, then data captures cannot be used as these features use the
same device resource. Breakpoints are still available but be aware that Native trace will
use one breakpoint for tracing. This will NOT be reflected on the Device Debug
Resource toolbar.
To use data capture triggers, you must disable Native trace (see
Section 6.3.7 “Disabling Trace”).
6.3.3.2
SPI TRACE
SPI trace can be used only with high-speed communication hardware (LVDS cables).
Trace clock and data are provided through pins 7 (DAT) and 8 (CLK) on the receiver
board of the LVDS connection. The device does not have to be operating at high
speeds to use this feature.
For devices with remappable peripheral pins, be aware that the SPI trace macro does
not touch any PPS register and does not need to know how the peripheral is mapped
to a certain pin - it will write to the SPI1 or SPI2 selected in MPLAB IDE.
SPI trace does require that you enter the clock speed (Properties dialog, REAL ICE
category, Clock options category.)
For hardware connections, see Section 3.6.2 “SPI Trace Connections
(High-Speed/LVDS Connection)”.
The SPI interface uses the trace macro format (see Section 6.3.4 “Setting Up Trace
in MPLAB IDE”).
2013 Microchip Technology Inc.
DS52085A-page 57
Emulator User’s Guide for MPLAB X IDE
6.3.3.3
I/O PORT TRACE
I/O Port trace can be used with either standard or high-speed communications. Trace
clock and data are provided from a device 8-pin I/O port through the MPLAB REAL ICE
in-circuit emulator logic probe connector.
The I/O port must have all 8 pins available for trace. The port must not be multiplexed
with the currently-used PGC and PGM pins. Therefore, review the data sheet of the
selected device to determine the uninitialized/default port pin states and change them
as necessary.
For hardware connections, see Section 3.6.3 “I/O Port Trace Connections”.
The port interface uses the trace macro format (see Section 6.3.4 “Setting Up Trace
in MPLAB IDE”).
6.3.4
Setting Up Trace in MPLAB IDE
To set up MPLAB X IDE to use trace for the MPLAB REAL ICE in-circuit emulator:
1. Right click on the project name and select “Properties”. In the Project Properties
dialog click on “Real ICE” under “Categories”.
2. Under “Option categories”, select “Clock”. For data capture and trace, the emulator needs to know the instruction cycle speed.
3. Under “Option categories”, select “Trace and Profiling”.
4. Under “Data Collection Selection”, choose “User Instrumented Trace”.
5. Under “Communications Medium” choose either Native, I/O PORT or SPI trace.
6. Set up any other trace-related options. (See Section 11.3.1 “Trace and
Profiling”.)
7. Click OK.
Next, enter trace macros in your application code.
• To record a PC location, click on or highlight a line of code and then right click to
select “Insert Language Line Trace” fro m the pop-up menu, where Language can
be either C or ASM. This causes the following macro line to be inserted above the
selected line:
__TRACE(id);
where id is a line trace number auto-generated during the build. For more
information, see Section 6.3.9 “More on Trace/Log ID Numbers”.
Note:
DS52085A-page 58
Inserting a macro into code may modify the logic flow of the program.
Please be sure that braces are present where necessary.
2013 Microchip Technology Inc.
Specific Debug Functions: 8- and 16-Bit Devices
• The recording of a variable value is performed much in the same way. First highlight the variable name or expression and then right click to select “Log Selected
Language Value” from the pop-up menu, where Language can be either C or
ASM. This causes the following macro line to be inserted above the line
containing the variable:
__LOG(id,selected variable);
where id is a log number auto-generated during build and selected variable
is the highlighted variable. For more information, see Section 6.3.9 “More on
Trace/Log ID Numbers”.
• To remove a trace point, simply highlight and then delete the Trace/Log macro.
6.3.5
Running Trace
1. Debug Run (Debug>Debug Project) your application.
2. Pause the application.
3. View the trace data in the Trace window (Window>Debugging>Trace). For each
__TRACE macro, the line of code following the macro will appear in the trace window each time it is passed. For each __LOG macro, the selected variable in the
line of code following the macro will appear in the trace window each time it is
passed.
Note:
To trace multiple lines of code or variables, you must place a macro
before each line/variable that you wish to trace.
Repeat these steps each time you change a trace point.
6.3.6
Tracing Tips
When using __TRACE and __LOG macros in your code, consider the following:
• Focus on one area of an application and place __TRACE and __LOG macros so
that they form a “flow” in the Trace window. That way, you can follow the execution
flow and debug the application based on missing/incorrect trace points or an
abrupt end to the trace flow.
• Use __TRACE and __LOG macros with conditional statements in your code to aid
in debugging. Example: When a variable reaches a certain value, start logging it.
If(var > 5)
{
__LOG(ID, var)
}
• Leave __TRACE and __LOG macros in your code for future debugging, if this is
allowable. (For Project Properties dialog, REAL ICE Category, Trace Options Category page, select “Disable Trace Macros“.)
2013 Microchip Technology Inc.
DS52085A-page 59
Emulator User’s Guide for MPLAB X IDE
6.3.7
Disabling Trace
To temporarily turn off trace data collection:
1. Select File>Project Properties dialog, Categories: REAL ICE, Options
categories: Trace and Profiling.
2. Check “Disable Trace Macros”.
3. Click OK.
To disable the full trace capability:
1. Remove all trace and log macros from code.
2. Select File>Project Properties dialog, Categories: REAL ICE, Options
categories: Trace and Profiling.
3. Under “Data Collection Selection”, choose “Off”.
4. Click OK.
6.3.8
Resource Usage Examples
The following examples are for illustration only. Your results may vary based upon
compiler/assembler version, command line options, MPLAB IDE version, size of data
variable being logged, interrupt state, and device in use. All examples include
argument setup, function call, and return time in their cycle counts.
The PIC18FXXJ MCU examples are compiled/assembled for non-priority interrupt
usage (30 instructions). For priority interrupt usage, the value is 57; and for no interrupt
usage, the value is 15.
The dsPIC33F DSC examples show 9 instructions specified in the 16-bit library size for
memcpy().
EXAMPLE 6-1:
PIC18FXXJ DEVICE RUNNING AT 4MHZ (1 MIPS) WITH
ASSEMBLY PROJECT
Library Size (in instructions)
SPI
I/O Port
23 + 30
37 + 30
25 + 30
GPRs Used (in bytes)
8
6
6
__TRACE(id) instruction cycles
80
54
42
__LOG(id, BYTE) instruction cycles
168
90
57
EXAMPLE 6-2:
PIC18FXXJ DEVICE RUNNING AT 40MHZ (10 MIPS) WITH C
PROJECT
Library Size (in instructions)
GPRs Used (in bytes)
Native
SPI
I/O Port
75 + 30
87 + 30
112 + 30
10
8
8
__TRACE(id) instruction cycles
79
71
55
__LOG(id, INT) instruction cycles
225
169
162
EXAMPLE 6-3:
dsPIC33F DEVICE RUNNING AT 10 MIPS WITH C PROJECT
Library Size (in instructions)
DS52085A-page 60
Native
Native
SPI
I/O Port
87 + 9
92 + 9
93 + 9
GPRs Used (in bytes)
18
14
0
__TRACE(id) instruction cycles
80
53
32
__LOG(id, INT) instruction cycles
212
124
106
2013 Microchip Technology Inc.
Specific Debug Functions: 8- and 16-Bit Devices
EXAMPLE 6-4:
dsPIC33F DEVICE RUNNING AT 16 MIPS WITH C PROJECT
Native
SPI
I/O Port
__TRACE(id) instruction cycles
88
53
32
__LOG(id, INT) instruction cycles
227
138
106
EXAMPLE 6-5:
dsPIC33F DEVICE RUNNING AT 34 MIPS WITH C PROJECT
Native
SPI
I/O Port
__TRACE(id) instruction cycles
100
53
32
__LOG(id, INT) instruction cycles
251
152
106
6.3.9
More on Trace/Log ID Numbers
MPLAB IDE will automatically generate the ID numbers required for a trace or log
macro. However, to understand the method behind the numbering, read further.
You can have 64 trace points and 128 log points. These limits are determined by port
trace (8 bits). Bit 7 is used as a clock, thus leaving 7 bits for data (128). Bit 6 is a flag
which indicates a trace record instead of a log record.
For a trace record (bit 6 is 1), the low order bits represent the trace number (nnnnnn).
You could say 0-63 are the legal trace numbers and require the trace flag be set, but it
was just easier to combine the flag with the number and say the valid numbers are
64-127.
clock
bit 7
1
n
n
n
n
n
n
bit 0
For a log record (bit 6 is 0), the low order bits identify the data type (t) and the log
number is sent in the next byte (nnnnnnn), thus freeing up a full 128 values.
6.3.10
clock
bit 7
0
t
t
t
t
t
t
bit 0
clock
bit 7
n
n
n
n
n
n
n
bit 0
Quick Trace Reference
If you are new to using the MPLAB REAL ICE in-circuit emulator trace feature, it is
recommended that you read through the entire trace section for a full understanding.
Use this section as a quick reference for trace.
1. Select File>Project Properties dialog, Categories: REAL ICE, Options categories: Trace. Enable trace, choose the type of trace and set other trace options.
2. Select Window>Debugging>Trace to open the trace window in which to view
trace data.
3. Right click in your code to enter trace macros (__TRACE, __LOG) as desired.
4. Debug Run your project.
2013 Microchip Technology Inc.
DS52085A-page 61
Emulator User’s Guide for MPLAB X IDE
6.4
PC SAMPLING
PC sampling is a method for examining C code to determine how much time is spent
in each function. This information can show you where your program time is being
spent so you may work to optimize your code.
For PC sampling, a device timer is set up to take samples of program execution and
display the results in the PC profiling window.
PC profiling is similar to PC sampling. For details see Section 7.5 “PC Profiling”.
Currently, to use PC sampling your project must be set up for:
• a 16-bit device
• the MPLAB XC16 C Compiler version 1.10 or above
To perform sampling:
1. Open the Project properties window (File>Project Properties).
2. Click on “REAL ICE” under “Categories” and select “Trace and Profiling” from the
“Options categories” drop-down box.
3. Under “Data Collection Selection”, select “PC Sampling”.
4. Set up your data file and timer in this window. For reference, see
Section 11.3.1 “Trace and Profiling”. Then click OK.
5. Select Window>Debugging>PC Profiling. This will open the PC Profiling window.
6. Run your code and then halt.
7. View the sampling data in the window. Data is only displayed on halt.
8. Right click in the window to pop up a menu to either clear the data or reload the
data.
FIGURE 6-3:
DS52085A-page 62
PC SAMPLING SELECTION AND SETUP
2013 Microchip Technology Inc.
Specific Debug Functions: 8- and 16-Bit Devices
6.5
APPLICATION IN/OUT
Note:
This window is only available for devices that support the application in/out
function used with the MPLAB REAL ICE in-circuit emulator or MPLAB ICD
3 in-circuit debugger. For details, see online help, “Device and Feature Support”.
The Application In/Out window allows you to interact with a running application using
the Application Input/Output feature supported on some devices. Using this feature,
data may be sent serially to and from the target application and, during runtime, over
the same PGC/PGD lines used for debugging. Data written to the APPOUT register will
be displayed to the window, while user input will be sent to the target application and
available in the APPIN register.
To use the Application In/Out window:
• Use the device-specific header file when building your application to use the
macros assigned in the header (per Example 6-6.)
• In the future, the 16-bit device library will have printf() and scanf() functions
for use with the Application In/Out feature, as referenced in the “16-Bit
Debug-Support Library” chapter of the 16-Bit Language Tools Libraries
(DS51456) document.
EXAMPLE 6-6:
APPLICATION IN/OUT MACRO USAGE
The following application code reads the application input register and writes out a padded value of the input to the application output register.
// include file
#include <p33Exxxx.h>
// set up config bits
_FWDT( FWDTEN_OFF )
// initialize variables
unsigned int val;
int i;
unsigned int oval;
int main(void)
{
while(1)
{
if(APPSbits.APIFUL) // APPI is full?
{
val = _APPIN;
// Read User Input
for(i=0; i<4; i++)
{
while(APPSbits.AROFUL); // APPO is full?
oval = val&0xFF;
if(oval < 0x20)
oval = 0x20;
oval |= 0x20202000;
_APPO = oval;
// Send to MPLAB X IDE
val >>= 8;
}
}
}
}
2013 Microchip Technology Inc.
DS52085A-page 63
Emulator User’s Guide for MPLAB X IDE
To run this application:
1. Create a project using the Project wizard:
a) Select a supported device.
b) Select REAL ICE or ICD 3 as the hardware tool.
c) Use the “MPLAB C Compiler for PIC24 MCUs and dsPIC DSCs” or the
“MPLAB XC16 C Compiler” as the language toolsuite.
2. Select File>New File to create and name a new C Source File. In the Editor window that opens, add the previous code and save.
3. Right click on the project name in the Projects window and select “Properties”. In
the Project Properties window, click on “pic32-gcc” under “Categories”. Under
“Option Categories”, select “General” and check the “Enable App IO” checkbox.
4. Build the project (Right click on the project name and select “Build”).
5. Select Window>Debugging>PIC App IO to open the Application In/Out window.
6. Click on the “Properties” button (on the left of the window) to launch the Set App
IO Properties dialog. Under “Capture” click “On”.
FIGURE 6-4:
SET APP I/O PROPERTIES
7. Debug Run or Run the project.
8. Enter an text value in the Input text box. Hit Enter.
9. View the output in the Output text box.
FIGURE 6-5:
DS52085A-page 64
APP IN/OUT WINDOW
2013 Microchip Technology Inc.
Specific Debug Functions: 8- and 16-Bit Devices
Change Input and Output Formats by opening Set App IO Properties dialog and running the program again to see what outputs result for different inputs.
For more on options avaiable in this window, see Section 11.4.2 “Application In/Out
Window and Related Dialogs”.
6.6
ADDITIONAL DEBUG FEATURES
In addition to the debug features covered previously, 8- and 16-bit devices have the
other debug features, such as “Freeze on Halt”, which allows you to freeze selected
peripherals on a halt. For a complete list of debug functions, windows and dialogs, see
Chapter 11. “Emulator Function Summary”.
2013 Microchip Technology Inc.
DS52085A-page 65
Emulator User’s Guide for MPLAB X IDE
NOTES:
DS52085A-page 66
2013 Microchip Technology Inc.
MPLAB® REAL ICE™ IN-CIRCUIT
EMULATOR USER’S GUIDE FOR
MPLAB X IDE
Chapter 7. Specific Debug Functions: 32-Bit Devices
7.1
INTRODUCTION
The following debug functions are specific to 32-bit devices:
Note:
•
•
•
•
•
•
7.2
For PIC32 devices, the JTAG port may need to be disabled to prevent
conflicts when using trace and other ICE features where pin conflicts can
result.
Data Capture and Runtime Watches
PIC32 Instruction Trace
Instrumented Trace
PC Profiling
Application In/Out
Additional Debug Features
DATA CAPTURE AND RUNTIME WATCHES
Not all 32-bit devices support data capture and/or runtime watches. A list of supported
features by device is available in online help.
For PIC32 devices, breakpoints use different resources than data captures and runtime
watches. However data captures and runtime watches use the same resources.
Therefore, setting a data capture or runtime watch uses the resource for the selected
symbol.
Note:
The Performance Pak is not required for debugging at maximum speeds as
the capture clock speed is independent of the target system clock.
• Data Capture and DMCI
• Runtime Watches and DMCI
• Runtime Watches and the Watch Window
2013 Microchip Technology Inc.
DS52085A-page 67
Emulator User’s Guide for MPLAB X IDE
7.2.1
Data Capture and DMCI
Data capture provides streaming data from a device to the following:
• Data Monitoring and Control Interface (DMCI) – Plug-in
To install the DMCI plug-in:
1.
2.
3.
4.
Select Tools>Plugins. The Plugins window will open.
Click on the Available Plugins tab.
Find DMCI and check the checkbox next to it.
Click Install and follow the screens.
See also the “Add Plug-in Tools” in the “Additional Tasks” section of the MPLAB X IDE
help file.
To set up data capture:
1. Build the project (In the Projects window, right click on the project name and
select “Build”). The project must be built to see the available symbols.
2. Select Window>Debugging>Watches to open the Watches window.
3. Right click in the window and select “New Watch”. Select the symbol or SFR wish
to watch in the New Watch window. Click OK.
4. Select Tools>Embedded>DMCI>DMCI Window to open the DMCI dialog.
5. Set up the DMCI for this data capture. See the DMCI help file for details
(Help>Help Contents, “Plug-In Tools” section).
6. Begin a debug session (Debug>Debug Project). Input data using DMCI controls
or view data in a DMCI graphical window.
7.2.2
Runtime Watches and DMCI
For devices without data capture, the runtime watch can provide data polling to the
following:
• Data Monitoring and Control Interface (DMCI) – Plug-in
To install the DMCI plug-in:
1.
2.
3.
4.
Select Tools>Plugins. The Plugins window will open.
Click on the Available Plugins tab.
Find DMCI and check the checkbox next to it.
Click Install and follow the screens.
See also the “Add Plug-in Tools” in the “Additional Tasks” section of the MPLAB X IDE
help file.
To set up runtime watches:
1. Build the project (In the Projects window, right click on the project name and
select “Build”). The project must be built to see the available symbols.
2. Select Window>Debugging>Watches to open the Watches window.
3. Right click in the window and select “New Runtime Watch”. Select the symbol or
SFR wish to watch in the New Run Time Watch window. Click OK.
4. Right click on the project and select “Properties” to open the Project Properties
dialog. Then click on the “Real ICE” category and select the “Clock” option
category. Enter instruction speed information.
5. Select Tools>Embedded>DMCI>DMCI Window to open the DMCI dialog.
6. Set up the DMCI for this runtime watch. See the DMCI help file for details
(Help>Help Contents, “Plug-In Tools” section).
7. Begin a debug session (Debug>Debug Project). Input data using DMCI controls
or view data in a DMCI graphical window.
DS52085A-page 68
2013 Microchip Technology Inc.
Specific Debug Functions: 32-Bit Devices
7.2.3
Runtime Watches and the Watch Window
A runtime watch provides updating of a variable in the following windows during
program execution instead of on halt:
• Watches – Window > Debugging menu
• Memory – Window > PIC Memory Views menu
To set up runtime watches:
1. Build the project (In the Projects window, right click on the project name and
select “Build”). The project must be built to see the available symbols.
2. Select Window>Debugging>Watches to open the Watches window.
3. Right click in the window and select “New Runtime Watch”. Select the symbol or
SFR wish to watch in the New Run Time Watch window. Click OK.
4. Right click on the project and select “Properties” to open the Project Properties
dialog. Then click on the “Real ICE” category and select the “Clock” option category. Enter instruction speed information.
5. Begin a debug session (Debug>Debug Project). Watch variable values change
in the Watch window.
6. Pause (halt) and open another window (e.g., SFR) containing the watched
variable. Continue the program again and watch the values change in this
window.
2013 Microchip Technology Inc.
DS52085A-page 69
Emulator User’s Guide for MPLAB X IDE
7.3
PIC32 INSTRUCTION TRACE
This section will discuss trace for 32-bit devices and how to use it. Not all PIC32
devices have instruction trace so refer to your device data sheet.
•
•
•
•
Requirements for Trace
How Instruction Trace Works
Setting Up and Using Trace
Trace Hardware Specifications
7.3.1
Requirements for Trace
The following is required to use trace for 32-bit (PIC32) devices:
• MPLAB X IDE and a compatible 32-bit toolchain
• PIC32MX Plug-In Module (PIM) containing a device that supports trace and a
trace port
• MPLAB REAL ICE Trace Interface Kit containing a 12-inch trace cable and a trace
adapter board
7.3.2
How Instruction Trace Works
PIC32 instruction trace uses a MIPS32 M4K iFlowtrace™ mechanism, which is a
non-intrusive hardware instruction trace You can use this trace to capture every
instruction executed by the device. The trace data is sent from the device using the pins
TRCLK and TRD3:0 to the emulator. The emulator streams this data to a trace buffer
on the PC that acts like a rolling FIFO.
The amount of trace data is limited only by the size of the trace buffer. This buffer can
fill quickly even when set to the maximum size, so it is wise to determine exactly what
you need to capture.
Enable and set trace options in the Project Properties dialog, Categories: REAL ICE,
Option categories: Trace and Profiling. Here you may set:
•
•
•
•
Data selection - enable/disable trace and select the type of trace.
Data file path and name - location of trace file
Data file maximum size - size of trace file
Data Buffer maximum size - size of the trace buffer
The maximum off-chip (PC) trace buffer size is 22MB. Execution will not halt when this
external buffer is full.
See also Section 11.3.1 “Trace and Profiling”.
DS52085A-page 70
2013 Microchip Technology Inc.
Specific Debug Functions: 32-Bit Devices
FIGURE 7-1:
2013 Microchip Technology Inc.
PIC32 INSTRUCTION TRACE OPTIONS
DS52085A-page 71
Emulator User’s Guide for MPLAB X IDE
7.3.3
Setting Up and Using Trace
PIC32 Instruction Trace requires hardware and software setup before you can trace.
7.3.3.1
HARDWARE SETUP – PIC32 MCU ON PIM
To use the PIC32 Instruction Trace feature with the PIM do the following:
1. Plug the PIM into an unpowered target board.
2. Install communication cable(s) between the emulator and your target board. See
Section 3.5 “Target Communication Connections”.
3. Connect the trace cable from the trace port on the PIM to the trace adapter
board. Orient the cable as show in Figure 7-2.
TRACE CONNECTION WITH PIM
Emulator Pod
PIM
5
FUNCTION
STATUS
ACTIVE
RESET
Communication Cable(s)
PIC32
FIGURE 7-2:
Trace Cable
Trace
Adapter
Trace Port
4. Plug the trace adapter board into the MPLAB REAL ICE in-circuit emulator logic
probe port. The top of the adapter board contains the connectors and should be
oriented upwards when plugging the board into the logic probe port (Figure 7-2).
5. Power the target.
Note:
7.3.3.2
When using trace, pins TRCLK and TRD3:0 are used. Therefore, you
cannot use the other functions multiplexed on these pins. For
PIC32MX360F512L, multiplexed functions are RG14:12 and RA7:6. Check
your device data sheet for details.
HARDWARE SETUP – PIC32 MCU ON TARGET
When designing instruction trace capability onto your own board, the following
provisions will need to be made.
• Termination series resistors will need to be added as depicted in Figure 7-5.
• Depending on your board routing and loading of the signals used for trace; it is a
good idea to place 0 ohm resistors that can be unpopulated to isolate the trace
signals TRCLK and TRD3:0.
To use the PIC32 Instruction Trace feature with your own board do the following:
1. The target board should initially be unpowered.
2. Install communication cable(s) between the emulator and your target board. See
Section 3.5 “Target Communication Connections”.
3. Connect the trace cable from the target board to the trace adapter board. Make
sure the PIC32 MCU on your target board is connected to accomodate trace, as
per Figure 7-5.
4. Plug the trace adapter board into the MPLAB REAL ICE in-circuit emulator logic
probe port. The top of the adapter board contains the connectors and should be
oriented upwards when plugging the board into the logic probe port (Figure 7-3).
DS52085A-page 72
2013 Microchip Technology Inc.
Specific Debug Functions: 32-Bit Devices
5. Power the target.
Note:
When using trace, pins TRCLK and TRD3:0 are used. Therefore, you
cannot use the other functions multiplexed on these pins. For
PIC32MX360F512L, multiplexed functions are RG14:12 and RA7:6.
FIGURE 7-3:
TRACE CONNECTION WITH DEVICE ON TARGET
Emulator Pod
7.3.3.3
FUNCTION
STATUS
ACTIVE
RESET
Communication Cable(s)
5
5
Trace Cable
PIC32
Trace
Adapter
MPLAB X IDE SETUP
To set up MPLAB X IDE to use trace for the MPLAB REAL ICE in-circuit emulator:
1. Right click on the project name and select “Properties”. In the Project Properties
dialog click on “Real ICE” under “Categories”.
2. Under “Option categories”, select “Clock”. For data capture and trace, the
emulator needs to know the instruction cycle speed.
3. Under “Option categories”, select “Trace and Profiling”.
4. Under “Data Collection Selection”, choose “Instruction Trace/Profiling”.
5. Set up any other trace-related options. (See Section 11.3.1 “Trace and
Profiling”.)
6. Click OK.
On a Debug Run, trace will continue to fill the trace buffer with data, rolling over when
the buffer is full, until a program Halt.
7.3.3.4
VIEWING TRACE DATA
When trace is enabled and code is run, trace data will be collected by the emulator.
Once the device is halted, trace data will be decoded and displayed in the Trace
window (Window>Debugging>Trace).
7.3.4
Trace Hardware Specifications
Specifications for hardware that supports PIC32 Instruction Trace are listed below.
7.3.4.1
MPLAB REAL ICE TRACE INTERFACE KIT (AC244006)
The MPLAB REAL ICE Trace Interface Kit consists of an adapter board and trace
cable. Kit component dimensions and a pin connection diagram for the adapter board
are shown below.
TABLE 7-1:
KIT COMPONENT DIMENSIONS IN INCHES
Component
Length
Width
Height
Adapter Board
0.900
0.800
0.6
Cable
12.0
0.5
0.0625
2013 Microchip Technology Inc.
DS52085A-page 73
Emulator User’s Guide for MPLAB X IDE
FIGURE 7-4:
ADAPTER BOARD PIN CONNECTION DIAGRAM
From Emulator Logic Probe Port
J1
Reserved
13
11
9
7
5
3
1
TCLK
Reserved
Reserved
TRIG3
TRIG1
To Trace Cable/PIM Trace Port J1
Signal Map
Reserved
Reserved
14
12
10
8
6
4
2
J1
Reserved
Reserved
TRIG4
TRIG2
J2
TCLK
TRCLK
TRIG1
TRD0
TRIG2
TRD1
TRIG3
TRD2
TRIG4
TRD3
1
3
5
7
9
TRCLK
TRD0
TRD1
TRD2
TRD3
J2
2
4
6
8
10
GND:Blue, TRCLK:Yellow, TRDAT:Green
To use the logic probes instead of the trace cable, see Section 3.6.4 “PIC32
Instruction Trace Connections”.
7.3.4.2
PIC32MX PIM
The PIC32MX PIM contains a PIC32 device that supports PIC32 Instruction Trace and
a trace port connector. Two current PIMs and their dimensions are shown in Table 7-2
(see the Microchip website for up-to-date information). A pin connection diagram is
shown in Figure 7-5.
TABLE 7-2:
PIM DIMENSIONS IN INCHES
PIM #
PIM Name
Device
Length
Width
Height
MA320001
PIC32 PIM
PIC32MX360F512L
1.55
1.55
0.9
MA320002
PIC32 USB PIM
PIC32MX460F512L
1.55
1.55
0.9
FIGURE 7-5:
PIC32MX PIM PIN CONNECTION DIAGRAM
Remove resistors to
isolate trace pins
from target board.
91
97
96
95
92
22 ohm resistors are
used for impedance
matching.
0
0
0
0
0
22
22
22
22
22
1
3
5
7
9
J1
2
4
6
8
10
PIM
Trace
Port
From Trace Cable/
Adapter Board Port J2
TR
D
TR 0
D1
TR
D
2
TR
D
TR 3
C
LK
To PIM Ground
VDD
PIC32MX
VDD Max = 3.6V
VSS
All processor pins
connected directly
to their respective
PIM pins unless
otherwise specified.
To PIM Ground
DS52085A-page 74
2013 Microchip Technology Inc.
Specific Debug Functions: 32-Bit Devices
7.4
INSTRUMENTED TRACE
For some PIC32 devices, instrumented trace is available (see Chapter 2. “Device and
Feature Support”).
For information on this trace, see Section 6.3 “Instrumented Trace”.
7.5
PC PROFILING
PC profiling is a method for examining C code to determine how much time is spent in
each function. This information can show you where your program time is being spent
so you may work to optimize your code.
For PC profiling, every program counter (PC) trace sample is taken from the trace
(data) buffer and profiled. This data is displayed in the PC Profiling window, as shown
in Figure 7-6. In this example, the trace buffer contains 21,000 PC sample data points.
Of these, 7859 (or 37.42%) where associated with the main() function, 6023 (or
28.68%) with the subrA() function, etc.
PC profiling is similar to PC sampling. For details see Section 6.4 “PC Sampling”.
To perform profiling:
1. Set up your hardware for PIC32 Instruction trace (see Section 7.3 “PIC32
Instruction Trace”.)
1. Open the Project properties window (File>Project Properties).
2. Click on “REAL ICE” under “Categories” and select “Trace and Profiling” from the
“Options categories” drop-down box.
3. Under “Data Collection Selection”, select “Instruction Trace/Profiling”.
4. Set up your data file in this window. For reference, see Section 11.3.1 “Trace
and Profiling”. Then click OK.
5. Select Window>Debugging>PC Profiling. This will open the PC Profiling window.
6. Run your code and then pause/halt.
7. View the profiling data in the window. Data is only displayed on halt.
8. Right click in the window to pop up a menu to either clear the data or reload the
data.
2013 Microchip Technology Inc.
DS52085A-page 75
Emulator User’s Guide for MPLAB X IDE
FIGURE 7-6:
7.6
PC SAMPLING WINDOW
APPLICATION IN/OUT
Note:
This window is only available for devices that support the application in/out
function used with the MPLAB REAL ICE in-circuit emulator or MPLAB ICD
3 in-circuit debugger. For details, see online help, “Device and Feature
Support”.
The application in/out function cannot be used with PIC32 instruction trace.
The Application In/Out window allows you to interact with a running application using
the Application Input/Output feature supported on some devices. Using this feature,
data may be sent serially to and from the target application and, during runtime, over
the same PGC/PGD lines used for debugging. Data written to the APPOUT register will
be displayed to the window, while user input will be sent to the target application and
available in the APPIN register.
To use the Application In/Out window:
• Use the device-specific header file when building your application to use the
macros assigned in the header (per Example 7-1.)
• Alternatively, the PIC32 MCU library has printf() and scanf() functions for
use with the Application In/Out feature. Refer to the “PIC32 Debug-Support
Library” chapter in 32-Bit Language Tools Libraries (DS51685).
DS52085A-page 76
2013 Microchip Technology Inc.
Specific Debug Functions: 32-Bit Devices
EXAMPLE 7-1:
APPLICATION IN/OUT MACRO USAGE
The following application code reads the application input register and writes out a
padded value of the input to the application output register.
// include file
#include <p32xxxx.h>
// set up config bits
#pragma config FWDTEN = OFF
// initialize variables
unsigned int val;
int i;
unsigned int oval;
int main(void)
{
while(1)
{
if(_DDPSTATbits.APIFUL) // APPI is full?
{
val = _APPI;
// Read User Input
for(i=0; i<4; i++)
{
while(_DDPSTATbits.APOFUL); // APPO is full?
oval = val&0xFF;
if(oval < 0x20)
oval = 0x20;
oval |= 0x20202000;
_APPO = oval;
// Send to MPLAB X IDE
val >>= 8;
}
}
}
}
To run this application:
1. Create a project using the Project wizard:
a) Select a supported device.
b) Select REAL ICE or ICD 3 as the hardware tool.
c) Use the “MPLAB C Compiler for PIC32 MCUs” or the “MPLAB XC32 C
Compiler” as the language toolsuite.
2. Select File>New File to create and name a new C Source File. In the Editor
window that opens, add the previous code and save.
3. Right click on the project name in the Projects window and select “Properties”. In
the Project Properties window, click on “pic32-gcc” under “Categories”. Under
“Option Categories”, select “General” and check the “Enable App IO” checkbox.
4. Build the project (Right click on the project name and select “Build”).
5. Select Window>Debugging>PIC App IO to open the Application In/Out window.
6. Click on the “Properties” button (on the left of the window) to launch the Set App
IO Properties dialog. Under “Capture” click “On”.
2013 Microchip Technology Inc.
DS52085A-page 77
Emulator User’s Guide for MPLAB X IDE
FIGURE 7-7:
SET APP I/O PROPERTIES
7. Debug Run or Run the project.
8. Enter an text value in the Input text box. Hit Enter.
9. View the output in the Output text box.
FIGURE 7-8:
APP IN/OUT WINDOW
Change Input and Output Formats by opening Set App IO Properties dialog and running the program again to see what outputs result for different inputs.
For more on options avaiable in this window, see Section 11.4.2 “Application In/Out
Window and Related Dialogs”.
7.7
ADDITIONAL DEBUG FEATURES
In addition to the debug features covered previously, 32-bit devices have the other
debug features, such as “Freeze on Halt”, which allows you to freeze selected peripherals on a halt. For a complete list of debug functions, windows and dialogs, see
Chapter 11. “Emulator Function Summary”.
DS52085A-page 78
2013 Microchip Technology Inc.
MPLAB® REAL ICE™ IN-CIRCUIT
EMULATOR USER’S GUIDE FOR
MPLAB X IDE
Part 3 – Troubleshooting
Chapter 8. Troubleshooting First Steps ..................................................................... 81
Chapter 9. Frequently Asked Questions (FAQ) ......................................................... 83
Chapter 10. Messages ................................................................................................. 91
2013 Microchip Technology Inc.
DS52085A-page 79
Emulator User’s Guide for MPLAB X IDE
NOTES:
DS52085A-page 80
2013 Microchip Technology Inc.
MPLAB® REAL ICE™ IN-CIRCUIT
EMULATOR USER’S GUIDE FOR
MPLAB X IDE
Chapter 8. Troubleshooting First Steps
8.1
INTRODUCTION
If you are having problems with MPLAB REAL ICE in-circuit emulator operation, start
here.
• The 5 Questions to Answer First
• Top Reasons Why You Can’t Debug
• Other Things to Consider
8.2
THE 5 QUESTIONS TO ANSWER FIRST
1. What device are you working with? Often an upgrade to a newer version of
MPLAB IDE is required to support newer devices. That is, yellow light = untested
support.
2. Are you using a Microchip demo board or one of your own design? Have you followed the guidelines for resistors/capacitors for communications connections?
See Chapter 3. “Operation”.
3. Have you powered the target? The emulator cannot power the target.
4. Are you using a USB hub in your set up? Is it powered? If you continue to have
problems, try using the emulator without the hub (plugged directly into the PC.)
5. Are you using the standard communiction cable (RJ-11) shipped with emulator?
If you have made a longer cable, it can have communications errors. If longer
cables are required, you should consider using high-speed communications. See
Section 3.4.2 “High-Speed/LVDS Communication (Performance Pak)”.
8.3
TOP REASONS WHY YOU CAN’T DEBUG
1. The oscillator is not working. Check your Configuration bits setting for the
oscillator. If you are using an external oscillator, try using an internal oscillator. If
you are using an internal a PLL, make sure your PLL settings are correct.
2. The target board is not powered. Check the power cable connection.
3. The Vdd voltage is outside the specifications for this device. See the device
programming specification for details.
4. The emulator has somehow become physically disconnected from the PC and/or
the target board. Check the communications cables’ connections.
5. Emulator to PC communications has somehow been interrupted. Reconnect to
the emulator in MPLAB IDE.
6. The device is code-protected. Check your Configuration bits setting for code
protection.
7. You have not programmed your part in Debug mode.
8. You are trying to debug a production device that doesn't have debugging capabilities. Use a debug header instead. (See “Processor Extension Pak and
Header Specification (DS51292)” in “Recommended Reading”.)
2013 Microchip Technology Inc.
DS52085A-page 81
Emulator User’s Guide for MPLAB X IDE
9. The target application has somehow become corrupted or contains errors. Try
rebuilding and reprogramming the target application. Then initiate a
Power-On-Reset of the target.
10. You do not have the correct PGC/PGD pin pairs programmed in your
Configuration bits (for devices with multiple PGC/PGD pin pairs).
11. Other configuration settings are interfering with debugging. Any configuration
setting that would prevent the target from executing code will also prevent the
emulator from putting the code into debug mode.
12. Brown-out Detect voltage is greater than the operating voltage VDD. This means
the device is in Reset and cannot be debugged.
13. You have not followed the guidelines in Chapter 3. for communication
connections.
14. The emulator cannot always perform the action requested. For example, it
cannot debug when in Run mode.
8.4
OTHER THINGS TO CONSIDER
1. It is possible the error was a one-time glitch. Try the operation again.
2. There may be a problem programming in general. As a test, switch to programmer mode and program the target with the simplest application possible (e.g., a
program to blink an LED). If the program will not run, then you know that
something is wrong with the target setup.
3. It is possible that the target device has been damaged in some way (e.g., over
current). Development environments are notoriously hostile to components.
Consider trying another target device.
4. Microchip Technology Inc. offers myriad demonstration boards to support most
of its microcontrollers. Consider using one of these applications, which are
known to work, to verify correct MPLAB REAL ICE in-circuit emulator
functionality. Or, use the Loop-Back Test board to verify the emulator itself
(Section 12.6 “Loop-Back Test Board”.)
5. Review emulator debug operation to ensure proper application setup (Chapter
3. “Operation”.)
6. If the problem persists contact Microchip.
DS52085A-page 82
2013 Microchip Technology Inc.
MPLAB® REAL ICE™ IN-CIRCUIT
EMULATOR USER’S GUIDE FOR
MPLAB X IDE
Chapter 9. Frequently Asked Questions (FAQ)
9.1
INTRODUCTION
Look here for answers (A) to frequently asked questions (Q) about the MPLAB REAL
ICE in-circuit emulator system.
• How The Emulator Works
• How Trace Works – 8 and 16 Bit Devices
• General Issues
9.2
HOW THE EMULATOR WORKS
Q: What's in the silicon that allows it to communicate with the MPLAB REAL ICE
in-circuit emulator?
A: Most silicon contains a debug module that can communicate with the REAL
ICE. A small debug executive program is also needed to be programmed in the
high area of memory (sometimes in a separate area of memory called test memory). On some small devices without on-chip debugging capability, an emulation
header may be purchased to allow debugging.
Q: How is the throughput of the processor affected by having to run the debug
executive?
A: The debug executive doesn't run while in Run mode, so there is no throughput
reduction when running your code, i.e., the emulator doesn’t ‘steal’ any cycles
from the target device. However, when you are doing Native trace, each macro
inserted takes about 200 instructions. Therefore, this will affect timing.
For more information, see Section 6.3.8 “Resource Usage Examples”.
Q: How does the MPLAB REAL ICE in-circuit emulator compare with other in-circuit
emulators/debuggers?
A: Please refer to Section 3.2 “Tools Comparison”.
Q: How does MPLAB IDE interface with the MPLAB REAL ICE in-circuit emulator to
allow more features than in-circuit debuggers?
A: For some devices, the MPLAB REAL ICE in-circuit emulator communicates
using the debug executive located in a special area of memory that does not use
application program memory. Also, the debug exec is streamlined for more efficient communication. The emulator contains an FPGA, large SRAM Buffers
(1Mx8), and a high speed USB interface. The program memory image is downloaded and is contained in the SRAM to allow faster programming. The FPGA in
the emulator serves as an accelerator for interfacing with the device in-circuit
debugger modules.
2013 Microchip Technology Inc.
DS52085A-page 83
Emulator User’s Guide for MPLAB X IDE
Q: On traditional emulators, the data must come out on the bus in order to perform a
complex trigger on that data. Is this also required on the MPLAB REAL ICE
in-circuit emulator? For example, could I halt based on a flag going high?
A: Traditional emulators use a special emulator chip (-ME) for monitoring. There
is no -ME with the MPLAB REAL ICE in-circuit emulator so there are no busses
to monitor externally. With the MPLAB REAL ICE in-circuit emulator, rather than
using external breakpoints, the built-in breakpoint circuitry of the debug engine is
used; the busses and breakpoint logic are monitored inside the part.
Q: Does the MPLAB REAL ICE in-circuit emulator have complex breakpoints?
A: Yes. You can break based on pass counts, program memory execution at a
specific address or data memory reads/writes at a specific address. You can also
do event breakpoints (break on an event) sequenced breakpoints (break after
events occur in a specific order), or ANDed breakpoint (break when events occur
all together).
Q: One of the probe pins is labeled 5V. How much drive capability does this probe
have?
A: This is a monitoring function (allows you to see what VDD is actually being
applied and used on the driver buffers). The MPLAB REAL ICE in-circuit
emulator cannot provide power to the target.
Q: Are any of the driver boards optoisolated or electrically isolated?
A: They are DC optoisolated, but not AC optoisolated. To apply high voltage
(120V) to the current system, see Section 13.4 “MPLAB REAL ICE Isolator
Unit (Opto-Isolator)”.
Q: What limitations are there with the 4 (PGC) or 5 (PGD) pins only?
A: There are several limiations on these pins:
- The standard ICSP RJ-11 cable does not allow for clock speeds greater than
about 15 Mb/sec. For these high-speed applications, the Performance Pak
(high-speed/LVDS) cable interface is required.
- Some circuitry should not be used on these pins. See Section 3.5.4 “Circuits
That Will Prevent the Emulator From Functioning”. Also refer to “Development Tools Design Advisory” (DS51764).
Q: Will this slow down the running of the program?
A: There is no cycle stealing with the MPLAB REAL ICE in-circuit emulator. The
output of data is performed by the state machine in the silicon.
Q: How do I connect CLK and DAT when using high-speed communications?
A: These connections are optional and used for SPI trace. For more information,
see Section 3.6.2 “SPI Trace Connections (High-Speed/LVDS
Connection)”.
Q: What is meant by the data rate is limited to 15 MIPS, when using the standard
board? Is this caused by the core processor or transfer rate?
A: The standard board uses the RJ-11 cable and has a limitation on how fast data
can reliably be transmitted when using trace, runtime watches, and data capture.
The top end is when the processor has an operational speed of 15 MIPS. The
trace clock is derived from the main system clock of the device.
The 15 MIPS limit is a worst case limit. For well designed boards with less signal
integrity problems, the limit may be higher.
Q: Does the 15 MIPS limit apply to PIC32 devices?
A: No. The PIC32 MCU uses a fixed rate clock that doesn't derive from the target
system clock. It also uses a more robust communication protocol.
DS52085A-page 84
2013 Microchip Technology Inc.
Frequently Asked Questions (FAQ)
Q: To debug a dsPIC® DSC running at 30 MIPS, is high-speed communications
necessary to do even basic debugging?
A: Basic debugging at any device frequency can be accomplished with either
standard or high-speed (Performance Pak) communications.
Q: My target board connector is for standard communications but I want to use
high-speed communications. Can I use the high-speed/LVDS communications
(Performance Pak) cables, high-speed-to-standard converter board, and standard
communication (ICSP) cable?
A: No. You cannot use the standard/ICSP cable for high-speed communications,
i.e., high device operational frequencies. This introduces signal integrity issues,
due to the lower quality of cable transmission, when using the RJ-11 converter
board.
Q: If the high-speed receiver board is used, do pins 7-8 have to be connected, or can
they just be left open?
A: They can be left open. The high-speed receiver board weakly pulls them
down.
Q: What is the function of pin 6, the auxiliary pin?
A: There is no function on pin 6. It is a legacy connection, compatible with the
typical ICSP 6-pin header definition.
9.3
HOW TRACE WORKS – 8 AND 16 BIT DEVICES
Q: When using trace, is this connection electrically isolated in any way, i.e., do the
triggers have any isolation?
A: They are buffered and DC adjusted to whatever VDD level you are running.
The buffers tristate when off. This minimal isolation makes the system fast and
opens the door to adapt to new and faster technologies. However, you may
implement more RS-232 isolation (4-6 lines) if desired, but this may impact your
speed.
Q: Can we do trace by using the 5 or 6 ICSP pins only?
A: Tracing is possible using the standard ICSP interface.
Q: Does inputting execution speed in the Project Properties dialog (File>Project
Properties, REAL ICE category, Clock option) actually set communication clock?
A: No. The input box in this tab merely reports the speed to the emulator so that
it can accurately control timing. The actual communication speed is based on the
target system clock. Reporting the clock is needed only for Native trace, data
capture, and runtime watches.
Q: When would SPI trace be used? What extra advantage does this have?
A: SPI trace is faster than Native trace and impacts code size less. It can also be
used on many devices that do not have Native trace. See the online help, “Device
and Feature Support”.
Q: In order to use the SPI trace, what is the hardware connection?
A: For serial SPI port trace, the device SPI SDO (serial data output) and SCK
(serial clock) are required. These pins must be connected, respectively, to the
DAT and CLK pin interface on the Performance Pak receiver board. See
Section 3.6.2 “SPI Trace Connections (High-Speed/LVDS Connection)” for
more information.
2013 Microchip Technology Inc.
DS52085A-page 85
Emulator User’s Guide for MPLAB X IDE
Q: For SPI trace, which two pins are used?
A: The pins are:
SDO (Serial Data Output) DAT (pin 7)
SCK (Serial Clock Output) CLK (pin 8)
Q: What are the correct port settings to use SPI trace, i.e., mode, sync/async, etc.?
A: The setup is taken care of by MPLAB IDE, so you will not need to be concerned about the code required for setting this. Trace will support 64 trace points
and 128 log points.
SPI – Comm Protocol MODE1, clock high, sampled falling edge.
Q: What is the correct connection for using I/O Port (parallel port) trace?
A: The connection varies depending on the PORT used. There are port assignments in MPLAB IDE that are displayed when the PORT is selected in the property sheet. See Section 3.6.3 “I/O Port Trace Connections” for more
information.
Q: Can we use any port?
A: The port must be available on the device and not multiplexed with the currently
used PGC and PGM pins.
Q: Of the 7 data and one clock, which one is the clock?
A: There are 7 bits of data to set up to 128 trace points. The clock is the MSB of
the port.
Q: Are these I/O ports used for trace available as general I/O during debugging?
A: For dsPIC30F/33F and PIC24F/H devices, you may write to the opposing 8-bit
part of the port provided byte write operations are used. The following example
will write to the high side of the port only.
#define high(num)
(((BYTE *)&num)[1])
#define low(num)
(((BYTE *)&num)[0])
high(PORTA) = 0x12;
For PIC18 devices, once the ports are defined to be used for trace, you should
not access them in your code.
DS52085A-page 86
2013 Microchip Technology Inc.
Frequently Asked Questions (FAQ)
9.4
GENERAL ISSUES
Q: Performing a Verify fails after programming the device. Is this a programming
issue?
A: If Run (Run>Run Project) is selected, the device will automatically run immediately after programming. Therefore, if your code changes the flash memory,
verification could fail. To prevent the code from running after programming,
please select 'Hold in Reset'.
Q: I have set a breakpoint but my program doesn't stop there. Why?
A: Consider the following:
1- Are you setting those breakpoint in Debug mode and then choosing Run?
Breakpoints are ineffective in Programmer mode.
2- Are these breakpoints part of a sequence? Remember, sequence breakpoints
will only halt execution if they are followed in the exact sequence.
3- Are these breakpoints part of PIC32 instruction trace triggers? Once you
choose them as trace triggers they are not functional breakpoints anymore. See
Section 7.3 “PIC32 Instruction Trace” for more information.
4- Are you seeing breakpoint skid? See next question.
5- Finally, your program may not have executed the instruction at which you wish
to break. Try setting a breakpoint earlier in your code and single step from there
to see the actual code flow executed by the device.
Q: I can't set a breakpoint on a particular line of code. Why?
A: MPLAB IDE will allow setting breakpoints only on executable code.
Example 1: The line you are trying to break on may have been optimized out by
the compiler. In that case, try turning optimizations off.
Example 2: The line you are trying to break on may be a compiler directive, and
not actual code.
Q: I didn’t set a breakpoint, yet I have one in my code. What’s going on?
A: What you are seeing is a phantom breakpoint. Occasionally, a breakpoint can
become enabled when it shouldn’t be. Simply disable or delete the breakpoint.
You may need to go to the disassembly window to do so, or simply right click and
choose delete all breakpoints. If this does not work, try closing and reopening the
disassembly window.
Q: Can I use the debugger with optimized code?
A: It is strongly recommended that C compiler optimization is turned off during
debugging (see the Build Options dialog). Optimization will greatly alter how the
executable code corresponds to the source files and hence the debugger may
appear to behave strangely with some code.
Q: Data capture has become flaky. What is going on?
A: The speed of data capture may be too high for your PC or target environment
(noise). There are several things you can do:
1- Reduce the clock speed. Refer to Section 11.3.3 “Clock”.
2- Reduce the rate at which you capture data. In the Watches window, right click
on the symbol, select “Run Time Update Interval” and set a delay.
2013 Microchip Technology Inc.
DS52085A-page 87
Emulator User’s Guide for MPLAB X IDE
Q: I cannot get trace to work. What’s wrong?
A: Consider the following:
- Certain tool versions are required to use trace. Please refer to either Chapter
6. “Specific Debug Functions: 8- and 16-Bit Devices” or Chapter
7. “Specific Debug Functions: 32-Bit Devices”.
- For dsPIC30F/33F and PIC24F/H devices, only C code can be used with trace,
not assembly.
- In-line assembly code (assembly code within C code) cannot be traced.
- Code must be rebuilt and reprogrammed when trace macros are added.
- Ensure you do not have trace macros disabled on the Build Options Trace tab.
- Native trace, data captures and runtime watches cannot be used together.
- The target clock frequency must be reported to MPLAB IDE on the Settings
Clock tab for Native and SPI trace.
- For Port I/O Trace, all 8 pins must be dedicated to trace (i.e., not multiplexed
with the currently used PGC and PGM pins.)
- For Port I/O Trace, ensure that the chosen port is able to output 0x00 and 0xFF.
As a test, set the port TRIS to 0 (all outputs) and set the LAT to a value in the
watch window. The value written to LAT should appear on the port pins.
Q: My program halts while I am tracing, corrupting my trace data. What’s happening?
A: The Watchdog timer can cause this behavior. Ensure it is disabled by properly
setting the configuration bits
Q: My PC went into power-down/hibernate mode, and now my emulator won’t work.
What happened?
A: When using the emulator for prolonged periods of time, and especially as a
debugger, be sure to disable the Hibernate mode in the Power Options Dialog
window of your PC’s operating system. Go to the Hibernate tab and clear or
uncheck the “Enable hibernation” check box. This will ensure that all
communication is maintained across all the USB subsystem components.
Q: I set my peripheral to NOT freeze on halt, but it is suddenly freezing. What's going
on?
A: For dsPIC30F/33F and PIC24F/H devices, a reserved bit in the peripheral
control register (usually either bit 14 or 5) is used as a Freeze bit by the debugger. If you have performed a write to the entire register, you may have overwritten
this bit. (The bit is user accessible in Debug mode.)
To avoid this problem, write only to the bits you wish to change for your application (BTS, BTC) instead of to the entire register (MOV).
DS52085A-page 88
2013 Microchip Technology Inc.
Frequently Asked Questions (FAQ)
Q: When using a 16-bit device, unexpected Reset occurred. How do I determine
what caused it?
A: Consider the following:
- Ensure the Watchdog Timer is disabled in the configuration bits.
- To determine a Reset source, check the RCON register.
- Handle traps/interrupts in an interrupt service routine (ISR). You should include
trap.c style code, i.e.,
void __attribute__((__interrupt__))
_OscillatorFail(void);
:
void __attribute__((__interrupt__))
_AltOscillatorFail(void);
:
void __attribute__((__interrupt__))
_OscillatorFail(void)
{
INTCON1bits.OSCFAIL = 0;
//Clear the trap flag
while (1);
}
:
void __attribute__((__interrupt__))
_AltOscillatorFail(void)
{
INTCON1bits.OSCFAIL = 0;
while (1);
}
:
Q: How can I manually download the firmware?
A: For an active project that uses the emulator:
- Select File>Project Properties to open the Properties window.
- Click on the “Real ICE” category and select “Firmware” from the drop-down
Option Categories.
- Uncheck “Use Latest Firmware” and browse for the Firmware File at location:
<install path>MPLABX/mplab_ide/mplablibs/modules/
ext/REALICE.jar.
- Select the .jam file you want and click OK. Click Reset.
2013 Microchip Technology Inc.
DS52085A-page 89
Emulator User’s Guide for MPLAB X IDE
Q: I accidentally disconnected my emulator while firmware was downloading. What
do I do now?
A: Reconnect the emulator. It will begin to erase what had been written so it can
restart. This erasing will take about 75 seconds (1:15 mins). Please be patient.
You will see:
- the orange busy light turn on for about 25 seconds
- the light turn red for about another 25 seconds
- the light turn orange again for about another 25 seconds
When it turns back to red again, MPLAB IDE will recognize the device and start
the recovery process, i.e., begin firmware download.
Q: My memory window does not reflect changes
A: In order to see changes in the window, you must do a read of the memory.
Q: I don’t see my problem here. Now what?
A: Try the following resources:
Section 3.10 “Resources Used by the Emulator”
Section 10.2 “Error Messages”
Section 10.3 “General Corrective Actions”
DS52085A-page 90
2013 Microchip Technology Inc.
MPLAB® REAL ICE™ IN-CIRCUIT
EMULATOR USER’S GUIDE FOR
MPLAB X IDE
Chapter 10. Messages
10.1
INTRODUCTION
The MPLAB REAL ICE in-circuit emulator produces many different output messages.
Some are error messages, many of which can often be resolved with general corrective
actions. And some are informational only.
• Error Messages
• General Corrective Actions
• Informational Messages
10.2
ERROR MESSAGES
MPLAB REAL ICE in-circuit emulator error messages are listed below. Text in error
messages listed below of the form %x (a variable) will display as text relevant to your
particular situation in the actual error message.
•
•
•
•
•
•
•
•
Read/Write Errors
Emulator-to-Target Communication Errors
Emulator-to-PC Communcation Errors
Corrupted/Outdated Installation Errors
Debug Failure Errors
Hardware/Firmware Errors
Miscellaneous Errors
Internal Errors
10.2.1
Read/Write Errors
For the errors below, read any instructions under your error message. If these fail to fix
the problem or if there are no instructions, see Section 10.3.1 “Read/Write Error
Actions”.
Failed while writing to %s
Failed while reading %s
Failed to program device
Failed to read device
Failed to write to %s memory
Failed to erase the device
Unable to read target register(s).
Unable to write target register(s).
Programming debug executive failed
Programming program executive failed
Failed to get Device ID
2013 Microchip Technology Inc.
DS52085A-page 91
Emulator User’s Guide for MPLAB X IDE
10.2.2
Emulator-to-Target Communication Errors
For the errors below, read any instructions under your error message. If these fail to fix
the problem or if there are no instructions, see Section 10.3.2 “Emulator-to-Target
Communication Error Actions”.
Failed to reset the device
Failed while sending cmd_INITCOMM command
Failed while sending cmd_SETPROBES command
Failed while sending cmd_SETBRACKET
Failed to get status
Failed to send database
If you receive this error:
1. Try downloading again. It may be a one-time error.
2. Try manually downloading the highest-number .jam file.
Invalid command response (sent 0x%x, received 0x%x)
Failed while trying to enter ICE test mode
Failed while trying to start DMA test
Failed to properly receive DMA test data
Timed out while waiting to process data from endpoint 0x%x
transmission failure while receiveing streaming data
Interrupted Exception occurred %s
Unable to start streaming data reception
Unable to start run time data reception
Failed getting PC
10.2.3
Emulator-to-PC Communcation Errors
For the errors below, read any instructions under your error message. If these fail to fix
the problem or if there are no instructions, see Section 10.3.3 “Emulator-to-PC Communication Error Actions”.
Failed to set debug options
Failed while stepping the target
Failed while halting the target
Cannot communicate with %s
10.2.4
Corrupted/Outdated Installation Errors
For the errors below, read any instructions under your error message. If these fail to fix
the problem or if there are no instructions, see Section 10.3.4 “Corrupted Installation
Actions”.
Failed to download firmware
If the Hex file exists:
- Reconnect and try again.
- If this does not work, the file may be corrupted. Reinstall MPLAB IDE.
If the Hex file does not exist:
- Reinstall MPLAB IDE.
DS52085A-page 92
2013 Microchip Technology Inc.
Messages
The MPLAB REAL ICE is missing its Program Executive. Please reconnect to the
PC and try again.
The MPLAB REAL ICE is missing its Debug Executive. Please reconnect to the
PC and try again.
The MPLAB REAL ICE is missing its Device Database. Please reconnect to the
PC and try again.
The MPLAB REAL ICE is missing a Memory Object.
The current memory object in the MPLAB REAL ICE is corrupted. Please retry the
operation.
Unable to download debug executive
If you receive this error while attempting to debug:
1. Deselect the emulator as the debug tool.
2. Close you project and then close MPLAB IDE.
3. Restart MPLAB IDE and re-open your project.
4. Reselect the emulator as your debug tool and attempt to program your target
device again.
Unable to download program executive
If you receive this error while attempting to program:
1. Deselect the emulator as the programmer.
2. Close your project and then close MPLAB IDE.
3. Restart MPLAB IDE and re-open your project.
4. Reselect the emulator as your programmer and attempt to program your target
device again.
10.2.5
Debug Failure Errors
For the errors below, read any instructions under your error message. If these fail to fix
the problem or if there are no instructions, see Section 10.3.6 “Debug Failure
Actions”.
Unable to open debug executive file %s
The target device is not ready for debugging. Please check your configuration bit
settings and program the device before proceeding.
You will receive this message when you have not programmed your device for
the first time and try to Run. If you receive this message after this, or immediately
after programming your device, please refer to Section 10.3.6 “Debug Failure
Actions”.
An unknown exception has occurred. Please unplug the MPLAB REAL ICE and
reconnect.
The Target is held in Reset. Please ensure the MCLR line is pulled up or High-Z'd.
The Debug Executive is found but can't be communicated with. Please ensure
your oscillator settings are correct. If the device supports internal RC try to
connect via that mode first.
See also Section 10.3.2 “Emulator-to-Target Communication Error
Actions”.
REAL ICE was unloaded while still busy. Please unplug and reconnect the USB
cable before using REAL ICE again.
Target device was not found. You must connect to a target device to use MPLAB
REAL ICE.
2013 Microchip Technology Inc.
DS52085A-page 93
Emulator User’s Guide for MPLAB X IDE
See also Section 10.3.2 “Emulator-to-Target Communication Error
Actions”.
Invalid streaming data was been detected. Run time watch or trace data may no
longer be valid. Is recommended that you restart your debug session.
See the FAQ, “Data capture has become flaky. What is going on?”.
10.2.6
Hardware/Firmware Errors
For the errors below, read any instructions within your error message.
The 17.5 rail is unable to turn on. Please unplug the MPLAB REAL ICE and
reconnect. If the problem persists contact Microchip for assistance.
The SRAM has failed its self test. Please unplug the MPLAB REAL ICE and
reconnect. If the problem persists contact Microchip for assistance.
The FPGA has failed its self test. MPLAB IDE will attempt to download the latest
firmware.
Please do not disconnect the REAL ICE during the download process. If the
problem persists contact Microchip for assistance.
The Driver board is missing. Please unplug the MPLAB REAL ICE, make sure the
driver board is properly seated and reconnect. If the problem persists contact
Microchip for assistance.
The Main board serial EEPROM is missing. Please unplug the MPLAB REAL ICE
and reconnect. If the problem persists contact Microchip for assistance.
The Driver board serial EEPROM is missing. Please unplug the MPLAB REAL ICE
and reconnect. If the problem persists contact Microchip for assistance.
The DAC is missing. Please unplug the MPLAB REAL ICE and reconnect. If the
problem persists contact Microchip for assistance.
The Main boards' trigger IO expander is missing. Please unplug the MPLAB
REAL ICE and reconnect. If the problem persists contact Microchip for
assistance.
The Data pin I/O test failed. Please unplug the MPLAB REAL ICE and reconnect.
If the problem persists contact Microchip for assistance.
The Driver I/O expander is missing. Please unplug the MPLAB REAL ICE and
reconnect. If the problem persists contact Microchip for assistance.
The VPP generator could not set the proper voltage. Please unplug the MPLAB
REAL ICE and then reconnect. If problem persists, contact Microchip for
assistance.
The VDD generator could not set the proper voltage. Please unplug the MPLAB
REAL ICE and then reconnect. If problem persists, contact Microchip for
assistance.
The Clock or Data line has clamped the external voltage! Please remove your
target, probe the voltage levels and then reconnect.
Too much current has been drawn on VPP. Please disconnect your circuit, check
the MCLR line for shorts and then reconnect.
Too much current has been drawn on VDD. Please disconnect your circuit, check
the CLK and DATA lines for shorts and then reconnect.
Target Vdd not detected. Please ensure the target device is connect
DS52085A-page 94
2013 Microchip Technology Inc.
Messages
10.2.7
Miscellaneous Errors
For the errors below, read any instructions under your error message.
could not open file
There was a problem reading file
Failed to set firmware suite.
Database intitialization failure.
Connection failed (timed out waiting to REAL ICE to respond)
MPLAB has lost communication with REAL ICE.
Unable to connect to REAL ICE (MPLABComm connect failure)
REAL ICE is busy. Please wait for the current operation to finish.
If you receive this error when attempting to deselect the emulator as a debugger
or programmer:
1. Wait - give the emulator time to finish any application tasks. Then try to
deselect the emulator again.
2. Select Halt to stop any running applications. Then try to deselect the emulator
again.
3. Unplug the emulator from the PC. Then try to deselect the emulator again.
4. Shut down MPLAB IDE.
REAL ICE failed to request DMA reads.
Unable to intialize REAL ICE database.
An Error occurred while running
Address: %x Expected Value: %x Received Value: %x
Target Device ID (0x%x) does not match expected Device ID (0x%x).
Unable to properly create REAL ICE database.
10.2.8
Internal Errors
See Section 10.3.7 “Internal Error Actions”.
Initialization failed: Unable to create ControlPointMediator
Initialization failed: Unable to create com object
Initialization failed: Unable to retrieve device information for device %s
Initialization failed: Family class is unrecognized
Initialization failed: Failed while retrieving device database (.pic) information
Initialization failed: Failed while retrieving tool database (.rice) information
Initialization failed: Unable to load debug executive
Initialization failed: Unable to acquire emulation memory object
Initialization failed: Unable to acquire ToolExecMediator
2013 Microchip Technology Inc.
DS52085A-page 95
Emulator User’s Guide for MPLAB X IDE
10.3
GENERAL CORRECTIVE ACTIONS
These general corrective actions may solve your problem:
•
•
•
•
•
•
•
Read/Write Error Actions
Emulator-to-Target Communication Error Actions
Emulator-to-PC Communication Error Actions
Corrupted Installation Actions
USB Port Communication Error Actions
Debug Failure Actions
Internal Error Actions
10.3.1
Read/Write Error Actions
If you receive a read or write error:
1. Did you hit Abort? This may produce read/write errors.
2. Try the action again. It may be a one time error.
3. Ensure that the target is powered and at the correct voltage levels for the device.
See the device data sheet for required device voltage levels.
4. Ensure that the emulator-to-target connection is correct (PGC and PGD are
connected.)
5. For write failures, ensure that “Erase all before Program” is checked on the
Program Memory tab of the Settings dialog.
6. Ensure that the cable(s) used are of the correct length - maximum 6” for standard
communications and 10’ for high-speed communications.
10.3.2
Emulator-to-Target Communication Error Actions
The MPLAB REAL ICE in-circuit emulator and the target device are out-of-synch with
each other.
1. Select Reset and then try the action again.
2. Ensure that the cable(s) used are of the correct length - maximum 6” for standard
communications and 10’ for high-speed communications.
10.3.3
Emulator-to-PC Communication Error Actions
The MPLAB REAL ICE in-circuit emulator and MPLAB IDE are out of synch with each
other.
1.
1.
2.
3.
Unplug and then plug in the emulator.
Reconnect to the emulator.
Try the operation again. It is possible the error was a one time glitch.
The version of MPLAB IDE installed may be incorrect for the version of firmware
loaded on the MPLAB REAL ICE in-circuit emulator. Follow the steps outlined in
Section 10.3.4 “Corrupted Installation Actions”.
4. There may be an issue with the PC USB port. See Section 10.3.5 “USB Port
Communication Error Actions”.
10.3.4
Corrupted Installation Actions
The problem is most likely caused by a incomplete or corrupted installation of MPLAB
IDE.
1. Uninstall all versions of MPLAB IDE from the PC.
2. Reinstall the desired MPLAB IDE version.
3. If the problem persists contact Microchip.
DS52085A-page 96
2013 Microchip Technology Inc.
Messages
10.3.5
USB Port Communication Error Actions
The problem is most likely caused by a faulty or non-existent communications port.
1. Reconnect to the MPLAB REAL ICE in-circuit emulator
2. Make sure the emulator is physically connected to the PC on the appropriate
USB port.
3. Make sure the appropriate USB port has been selected in the emulator Settings.
4. Make sure the USB port is not in use by another device.
5. If using a USB hub, make sure it is powered.
6. Make sure the USB drivers are loaded.
10.3.6
Debug Failure Actions
The MPLAB REAL ICE in-circuit emulator was unable to perform a debugging
operation. There are numerous reasons why this might occur. See Chapter
8. “Troubleshooting First Steps”.
10.3.7
Internal Error Actions
Internal errors are unexpected and should not happen. They are primarily used for
internal Microchip development.
The most likely cause is a corrupted installation (Section 10.3.4 “Corrupted
Installation Actions”).
Another likely cause is exhausted system resources.
1. Try rebooting your system to free up memory.
2. Make sure you have a reasonable amount of free space on your hard drive (and
that it is not overly fragmented.)
If the problem persists contact Microchip.
10.4
INFORMATIONAL MESSAGES
MPLAB REAL ICE in-circuit emulator informational messages are listed below in
numeric order.
Note:
Numbers may not yet appear in displayed messages. Use the Search tab
on the Help viewer to find your message and highlight it below.
Loopback test completed successfully. Your REAL ICE is functioning properly. If
you are still having problems with your target circuit please check the Target
Board Considerations section of the online help.
See Section 12.7 “Target Board Considerations”.
2013 Microchip Technology Inc.
DS52085A-page 97
Emulator User’s Guide for MPLAB X IDE
NOTES:
DS52085A-page 98
2013 Microchip Technology Inc.
MPLAB® REAL ICE™ IN-CIRCUIT
EMULATOR USER’S GUIDE FOR
MPLAB X IDE
Part 4 – Reference
Chapter 11. Emulator Function Summary................................................................ 101
Chapter 12. Hardware Specification ......................................................................... 109
Chapter 13. Emulator Accessories........................................................................... 115
2013 Microchip Technology Inc.
DS52085A-page 99
Emulator User’s Guide for MPLAB X IDE
NOTES:
DS52085A-page 100
2013 Microchip Technology Inc.
MPLAB® REAL ICE™ IN-CIRCUIT
EMULATOR USER’S GUIDE FOR
MPLAB X IDE
Chapter 11. Emulator Function Summary
11.1
INTRODUCTION
A summary of the MPLAB REAL ICE in-circuit emulator functions is listed here.
• Emulator Selection and Switching
• Emulator Options Selection
• Emulator Windows & Dialogs
11.2
EMULATOR SELECTION AND SWITCHING
Use the Project Properties dialog to select or switch emulators for a project. To switch
you must have more than one MPLAB REAL ICE in-circuit emulator connected to your
computer. MPLAB X IDE will differentiate between the two by displaying two different
serial numbers.
To select or change the emulator used for a project:
1. Open the Project Properties dialog by doing one of the following:
a) Click on the project name in the Project window and select File>Project
Properties.
b) Right click on the project name in the Project window and select “Properties”.
2. Under “Categories”, click on “[[default]]”
3. Under “Hardware Tools”, find “REAL ICE” and click on a serial number (SN) to
select an emulator for use in the project.
11.3
EMULATOR OPTIONS SELECTION
Set up emulator options on the emulator property pages of the Project Properties
dialog.
1. Open the Project Properties dialog by doing one of the following:
a) Click on the project name in the Project window and select File>Project
Properties.
b) Right click on the project name in the Project window and select “Properties”.
2. Under “Categories”, click on “REAL ICE”
3. Select property pages from “Options categories”. Click on an option to see its
description in the text box below. Click to the right of an option to change it.
Available option categories are:
•
•
•
•
•
•
•
•
Trace and Profiling
External Triggers
Clock
Freeze Peripherals
Debug Options
Program Options
Firmware
Memories to Program
2013 Microchip Technology Inc.
DS52085A-page 101
Emulator User’s Guide for MPLAB X IDE
11.3.1
Trace and Profiling
Depending on the device you have selected for your project, you may be able to use
trace or PC sampling/profiling when debugging. Enable and set up these features as
specified below.
8-Bit and 16-Bit Devices
Options available on this page depend on the trace/profiling features of the project
device. For more on trace and profiling, see Chapter 6. “Specific Debug Functions: 8and 16-Bit Devices”.
TABLE 11-1:
TRACE/PROFILING OPTION CATEGORY
Data Collection Selection
Enable/Disable data collection.
• Off - Do not use trace or PC sampling.
• User Instrumented Trace - see
Section 6.3 “Instrumented Trace”.
• PC Sampling - see Section 6.4 “PC Sampling”.
Data File Path and Name
Enter or change the path and/or name of the file
used to store data.
Data File Maximum Size (bytes)
Set the maximum size of the data file.
Data Buffer Maximum Size (bytes)
Set the size of the data buffer, up to 54600 bytes (on
board the emulator unit.)
User Instrumented Trace Items
Disable Trace Macros
Check to temporarily disable trace macros or
uncheck to enable trace macros.
To disable trace, remove all macros and select “Off”
under “Data Collection Selection”.
Communications Medium
Select the trace medium, if available (device dependent): Native, I/O Port, SPI.
I/O Port Selection
Specify the device port to be used for I/O port trace.
The available combinations for the selected device
will be listed.
SPI Selection
Specify the device SPI pins to be used for SPI trace.
The available pins for the selected device will be
listed.
PC Sample Items - Only on Some 16-bit Devices
DS52085A-page 102
Timer Selection (Not Used by Application Code)
Select a device timer to use to count PC samples.
Note: You will no longer be able to use this timer in
your application. It will be dedicated to PC sampling.
Note: You may select only one timer; you cannot
combine two timers to get a 32-bit timer. Use of one
of a 32-bit timer pair will prohibit that pair from operating as a 32-bit timer.
Timer Interrupt Priority
Select an interrupt priority for the timer.
Note: Select a priority that is higher than other priorities you have set in your application. If you do not,
the other priorities will preempt the sampling priority
and you will not capture these samples.
Timer Interval
Enter a sampling interval.
This must be integer values (1, 2, 3, and so forth).
If you are not capturing data, you may be missing
samples given your current interval. Try adjusting the
unit selection and interval, for example, if you had 1
millisecond, try 990 microseconds.
2013 Microchip Technology Inc.
Emulator Function Summary
TABLE 11-1:
TRACE/PROFILING OPTION CATEGORY (CONTINUED)
Timer Interval Units
Select a sampling interval unit:
• microseconds
• milliseconds
• seconds
• instruction cycles
32-Bit Devices
Options available on this page depend on the trace/profiling features of the project
device. For more on trace and profiling, see Chapter 7. “Specific Debug Functions:
32-Bit Devices”.
TABLE 11-2:
TRACE/PROFILING OPTION CATEGORY
Data Collection Selection
Enable/Disable data collection.
• Off - Do not use trace of PC sampling
• Instruction Trace/Profiling - see
Section 7.3 “PIC32 Instruction Trace” and
Section 7.5 “PC Profiling”.
• User Instrumented Trace - see
Section 7.4 “Instrumented Trace”.
Data File Path and Name
Enter or change the path and/or name of the file
used to store data.
Data File Maximum Size (bytes)
Set the maximum size of the data file.
Data Buffer Maximum Size (bytes)
Set the size of the data buffer, up to 54600 bytes (on
board the emulator unit.)
User Instrumented Trace Items
Disable Trace Macros
Check to temporarily disable trace macros or
uncheck to enable trace macros.
To disable trace, remove all macros and select “Off”
under “Data Collection Selection”.
Communications Medium
Select the trace medium, if available (device dependent): Native.
11.3.2
External Triggers
Select external triggers for Triggers 0 through 7. For more on triggers, see
Section 5.5 “External Triggers (Logic Probes)”.
2013 Microchip Technology Inc.
DS52085A-page 103
Emulator User’s Guide for MPLAB X IDE
11.3.3
Clock
Enter the runtime clock (instruction) speed on this tab. This does not set the speed, but
informs the emulator of its value for runtime watch, data capture and trace.
Note:
Clock switching is available for data capture and trace, but you must set the
clock correctly or you may see issues. Enter the fastest instruction speed
you will be using on this tab.
TABLE 11-3:
CLOCK OPTION CATEGORY
Use FRC in debug mode
(dsPIC33F and PIC24F/H devices
only)
When debugging, use the device fast internal RC
(FRC) for clocking instead of the oscillator specified
for the application. This is useful when the application clock is slow.
Checking this checkbox will let the application run at
the slow speed but debug at the faster FRC speed.
Reprogram after changing this setting.
Note: Peripherals that are not frozen will operate at
the FRC speed while debugging.
Target run-time instruction speed
Enter a value for the “Speed unit” selected.
Example 1: For a PIC24 MCU and a target clock
oscillator at 32 MHz (HS), instruction speed = 32
MHz/2 = 16 MIPS.
Example 2: For a PIC18F8722 MCU and a target
clock oscillator at 10 MHz (HS) making use of the
PLL (x4 = 40 MHz), instruction speed = 40 MHz/4 =
10 MIPS.
Instruction speed units
Select either:
KIPS – Thousands (103) of instructions per second
MIPS – Millions (106) of instructions per second
11.3.4
Freeze Peripherals
Select peripherals to freeze or not freeze on program halt.
TABLE 11-4:
FREEZE PERIPHERALS OPTION CATEGORY
Freeze Peripherals
Freeze all peripherals on halt.
This options applies to PIC12/16/18 MCUs.
Peripheral
Freeze this peripheral on halt.
This options applies to 16- and 32-bit MCUs.
PIC12/16/18 MCU Devices
To freeze/unfreeze all device peripherals on halt, check/uncheck the “Freeze on Halt”
checkbox. If this does not halt your desired peripheral, be aware that some peripherals
have no freeze on halt capability and cannot be controlled by the emulator.
dsPIC30F/33F, PIC24F/H and PIC32 Devices
For peripherals in the list “Peripherals to Freeze on Halt”, check to freeze that peripheral on a halt. Uncheck the peripheral to let it run while the program is halted. If you do
not see a peripheral on the list, check “All Other Peripherals”. If this does not halt your
desired peripheral, be aware that some peripherals have no freeze on halt capability
and cannot be controlled by the emulator.
To select all peripherals, including “All Other Peripherals”, click Check All. To deselect
all peripherals, including “All Other Peripherals”, click Uncheck All.
DS52085A-page 104
2013 Microchip Technology Inc.
Emulator Function Summary
11.3.5
Debug Options
Use software breakpoints, if available for the project device.
TABLE 11-5:
DEBUG OPTIONS OPTION CATEGORY
Use Software Breakpoints
TABLE 11-6:
Check to use software breakpoints. Uncheck to use
hardware breakpoints. See discussion below to
determine which type is best for your application.
SOFTWARE VS HARDWARE BREAKPOINTS
Features
Software Breakpoints
Hardware Breakpoints
Number of breakpoints
unlimited
limited
Breakpoints are written to
program memory
debug registers
Time to set breakpoints
oscillator speed dependent –
can take minutes
minimal
Skidding
no
yes
Note: Using software breakpoints for debug impacts device endurance. Therefore, it is
recommended that devices used in this manner not be used as production parts.
11.3.6
Program Options
Choose to erase all memory before programming or to merge code.
TABLE 11-7:
PROGRAM OPTIONS OPTION CATEGORY
Erase All Before Program
Check to erase all memory before programming
begins.
Unless programming new or already erased devices,
it is important to have this box checked. If not
checked, the device is not erased and program code
will be merged with the code already in the device.
Enable Low Voltage Programming
For Programmer Settings only, PIC12F/16F1xxx
devices:
• For the LVP configuration bit set to "Low-voltage
programming enabled", you may program in either
high-voltage (default) or low-voltage (enabled
here.)
• For the LVP configuration bit set to "High-voltage
on MCLR/Vpp must be used for programming",
you may only program in high-voltage.
11.3.7
Firmware
Select and load emulator firmware. MPLAB X IDE automatically downloads the correct
firmware for your project. Only change this setting if you are having issues.
TABLE 11-8:
FIRMWARE OPTION CATEGORY
Use Latest Firmware
Check to use the latest firmware. Uncheck to select
the firmware version below.
Firmware File
Click in the right-hand text box to search for a firmware file (.jam) to associate with the emulator:
<install path>MPLABX/mplab_ide/
mplablibs/modules/ext/REALICE.jar
2013 Microchip Technology Inc.
DS52085A-page 105
Emulator User’s Guide for MPLAB X IDE
11.3.8
Memories to Program
Select the memories to be programmed into the target.
TABLE 11-9:
DS52085A-page 106
MEMORIES TO PROGRAM OPTION CATEGORY
Auto select memories and ranges
Allow REAL ICE to Select Memories - The emulator uses your selected device and default settings to
determine what to program.
Manually select memories and ranges - You select
the type and range of memory to program (see
below.)
Memory
Check to program Memory, where Memory is the
type of memory. Types include: EEPROM, ID, Boot
Flash, Auxilliary.
Program Memory
Check to program the target program memory range
specified below.
Program Memory Start (hex)
Program Memory End (hex)
The starting and ending hex address range in program memory for programming, reading, or verification.
If you receive a programming error due to an incorrect end address, correct the end address and program again.
Note: The address range does not apply to the
Erase function. The Erase function will erase all data
on the device.
Preserve Program Memory
Check to not program the target program memory
range specified below.
Preserve Program Memory Start (hex)
Preserve Program Memory End (hex)
The starting and ending hex address range in target
program memory to preserve when programming,
reading, or verifying.
This memory is read from the target and overlayed
with existing MPLAB X IDE memory.
Preserve Memory
Check to not erase Memory when programming,
where Memory is the type of memory. Types include:
EEPROM, ID, Boot Flash, Auxilliary.
2013 Microchip Technology Inc.
Emulator Function Summary
11.4
EMULATOR WINDOWS & DIALOGS
The following windows and dialogs are used specifically for the emulator and/or other
debug tools.
• Trace Window and Releated Dialogs
• Application In/Out Window and Related Dialogs
• PC Sampling Window and Related Dialogs
11.4.1
Trace Window and Releated Dialogs
The trace window displays the results of a trace. This window is available for the
emulator and the simulator.
FIGURE 11-1:
TRACE WINDOW
Right clicking in a column will pop up a menu with the following functions. For more on
these functions, see the MPLAB X IDE User’s Guide (DS52027), “MPLAB X IDE Windows and Dialogs”, “Trace Window”.
For more on using trace, see:
• Section 6.3 “Instrumented Trace” – 8- and 16-bit Devices
• Section 7.3 “PIC32 Instruction Trace” – 32-bit Devices
2013 Microchip Technology Inc.
DS52085A-page 107
Emulator User’s Guide for MPLAB X IDE
11.4.2
Application In/Out Window and Related Dialogs
The Application In/Out window supports the App IO function where runtime control
information can be sent to an application through MPLAB IDE (APPIN) and status information can be sent by the application to MPLAB IDE (APPOUT).
FIGURE 11-2:
APP IN/OUT WINDOW
Other actions are available from the buttons. Right clicking in the Ouput text box will
pop up a menu with the same functions.
TABLE 11-10: APP IN/OUT WINDOW BUTTONS
Button
Properties
Description
Open the Set App IO Properties dialog.
Set the format of the input and output: Text, 8-bit Hex, 16-bit Hex,
or 32-bit Hex.
Enable/disable data capture. Browse to a location to save the output to a file.
Clear App IO Output
Clear the output content from the Output text box.
Copy App IO Output to
Output View
Copy the Output text box content to the Output window.
For more on using this window and its related dialogs, see:
• Section 6.5 “Application In/Out” – 8- and 16-bit Devices
• Section 7.6 “Application In/Out” – 32-bit Devices
11.4.3
PC Sampling Window and Related Dialogs
Program Counter (PC) sampling is a method of determining the amount of time spent
in each application function for use in code optimization. The PC Sampling window will
show the function name, sample count for that function, percentage sample count is of
the total samples, and a bar graph of the count.
For more on PC Sampling and Profiling, see:
• Section 6.4 “PC Sampling” – 8- and 16-bit Devices
• Section 7.5 “PC Profiling” – 32-bit Devices
DS52085A-page 108
2013 Microchip Technology Inc.
MPLAB® REAL ICE™ IN-CIRCUIT
EMULATOR USER’S GUIDE FOR
MPLAB X IDE
Chapter 12. Hardware Specification
12.1
INTRODUCTION
The hardware and electrical specifications of the basic MPLAB REAL ICE in-circuit
emulator system are detailed.
12.2
HIGHLIGHTS
This chapter discusses:
•
•
•
•
•
12.3
USB Port/Power
Emulator Pod
Standard Communication Hardware
Loop-Back Test Board
Target Board Considerations
USB PORT/POWER
The MPLAB REAL ICE in-circuit emulator is connected to the host PC via a Universal
Serial Bus (USB) port, version 2.0 compliant. The USB connector is located on the
back of the pod.
The system is capable of reloading the firmware via the USB interface.
System power is derived from the USB interface. The emulator is classified as a high
power system per the USB specification, and requires 300 mA of power from the USB
to function in all operational modes (emulator/programmer).
Note:
The MPLAB REAL ICE in-circuit emulator is powered through its USB connection. The target board is powered from its own supply. The emulator
cannot provide power to the target board.
Cable Length – The PC-to-emulator cable length for proper operation has been tested
for each driver board and is shipped in the emulator kit.
Powered Hubs – If you are going to use a USB hub, make sure it is powered. Also,
USB ports on PC keyboards do not have enough power for the emulator to operate.
2013 Microchip Technology Inc.
DS52085A-page 109
Emulator User’s Guide for MPLAB X IDE
12.4
EMULATOR POD
The emulator pod (DV244005) consists of a main board enclosed in the casing with a
port for either of two driver boards (for standard or high-speed communication with a
target). On the emulator encloser are push buttons, indicator lights (LEDs) and a logic
probe connector interface.
12.4.1
Main Board
This component has an interface processor (dsPIC DSC), a USB 2.0 interface capable
of USB speeds of 480 Mb/sec, a Field Programmable Gate Array (FPGA) for general
system control and increased communication throughput, an SRAM for holding the program code image for programming into the emulation device on-board Flash, the external trigger logic, user interface push buttons and LED indicators.
The MPLAB REAL ICE in-circuit emulator system supports two types of interfaces to
the target processor. They consist of the standard driver board and an optional
high-speed driver board. These boards are inserted into the emulator pod via a card
guide.
Durability/insertion life cycle of the card guide: 10,000 cycles
12.4.2
Push Buttons
The push buttons have the following significance.
Push Button
Related
LED
Description
Reset
Status
Push to Reset the device.
Function
Status
Halt – When running, push to put the emulator in the Break or
halted condition.
12.4.3
Indicator Lights (LEDs)
The indicator lights have the following significance.
TABLE 12-1:
Type
Color
LED INDICATORS
Condition
Description
Active
Blue
Lit
Power has been applied or target has been connected.
Status
Green
Lit
The emulator is operating normally – standby.
Red
Lit
An operation has failed.
Blinking
USB Comm error or driver not installed.
Orange Lit
12.4.4
The emulator is busy.
Logic Probe/External Trigger Interface
Probes can be connected to the 14-pin header on the side of the unit for processing
external signals that are used for triggering external equipment. This header contains
8 input/output connections that are user selectable as inputs or outputs with logic levels
that are proportional to the target operating voltage.
The outputs can be used for triggering an external logic analyzer or oscilloscope to
allow the developer to capture events of interest based on trigger criteria set within
MPLAB IDE. The external trigger is a pulse of approximately 1.5 s. This value is not
determinsitic and the external tool should be triggered on a pulse edge.
The inputs are part of a trigger bus.
DS52085A-page 110
2013 Microchip Technology Inc.
Hardware Specification
FIGURE 12-1:
LOGIC PROBE PINOUT ON EMULATOR
13
14
1*
2
Logic probes may be attached to this connector to give the functionality described in
Table 12-2. The probes are color coded and labeled for easy identification.
TABLE 12-2:
LOGIC PROBE PINOUT DESCRIPTION
Pin
I/O
Name
1
O
2
O
3
O
4
I
TCLK
5
I/O
6
I/O
7
I/O
8
9
Function
Color
VDD reference
Red
NC
No connection
Gray
NC
No connection
Gray
VDD
(1)
External synchronous clock
Gray
External input/output bit 7
White
EXT6
External input/output bit 6
White
EXT5
External input/output bit 5
White
I/O
EXT4
External input/output bit 4
White
I/O
EXT3
External input/output bit 3
White
10
I/O
EXT2
External input/output bit 2
White
11
I/O
EXT1
External input/output bit 1
White
12
I/O
External input/output bit 0
White
13
Gnd
GND
System Ground
Black
14
Gnd
GND
System Ground
Black
Note 1:
Note 2:
(2)
EXT7
(2)
EXT0
Do not connect VDD to the target.
EXT0 and EXT7 are temporarily used during loop-back test. Ensure that they are
not connected together.
The electrical specifications for logic probes are listed in Table 12-3.
TABLE 12-3:
Logic Inputs
LOGIC PROBE ELECTRICAL SPECIFICATIONS
VIH = VDD x 0.7V (min)
VIL = VDD x 0.3V (max)
Logic Outputs
VDD = 5V
VDD = 3V
VDD = 2.3V
VDD = 1.65V
VOH = 3.8V min
VOH = 2.4V min
VOH = 1.9V min
VOH = 1.2V min
VOL = 0.55V max VOL = 0.55V max VOL = 0.3V max
2013 Microchip Technology Inc.
VOL = 0.45V max
DS52085A-page 111
Emulator User’s Guide for MPLAB X IDE
12.5
STANDARD COMMUNICATION HARDWARE
For standard emulator communication with a target (Section 3.4.1 “Standard Communication”), use the standard driver board.
To use this type of communication with a debug header, you may need a device-specific Processor Pak, which includes an 8-pin connector debug header containing the
desired ICE/ICD device and a standard adapter board (8-pin to 6-pin connection).
Note:
Older debug headers used a 6-pin (RJ-11) connector instead of an 8-pin
connector, so these headers may be connected directly to the emulator.
For more on available debug headers, see the “Debug Header Specification” in “Recommended Reading”.
12.5.1
Standard Driver Board
The standard driver board is the main interface to the target processor. It contains the
connections to the high voltage (VPP), VDD sense lines, and clock and data connections
required for programming and connecting with the target devices.
The VPP high-voltage lines can produce a variable voltage that can swing from 14 to 0
volts to satisfy the voltage requirements for the specific emulation processor.
The VDD sense connection draws very little current from the target processor. The
actual power comes from the MPLAB REAL ICE in-circuit emulation system as the VDD
sense line is used as a reference only to track the target voltage. The VDD connection
is isolated with an optical switch.
The clock and data connections are interfaces with the following characteristics:
• Clock and data signals are in high-impedance mode (even when no power is
applied to the MPLAB REAL ICE in-circuit emulator system)
• Clock and data signals are protected from high voltages caused by faulty targets
systems, or improper connections
• Clock and data signals are protected from high current caused from electrical
shorts in faulty target systems
Note:
When using the standard driver board, the rate for real-time streaming data
and tracing is limited to 15 MIPS.
FIGURE 12-2:
MODULAR CONNECTOR PINOUT OF STANDARD DRIVER
BOARD
1 6
Front view of Modular Connector
on Std Driver Board
246
1 35
Bottom view of Modular Connector
Pinout on Std Driver Board
DS52085A-page 112
Modular
Connector Pin
Microcontroller
Pin
1
Not Used
2
RB6
3
RB7
4
Ground
5
VDD Target
6
VPP
2013 Microchip Technology Inc.
Hardware Specification
12.5.2
Modular Cable and Connector
For standard communications, a modular cable connects the emulator and the target
application. The specifications for this cable and its connectors are listed below.
12.5.2.1
MODULAR CABLE SPECIFICATION
• Manufacturer, Part Number – Microchip Technology, 07-00024
The length for this cable (L) is 6 inches. If you require a longer cable, consider purchasing the Performance Pak. For details see Section 13.3 “High-Speed/LVDS Communication Hardware (Performance Pak)”. It is not recommended that you use a
modular cable shorter than 6 inches or you may experience communication problems.
FIGURE 12-3:
MODULAR CABLE
L
Pin 6
Pin 1
12.5.2.2
MODULAR PLUG SPECIFICATION
• Manufacturer, Part Number – AMP Incorporated, 5-554710-3
• Distributor, Part Number – Digikey, A9117ND
12.5.2.3
MODULAR CONNECTOR SPECIFICATION
• Manufacturer, Part Number – AMP Incorporated, 555165-1
• Distributor, Part Number – Digikey, A9031ND
The following table shows how the modular connector pins on an application
correspond to the microcontroller pins. This configuration provides full ICD
functionality.
FIGURE 12-4:
MODULAR CONNECTOR PINOUT OF TARGET BOARD
1 6
2013 Microchip Technology Inc.
Modular
Connector Pin
Microcontroller
Pin
6
Not Used
5
RB6
4
RB7
3
Ground
2
VDD Target
1
VPP
Front view of Modular Connector
on Target Board
246
135
Bottom view of Modular Connector
Pinout on Target Board
DS52085A-page 113
Emulator User’s Guide for MPLAB X IDE
12.6
LOOP-BACK TEST BOARD
This board (included with DV244005) can be used to verify that the emulator is
functioning properly. To use this board:
1.
2.
3.
4.
5.
6.
7.
8.
9.
10.
Disconnect the emulator from the target and the PC.
Insert the standard driver board if it is not already installed.
Plug the loopback test board into the pod’s logic probe connector.
Connect the loop-back test board to the standard driver board using the modular
cable.
Reconnect the emulator to the computer.
Launch MPLAB X IDE. Ensure that all existing projects are closed.
Select Debug>Run Debugger/Programmer Self Test, then, select the specific
“REAL ICE” you want to test and click OK.
Ensure the loopback test board and cable are connected and click Yes to
continue.
View the self test results in the emulator’s Output window.
After the emulator passes the self test, disconnect the loopback test board from
the emulator.
MPLAB IDE will detect and run the complete loop-back test and give you a status
(PASS/FAIL). The loop-back test board detection works by applying a short pulse on
EXT0 and detecting it on EXT7 on the logic probe connector (Section 12.4.4 “Logic
Probe/External Trigger Interface”). Once the board is detected, the emulator applies
stimulus to the clock/data and VPP lines and reads the sequence back from the logic
probe connector interface, thus confirming proper signals levels and connectivity down
to the connector interfaces.
FIGURE 12-5:
LOOP-BACK TEST BOARD CONNECTIONS
Driver Board Slot
Emulator
Pod
Logic Probe Connector
12.7
Standard Driver Board
Modular Cable
Loop-Back Test Board
TARGET BOARD CONSIDERATIONS
The target board should be powered according to the requirements of the selected
device (1.6V-5.5V) and the application.
Note:
The emulator cannot power the target.
The emulator does sense target power. There is a 10 K load on VDD_TGT.
Depending on the type of emulator-to-target communications used, there will be some
considerations for target board circuitry:
• Section 3.5.3 “Target Connection Circuitry”
• Section 3.5.4 “Circuits That Will Prevent the Emulator From Functioning”
Additional design considerations may be found in “Development Tools Design
Advisory” (DS51764).
DS52085A-page 114
2013 Microchip Technology Inc.
MPLAB® REAL ICE™ IN-CIRCUIT
EMULATOR USER’S GUIDE FOR
MPLAB X IDE
Chapter 13. Emulator Accessories
13.1
INTRODUCTION
The MPLAB REAL ICE in-circuit emulator has several different accessories to aid in
different debugging conditions.
13.2
HIGHLIGHTS
This chapter discusses:
•
•
•
•
13.3
High-Speed/LVDS Communication Hardware (Performance Pak)
MPLAB REAL ICE Isolator Unit (Opto-Isolator)
MPLAB REAL ICE JTAG Adaptor Board
Other Accessories
HIGH-SPEED/LVDS COMMUNICATION HARDWARE (PERFORMANCE PAK)
For high-speed/LVDS communication with a target (Section 3.4.2 “High-Speed/LVDS
Communication (Performance Pak)”), use the Performance Pak (AC244002).
• High-Speed Driver Board
• High-Speed Receiver Board
• LVDS Cables and Target Pinout
To use this type of communication with a debug header, you will need a device-specific
Processor Pak, which includes an 8-pin connector debug header containing the
desired ICE/ICD device and a standard adapter board (8-pin to 6-pin connection.)
Note:
You will not need the standard adapter board for high-speed communications. Instead, you will plug the 8-pin connector end of the high-speed
receiver board directly into the 8-pin connector of the debug header.
For more on available debug headers, see the “Processor Extension Pak and
Header Specification (DS51292)” in “Recommended Reading”.
2013 Microchip Technology Inc.
DS52085A-page 115
Emulator User’s Guide for MPLAB X IDE
13.3.1
High-Speed Driver Board
The high-speed driver board consists of two separate multipoint LVDS (Low Voltage
Differential Signaling) transmitters and receivers for clock and data. Multipoint LVDS
requires 100 ohm terminations at each driver output and receiver input, per the standard, and multipoint configurations type 2 receivers are used, as these are intended for
control signals or where fail-safe provisions are needed. Even though the standard
allows for any combination of drivers, receivers and/or transceivers of up to 32 on the
line, only two will be used. The driver board has a port expansion which is controlled
by an I2C™ interface for sending/receiving status information to/from the emulator. The
high-speed driver board assembly is inserted into the emulator pod via the card guide.
Note:
The driver board can support data rates up to 100M/bits. However, due to
device speeds, the acutal rate is up to 20M/bits.
FIGURE 13-1:
MODULAR CONNECTORS PINOUT OF HIGH-SPEED DRIVER
BOARD
1
8 1
J2
8
1
3 5 7
2
Front view of Modular Connectors
on HS Driver Board
J3
4 6
1
8
3 5 7
2
4 6
8
Bottom view of Modular Connectors
Pinout on HS Driver Board
J2 Pinout
Pin
1
2
3
4
Name
LVD+
LVD–
LVC+
LV_VDD
Function
LV Std Data +
LV Std Data –
LV Std Clock +
Power
Pin
5
6
7
8
Name
GND
LVC–
VDD_TGT
VPP_TGT
Function
Ground
LV Std Clock –
VDD on target
VPP on target
J3 Pinout
Pin
1
2
3
4
Name
DATAEN+
DATAEN–
CLKEN+
USPID+
Function
Std Data Enable +
Std Data Enable –
Std Clock Enable +
*Serial Data +
Pin
5
6
7
8
Name
USPID–
CLKEN–
USPIC+
USPIC–
Function
*Serial Data –
Std Clock Enable –
*Serial Clock +
*Serial Clock –
* Optional - see Section 3.6.2 “SPI Trace Connections (High-Speed/LVDS
Connection)”.
DS52085A-page 116
2013 Microchip Technology Inc.
Emulator Accessories
13.3.2
High-Speed Receiver Board
A high-speed receiver board assembly is also required when using LVDS connectivity.
This board is a counterpart to the high-speed driver board assembly in the pod. When
the driver is active on the pod, the receiver is active in the receiver board. Alternatively,
when the driver is active on the receiver board, the corresponding receiver is active in
the driver board, providing transmitting and receiving capability at both ends. The
receiver board contains an 8-pin, 0.100 inch centers header, and is used to connect to
the target board or a debug header. The receiver board circuitry may be implemented
on the target system to avoid using the receiver board.
FIGURE 13-2:
MODULAR CONNECTORS PINOUT OF HIGH-SPEED
RECEIVER BOARD
1
8 1
J3
8
1
3 5 7
2
Front view of Modular Connectors
on HS Receiver Board
J2
4 6
1
8
3 5 7
2
4 6
8
Bottom view of Modular Connectors
Pinout on HS Receiver Board
J3 Pinout
Pin
1
2
3
4
Name
DATAEN+
DATAEN–
CLKEN+
USPID+
Function
Pin
Std Data Enable +
Std Data Enable –
Std Clock Enable +
*Serial Data +
5
6
7
8
Name
Function
USPID–
CLKEN–
USPIC+
USPIC–
*Serial Data –
Std Clock Enable –
*Serial Clock +
*Serial Clock –
* Optional - see Section 3.6.2 “SPI Trace Connections (High-Speed/LVDS
Connection)”.
J2 Pinout
Pin
1
2
3
4
Name
LVD+
LVD–
LVC+
LV_VDD
FIGURE 13-3:
2013 Microchip Technology Inc.
LV Std Data +
LV Std Data –
LV Std Clock +
Power
Pin
5
6
7
8
Name
Function
GND
LVC–
VDD_TGT
VPP_TGT
Ground
LV Std Clock –
VDD on target
VPP on target
8-PIN HEADER PINOUT OF HIGH-SPEED RECEIVER BOARD
J1
1
2
3
Top of
HS Rcvr 4
Board
5
6
7
8
Function
Pin
Name
1
2
3
4
VPP
VDD_TGT
GND
ICSPDAT
Function
Power
Power on target
Ground
Standard Com Data
Pin
Name
Function
5
6
7
8
ICSPCLK
AUX
DAT
CLK
Standard Com Clock
Auxiliary
*Trace Data
*Trace Clock
* Optional – see Section 3.6.2 “SPI Trace Connections
(High-Speed/LVDS Connection)”.
DS52085A-page 117
Emulator User’s Guide for MPLAB X IDE
FIGURE 13-4:
RECEIVER BOARD SCHEMATIC – ICSPDAT
AHC1G04-SOT5
NDATA_EN
4
3
100
6
7
LVD-
1
VCCA
6
VCCB
VDD_TAR
4
LVD+
+3.3V
DATA_EN
2
DATA
5
DATA_EN
2
3
1
DIR
A
B 4
GND
SN65MLVD206
ICSPDAT
4.7K
74LVC1T45_SOT-6P
3
DATAEN+
4
100
2
6
1
7
DATAEN-
DATA_EN
SN65MLVD206
FIGURE 13-5:
RECEIVER BOARD SCHEMATIC – ICSPCLK
AHC1G04-SOT5
NCLK_EN
4
2
3
100
LVC-
6
7
1
VCCA
6
VCCB
VDD_TAR
4
LVC+
+3.3V
CLK_EN
CLK
5
CLK_EN
2
3
1
DIR
A
B 4
4.7K
GND
SN65MLVD206
ICSPCLK
74LVC1T45_SOT-6P
3
4
CLKEN+
100
CLKEN-
6
7
2
1
CLK_EN
SN65MLVD206
DS52085A-page 118
2013 Microchip Technology Inc.
Emulator Accessories
FIGURE 13-6:
RECEIVER BOARD SCHEMATIC – DAT & CLK
3
USPID+
+3.3V
4
100
6
1
7
USPID-
DAT
2
10K
10K
SN65MLVD206
3
USPIC+
+3.3V
4
100
2
6
1
7
USPIC-
CLK
10K
POWER
10K
0.1uF
SN65MLVD206
13.3.3
LVDS Cables and Target Pinout
The emulator-to-target cable length for proper operation has been tested for this
driver/receiver board combination and is shipped in the Performance Pak. The recommended lengths are 3 feet, with a maximum of 10 feet.
FIGURE 13-7:
LVDS CABLE
Pin 8
Pin 1
The target board should have the following 8-pin connection pin-out to plug in to the
receiver board.
FIGURE 13-8:
8-PIN HEADER PINOUT AT TARGET
J1
1
2
3
4
5
6
7
8
2013 Microchip Technology Inc.
Top of
Target
Board
Pin
Name
1
2
3
4
VPP
VDD_TGT
GND
ICSPDAT
Function
Power
Power on target
Ground
Standard Com Data
Pin
Name
Function
5
6
7
8
ICSPCLK
AUX
DAT
CLK
Standard Com Clock
Auxiliary
*Trace Data
*Trace Clock
* Optional – see Section 3.6.2 “SPI Trace Connections
(High-Speed/LVDS Connection)”.
DS52085A-page 119
Emulator User’s Guide for MPLAB X IDE
13.4
MPLAB REAL ICE ISOLATOR UNIT (OPTO-ISOLATOR)
The MPLAB REAL ICE Isolator Unit (AC244005) is a useful accessory to the MPLAB
REAL ICE in-circuit emulator system. The isolator enables connectivity for AC line and
high voltage applications not referenced to ground. Typically, these are consumer
applications such as light dimmers, vacuum cleaners, washing machines, and other
types of motor-based systems where the MCU uses a non-isolated power supply
DANGER
Do not remove the board enclosure. Depending on your application, you
could be exposing yourself to dangerous voltage levels.
The isolator connects on one end to the Performance Pak high-speed cables. The isolator connects on the other end to the target using an 8-pin, single-line ICSP connector.
See Figure 13-9.
To use this board:
1. Obtain a Performance Pak (AC244002). This board can only be used with the
Performance Pak.
2. Use this board instead of the high-speed receiver board. See
Section 13.3 “High-Speed/LVDS Communication Hardware (Performance
Pak)” for pin-outs.
Because of the complexity and high dynamic voltage range, the isolator currently provides MCU technology support only for some devices. See online help, “Device and
Feature Support” for details.
Note:
Isolation does not support trace.
FIGURE 13-9:
HIGH-SPEED EMULATOR SYSTEM USING ISOLATOR UNIT
Emulator Pod
ACTIVE
STATUS
FUNCTION
RESET
J2
J3
High-Speed
Driver Board
Performance Pak
Isolator
J2
Target Device
or PIM
Target Board
DS52085A-page 120
pin 1
J3
Microchip
Isolator Unit Replaces
High-Speed
Receiver Board
2013 Microchip Technology Inc.
Emulator Accessories
13.4.1
Isolator Unit Design
The isolator is a bridge where electrically hot signals are passed through transparently
to the emulator. The ICSP interface signals are magnetically or optically isolated providing up to 2.5KV equivalent isolation protection. The isolator is housed in its own
enclosure providing an additional measure of safety.
This unit contains the same circuitry as the high-speed receiver board (see
Section 13.3.2 “High-Speed Receiver Board”) plus isolation circuitry (see the
following schematics).
ISOLATOR UNIT SCHEMATIC - ICSPDAT
+3.3V
1
4
13
LVD+
6
DATA
HOT_ICSPDAT
HOT_DEN
11
9
2
GND1 GND2
8 GND1 GND2 15
1
7
LVD-
12
10
7
2
6
16
14
3
4
R1
100
VDD1 VDD2
3
5
U1
HOT_VDD
U7
ISO
FIGURE 13-10:
ADUM3401_SO16_300
SN65MLVD206
74AHC1G04_SOT-23_5L
2
FIGURE 13-11:
NDATA_EN
U9
4
ISOLATOR UNIT SCHEMATIC - ICSPCLK
+3.3V
1
LVC+
2
R1
100
6
7
LVC-
1
SN65MLVD206
CLK
16
14
4
13
3
4
VDD1 VDD2
3
5
U2
HOT_VDD
U13
6
ISO
DATA_EN
12
10
HOT_ICSPCLK
HOT_CEN
11
7
9
2
GND1 GND2
8 GND1 GND2 15
ADUM3401_SO16_300
74AHC1G04_SOT-23_5L
CLK_EN
2
NCLK_EN
4
U11
2013 Microchip Technology Inc.
DS52085A-page 121
Emulator User’s Guide for MPLAB X IDE
FIGURE 13-12:
ISOLATOR UNIT SCHEMATIC - DAT & CLK
3
U3
4
DATAEN+
2
R3
100
DATAEN-
6
7
1
DATA_EN
SN65MLVD206
U4
CLKEN+
4
2
R4
100
CLKEN-
3
6
7
1
CLK_EN
SN65MLVD206
USPID+
+3.3V
4
USDO
2
R5
100
USPID-
3
6
7
1
1
SN65MLVD206
U6
USPIC+
R6
100
USPIC-
DS52085A-page 122
3
R7
10K
+3.3V
4
USCK
1
SN65MLVD206
R36
10K
+3.3V
U8
VDD1 VDD2
HOT_VDD
16
3
14
4
13
10
5
2
6
7
+3.3V
ISO
U5
HOT_DEN
HOT_CEN
HOT_VDD
12
6
11
7
2 GND1 GND2 9
8 GND1 GND2 15
HOT_USDO
HOT_USCK
R9
10K
R8
10K
ADUM3402_SO16_300
2013 Microchip Technology Inc.
Emulator Accessories
FIGURE 13-13:
ISOLATOR UNIT SCHEMATIC - POWER
+3.3V
C18
10uF 6.3V
C21
0.1uF
R23
L1
D1
.05
10uH
CRS08
+3.3V
U18
R17
100K
+3.3V
1,2,5,6
R20
100K
8
VIN
7 PG
6
MC
5
SHDN
1
EXT
2
GND
3
CS
4
FB
C30
0.1uF
MCP1652_MSOP8
R28
4.22K 1%
R38
L4
D4
.05
10uH
CRS08
1,2,5,6
U22
HOT_VDD
R42
100K
8
VIN
7
PG
6
MC
5
SHDN
1
EXT
2
GND
3
CS
4
FB
Q1
2013 Microchip Technology Inc.
C31
10 25V
R41
0.1
3
+3.3V
C17-C18
0.1
R40
11.7K 1%
HOT_+5V
IRLMS2002_MICRO6 4
MCP1652_MSOP8
+5V
R34
0.1
3
HOT_VDD
R37
100K
R31
11.7K 1%
C25
10 25V
IRLMS2002_MICRO6 4
HOT_VDD
C32
10uF 6.3V
Q1
+5V
C1-C9, C12-C13, C28
0.1
R39
4.22K 1%
HOT_VDD
C10-C11, C15
0.1
VDD_TAR
C14, C29
0.1
DS52085A-page 123
Emulator User’s Guide for MPLAB X IDE
FIGURE 13-14:
ISOLATOR UNIT SCHEMATIC - VDD, VPP, MCLR
VDD DETECT
HOT_+5V
U15
8
+5V
+5V
U16 5
VDD_TAR
R10
IN+
1
3
IN- 4
2
0
NC
1
U17 5
7 NC
2
6
3
5
4
R12
IN+
1
3
IN- 4
2
500
HOT_VDD
MCP601_SOT-23_5L
C24
100pF
HOT_VDD
R14
10K
LOC110_8PFLATPK
R13
90.9K, 5%
R11
90.9K, 5%
MCP601_SOT-23_5L
VPP/NMCLR
2
3
U10
1 VDD1
VPP_TAR
2 VI
3 VDD1
ENC
+5V
J4
1
DEC
+3.3V
HOT_VDD
VDD2 8
GND2 7
VO 6
HOT_VPP
5
4 GND1
GND2
ADUM1100
13.4.2
Third Party Isolator Support
If the MPLAB REAL ICE Isolator Unit does not fit your needs, there are several third
parties which provide isolators that work with Microchip devices, such as Keterex. See
our website (www.microchip.com) for more details.
DS52085A-page 124
2013 Microchip Technology Inc.
Emulator Accessories
13.5
MPLAB REAL ICE JTAG ADAPTOR BOARD
The MPLAB REAL ICE JTAG Adaptor (AC244007) may be used to provide JTAG
communication between the MPLAB REAL ICE in-circuit emultor and the target. The
kit contains a JTAG adaptor board, ribbon cable, and this insert.
13.5.1
JTAG Support
• The JTAG adaptor board is supported on MPLAB X IDE 1.60 and above.
• The JTAG adaptor board supports all PIC32 devices.
• Only basic debug features are available when using JTAG: Run, Halt, and Single
Step. No advanced features are available, i.e., data capture, runtime watches,
application in/out, DMA reads/writer, RTDM, and instrumented trace.
13.5.2
Switch from Standard Communications to JTAG
To switch the hardware:
1. While connected to the target using Standard Communications, erase the target
device. You may need to add “Erase Device Memory Main Project” to a toolbar
using View>Toolbars>Customize.
Note:
The target device MUST BE ERASED before switching from Standard
Communications to JTAG communications.
2. Power down the target board.
3. Disconnect the Standard Communciations cable from the target, disconnect the
USB cable from the emulator, and unplug the Standard Driver Board from the
emulator.
4. Connect one end of the ribbon cable to the connector on the JTAG adaptor board
(it should plug in only one way) and insert the JTAG adaptor board into the
emulator driver board slot.
5. Connect the other end of the ribbon cable to the connector on a target board,
such as the Microchip Explorer 16 development board. The plug is keyed to fit
only one way.
6. Connect the USB cable to the emulator and power the target board.
To set up MPLAB X IDE for JTAG operation:
1. Select File>Project Properties. In the Project Properties dialog, click on your
desired configuration, e.g., “Conf: [default]”.
2. Click on the down arrow on the “Supported Plugin Board” dropdown box and
select “JTAG Driver Board”. Click OK to accept the setup.
2013 Microchip Technology Inc.
DS52085A-page 125
Emulator User’s Guide for MPLAB X IDE
FIGURE 13-15:
JTAG ADAPTOR BOARD CONNECTIONS AND SET UP
Emulator Pod
MPLAB® X IDE - Project Properties
ACTIVE
STATUS
FUNCTION
RESET
JTAG Adator Board
Ribbon Cable
PIC32
JTAG
Target Board with
JTAG connector
Target Board
13.5.3
Switch from JTAG to Standard Communications
To switch the hardware:
1. Device memory does not need to be erased in this case.
Note:
The target device DOES NOT NEED TO BE ERASED before switching
from JTAG communications to Standard Communications.
2. Power down the target board.
3. Disconnect the JTAB ribbon cable from the target, disconnect the USB cable
from the emulator, and unplug the JTAB adaptor board from the emulator.
4. Connect one end of the Standard Communications cable to the connector on the
Standard driver board and insert the board into the emulator driver board slot.
5. Connect the other end of the modular cable to the connector on a target board,
such as the Microchip Explorer 16 development board.
6. Connect the USB cable to the emulator and power the target board.
To set up MPLAB X IDE for Standard Communications operation:
1. Select File>Project Properties. In the Project Properties dialog, click on your
desired configuration, e.g., “Conf: [default]”.
2. Click on the down arrow on the “Supported Plugin Board” dropdown box and
select “None”. Click OK to accept the setup.
13.5.4
Switch between High-Speed Communications and JTAG
Switching between High-Speed (LVDS) Communications and JTAG communications is
the same as switching between Standard Communications and JTAG communications.
DS52085A-page 126
2013 Microchip Technology Inc.
Emulator Accessories
FIGURE 13-16:
JTAG ADAPTOR BOARD SCHEMATICS - PART 1
J1
SDO
TP6
TP7
SDI
TP4
SCK
PVPP
PVDD
BTMS
TP3
TP1
+3.3V
1
3
5
DATA_EN
7
CLK_EN
9
11
13
15
17
19
21
23
AUX1
(DRVR_INS) 25
AUX1_EN
27
AUX2_EN
29
2
4
6
8
10
12
14
16
18
20
22
24
26
28
30
+5V
TP5
DRVR_IRQ
NSYS_RST
UTIL_SDA
UTIL_SCL
VDD_SENSE
TMS_EN
TP2
AUX2
MB1-130_PCBMATE
+5V
C13
0.1
+5V
9 VDD
UTIL_SCL
UTIL_SDA
+5V
C7
0.1
+5V
NSYS_RST
VCC
2
1
12 SCL
13 SDA
15 A0
16 A1
17 A2
U5
5
18 RST
4
3
PCB Type. = 0x04
U4
GND
11 NC
14 NC
74CBTD1G384
10 VSS
GPA0
GPA1
GPA2
GPA3
GPA4
GPA5
GPA6
GPA7
R22
1
21
ID0
R21
1
22
ID1
R20
0
23
ID2
0
24
R19
ID3
25 OV_RST
26
VDD_ON
27
VPP_ON
28
VDD_EMSRC
GPB0
GPB1
GPB2
GPB3
GPB4
GPB5
GPB6
GPB7
1
2
3
4
5
6
7
8
+5V
10k
10k
10k
10k
ICSP_OC
EN_SCR
LVP_EN
LVP
INTA 20
INTB 19
TDO_EN
TDI_EN
TCK_EN
DRVR_IRQ
MCP23017_SSOP28
VIO_VREF
EJTAG IFC
J2
1
3
5
7
9
11
DINT 13
TRST_N
TDI
TDO
TMS
TCK
MCLR_N
2013 Microchip Technology Inc.
2
4
6
8
10
12
14
TDI
TMS
TCK
TDO
MCLR_N
VIO_VREF
1
3
5
7
9
11
13
15
17
19
HDR_2X10_JTAG
JTAG IFC
J4
2
4
6
8
10
12
14
16
18
20
DS52085A-page 127
Emulator User’s Guide for MPLAB X IDE
FIGURE 13-17:
JTAG ADAPTOR BOARD SCHEMATICS - PART 2
+5V
+5V
PVDD
U1
1 VCCA
6 VCCB
5
TDI_EN
SDO
R2
3
22
2
PVDD
C1
0.1
PTC1
PTC-MICROSMD
DIR
A
4
B
C2
0.1
TDI
33
50mA
GND
R23
74LVC1T45
+5V
+5V
PVDD
U2
1 VCCA
6 VCCB
5
TDO_EN
SDI
R3
3
22
2
PVDD
C3
0.1
PTC4
PTC-MICROSMD
DIR
A
C4
0.1
4
B
R29
GND
TDO
33
50mA
74LVC1T45
+5V
+5V
PVDD
U3
1 VCCA
6 VCCB
SCK
TCK_EN
R12
22
PVDD
C6
0.1
C5
0.1
PTC2
PTC-MICROSMD
5 DIR
B 4
3 A
2
TCK
33
50mA
GND
R18
74LVC1T45
+5V
+3.3V
R27
+5V
PVDD
1
VCCA
6
VCCB
10k
5
TMS_EN
BTMS
C9
0.1
U7
R24
3
22
2
PTC3
PTC-MICROSMD
DIR
A
PVDD
C10
0.1
B
GND
4
50mA
R26
TMS
33
74LVC1T45
DS52085A-page 128
2013 Microchip Technology Inc.
Emulator Accessories
FIGURE 13-18:
JTAG ADAPTOR BOARD SCHEMATICS - PART 3
+5V
U8
OUT 8
OUT 7
6
OUT
1 GND
OC
5
TPS2049
VDD_SENSE
VIO_VREF
+5V
3
VDD_EMSRC
2 IN
3 IN
4
EN
4
PVDD
R8
10k
R28
10k
TR1
5.0V
C16
0.1
K1
C11
0.1
1
PVDD
C12
1.0
VDD_ON
2
ICSP_OC
AQY212GS_SO4
R9
330
PVPP
3
4
MCLR_N
VPP_ON
2
1
K2
AQY212GS_SO4
R10
330
+5V
C8
0.1
+5V
UTIL_SCL
REVISION INFO
+5V
U6
8 VCC
6 SCL
7
WP
4
GND
5
SDA
A0 1
2
A1
3
A2
UTIL_SDA
24LC024_SO8N
ADDRESS=A2
2013 Microchip Technology Inc.
DS52085A-page 129
Emulator User’s Guide for MPLAB X IDE
13.6
OTHER ACCESSORIES
For additional accessories for the emulator and other hardware tools, such as Processor Extension Paks and Debug Headers, see the Microchip website for “MPLAB
Emulator and Debugger Accessories”.
DS52085A-page 130
2013 Microchip Technology Inc.
MPLAB® REAL ICE™ IN-CIRCUIT
EMULATOR USER’S GUIDE FOR
MPLAB X IDE
Support
INTRODUCTION
Please refer to the items discussed here for support issues.
•
•
•
•
•
•
Warranty Registration
myMicrochip Personalized Notification Service
The Microchip Web Site
Microchip Forums
Customer Support
About Microchip Technology
WARRANTY REGISTRATION
Registering your development tool entitles you to receive new product updates. Interim
software releases are available at the Microchip web site:
http://www.microchipdirect.com
myMICROCHIP PERSONALIZED NOTIFICATION SERVICE
Microchip's personal notification service helps keep customers current on their
Microchip products of interest. Subscribers will receive e-mail notification whenever
there are changes, updates, revisions or errata related to a specified product family or
development tool.
Please visit http://www.microchip.com/pcn to begin the registration process and select
your preferences to receive personalized notifications. A FAQ and registration details
are available on the page, which can be opened by selecting the link above.
When you are selecting your preferences, choosing “Development Systems” will populate the list with available development tools. The main categories of tools are listed
below:
• Compilers – The latest information on Microchip C compilers, assemblers, linkers
and other language tools. These include all MPLAB C compilers; all MPLAB
assemblers (including MPASM™ assembler); all MPLAB linkers (including
MPLINK™ object linker); and all MPLAB librarians (including MPLIB™ object
librarian).
• Emulators – The latest information on Microchip in-circuit emulators.This
includes the MPLAB REAL ICE™ in-circuit emulator.
• In-Circuit Debuggers – The latest information on Microchip in-circuit debuggers.
These include the PICkit™ 2, PICkit 3 and MPLAB ICD 3 in-circuit debuggers.
• MPLAB® IDE – The latest information on Microchip MPLAB IDE, the Windows®
Integrated Development Environment for development systems tools. This list is
focused on the MPLAB IDE, MPLAB IDE Project Manager, MPLAB Editor and
MPLAB SIM simulator, as well as general editing and debugging features.
2013 Microchip Technology Inc.
DS52085A-page 131
Emulator User’s Guide for MPLAB X IDE
• Programmers – The latest information on Microchip programmers. These include
the device (production) programmers MPLAB REAL ICE in-circuit emulator,
MPLAB ICD 3 in-circuit debugger, MPLAB PM3 and development (nonproduction)
programmers PICkit 2 and 3.
• Starter/Demo Boards – These include MPLAB Starter Kit boards, PICDEM demo
boards, and various other evaluation boards.
THE MICROCHIP WEB SITE
Microchip provides online support via our web site at http://www.microchip.com. This
web site is used as a means to make files and information easily available to
customers. Accessible by using your favorite Internet browser, the web site contains
the following information:
• Product Support – Data sheets and errata, application notes and sample
programs, design resources, user’s guides and hardware support documents,
latest software releases and archived software
• General Technical Support – Frequently Asked Questions (FAQs), technical
support requests, online discussion groups, Microchip consultant program
member listing
• Business of Microchip – Product selector and ordering guides, latest Microchip
press releases, listing of seminars and events, listings of Microchip sales offices,
distributors and factory representatives
MICROCHIP FORUMS
Microchip provides additional online support via our web forums at http://www.microchip.com/forums. Currently available forums are:
•
•
•
•
Development Tools
8-bit PIC MCUs
16-bit PIC MCUs
32-bit PIC MCUs
CUSTOMER SUPPORT
Users of Microchip products can receive assistance through several channels:
•
•
•
•
Distributor or Representative
Local Sales Office
Field Application Engineer (FAE)
Technical Support
Customers should contact their distributor, representative or field application engineer
(FAE) for support. Local sales offices are also available to help customers. A listing of
sales offices and locations is included in the back of this document. See our web site
for a complete, up-to-date listing of sales offices.
Technical support is available through the web site at http://support.microchip.com.
Documentation errors or comments may be emailed to [email protected].
DS52085A-page 132
2013 Microchip Technology Inc.
Support
ABOUT MICROCHIP TECHNOLOGY
Microchip Technology Inc. is a leading provider of microcontroller and analog semiconductors, providing low-risk product development, lower total system cost and faster
time to market for thousands of diverse customer applications worldwide. Headquartered in Chandler, Arizona, Microchip offers outstanding technical support along with
dependable delivery and quality.
Voice: (480) 792-7200
Fax: (480) 792-7277
myMicrochip: http://www.microchip.com/pcn
Website: http://www.microchip.com
Forums: http://www.microchip.com/forums
Support: http://support.microchip.com
2013 Microchip Technology Inc.
DS52085A-page 133
Emulator User’s Guide for MPLAB X IDE
NOTES:
DS52085A-page 134
2013 Microchip Technology Inc.
MPLAB® REAL ICE™ IN-CIRCUIT
EMULATOR USER’S GUIDE FOR
MPLAB X IDE
Appendix A. Revision History
Revision A (January 2013)
• Initial release of this document.
2013 Microchip Technology Inc.
DS52085A-page 135
Emulator User’s Guide for MPLAB X IDE
NOTES:
DS52085A-page 136
2013 Microchip Technology Inc.
MPLAB® REAL ICE™ IN-CIRCUIT
EMULATOR USER’S GUIDE FOR
MPLAB X IDE
Glossary
This glossary applies to al Microchip development tools documentation. Therefore,
some terms have tool-dependent meanings. An abbreviation of each tool is used to
identify each meaning. Currently, the following abbreviations are used:
IDE - MPLAB IDE
PM3 - MPLAB PM3 Programmer
C18 - MPLAB C Compiler for PIC18 MCUs
C30 - MPLAB C Compiler for PIC24 MCUs and dsPIC DSCs
ASM30 - MPLAB Assembler for PIC24 MCUs and dsPIC DSCs
Absolute Section
A section with a fixed (absolute) address that cannot be changed by the linker.
Access Memory
PIC18 Only – Special registers on PIC18 devices that allow access regardless of the
setting of the Bank Select Register (BSR).
Access Entry Points
Access entry points provide a way to transfer control across segments to a function
which may not be defined at link time. They support the separate linking of boot and
secure application segments.
Address
Value that identifies a location in memory.
Alphabetic Character
Alphabetic characters are those characters that are letters of the English alphabet
(a, b, …, z, A, B, …, Z).
Alphanumeric
Alphanumeric characters are comprised of alphabetic characters and integers
(0,1, …, 9).
ANDed Breakpoints
Set up an ANDed condition for breaking, i.e., breakpoint 1 AND breakpoint 2 must
occur at the same time before a program halt. This can only be accomplished if a data
breakpoint and a program memory breakpoint occur at the same time.
2013 Microchip Technology Inc.
DS52085A-page 137
Emulator User’s Guide for MPLAB X IDE
Anonymous Structure
C30 – An unnamed structure.
C18 – An unnamed structure that is a member of a C union. The members of an anonymous structure may be accessed as if they were members of the enclosing union. For
example, in the following code, hi and lo are members of an anonymous structure
inside the union caster.
union castaway
int intval;
struct {
char lo; //accessible as caster.lo
char hi; //accessible as caster.hi
};
} caster;
ANSI
American National Standards Institute is an organization responsible for formulating
and approving standards in the United States.
Application
A set of software and hardware that may be controlled by a PIC® microcontroller.
Archive
A collection of relocatable object modules. It is created by assembling multiple source
files to object files, and then using the archiver to combine the object files into one
library file. A library can be linked with object modules and other libraries to create
executable code.
Archiver
A tool that creates and manipulates libraries.
ASCII
American Standard Code for Information Interchange is a character set encoding that
uses seven binary digits to represent each character. It includes upper and lower case
letters, digits, symbols, and control characters.
Assembler
A language tool that translates assembly language source code into machine code.
Assembly Language
A programming language that describes binary machine code in a symbolic form.
Assigned Section
A section which has been assigned to a target memory block in the linker script file.
Asynchronously
Multiple events that do not occur at the same time. This is generally used to refer to
interrupts that may occur at any time during processor execution.
Asynchronous Stimulus
Data generated to simulate external inputs to a simulator device.
Attribute
Characteristics of variables or functions in a C program that are used to describe
machine-specific properties.
Attribute, Section
Characteristics of sections, such as “executable”, “readonly”, or “data” that can be
specified as flags in the assembler .section directive.
DS52085A-page 138
2013 Microchip Technology Inc.
Glossary
Binary
The base two numbering system that uses the digits 0-1. The rightmost digit counts
ones (20), the next counts multiples of two (21), the next counts multiples of four (22),
etc.
Bookmarks
Use bookmarks to easily locate specific lines in a file.
Under the Edit menu, select Bookmarks to manage bookmarks. Toggle
(enable/disable) a bookmark, move to the next or previous bookmark, or clear all bookmarks.
Breakpoint
Hardware Breakpoint: An event whose execution will cause a halt.
Software Breakpoint: An address where execution of the firmware will halt. Usually
achieved by a special break instruction.
Build
Compile and link all the source files for an application.
C
A general-purpose programming language which features economy of expression,
modern control flow and data structures, and a rich set of operators.
Calibration Memory
A special function register or registers used to hold values for calibration of a PIC
microcontroller on-board RC oscillator or other device peripherals.
Central Processing Unit
The part of a device that is responsible for fetching the correct instruction for execution,
decoding that instruction, and then executing that instruction. When necessary, it works
in conjunction with the arithmetic logic unit (ALU) to complete the execution of the
instruction. It controls the program memory address bus, the data memory address
bus, and accesses to the stack.
Clean
Under the MPLAB X IDE Project menu, Clean removes all intermediary project files,
such as object, hex and debug files, for the active project. These files are recreated
from other files when a project is built.
COFF
Common Object File Format. An object file of this format contains machine code,
debugging and other information.
Command Line Interface
A means of communication between a program and its user based solely on textual
input and output.
Compiler
A program that translates a source file written in a high-level language into machine
code.
Conditional Assembly
Assembly language code that is included or omitted based on the assembly-time value
of a specified expression.
Conditional Compilation
The act of compiling a program fragment only if a certain constant expression, specified
by a preprocessor directive, is true.
2013 Microchip Technology Inc.
DS52085A-page 139
Emulator User’s Guide for MPLAB X IDE
Configuration Bits
Special-purpose bits programmed to set PIC microcontroller modes of operation. A
Configuration bit may or may not be preprogrammed.
Control Directives
Directives in assembly language code that cause code to be included or omitted based
on the assembly-time value of a specified expression.
CPU
See Central Processing Unit.
Cross Reference File
A file that references a table of symbols and a list of files that references the symbol. If
the symbol is defined, the first file listed is the location of the definition. The remaining
files contain references to the symbol.
Data Directives
Data directives are those that control the assembler’s allocation of program or data
memory and provide a way to refer to data items symbolically; that is, by meaningful
names.
Data Memory
On Microchip MCU and DSC devices, data memory (RAM) is comprised of General
Purpose Registers (GPRs) and Special Function Registers (SFRs). Some devices also
have EEPROM data memory.
Debugger
Hardware that performs debugging.
Debugger System
The Debugger systems include the pod, processor module, device adapter, target
board, cables, and MPLAB X IDE software.
Debugging Information
Compiler and assembler options that, when selected, provide varying degrees of information that is used to debug application code. See compiler or assembler documentation for details on selecting debug options.
Deprecated Features
Features that are still supported for legacy reasons, but will eventually be phased out
and no longer used.
Device Programmer
A tool used to program electrically programmable semiconductor devices such as
microcontrollers.
Digital Signal Controller
A microcontroller device with digital signal processing capability, i.e., Microchip dsPIC
DSC devices.
Digital Signal Processing
The computer manipulation of digital signals, i.e., analog signals (sound or image)
which have been converted to digital form (sampled).
Digital Signal Processor
A microprocessor that is designed for use in digital signal processing.
Directives
Statements in source code that provide control of the language tool’s operation.
DS52085A-page 140
2013 Microchip Technology Inc.
Glossary
Download
Download is the process of sending data from a host to another device, such as an
emulator, programmer or target board.
DSC
See Digital Signal Controller.
DSP
See Digital Signal Processor.
dsPIC DSCs
dsPIC Digital Signal Controllers (DSCs) refers to all Microchip DSC families.
DWARF
Debug With Arbitrary Record Format. DWARF is a debug information format for ELF
files.
EEPROM
Electrically Erasable Programmable Read Only Memory. A special type of PROM that
can be erased electrically. Data is written or erased one byte at a time. EEPROM
retains its contents even when power is turned off.
ELF
Executable and Linking Format. An object file of this format contains machine code.
Debugging and other information is specified in DWARF. ELF/DWARF provide better
debugging of optimized code than COFF.
Emulation
The process of executing software loaded into emulation memory as if it were firmware
residing on a microcontroller device.
Emulation Memory
Program memory contained within the emulator.
Emulator
Hardware that performs emulation.
Emulator System
The MPLAB REAL ICE system consists of a pod, a driver (and potentially a receiver)
card, target board, cables, and MPLAB X IDE software.
Endianness
The ordering of bytes in a multi-byte object.
Environment
IDE – The particular layout of the desktop for application development.
PM3 – A folder containing files on how to program a device. This folder can be transferred to a SD/MMC card.
Epilogue
A portion of compiler-generated code that is responsible for deallocating stack space,
restoring registers and performing any other machine-specific requirement specified in
the runtime model. This code executes after any user code for a given function,
immediately prior to the function return.
EPROM
Erasable Programmable Read Only Memory. A programmable read-only memory that
usually can be erased by exposure to ultraviolet radiation.
2013 Microchip Technology Inc.
DS52085A-page 141
Emulator User’s Guide for MPLAB X IDE
Error File
A file containing error messages and diagnostics generated by a language tool.
Errors
Errors report problems that make it impossible to continue processing your program.
When possible, errors identify the source file name and line number where the problem
is apparent.
Event
A description of a bus cycle which may include address, data, pass count, external
input, cycle type (e.g., fetch, R/W), and time stamp. Events are used to describe triggers, breakpoints and interrupts.
Executable Code
Software that is ready to be loaded for execution.
Export
Send data out of the MPLAB X IDE in a standardized format.
Expressions
Combinations of constants and/or symbols separated by arithmetic or logical
operators.
Extended Microcontroller Mode
In Extended Microcontroller mode, on-chip program memory as well as external memory is available. Execution automatically switches to external if the program memory
address is greater than the internal memory space of the PIC18 device.
Extended Mode (PIC18 MCUs)
In Extended mode, the compiler will utilize the extended instructions (i.e., ADDFSR,
ADDULNK, CALLW, MOVSF, MOVSS, PUSHL, SUBFSR and SUBULNK) and the indexed
with literal offset addressing.
External Label
A label that has external linkage.
External Linkage
A function or variable has external linkage if it can be referenced from outside the
module in which it is defined.
External Symbol
A symbol for an identifier which has external linkage. This may be a reference or a
definition.
External Symbol Resolution
A process performed by the linker in which external symbol definitions from all input
modules are collected in an attempt to resolve all external symbol references. Any
external symbol references that do not have a corresponding definition cause a linker
error to be reported.
External Input Line
An external input signal logic probe line (TRIGIN) for setting an event based on external
signals.
External RAM
Off-chip Read/Write memory.
Fatal Error
An error that will halt compilation immediately. No further messages will be produced.
DS52085A-page 142
2013 Microchip Technology Inc.
Glossary
File Registers
On-chip data memory, including GPRs and SFRs.
Filter
Determine by selection what data is included/excluded in a trace display or data file.
Flash
A type of EEPROM where data is written or erased in blocks instead of bytes.
FNOP
Forced No Operation. A forced NOP cycle is the second cycle of a two-cycle instruction. Since the PIC microcontroller architecture is pipelined, it prefetches the next
instruction in the physical address space while it is executing the current instruction.
However, if the current instruction changes the PC, this prefetched instruction is explicitly ignored, causing an FNOP cycle.
Frame Pointer
A pointer that references the location on the stack that separates the stack-based
arguments from the stack-based local variables. Provides a convenient base from
which to access local variables and other values for the current function.
Free-Standing
An implementation that accepts any strictly conforming program that does not use
complex types and in which the use of the features specified in the library clause (ANSI
‘89 standard clause 7) is confined to the contents of the standard headers <float.h>,
<iso646.h>, <limits.h>, <stdarg.h>, <stdbool.h>, <stddef.h> and
<stdint.h>.
GPR
General Purpose Register. The portion of device data memory (RAM) available for
general use.
Halt
A stop of program execution. Executing Halt is the same as stopping at a breakpoint.
Header, Debug
A circuit board containing a special debug device (-ICE/-ICD) used with in-circuit
debuggers and emulators to debug application code. For low pin count devices,
resources can be recovered when using a debug header. See the Header Board
Specification (DS51292) for details.
Heap
An area of memory used for dynamic memory allocation where blocks of memory are
allocated and freed in an arbitrary order determined at runtime.
Hex Code
Executable instructions stored in a hexadecimal format code. Hex code is contained in
a hex file.
Hex File
An ASCII file containing hexadecimal addresses and values (hex code) suitable for
programming a device.
Hexadecimal
The base 16 numbering system that uses the digits 0-9 plus the letters A-F (or a-f). The
digits A-F represent hexadecimal digits with values of (decimal) 10 to 15. The rightmost
digit counts ones (160), the next counts multiples of 16 (161), the next counts multiples
of 256 (162), etc.
2013 Microchip Technology Inc.
DS52085A-page 143
Emulator User’s Guide for MPLAB X IDE
High Level Language
A language for writing programs that is further removed from the processor than
assembly.
ICD
In-Circuit Debugger. The MPLAB ICD3 In-Circuit Debugger, MPLAB ICD2 In-Circuit
Debugger, PICkit 3 D.E. In-Circuit Debugger (Debug Express add-on), and PICkit 2
D.E. In-Circuit Debugger (Debug Express add-on) are the Microchip in-circuit
debuggers.
ICE
In-Circuit Emulator. The MPLAB REAL ICE system is Microchip’s next-generation
in-circuit emulator.
ICSP
In-Circuit Serial Programming. A method of programming Microchip embedded
devices using serial communication and a minimum number of device pins.
IDE
Integrated Development Environment. MPLAB X IDE is Microchip’s integrated
development environment.
Identifier
A function or variable name.
IEEE
Institute of Electrical and Electronics Engineers.
Import
Bring data into the MPLAB X IDE from an outside source, e.g., from a hex file.
Initialized Data
Data that is defined with an initial value. In C,
int myVar=5;
defines a variable that will reside in an initialized data section.
Instruction Set
The collection of machine language instructions that a particular processor
understands.
Instructions
A sequence of bits that tells a central processing unit to perform a particular operation
and can contain data to be used in the operation.
Internal Linkage
A function or variable has internal linkage if it can not be accessed from outside the
module in which it is defined.
International Organization for Standardization
An organization that sets standards in many businesses and technologies, including
computing and communications.
Interrupt
A signal to the CPU that suspends the execution of a running application and transfers
control to an Interrupt Service Routine (ISR) so that the event may be processed. Upon
completion of the ISR, normal execution of the application resumes.
Interrupt Handler
A routine that processes special code when an interrupt occurs.
DS52085A-page 144
2013 Microchip Technology Inc.
Glossary
Interrupt Request
An event which causes the processor to temporarily suspend normal instruction execution and to start executing an interrupt handler routine. Some processors have
several interrupt request events allowing different priority interrupts.
Interrupt Service Routine
ALU30, C18, C30 – A function that handles an interrupt.
IDE – User-generated code that is entered when an interrupt occurs. The location of
the code in program memory will usually depend on the type of interrupt that has
occurred.
Interrupt Vector
Address of an interrupt service routine or interrupt handler.
IRQ
See Interrupt Request.
ISO
See International Organization for Standardization.
ISR
See Interrupt Service Routine.
L-value
An expression that refers to an object that can be examined and/or modified. An l-value
expression is used on the left-hand side of an assignment.
Latency
The time between an event and its response.
Librarian
See Archiver.
Library
See Archive.
Linker
A language tool that combines object files and libraries to create executable code,
resolving references from one module to another.
Linker Script Files
Linker script files are the command files of a linker. They define linker options and
describe available memory on the target platform.
Listing Directives
Listing directives are those directives that control the assembler listing file format. They
allow the specification of titles, pagination, and other listing control.
Listing File
A listing file is an ASCII text file that shows the machine code generated for each C
source statement, assembly instruction, assembler directive, or macro encountered in
a source file.
Little Endian
A data ordering scheme for multi-byte data whereby the least significant byte is stored
at the lower addresses.
2013 Microchip Technology Inc.
DS52085A-page 145
Emulator User’s Guide for MPLAB X IDE
Local Label
A local label is one that is defined inside a macro with the LOCAL directive. These
labels are particular to a given instance of a macro’s instantiation. In other words, the
symbols and labels that are declared as local are no longer accessible after the ENDM
macro is encountered.
Logic Probes
Up to 14 logic probes can be connected to some Microchip emulators. The logic probes
provide external trace inputs, trigger output signal, +5V, and a common ground.
Loop-Back Test Board
Used to test the functionality of the MPLAB REAL ICE in-circuit emulator.
LVDS
Low Voltage Differential Signaling. A low noise, low-power, low amplitude method for
high-speed (gigabits per second) data transmission over copper wire.
LVDS differs from normal input/output (I/O) in a few ways:
Normal digital I/O works with 5 volts as a high (binary ‘1’) and 0 volts as a low (binary
‘0’). When you use a differential, you add a third option (-5 volts), which provides an
extra level with which to encode, and results in a higher maximum data transfer rate.
A higher data transfer rate means fewer wires are required, as in UW (Ultra Wide) and
UW-2/3 SCSI hard disks, which use only 68 wires. These devices require a high transfer rate over short distances. Using standard I/O transfer, SCSI hard drives would
require a lot more than 68 wires.
Low voltage means that the standard 5 volts is replaced by either 3.3 volts or 1.5 volts.
LVDS uses a dual wire system, running 180 degrees of each other. This enables noise
to travel at the same level, which in turn can get filtered more easily and effectively.
With standard I/O signaling, data storage is contingent on the actual voltage level. Voltage level can be affected by wire length (longer wires increase resistance, which lowers
voltage). But with LVDS, data storage is distinguished only by positive and negative
voltage values, not the voltage level. Therefore, data can travel over greater lengths of
wire while maintaining a clear and consistent data stream.
Source: http://www.webopedia.com/TERM/L/LVDS.html.
Machine Code
The representation of a computer program that is actually read and interpreted by the
processor. A program in binary machine code consists of a sequence of machine
instructions (possibly interspersed with data). The collection of all possible instructions
for a particular processor is known as its “instruction set”.
Machine Language
A set of instructions for a specific central processing unit, designed to be usable by a
processor without being translated.
Macro
A macro instruction is an instruction that represents a sequence of instructions in
abbreviated form.
Macro Directives
Directives that control the execution and data allocation within macro body definitions.
Makefile
Export to a file the instructions to Make the project. Use this file to Make your project
outside of MPLAB X IDE, i.e., with a make.
DS52085A-page 146
2013 Microchip Technology Inc.
Glossary
Under Project>Build Options>Project, Directories tab, you must have selected
“Assemble/Compile/Link in the project directory” under “Build Directory Policy” for this
feature to work.
Make Project
A command that rebuilds an application, recompiling only those source files that have
changed since the last complete compilation.
MCLR - Master Clear
Master Clear (MCLR) is a function on a pin that causes a processor Reset. MCLR is
usually multiplexed with other functions such as VPP. Also, MCLR is usually complementary (MCLR); that is, when the pin is pulled low, a Reset occurs, and when the pin
is pulled high, the device operates normally.
Internal MCLR – When the MCLR enable configuration bit is cleared (0), a Reset signal
is generated internally.
External MCLR – When the MCLR enable configuration bit is set (1), the pin becomes
an external Reset input.
MCU
Microcontroller Unit. An abbreviation for microcontroller. Also uC.
Memory Model
C30 – A representation of the memory available to the application.
C18 – A description that specifies the size of pointers that point to program memory.
Message
Text displayed to alert you to potential problems in language tool operation. A message
will not stop operation.
Microcontroller
A highly integrated chip that contains a CPU, RAM, program memory, I/O ports and
timers.
Microcontroller Mode
One of the possible program memory configurations of PIC18 microcontrollers. In
Microcontroller mode, only internal execution is allowed. Thus, only the on-chip
program memory is available in Microcontroller mode.
Microprocessor Mode
One of the possible program memory configurations of PIC18 microcontrollers. In
Microprocessor mode, the on-chip program memory is not used. The entire program
memory is mapped externally.
Mnemonics
Text instructions that can be translated directly into machine code. Also referred to as
opcodes.
MPASM™ Assembler
Microchip Technology’s relocatable macro assembler for PIC microcontroller devices,
KeeLoq® devices, and Microchip memory devices.
MPLAB Language Tool for Device
Microchip’s C compilers, assemblers and linkers for specified devices. Select the type
of language tool based on the device you will be using for your application, e.g., if you
will be creating C code on a PIC18 MCU, select the MPLAB C Compiler for PIC18
MCUs.
2013 Microchip Technology Inc.
DS52085A-page 147
Emulator User’s Guide for MPLAB X IDE
MPLAB ICD
Microchip in-circuit debuggers that work with MPLAB X IDE. The ICDs support Flash
devices with built-in debug circuitry. The main component of each ICD is the pod. A
complete system consists of a pod, debug header (with a device-ICD), target board,
cables, and MPLAB X IDE software.
MPLAB X IDE
Microchip’s Integrated Development Environment. MPLAB X IDE comes with an editor,
project manager, and simulator.
MPLAB PM3
A device programmer from Microchip. Programs PIC18 microcontrollers and dsPIC
digital signal controllers. Can be used with MPLAB X IDE or as a stand-alone programmer. Replaces PRO MATE II.
MPLAB REAL ICE™ In-Circuit Emulator
Microchip next-generation in-circuit emulator that works with MPLAB X IDE. The
MPLAB REAL ICE emulator supports PIC MCUs and dsPIC DSCs. The main component of each ICE is the pod. A complete system consists of a pod, a driver (and, potentially, a receiver) card, cables, and MPLAB X IDE software.
MPLAB SIM
Microchip’s simulator that works with MPLAB X IDE in support of PIC MCU and dsPIC
DSC devices.
MPLIB™ Object Librarian
Microchip’s librarian that can work with MPLAB X IDE. MPLIB librarian is an object
librarian for use with COFF object modules created using either MPASM assembler or
MPLAB C18 C compiler.
MPLINK™ Object Linker
MPLINK linker is an object linker for the Microchip MPASM assembler and the Microchip C18 C compiler. MPLINK linker also may be used with the Microchip MPLIB librarian. MPLINK linker is designed to be used with MPLAB X IDE, though it is not a
necessity.
MRU
Most Recently Used. Refers to files and windows available to be selected from MPLAB
X IDE main pull-down menus.
Native Data Size
For Native trace, the size of the variable used in a Watch window must be of the same
size as the selected device’s data memory: bytes for PIC18 devices and words for
16-bit devices.
Nesting Depth
The maximum level to which macros can include other macros.
Node
MPLAB X IDE project component.
Non-Extended Mode (PIC18 MCUs)
In Non-Extended mode, the compiler will not use the extended instructions nor the
indexed with literal offset addressing.
Non Real Time
Refers to the processor at a breakpoint, or executing single-step instructions, or
MPLAB X IDE being run in simulator mode.
DS52085A-page 148
2013 Microchip Technology Inc.
Glossary
Non-Volatile Storage
A storage device whose contents are preserved when its power is off.
NOP
No Operation. An instruction that has no effect when executed except to advance the
PC.
Object Code
The machine code generated by an assembler or compiler.
Object File
A file containing machine code and possibly debug information. It may be immediately
executable or it may be relocatable, requiring linking with other object files, e.g.,
libraries, to produce a complete executable program.
Object File Directives
Directives that are used only when creating an object file.
Octal
The base 8 number system that only uses the digits 0-7. The rightmost digit counts
ones (80), the next digit counts multiples of eight (81), the next digit counts multiples of
64 (82), etc.
Off-Chip Memory
Off-chip memory refers to the memory selection option for the PIC18 device where
memory may reside on the target board, or where all program memory may be supplied
by the emulator. The Memory tab accessed from Options>Development Mode provides the Off-Chip Memory selection dialog box.
One-to-One Project-Workspace Model
The most common configuration for application development in MPLAB X IDE to is
have one project in one workspace. Select Configure>Settings, Projects tab and check
“Use one-to-one project-workspace model”.
Opcodes
Operational Codes. See Mnemonics.
Operators
Symbols, like the plus sign ‘+’ and the minus sign ‘-’, that are used when forming
well-defined expressions. Each operator has an assigned precedence that is used to
determine order of evaluation.
OTP
One Time Programmable. EPROM devices that are not in windowed packages. Since
EPROM needs ultraviolet light to erase its memory, only windowed devices are erasable.
Pass Counter
A counter that decrements each time an event (such as the execution of an instruction
at a particular address) occurs. When the pass count value reaches zero, the event is
satisfied. You can assign the Pass Counter to break and trace logic, and to any
sequential event in the complex trigger dialog.
PC
Personal Computer or PC.
PC Host
Any PC running a supported Windows operating system.
2013 Microchip Technology Inc.
DS52085A-page 149
Emulator User’s Guide for MPLAB X IDE
Persistent Data
Data that is never cleared or initialized. This allows an application to preserve data
across a device Reset.
Phantom Byte
An unimplemented byte in the dsPIC architecture that is used when treating the 24-bit
instruction word as if it were a 32-bit instruction word. Phantom bytes appear in dsPIC
hex files.
PIC MCUs
PIC microcontrollers (MCUs) refers to all Microchip microcontroller families.
PICkit 1, 2, and 3
Microchip’s developmental device programmers with debug capability through Debug
Express. See the Readme files for each tool to see which devices are supported.
Plug-ins
The MPLAB X IDE has both built-in components and plug-in modules to configure the
system for a variety of software and hardware tools. Several plug-in tools may be found
under the Tools menu.
Pod
MPLAB REAL ICE system: The box that contains the emulation control circuitry for the
ICE device on the header or target board. An ICE device can be a production device
with built-in ICE circuitry or a special ICE version of a production device (i.e.,
device-ICE).
MPLAB ICD: The box that contains the debug control circuitry for the ICD device on the
header or target board. An ICD device can be a production device with built-in ICD circuitry or a special ICD version of a production device (i.e., device-ICD).
Power-on-Reset Emulation
A software randomization process that writes random values in data RAM areas to
simulate uninitialized values in RAM upon initial power application.
Pragma
A directive that has meaning to a specific compiler. Often a pragma is used to convey
implementation-defined information to the compiler. MPLAB C30 uses attributes to
convey this information.
Precedence
Rules that define the order of evaluation in expressions.
Production Programmer
A production programmer is a tool that has resources designed into it that program
devices rapidly. It has the capability to program at various voltage levels and completely
adheres to the programming specification. Programming a device as fast as possible
is of prime importance in a production environment where time is of the essence as the
application circuit moves through the assembly line.
Microchip production programmers, such as MPLAB PM3, MPLAB REAL ICE in-circuit
emulator, and MPLAB ICD 3, have been designed to be robust enough to tolerate these
demanding environments.
Some top-end tools have additional accessories. The MPLAB REAL ICE Performance
Pak has accelerators to speed up the communication and ICSP process. The MPLAB
PM3 programmer has interchangeable socket modules to support various devices
out-of-circuit.
DS52085A-page 150
2013 Microchip Technology Inc.
Glossary
Profile
For MPLAB SIM simulator, a summary listing of executed stimulus by register.
Program Counter
The location that contains the address of the instruction that is currently executing.
Program Counter Unit
ALU30 – A conceptual representation of the layout of program memory. The program
counter increments by 2 for each instruction word. In an executable section, 2 program
counter units are equivalent to 3 bytes. In a read-only section, 2 program counter units
are equivalent to 2 bytes.
Program Memory
IDE – The memory area in a device where instructions are stored. Also, the memory in
the emulator or simulator containing the downloaded target application firmware.
ALU30, C30 – The memory area in a device where instructions are stored.
Project
A project contains the files that are needed to build an application (source code, linker
script files, etc.) along with their associations, to various build tools and build options.
Prologue
A portion of compiler-generated code that is responsible for allocating stack space, preserving registers and performing any other machine-specific requirement that is
specified in the runtime model. This code executes before user code for a given
function.
Prototype System
A term referring to a user's target application, or target board.
PWM Signals
Pulse Width Modulation Signals. Certain PIC MCU devices have a PWM peripheral.
Qualifier
An address or an address range that is used by the Pass Counter or as an event before
another operation in a complex trigger.
Radix
The number base, hex, or decimal, used in specifying an address.
Random Access Memory (RAM)
Data emory in which information can be accessed in any order.
Raw Data
The binary representation of code or data associated with a section.
Read-Only Memory (ROM)
Memory hardware that allows fast access to permanently stored data, but prevents
addition to, or modification of, the data.
Real Time
When an in-circuit emulator or debugger is released from the Halt state, the processor
runs in Real Time mode and behaves exactly as the normal chip would behave. In Real
Time mode, the real time trace buffer of an emulator is enabled and constantly captures
all selected cycles, and all break logic is enabled. In an in-circuit emulator or debugger,
the processor executes in real time until a valid breakpoint causes a halt, or until the
user halts the execution.
In the simulator, real time simply means execution of the microcontroller instructions as
fast as they can be simulated by the host CPU.
2013 Microchip Technology Inc.
DS52085A-page 151
Emulator User’s Guide for MPLAB X IDE
Real-Time Watch
A Watch window where the variables change in real time as the application is run. See
individual tool documentation to determine how to set up a real-time watch. Not all tools
support real-time watches.
Recursive Calls
A function that calls itself, either directly or indirectly.
Recursion
The concept that a function or macro, having been defined, can call itself. Great care
should be taken when writing recursive macros; it is easy to get caught in an infinite
loop where there will be no exit from the recursion.
Reentrant
A function that may have multiple, simultaneously active instances. This may happen
due to either direct or indirect recursion, or through execution during interrupt
processing.
Relaxation
The process of converting an instruction to an identical, but smaller, instruction. This is
useful for saving on code size. MPLAB ASM30 currently knows how to RELAX a CALL
instruction into an RCALL instruction. This is done when the symbol that is being called
is within +/- 32k instruction words from the current instruction.
Relocatable
An object whose address has not been assigned to a fixed location in memory.
Relocatable Section
ALU30 – A section whose address is not fixed (absolute). The linker assigns addresses
to relocatable sections through a process called relocation.
Relocation
A process performed by the linker in which absolute addresses are assigned to relocatable sections and all symbols in the relocatable sections are updated to their new
addresses.
ROM
Read-Only Memory (Program Memory). Memory that cannot be modified.
Run
The command that releases the emulator from halt, allowing it to run the application
code and change or respond to I/O in real time.
Run-time Model
Describes the use of target architecture resources.
Scenario
For MPLAB SIM simulator, a particular setup for stimulus control.
Section
A portion of an application located at a specific address of memory.
Section Attribute
A characteristic ascribed to a section (e.g., an access section).
Sequenced Breakpoints
Breakpoints that occur in a sequence. Sequence execution of breakpoints is
bottom-up, i.e., the last breakpoint in the sequence occurs first.
DS52085A-page 152
2013 Microchip Technology Inc.
Glossary
Serialized Quick Turn Programming
Serialization allows you to program a serial number into each microcontroller device
that the Device Programmer programs. This number can be used as an entry code,
password or ID number.
SFR
See Special Function Registers.
Shell
The MPASM assembler shell is a prompted input interface to the macro assembler.
There are two MPASM assembler shells: one for the DOS version, and one for the
Windows version.
Simulator
A software program that models the operation of devices.
Single Step
This command steps though code, one instruction at a time. After each instruction,
MPLAB X IDE updates register windows, watch variables, and status displays so you
can analyze and debug instruction execution. You can also single step C compiler
source code, but instead of executing single instructions, MPLAB X IDE will execute all
assembly level instructions generated by the line of the high level C statement.
Skew
The information associated with the execution of an instruction appears on the processor bus at different times. For example, the executed opcode appears on the bus as a
fetch during the execution of the previous instruction. The source data address and
value, and the destination data address appear when the opcode is actually executed,
and the destination data value appears when the next instruction is executed. The trace
buffer captures the information that is on the bus at one instance. Therefore, one trace
buffer entry will contain execution information for three instructions. The number of captured cycles from one piece of information to another for a single instruction execution
is referred to as the skew.
Skid
When a hardware breakpoint is used to halt the processor, one or more additional
instructions may be executed before the processor halts. The number of extra
instructions executed after the intended breakpoint is referred to as the skid.
Source Code
A text listing of commands that may be completed or assembled into object code.
Source code is written in a formal programming language that can be translated into
machine code or executed by an interpreter.
Source File
An ASCII text file containing source code.
Special Function Registers
The portion of data memory (RAM) dedicated to registers that control I/O processor
functions, I/O status, timers, or other modes or peripherals.
SQTP
See Serialized Quick Turn Programming.
Stack, Hardware
Locations in MCU or DSC where the return address is stored when a function call is
made.
2013 Microchip Technology Inc.
DS52085A-page 153
Emulator User’s Guide for MPLAB X IDE
Stack, Software
Memory used by an application for storing return addresses, function parameters, and
local variables. This memory is typically managed by the compiler when developing
code in a high-level language.
MPLAB Starter Kit for Device
Microchip’s starter kits contains everything needed to begin exploring the specified
device. View a working application and then debug and program your own changes.
Static RAM or SRAM
Static Random Access Memory. Program memory you can read/write on the target
board that does not need refreshing frequently.
Status Bar
The Status Bar is located on the bottom of the MPLAB X IDE window and indicates current information, such as cursor position, development mode and device, and active
tool bar.
Step Into
This command is the same as Single Step. Step Into (as opposed to Step Over) follows
a CALL instruction into a subroutine.
Step Over
Step Over allows you to debug code without stepping into subroutines. When stepping
over a CALL instruction, the next breakpoint will be set at the instruction after the CALL.
If for some reason the subroutine gets into an endless loop or does not return properly,
the next breakpoint will never be reached. The Step Over command is the same as
Single Step except for its handling of CALL instructions.
Step Out
Step Out allows you to step out of a subroutine which you are currently stepping
through. This command executes the rest of the code in the subroutine and then stops
execution at the return address to the subroutine.
Stimulus
Input to the simulator, i.e., data generated to exercise the response of simulation to
external signals. Often the data is put into the form of a list of actions in a text file.
Stimulus may be asynchronous, synchronous (pin), clocked, or register.
Stopwatch
A counter for measuring execution cycles.
Storage Class
Determines the lifetime of the memory associated with the identified object.
Storage Qualifier
Indicates special properties of the objects being declared (e.g., const).
Symbol
A symbol is a general purpose mechanism for describing the various pieces which
comprise a program. These pieces include function names, variable names, section
names, file names, struct/enum/union tag names, etc. Symbols in MPLAB X IDE refer
mainly to variable names, function names and assembly labels. The value of a symbol
after linking is its value in memory.
Symbol, Absolute
Represents an immediate value, such as a definition, through the assembly .equ
directive.
DS52085A-page 154
2013 Microchip Technology Inc.
Glossary
System Window Control
The system window control is located in the upper left corner of windows and some dialogs. Clicking on this control usually pops up a menu that has the items “Minimize,”
“Maximize,” and “Close.”
Target
Refers to user hardware.
Target Application
Software residing on the target board.
Target Board
The circuitry and programmable device that makes up the target application.
Target Processor
The microcontroller device on the target application board.
Template
Lines of text that you build to insert into your files at a later time. The MPLAB Editor
stores templates in template files.
Tool Bar
A row or column of icons that you can click on to execute MPLAB X IDE functions.
Trace
An emulator or simulator function that logs program execution. The emulator logs
program execution into its trace buffer which is uploaded to MPLAB X IDE’s trace window.
Trace Memory
Trace memory contained within the emulator. Trace memory is sometimes called the
trace buffer.
Trace Macro
A macro that will provide trace information from emulator data. Since this is a software
trace: the macro must be added to code, the code must be recompiled or reassembled,
and the target device must be programmed with this code before trace will work.
Trigger Output
Trigger output refers to an emulator output signal that can be generated at any address
or address range, and is independent of the trace and breakpoint settings. Any number
of trigger output points can be set.
Trigraphs
Three-character sequences, all starting with ??, that are defined by ISO C as
replacements for single characters.
Unassigned Section
A section that has not been assigned to a specific target memory block in the linker
script file. The linker must find a target memory block in which to allocate an
unassigned section.
Uninitialized Data
Data that is defined without an initial value. In C,
int myVar;
defines a variable which will reside in an uninitialized data section.
2013 Microchip Technology Inc.
DS52085A-page 155
Emulator User’s Guide for MPLAB X IDE
Upload
The Upload function transfers data from a tool (such as an emulator or programmer) to
the host PC, or from the target board to the emulator.
USB
Universal Serial Bus. An external peripheral interface standard for communication
between a computer and external peripherals over a cable using bi-serial transmission.
USB 1.0/1.1 supports data transfer rates of 12 Mbps. USB 2.0 supports data rates up
to 480 Mbps and is often referred to as high-speed USB.
Vector
The memory locations that an application will jump to when a Reset or an interrupt
occurs.
Warning
IDE – An alert that is provided to warn you of a situation that would cause physical
damage to a device, software file, or equipment.
ALU30, C30 – Warnings report conditions that may indicate a problem, but do not halt
processing. In MPLAB C30, warning messages report the source file name and line
number, but include the text ‘warning:’ to distinguish them from error messages.
Watch Variable
A variable that you may monitor during a debugging session in a Watch window.
Watch Window
Watch windows contain a list of watch variables that are updated at each breakpoint.
Watchdog Timer
A timer on a PIC microcontroller that resets the processor after a selectable length of
time. The WDT is enabled or disabled and set up using Configuration bits.
WDT
See Watchdog Timer.
Workbook
For MPLAB SIM stimulator, a setup for generation of SCL stimulus.
WorkSpace
A workspace contains MPLAB X IDE information on the selected device, selected
debug tool and/or programmer, open windows and their location, and other IDE
configuration settings.
DS52085A-page 156
2013 Microchip Technology Inc.
MPLAB® REAL ICE™ IN-CIRCUIT
EMULATOR USER’S GUIDE FOR
MPLAB X IDE
Index
Numerics
32-Bit Devices, Trace............................................... 70
A
About Microchip Technology.................................. 133
AC Line Isolation .................................................... 120
AC244002 .............................................................. 115
AC244005 .............................................................. 120
AC244006 ................................................................ 73
App IO .................................................................63, 76
Application In/Out................................................63, 76
Auxilliary Memory................................................... 106
AVdd, AVss .............................................................. 33
B
Boot Flash Memory ................................................ 106
Breakpoints
Hardware .......................................................... 50
Setup ................................................................ 50
Software............................................................ 50
C
Cables
Length ..............................................109, 113, 119
USB .................................................................. 28
Capacitors ................................................................ 33
Capacitors, not on PGC,PGD or MCLR ................... 34
Capture, Data......................................................53, 67
Circuits That Will Prevent the Emulator From Functioning......................................................................... 34
CLK .....................................................................32, 35
Clock Speed.......................................... 57, 58, 73, 104
Clock Switching...................................................... 104
Code Protect ............................................................ 39
Command-line Programming ................................... 47
Configuration Bits..................................................... 39
Configuration bits set in code................................... 45
Converter Board, High-Speed to Standard .............. 17
Customer Support .................................................. 132
D
DAT .....................................................................32, 35
Data Capture.......................................................53, 67
Data Rate ............................................................... 112
Debug
Executive .......................................................... 40
Sequence of Operations ................................... 39
Top Reasons Why You Can’t ........................... 81
Debug/Program Quick Reference ............................ 47
Device and Feature Support .................................... 19
Diodes, not on PGC,PGD ........................................ 34
DMCI ...................................................................54, 68
2013 Microchip Technology Inc.
Documentation
Conventions ...................................................... 11
Layout ............................................................... 10
Driver Board
High-Speed ..........................................17, 28, 116
Standard ..............................................17, 28, 112
Durability, Card Guide............................................ 110
DV244005 .............................................................. 110
E
EEPROM Memory.................................................. 106
EMUC, EMUD .......................................................... 35
Emulator Firmware, Manual Download .................... 89
Erase All Before Program ...................................... 105
External Triggers.................................................... 110
External Triggers Setup ......................................... 103
EXTn ................................................................ 36, 111
F
Feature Support ....................................................... 19
Firmware
Disconnected while Downloading ..................... 90
Firmware Downloads ............................................. 105
Freeze on Halt.......................................................... 88
Freeze Peripherals Setup ...................................... 104
G
General Corrective Actions ...................................... 96
H
Header Specification ................................................ 12
Hibernate mode........................................................ 88
High Voltage Isolation ............................................ 120
High-Speed Communication .................................... 30
Connections ...................................................... 32
Driver Board.................................................... 116
Receiver Board ............................................... 117
Hubs, USB ............................................................. 109
I
I/O Port Trace........................................................... 58
ICSP..............................................................38, 39, 41
ID Memory.............................................................. 106
Indicator Lights....................................................... 110
Instruction Trace, PIC32 .................................... 37, 72
Instrumented Trace ............................................ 55, 75
I/O Port........................................................ 36, 58
Native.......................................................... 35, 57
SPI ............................................... 35, 57, 117, 119
Internet Address, Microchip ................................... 132
Isolator Unit ...................................................... 17, 120
DS52085A-page 157
Emulator User’s Guide for MPLAB X IDE
J
R
JTAG ........................................................................ 67
Reading, Recommended.......................................... 12
Readme.................................................................... 12
REALICECMD.......................................................... 47
Receiver Board, High-Speed.................................. 117
Reserved Resources by Device ............................... 41
Runtime Watch................................................... 53, 67
K
Keep hardware tool connected ................................ 45
Kit Components........................................................ 17
L
LEDs ...................................................................... 110
Logic Probe Connector .......................................... 110
External Triggers............................................... 51
I/O Electrical Specifications............................. 111
I/O Port Trace ................................................... 36
Pinout .............................................................. 111
Logic Probes ............................................................ 17
Loop-Back Test Board ..................................... 17, 114
Low Voltage Programming, Enable........................ 105
LVDS .............................................................. 116, 117
LVP configuration bit .............................................. 105
M
MA320001 ................................................................ 74
MA320002 ................................................................ 74
Memories to Program............................................. 106
Memory Ranges ..................................................... 106
Memory window does not reflect changes ............... 90
Modular Interface Cable ........................................... 39
MPLAB REAL ICE Defined ...................................... 16
myMicrochip Personalized Notification Service...... 131
N
Native Trace ....................................................... 35, 57
P
Parallel Trace ........................................................... 36
PC Profiling .............................................................. 75
PC Sampling ............................................................ 62
PC, Power Down ...................................................... 88
Performance Pak
Benefits ............................................................. 30
Hardware ........................................................ 115
PGC, PGD............................. 32, 33, 34, 35, 38, 39, 40
PIC32 Instruction Trace...................................... 37, 72
PIM ................................................................29, 31, 72
Pod ..................................................................... 17, 28
Port Trace ................................................................ 58
PORTx ..................................................................... 36
Power-Down mode................................................... 88
Preserve Memory ................................................... 106
Processor Extension Pak Specification.................... 12
Programming
Command-line................................................... 47
Production ......................................................... 47
Pull-up or Pull-down resisters, not on PGC,PGD ..... 34
Push Buttons .......................................................... 110
Q
Quick Reference
Debug/Program................................................. 47
Trace................................................................. 61
DS52085A-page 158
S
Schematics, 100-Pin PIM ......................................... 74
Serial Trace .............................................................. 35
Skidding, Breakpoint .............................................. 105
SMPS ....................................................................... 21
Software Breakpoints Selection ............................. 105
SPI Trace ............................................35, 57, 117, 119
SQTP........................................................................ 47
Standard Communication......................................... 29
Connections ...................................................... 32
Driver Board .................................................... 112
Stopwatch................................................................. 50
T
Table Read Protect .................................................. 39
Target Connection
Circuitry ............................................................. 33
High-Speed ....................................................... 32
I/O Port.............................................................. 36
Improper Circuits............................................... 34
SPI .................................................................... 35
Standard............................................................ 32
Target Device ........................................................... 39
Trace
Instruction.......................................................... 70
Instrumented ..................................................... 55
Trace Connections ................................................... 35
Trace Quick Reference ............................................ 61
Trace Setup............................................................ 102
Transition Socket...................................................... 17
Specification...................................................... 12
TRCLK................................................................ 72, 73
TRDn .................................................................. 72, 73
Triggers .................................................................... 51
External ..................................................... 51, 110
Triggers, Setup....................................................... 103
U
USB ................................................................ 109, 156
Cables ......................................................... 17, 28
Hubs................................................................ 109
USB drivers .............................................................. 45
User ID Memory ..................................................... 106
V
Vcap ......................................................................... 33
Vdd, Vss .......................................... 32, 33, 38, 39, 111
Vpp ..........................................................32, 33, 34, 39
W
Watch
Runtime....................................................... 53, 67
Watchdog Timer ............................................... 39, 156
Web Site, Microchip ............................................... 132
2013 Microchip Technology Inc.
Index
NOTES:
2013 Microchip Technology Inc.
DS52085A-page 159
Worldwide Sales and Service
AMERICAS
ASIA/PACIFIC
ASIA/PACIFIC
EUROPE
Corporate Office
2355 West Chandler Blvd.
Chandler, AZ 85224-6199
Tel: 480-792-7200
Fax: 480-792-7277
Technical Support:
http://www.microchip.com/
support
Web Address:
www.microchip.com
Asia Pacific Office
Suites 3707-14, 37th Floor
Tower 6, The Gateway
Harbour City, Kowloon
Hong Kong
Tel: 852-2401-1200
Fax: 852-2401-3431
India - Bangalore
Tel: 91-80-3090-4444
Fax: 91-80-3090-4123
India - New Delhi
Tel: 91-11-4160-8631
Fax: 91-11-4160-8632
Austria - Wels
Tel: 43-7242-2244-39
Fax: 43-7242-2244-393
Denmark - Copenhagen
Tel: 45-4450-2828
Fax: 45-4485-2829
India - Pune
Tel: 91-20-2566-1512
Fax: 91-20-2566-1513
France - Paris
Tel: 33-1-69-53-63-20
Fax: 33-1-69-30-90-79
Japan - Osaka
Tel: 81-6-6152-7160
Fax: 81-6-6152-9310
Germany - Munich
Tel: 49-89-627-144-0
Fax: 49-89-627-144-44
Atlanta
Duluth, GA
Tel: 678-957-9614
Fax: 678-957-1455
Boston
Westborough, MA
Tel: 774-760-0087
Fax: 774-760-0088
Chicago
Itasca, IL
Tel: 630-285-0071
Fax: 630-285-0075
Cleveland
Independence, OH
Tel: 216-447-0464
Fax: 216-447-0643
Dallas
Addison, TX
Tel: 972-818-7423
Fax: 972-818-2924
Detroit
Farmington Hills, MI
Tel: 248-538-2250
Fax: 248-538-2260
Indianapolis
Noblesville, IN
Tel: 317-773-8323
Fax: 317-773-5453
Los Angeles
Mission Viejo, CA
Tel: 949-462-9523
Fax: 949-462-9608
Santa Clara
Santa Clara, CA
Tel: 408-961-6444
Fax: 408-961-6445
Toronto
Mississauga, Ontario,
Canada
Tel: 905-673-0699
Fax: 905-673-6509
Australia - Sydney
Tel: 61-2-9868-6733
Fax: 61-2-9868-6755
China - Beijing
Tel: 86-10-8569-7000
Fax: 86-10-8528-2104
China - Chengdu
Tel: 86-28-8665-5511
Fax: 86-28-8665-7889
China - Chongqing
Tel: 86-23-8980-9588
Fax: 86-23-8980-9500
Korea - Daegu
Tel: 82-53-744-4301
Fax: 82-53-744-4302
China - Hangzhou
Tel: 86-571-2819-3187
Fax: 86-571-2819-3189
Korea - Seoul
Tel: 82-2-554-7200
Fax: 82-2-558-5932 or
82-2-558-5934
China - Hong Kong SAR
Tel: 852-2943-5100
Fax: 852-2401-3431
Malaysia - Kuala Lumpur
Tel: 60-3-6201-9857
Fax: 60-3-6201-9859
China - Nanjing
Tel: 86-25-8473-2460
Fax: 86-25-8473-2470
Malaysia - Penang
Tel: 60-4-227-8870
Fax: 60-4-227-4068
China - Qingdao
Tel: 86-532-8502-7355
Fax: 86-532-8502-7205
Philippines - Manila
Tel: 63-2-634-9065
Fax: 63-2-634-9069
China - Shanghai
Tel: 86-21-5407-5533
Fax: 86-21-5407-5066
Singapore
Tel: 65-6334-8870
Fax: 65-6334-8850
China - Shenyang
Tel: 86-24-2334-2829
Fax: 86-24-2334-2393
Taiwan - Hsin Chu
Tel: 886-3-5778-366
Fax: 886-3-5770-955
China - Shenzhen
Tel: 86-755-8864-2200
Fax: 86-755-8203-1760
Taiwan - Kaohsiung
Tel: 886-7-213-7828
Fax: 886-7-330-9305
China - Wuhan
Tel: 86-27-5980-5300
Fax: 86-27-5980-5118
Taiwan - Taipei
Tel: 886-2-2508-8600
Fax: 886-2-2508-0102
China - Xian
Tel: 86-29-8833-7252
Fax: 86-29-8833-7256
Thailand - Bangkok
Tel: 66-2-694-1351
Fax: 66-2-694-1350
Italy - Milan
Tel: 39-0331-742611
Fax: 39-0331-466781
Netherlands - Drunen
Tel: 31-416-690399
Fax: 31-416-690340
Spain - Madrid
Tel: 34-91-708-08-90
Fax: 34-91-708-08-91
UK - Wokingham
Tel: 44-118-921-5869
Fax: 44-118-921-5820
China - Xiamen
Tel: 86-592-2388138
Fax: 86-592-2388130
China - Zhuhai
Tel: 86-756-3210040
Fax: 86-756-3210049
DS52085A-page 160
Japan - Tokyo
Tel: 81-3-6880- 3770
Fax: 81-3-6880-3771
11/29/12
2013 Microchip Technology Inc.