1
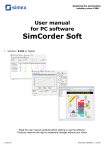
®
SIMEX
USER MANUAL for
Temperature and Humidity
Recording System
TRS
Installation and
configuration manual
and
User manual for software
SimCorder Soft
supporting Temperature and Humidity
Recording System
Software version:
– BASIC 1.0.0
– ALARM 1.1.1
– SERVER 1.1.3
– TERMINAL 1.1.3
Read the user's manual carefully before starting to use the system.
Producer reserves the right to implement changes without prior notice.
16.07.2008
V.5.01
User manual for TRS system
CONTENTS
1. INSTALLATION AND USING GUIDELINES..............................................................................................3
1.1. PERIODICAL CHECKING OF SENSORS.........................................................................................7
1.1.1. Conditions of testing..................................................................................................................8
1.2. CONDITIONS OF CORRECT MEASUREMENTS...........................................................................8
2. GENERAL CHARACTERISTICS OF THE SYSTEM .................................................................................8
3. INSTALLATION OF TRS SYSTEM............................................................................................................9
3.1. INSTALLATION GUIDELINES...........................................................................................................9
3.1.1. TRS system connection circuit ................................................................................................9
3.1.2. Connection of power supply / data converter SRS-2/4-Z16-B1 ..........................................10
3.1.3. Relative humidity and temperature sensors connection circuit..............................................10
3.2. INSTALLATION STEP BY STEP.....................................................................................................11
4. USING OF „SIMCORDER SOFT” PROGRAM........................................................................................16
4.1. APPLICATION STARTUP................................................................................................................17
4.2. „CURRENT MEASURES” MENU.....................................................................................................19
4.2.1. „Table” tab...............................................................................................................................19
4.2.2. „Graph” tab..............................................................................................................................21
4.2.3. „Devices infos” tab..................................................................................................................25
4.3. „REPORTS” MENU..........................................................................................................................26
4.3.1. „Table” tab...............................................................................................................................26
4.3.2. „Graph” tab..............................................................................................................................28
4.4. „CONFIGURATION” MENU.............................................................................................................29
4.4.1. „Devices” tab...........................................................................................................................29
4.4.2. „Groups” tab ...........................................................................................................................34
4.4.3. „Alarms” tab.............................................................................................................................34
4.4.4. „Settings” tab...........................................................................................................................35
4.5. GROUP OPERATIONS....................................................................................................................35
4.6. SIGNALISATION OF SYSTEM ALARM STATES...........................................................................37
4.6.1. Defining of alarm states..........................................................................................................37
4.6.2. Defining of relations between device messages and alarm states........................................38
4.6.3. Defining of relations between alarm states and alarm devices..............................................39
4.6.4. Example configuration of alarm states signalisations.............................................................40
4.7. GSM NOTIFICATION.......................................................................................................................42
4.8. APPLICATION CLOSING .............................................................................................................43
4.9. LIST OF ERRORS AND FAULT DIAGNOSTICS ...........................................................................44
Explanation of symbols used in the manual:
- This symbol denotes especially important guidelines concerning the installation and
operation of the system. Not complying with the guidelines denoted by this symbol
may cause an accident, damage or equipment destruction.
!
IF THE DEVICE IS NOT USED ACCORDING TO THE MANUAL THE USER IS
RESPONSIBLE FOR POSSIBLE DAMAGES.
i
Content
•
•
•
2
- This symbol denotes especially important characteristics of the system installation
and software SimCorder Soft working.
Read any information regarding this symbol carefully
of CD-ROM included to configuration set:
SimCorder Soft installer,
readme.txt file with info about software installation,
user manuals in pdf format.
User manual for TRS system
1. INSTALLATION AND USING GUIDELINES
!
Power supply must be switched off, while any assembly works
•
Typical application has been calculated for about 30 measurement modules, mounted in
equal distances to each other, without LED displays - total length of wires about 200m,
with cross-sec. 0,75 mm2 (e.g. LIYCY-TP 2 x 2 x 0,75).
•
Maximal count of modules depend on total wires length - before connection, individual
current consumption, and voltage drops should be analysed. Minimal supply voltage of
sensor is 9V, for modules made before 09.07.2002, and 7V for presently produced
modules. If supply voltage is lower than mentioned thresholds additional power supply
should be added to the net. While data transmission via Modbus net, modules consumes
additional current (about. 50 mA), which causes by higher voltage drop on wires (these
drops can causes by transmission errors), so measurement of voltages while modules are
in standby mode can be insufficient to verify propriety of supply. To check supply voltages,
additional load (about 50÷60mA) to the end of line (the farthest point from power supply)
should be added.
Main Power Supply:
SRS-2/4-Z16-B1a
Last module in the network must be terminated
with 100 ÷ 150 Ohm resistor
BA+
A+
Us A+ B- GND
B-
Us A+ B- GND
Us A+ B- GND
Us A+ B- GND
Us A+ B- GND
TRS-XX
TRS-XX
TRS-XX
TRS-XX
Us ctrl A+ B- GND
TRS-09a
Additional Power Supply:
TRS-09a module
Figure 1.1. Connection of additional power supply.
3
User manual for TRS system
•
•
•
•
Connections should be made with, shielded 2 pairs cable (2 x 2 x 0,75 mm2)
necessarily with circular cross section. For small network (few modules and short
connections) wires with cross-sec. 0,5 mm2 can be used, but special attention must be
taken to higher drops of supply voltage.
All connections inside covers should be made carefully. Supply and communication wires
should make a pairs (one pair for supply, and another for communication). Protected shield
should be connected to each other using additional terminal block (not included). Because
of small dimensions of module, shield should be insulated carefully. Connections of all
wires (and shield) must warrant proper electrical contact. Special attention should be taken
to short cuts created by thin wires protrude out of connectors.
RS 485 transmission line can not be branched, and its total length should be smaller than
1 km. If it is necessary to build longer network line amplifiers (repeaters), and additional
power supplies should be used.
Cover of each module must be installed carefully. Glands and screws should be screwed
evenly, to get proper tightness. Wires can not be curved directly beside glands, because it
can causes by leakage. Cables outgoing of glands should be mounted horizontally, if they
are mounted vertically (from above to down), a loop should be formed to avoid of
contended vapour. Only one cable can outgoing from one gland. Diameter of cable should
not be to small, to warrant proper tightness. If seal of cables is ineffective, gland should be
sealed with sealant (e.g. silicone).
Figure 1.2. Proper mounting of cables in glands
!
Figure 1.3. Improper mounting of cables in glands
4
User manual for TRS system
•
Case of module has protection level IP65. Heavy projections of pressured water (similar to
heavy waves) to modules are not allowed (e.g. while cleaning of room).
•
Cables connected to the TRS system should not be installed near of power transmission
lines (powered motors and other heavy loads of inductive character).
•
High temperature and humidity differenced can appear in every room depend on
measurement place. Every door opening, movement, turning on/off of machinery and airconditioning can cause by changes of local humidity and temperature. In most
unfavourable conditions (e.g. opening of refrigeration plant doors, delivery of vaporize
products, cleaning of room) condensation of vapour on the sensor can appear. Due to
mentioned problems modules must be mounted in place, where it will be not exposed to
risk of vapour condensation, specially with continuous or long term character.
!
•
Avoid of module installation near doors, windows (especially in rooms with higher
temperature), air conditioners, ventilation, or assembly line where people work, machinery
emitted vapours or high temperature, or needed periodic cleaning. Modules must not be
mounted in direct sunlight, or artificial light sources (bulbs, burners). To protect of
installation changes (and it's costs), it is recommended to plan all places where sensors
will be installed due to experiments made with portable temperature and humidity sensor.
!
•
It can happen, that it is impossible to find place without vapour condensation. This situation
can take place specially in refrigeration chambers connected with warmer rooms by air
curtains, airlocks. Special means should be taken to avoid of vapour condensation (e.g.
cover the sensors of direct air and vapour flow) or assume high variations of
measurements.
5
User manual for TRS system
•
It is very important, to install measurement modules in place allowing free air flow around
of sensors (best if flow is not stimulated mechanically). If module is mounted on absorbent
or wet walls distance from sensor to wall should be higher than 7 cm. Remember, that
stagnant air is perfect thermal insulator, so it can make significant differences between
near placed sensors. To avoid of these situations, mechanically stimulated (but soft) air
flow id recommended. Modules should be mounted in that way to direct sensors down.
•
Strong air pollution, aggressive chemicals and often vapour condensation flow to humidity
sensors' working life. In that cases it is recommended to use porous filters, made of Teflon
(Polytetrafluorethylen, PTFE) – these filters are standard equipment of presently produced
modules, The filter protect sensor of dust, water and other substances, extend working life
of sensor and avoid it of temporal vapour condensation ( e.g. caused by opened door of
refrigeration chamber).
•
Direct contact of module with aggressive chemicals (contain chlorine, ammonia, etc.) can
cause permanent damage of sensor. If damage is caused by aggressive chemicals
warranty became not valid.
!
•
6
While periodical cleaning of rooms, assembly lines etc. sensors should be protected with
protective rubber cap, to avoid sensor of pressurized water ( it is recommended to units
with protective basket made of ABS). Protective caps are available as additional
accessories.
User manual for TRS system
!
Sensor protective cap
1.1. PERIODICAL CHECKING OF SENSORS
User of the modules should take notice to necessarily of periodical checking (testing) of
modules' measurement correctness. Frequency of tests depends on environment conditions
of the modules:
•
If modules works in dry rooms, stores with soft working environment, without dust, the
humidity sensors should measure correctly at least 24 months, and should be checked
after that time.
•
If modules works in soft environment, but from time to time vapours can condensate on the
sensors (e.g. while periodical cleaning of machinery) then humidity sensors should
measure correctly at least 18 months, and should be checked after that time.
•
If humidity of air in the room (chamber) is often over 90%, and module works continuously
in these conditions then first testing should be done after 6 months since installation, and
next tests every 12 months.
If modules work in hard environment, with high density of vapours and dust, or haze of
aggressive substances, testing should be done every 6 months. Additional protective Teflon
filters should be changed before testing, and measurements should be done after its
replacement.
i
Testing, conservation, and calibration are normal exploitation activities, and
they are not included to guarantee. Producer can made testing, conservation
or calibration for a fee, on special order of customer.
7
User manual for TRS system
1.1.1. Conditions of testing.
i
Important ! Testing should be done while constant temperature and humidity.
Stable air flow (about 0.5 ÷ 2 m/s) should be kept while tests.
Measurement should to go on at least 15 minutes (assuming that, vapour condensation
on humidity sensor has no occurred directly before measurement).
Warning:
Vapour condensation can occur while the sensor is moved from cold to warmer room.
While measurement standardized sensor must be placed as near as possible, to tested
sensor. No one of the sensors can be hold in hand, while measurement.
1.2. CONDITIONS OF CORRECT MEASUREMENTS
•
To obtain correct measurement of relative humidity it is essential to, sensor get the same
temperature as it's ambient air. Unfortunately, even if difference of temperature is small
(i.e. 1°C, @ 20°C and 50% RH in room), then difference of indicated humidity is about
2.5%. Effective equalizing of sensor and ambient temperatures can be made using fans. It
is recommended to use fans in rooms and chambers, but air flow should be not greater
than 2m/s
•
While measurement of temperature and relative humidity in room, make sure that
measured parameter is stable. If changes are small (few degrees of temperature, teen %
RH per hour) and continuous air movement (about 0.5 - 2 m/s) stabilisation of
measurement is obtained after few minutes. If changes of temperature or RH are bigger
than mentioned above, or without air movement, stabilisation of measurement result can
take up to 30 minutes.
•
If vapour condensation occurs on the sensor, time necessary to correct measurement
increases significantly. Measured value approach real value just after equalizing of sensor
and ambient temperature, and evaporation of water from sensor. If real RH is high then
vaporization of water from sensor can take up to few hours.
•
Even if measurement has been done correctly, obtained information can inform user what
is local temperature and relative humidity. In huge chambers, rooms, stores differences of
temperatures and RH in different point can be significant, (few degrees, and teen %RH). In
such cases it is recommended to use few standard sensors to obtain more detailed
informations about arrangement of temperatures and RH.
2. GENERAL CHARACTERISTICS OF THE SYSTEM
Temperature and Humidity Recording System - TRS is complete PC based measurement
system. It's main purpose is acquisition and recording of information of temperature and
relative humidity. System can be used in refrigerator plants, cold storage, workshops, etc.
Main elements of the system: measurement modules, indication modules, signalising modules,
data transmission cable, data converter, data buffer and recording software.
Data transmission and supply voltage are guaranteed by 4-wires, shielded transmission cable,
which connects all system devices to the PC.
8
User manual for TRS system
3. INSTALLATION OF TRS SYSTEM
TRS system is easy to installation, we took pains to customer could make it himself.
3.1. INSTALLATION GUIDELINES
Allowed materials for trunking
• stainless steel (recommended)
• PVC (white)
Kinds of trunking
• pipes (distanced from the wall at least 25mm), smooth fasteners
• closed profiles (squared, rectangular) – roofing is required ( angle 45 grades)
Sensors location
• height 2 m, not closer than 1 m from ceiling
• if it is possible, in the middle of the walls, do not install it in the corner
• do not install sensors near to doors, windows, fans E.T.C.
i
•
•
•
Relative humidity sensors, should be used in the rooms where temperatures are
always positive.
Relative humidity sensors, mus not be cleaned with pressured water and other
pressured substances
Be careful while screwing of sensor cap and glands, proper tightness must be
preserved
3.1.1. TRS system connection circuit
RS 232
SRS-2/4-Z16-B1a
A+
TRS-XX
...
A+
...
B-
B-
TRS-XX
1
2
3
4
terminator
(120 ohm)
+Us
A+
BGND
terminator
(120 ohm)
Figure 3.1. Connection diagram of TRS system network
9
User manual for TRS system
3.1.2. Connection of power supply / data converter SRS-2/4-Z16-B1
front view
External power
supply socket
RS 232
+ 12V DC
GND
1 2 3 4
Correct power
supply output
indicator
+Us A+ B- GND
A+
RS 485 network signals
GND
B-
Power supply voltage output
+Us
Figure 3.2. Connection diagram of data converter
3.1.3. Relative humidity and temperature sensors connection circuit
Power
supply and
RS-485
connector
1 2 3 4
GND
Us
DATA+
DATA-
RS - 485
Us = 9 ÷ 12V DC
LED indicator
force
address
0xFF switch
Figure 3.3. Connection of humidity or / and temperature transducer
10
User manual for TRS system
Description of sensors connections
•
•
•
•
•
•
•
to connect measurement modules (sensors), 4 wires, paired and shielded cable should
be used, (i.e. Technokabel LIYCY-P 2 x 2 x 0.5),
all modules must be connected parallel to each other
last module must be equipped with termination resistor (100 ÷ 150 Ohm). Terminal resistor
is included to the kit.
data converter has no internal termination resistor, so it must be equipped with termination
resistor too.
Cases of measurement modules are being installed to the walls, using two screws
power supply/ data converter type SRS-2/4-Z16-B1 should be installed as close to the
host computer as possible. RS 485 network must not be branched, and no longer than
1 km.
at the most 127 modules (including data converter) can be connected to the network.
i
Detailed description concerning the TRS system
INSTALLATION AND USING GUIDELINES at page 3.
installation,
in chapter:
3.2. INSTALLATION STEP BY STEP
1. First, cable should be installed in all rooms where temperature and humidity will be
measured. Keep recommendations on page 9.
2. Next, measurement modules shall be installed on the walls (holders). Keep
recommendations on page 9.
3. After that, connect wires to the block terminals in the modules. All terminals marked A+
should be connected to each other, and terminals marked B- to each other – accordingly to
schematics on page 10
i
In last module on the line, between terminals A+ and B- should be connected via
termination resistor (100÷150 Ohm). This resistor is included to the kit.
4. Another end of network, should be connected to data converter (terminals RS 485) due to
schema showed on page 10.
5. Next, connect data converter to the PC serial port ( remember port name: com1, com2 etc.)
i
Modern computers has markers (names) placed near of serial ports, older models
often has got DB9 socket for com1, and DB25 socket for com2. If mouse is
connected to DB9 socket (com1), then DB-25 (com2) can be used with special
interface (offered by SIMEX).
6. Connect data converter to external power supply adaptor.
7. Install SimCorder Soft from included CD. SimCorder Soft is designed to Windows
operating system (Windows 95 or newer).
11
User manual for TRS system
i
Install BASIC, ALARM or SERVER version of SimCorder Soft on the PC directly
connected to TRS system. TERMINAL version of SimCorder Soft allows
visualization (via internet) of TRS system controlled directly by SERVER version of
SimCorder Soft.
The SimCorderSoft-v(NR)-install file is designed to install the SimCorder Soft
program (NR is a version number). The install file is locate in folder on CD delivered with
device.
During installation follow the directions provided by Installation wizard. The wizard
will create a folder on the computer’s hard drive, the program files will be placed in this
folder. The short cut to the program will be placed in a location specified by the user.
Manual start-up of the program is done using the SimCorder.exe executable file.
8. Initial start-up of the application enables detection of all TRS system devices present in the
network (excluding TERMINAL version). The user is asked to perform installation and
configuration procedure for all detected devices.
Follow the guidelines in the windows displayed by the program. To continue
installation procedure, once initial screen is displayed, click on the [Next>>] button.
9. Next screen (Figure 3.4) enables the selection of the number for the RS 232 serial port for
the converter. The number of chosen for the selected port must comply with number of the
port to which the converter is connected.
Figure 3.4. Selection of serial port
10. After defining the communications port, go to device detection screen (Figure 3.5) by
clicking on the [Next>>] button.
12
User manual for TRS system
Every module is equipped with internal push-button and LED indicator. While normal
operation mode LED flashes every about 10 sec., while installation mode LED lights
continuously.
To allow automatic detection of the module:
• Enable installation mode - press and hold at least 5 sec. internal push-button
• release push-button after LED starts to lights continuously
• in about 1 sec. after that SimCorder Soft should detect and readdress device,
so LED shall fade, and next flash every 10sec. These symptoms indicates that
device is detected, and correctly installed in the system.
Figure 3.5. Scanning network for devices - before detection of any device.
The list shown on the figure (Figure 3.6) contains all detected devices. Date and time of
installation allows identification of the devices (can be useful while settings of devices'
names). In addition this screen informs that Data Buffer has been detected. Such
informations can be confirmation of correct port selection,
i
•
•
In case when network (devices) has been configured beforehand (not for first
installation) user can use „network scanning” function - [Scan network]. Such
situation can take place only if network (devices) has been configured
beforehand.
Function [Reset the addresses] causes of setting manufacturer addresses in
all devices (modules) connected to the network, and can be used only in critical
situations while network installation. Remember that this operation must be
followed by re installation of all devices in the system (opening of every cover,
and handmade enabling of detection mode).
13
User manual for TRS system
Figure 3.6. Scanning network for devices - new devices detected
11. Device detection screen allows the assigning of names to detected devices (Figure 3.7).
Order of devices on the list corresponds to the order of it's detection by software.
Figure 3.7. Assigning names, units and min/max values
14
User manual for TRS system
Appropriate names (e.g. the location where the sensor was installed, Figure 3.8), unit
denotation and allowable measured values (minimum and maximum) should be assigned
to all detected devices. If any of these values will be exceeded during system operation
an alarm message will be displayed.
Figure 3.8. Assigning names, units and min/max values - an example of the settings
After pressing the [Next>>] button the final installation screen will be displayed.
12. After pressing the [Close] button when the final installation screen is displayed, the
installation shall be completed and the program will be ready to work.
15
User manual for TRS system
4. USING OF „SIMCORDER SOFT” PROGRAM
SimCorder Soft software is a part of Temperature and Humidity Recording System TRS. It's main purposes are acquiring, visualisation, printing and archiving of temperature and
humidity values in function of time.
Following versions of SimCorder Soft are available:
BASIC
ALARM
SERVER
TERMINAL
Measurement on demand
YES
YES
YES
NO
Direct operation with data logger device
YES
YES
YES
NO
Reconfiguration of the devices
YES
YES
YES
NO*
Alarm states signalization using TRS-B1 modules
NO
YES
YES
YES*
GSM notification
NO
YES
YES
YES*
Remote operation with TRS system
NO
NO
YES**
YES**
*
**
i
- TERMINAL version allows exclusively visualisation of the settings, change of the settings can be made
only via SERVER version installed on the PC directly connected to TRS network.
- SERVER version makes available data base containing measurement results, while TERMINAL version
allows remote access to this data base.
Install BASIC, ALARM or SERVER version of SimCorder Soft on the PC directly
connected to TRS system. TERMINAL version of SimCorder Soft allows
visualization (via internet) of TRS system controlled directly by SERVER version of
SimCorder Soft.
For running the TERMINAL version of this software it is necessary to enter server name
where data base is available (Figure 4.1).
Figure 4.1. Logging to the server (TERMINAL version)
i
16
„Server name” means name (or IP address) of the PC machine which SERVER
version of SimCorder Soft program is running on.
User manual for TRS system
4.1. APPLICATION STARTUP
Upon application startup the Current measures menu is displayed and Table tab is
active (Figure 4.2).
Figure 4.2. Program window upon startup
The selection from the currently active menu is made using the flat buttons in the upper part of
the program window (Figure 4.2). Four positions are available:
•
•
•
Current measures
Reports
Configuration
•
Info
- menu for current measurements visualizing;
- menu for visualizing and printing reports;
- menu for changing system settings, defining groups of devices
and alarm states of TRS system;
- menu containing program information.
Button [Log] located in bottom part of the main window allows opening/closing additional
window with messages related to the program execution. These messages window is opened
automatically when new message appears.
•
•
The TRS-system can work in two basic configurations (versions):
with data logger (allows to preserve data measurement , even if PC host is turned off)
without data logger (no measurements while PC host/ SimCorder Soft application is
closed)
17
User manual for TRS system
After running application checks, if data logger is available in present configuration
(excluding TERMINAL version). If it is, then proper information will appear in menu
Configuration, tab Devices (see Figure 4.3). Status bar placed in the bottom of the window
informs about the state of data logger. Reports related to the data logger state appear on this
status bar.
Data logger
found
Data
downloading
progress bar
Figure 4.3.Identification of data logger
Sequence of operations with data logger
• reading of data stored while host computer were powered off, or SimCorder Soft
application were closed.
• Storing of data to data base
• configuration of data logger
Until above operations are not finished, it is impossible to close the application (see
chapter APPLICATION CLOSING , page 43).
•
18
i
•
All operations related to data logger, are realised directly after application run,
and do not any flow to it's other functions.
Bezpośrednia współpraca z rejestratorem jest niedostępna w wersji TERMINAL.
User manual for TRS system
4.2. „CURRENT MEASURES” MENU
View mode allows to view current measurements results in table or graph format and
informs about critical situations and errors occurring in the system.
Current measures menu allows to view:
• current measurements results in table format (Table tab),
• current measurements results in graph format (Graph tab),
• critical situations, and errors in table format (Device messages).
4.2.1. „Table” tab
Figure 4.4. Current measures - Table tab
Table tab (Figure 4.4) is used for viewing of current measurement results (temperature,
humidity) in the form of a table, in all locations of the factory where sensors are installed (e.g.
refrigerator plants, drying room).
The remaining elements of the Table tab are:
•
•
•
From date
- this is the date and time defining the beginning of analysed
measurement recording period for printing in the form of a table,
To date
- this is the date and time defining the end of analysed measurement
recording period for printing in the form of a table,
table window consists of remaining columns:
- name of device, created by user while installation of the system
– Device name
(i.e. freezing chamber no. 1)
- unit for measurements
– Unit
– Current measure - result of presently realised measurement
19
User manual for TRS system
– Average measure
– Maximum measure
– Minimum measure
•
•
- average value of the measurements made between start and
end dates.
- the highest result of the measurements made between start
and end dates.
- the lowest result of the measurements made between start
and end dates.
[Refresh] button - updates the displayed data
[Measure] button- allows making of new measurement and storing the result to database
Change of “From date”
1) In order to change “From date”, click onto the arrow on right side of the date (Figure 4.5).
The calendar window will open:
Date change button
Figure 4.5. Changing the “From date”
2) The date can be change by clicking onto any day in the calendar. Buttons at the top part of
the calendar are used to change months (Figure 4.6). After clicking on the current year
located to the right from month’s name an edition window and buttons for changing the
year are displayed (Figure 4.6).
month change buttons
year change buttons
Figure 4.6. Changing months and year
20
User manual for TRS system
3) The time can be changed by clicking on the box, in which it is displayed and manually
typing it in using the keyboard.
4) The operation is completed by pressing the [Refresh] button; this will update the data
shown in the table.
4.2.2. „Graph” tab
Figure 4.7. Current measures - Graph tab
Graph tab (Figure 4.7) is used for viewing the measurement results (temperature, humidity) in
the form of a graph. Measurements from a maximum of 12 units (transducers, sensors ) may
be viewed simultaneously.
The Graph tab contains such elements as:
•
graphs area
- plots measured values (e.g. temperature, humidity) in function of
time. Each sensor is distinguished by a different colour (Figure 4.7);
•
•
Period
[Refresh] button
- this field allows selection of time period of the plots
- updates the displayed data;
•
Groups/Devices - this box enables creating graphs in two modes:
- for a group
- collective graph for a maximum of 12 logical devices
- for a single logical device.
i
Creating groups is described in the GROUP OPERATIONS section (4.5, page 35).
21
User manual for TRS system
Selecting graph (graph for a group device / graph for single device)
In order to select graph type:
• click appropriate tab Groups or Devices (Figure 4.8),
• check specific group or device. This will display measurement results for the selected
group or single device (displaying results takes place automatically after each change of
group or device).
i
In order to use table for groups the group must be created first. Creating groups is
described in the section 4.5 (GROUP OPERATIONS, page 35).
Figure 4.8. Single devices and Group of devices selection tabs.
Changing the graph display method
Following operations are available for the graph area:
•
22
enlarge graph
- a graph can be enlarged by marking the area of interest with the
mouse pointer. In order to do this first left-click on the graph and,
while holding down the left mouse button, drag the pointer to the
bottom right corner of the graph. The rectangle marked this way will
be enlarged. (Figure 4.9). To restore main scale of the graph, press
left mouse button and move cursor to the left top corner of the
graph or use [Refresh] push-button.
User manual for TRS system
Figure 4.9. Enlarging graph
•
moving the graph
- the graph can be moved to the left/right (earlier/later time period,
correspondingly) or to the down/up (lower/higher measurements
range, correspondingly) . In order to do this, right-click on the graph
and drag the pointer in desired direction (Figure 4.10).
Figure 4.10. Moving the graph
•
restoring default values
- the [Refresh] button enables returning to
initial graph in 1:1 scale;
23
User manual for TRS system
update the displayed measurements
•
- the [Refresh] button allows to update
measurement data displayed on the graph.
Selection of the Graph Period
To change time period of the graph, select desired value in „Period” option using cursor.
Information on periodical lack of measurement
If any measurement device, for whatever reasons (e.g. sensor fault), will not returns
measurement values, then this situation will be presented on the graph as interruption in the
measurement (Figure 4.11).
no measurement
values
Figure 4.11. Interruption in the graph (e.g. sensor fault)
If measurements can not be executed for some time (e.g. power supply fault or if network is
not equipped with data logger and application is closed) then the program will show this
situation on the graph in the form of two vertical lines (Figure 4.12).
24
User manual for TRS system
interruption of
measurements
Figure 4.12. Vertical lines on the graph - interruption of measurements
4.2.3. „Devices infos” tab
Figure 4.13. Current measure - Devices infos tab
Devices infos tab (Figure 4.13) is used for viewing of critical situations and devices errors
reported in the system. The remaining elements of the Devices infos tab are available:
• From date,
• To date,
• table window consisting of remaining columns:
- From date
- date when report was created (began),
- To date
- date when report was finished (ended),
- Device name
- it is individual name of device, created by user while system
configuration (e.g. freezing chamber)
- Description
- this is the description of report type.
25
User manual for TRS system
•
•
[Refresh] button
[Confirm] button
i
•
- updates the displayed message list,
- this button is used to acknowledge alarm states. Acknowledge
results in turning off the alarm signal (sound and light) only. To
delete device message from the message list, it's cause must be
removed (i.e. turn on the fan, fix damaged wires e.t.c.)
If particular alarm has been acknowledged but it's cause has not removed, then
new messages, related to this alarm, do not generate sound and light signals.
„Do not call” option
- is default (after every running of the software) every new report
activates Devices infos tab. If it is necessary, user can switch off
automatic activation checking „Do not call” option field.
4.3. „REPORTS” MENU
Reports menu is used to view and print reports containing recorded measurement
results in the form of tables or graphs. This menu also enables export of measurement data to
a text format file.
Creating new reports is possible in two modes:
• for a group (collective report for a maximum of 12 logical devices),
• for a single logical device.
i
Creating a report for a removed device is possible only in single device mode.
4.3.1. „Table” tab
Figure. 4.14. Reports - Table tab
26
User manual for TRS system
The Table tab (Figure. 4.14) is used for printing information concerning recorded
measurements (e.g. temperature, humidity) in the form of a table for one of the groups or a
particular measurement device selected by the user (for more information on groups see 4.5
section, at page 35). This tab also enables the export of data to text format files. The exported
file is formatted in a way allowing the transfer of data to a calculation sheet.
A table consisting of columns containing measurement date and value (for one or a number of
devices) is displayed in the centre of the tab. The remaining elements of the Table tab are:
•
From date
- this is the date and time defining the beginning of analysed
measurement recording period for printing in the form of a table,
•
To date
- this is the date and time defining the end of analysed measurement
recording period for printing in the form of a table (this does not have to
be the current date),
•
•
•
[Print] button
- prints the report,
[Refresh] button - updates the displayed data
[To file] button - exports data to a text file
•
Groups/Devices
- for a group
- this box enables creating tables in two modes:
- collective table for a maximum of 12 measurement devices
(observed logical devices can belong to different physical devices),
- for a single logical device.
i
Creating groups is described in the GROUP OPERATIONS section (page 35).
Selecting table type (for a group or single device)
In order to select table type:
• click appropriate tab Groups or Devices (Figure. 4.14),
• check specific group or device. This will display measurement results for the selected
group or single device (displaying results takes place automatically after each change of
group or device).
i
In order to use table for groups the group must be created first. Creating groups is
described in the GROUP OPERATIONS section (4.5, page 35).
Change of “From date” or “To date”
Change of From date and To date date take place the same way as in Table tab of
Current measure menu (see page 20).
27
User manual for TRS system
4.3.2. „Graph” tab
Figure 4.15. Reports - Graph tab
Graph tab (Figure 4.15) is used for viewing and printing of recorded measurement results (e.g.
temperature, humidity) in the form of a graph. Meaning of particular tabs and methods of
functions service is analogical as for Table tab in Reports menu.
Measurement points tracking
If Show cursor field is checked then special graphical cursor is displayed on the graph.
This cursor allows to easy tracking of measured data of selected device. Colour of the cursor
is same as selected logical device colour. To change selection click left mouse button until
cursor became same colour as desired logical device. Near to the cursor informations about
selected point are displayed. Date and time of recording and value of the registered
measurement point.
Informations about
measurement point
Cursor lines displayed
in graph colour
Fig. 4.16. Graph with special tracking cursor
28
User manual for TRS system
4.4. „CONFIGURATION” MENU
The Configuration menu is used to:
• change the settings of devices working in the TRS system (Devices tab);
• operations of groups (Groups tab);
• operations of alarms (Alarms tab).
i
TERMINAL version of SimCorder Soft allows exclusively visualisation of the
settings, change of the settings can be made only via SERVER version installed on
the PC directly connected to TRS. network.
4.4.1. „Devices” tab
Figure 4.17. Configuration – Devices tab (advanced options hidden)
Changing of devices settings
The settings of devices can be changed by clicking on the Devices tab (Figure 4.17).
Parameters in this tab can be edited after clicking on [Show advanced options] button.
Figure 4.18. Configuration - Devices tab (advanced options active)
29
User manual for TRS system
The user will be asked to enter a password protecting against the changing of the settings by
an unauthorized person. Entering of proper password allows to edit parameters and displaying
of additional keys for devices adding / removing (Figure 4.18). The password is supplied
together with the SimCorder Soft program.
The Devices tab (Figure 4.18) contains such elements (fields) as:
•
Installed devices
- shows the tree contains a list of all currently installed
devices together with their addresses. The first level of
the tree shows physical devices. After clicking the “+”
sign next to the physical device name (e.g. TRS-01) with
mouse pointer, the logical devices corresponding to this
device are displayed. Logical devices can be divided into
three groups: input devices (sensors), output devices
(i.e. displays) and alarm devices. For example clicking on
TRS-01, we can see one input device (temperature
sensor) showed with name defined while system
configuration (i.e. "drying room 1"). Similarly clicking on
device type TRS-04 (temperature and relative humidity
sensor) we can see two names defined by user while
system configuration – separate name for temperature
sensor, and separate for humidity sensor.
•
[Add] and [Remove] buttons
- allow to add and remove installed devices from the
system,
•
...device properties
- shows the tree containing a list of properties of selected
physical or logical device (depending on Installed
devices selected element). All parameter's values
(underlined) can be edited. All changed but not approved
(using [Apply]) values are showed in bold.
•
[Apply] and [Revert] buttons
- allow to memorize of changed parameters or revert
changed but not approved (using [Apply]) parameters.
Physical device means module produced by SIMEX i.e. TRS-01a. Every physical device
consist in at least one logical device.
Logical device - it can be input device (i.e. Temperature sensor), output device (display) or
alarm device (i.e. signalling device). It is device servicing single function, and seemed in
system as single measurement channel. Physical devices can be build of single logical
devices (i.e. TRS-01a), or can be combination of two or more logical devices (i.e. TRS-04a).
Parameters of physical and logical devices are changed separately (individually for every type
of logical device).
30
User manual for TRS system
Changes of physical devices configurations.
1) To change configuration of selected physical device, in section ”Installed devices” check
selected physical devices on the list (first level of the tree)
2) Desired parameters may be changed on the tab ”Physical device properties” by writing
of it's new values,or selection of option from the list.
Followed parameters of Physical devices can be changed (Figure 4.19) :
•
•
device name,
some of internal registers (depend on device type).
Figure 4.19. Physical device configuration window.
3) To confirm changes, click on [Apply] button, to revert changed but not approved (using
[Apply]) parameters press [Revert] button.
Changes of logical devices configuration
1) To change configuration of selected logical device, in section ”Installed devices” check
selected logical device on the list (second level of the tree),
Depend on device type, properties window will be titled:
- ”Input device properties”
- for input devices
- ”Output device properties” - for output devices
- ”Alarm device properties” - for alarm devices
31
User manual for TRS system
2) Desired parameters may be changed on the tab ”...device properties” by writing of it's
new values, or selection of option from list menu.
Followed parameters of input devices can be changed (Figure 4.20) :
•
•
•
•
•
i
individual name of the device, this name identifies device in the system
measurement unit
minimum and maximum values (thresholds). If these values exceeded proper report
will appear
decimal point position - it is possible to express measurement results with resolution
higher than one decimal position. This possibility do not meets with temperature and
relative humidity measurements (parameter is fixed for these measurements)
relation between selected device messages and previously defined alarm states (see:
SIGNALISATION OF SYSTEM ALARM STATES)
Signalisation of system alarm states is not available in BASIC version of
SimCorder Soft program.
Figure 4.20. „Input device properties” window
Followed parameters of output devices can be changed (Figure 4.21) :
•
•
•
32
individual name of the device, this name identifies device in the system
input devices related to selected output device. Results of measurements realised by
input device will be send, and presented on selected output device (display).
decimal point selection mode. Decimal point can be placed on position defined by
input device, or on position defined by user. Selection of decimal point position
consist in checking of „Standard point” option, and selection of desired value from
list menu.
User manual for TRS system
Figure 4.21. „Output device properties” window
Every alarm device (Figure 4.22) has following settings:
•
•
name, identifying device in the system
reactions (behaviours) of particular alarm device related to previously defined alarm
states (see: SIGNALISATION OF SYSTEM ALARM STATES )
Figure 4.22. „Alarm device properties” window
3) To confirm changes, click on [Apply] Button, to close the window without changes click
[Revert] or press [ESC] on the keyboard.
33
User manual for TRS system
4.4.2. „Groups” tab
Figure 4.23. Configuration - Groups tab
Groups tab (Figure 4.23) is used to create, modification and delete definitions of devices
groups. Defined groups are used in menu Current measures and Reports for creation of
group tables and graphs.
i
The functions related to the groups are described in GROUP OPERATIONS
section.
4.4.3. „Alarms” tab
Figure 4.24. Configuration - Alarms tab
34
User manual for TRS system
Alarms tab (Figure 4.24) allows to define alarm states, which can occur in the system. Defined
states are being used while configuration of logical devices, and creation of relations between
device messages and alarm devices reactions.
i
•
•
The method of defined alarm states use is described in SIGNALISATION OF
SYSTEM ALARM STATES.
Signalisation of system alarm states is not available in BASIC version of
SimCorder Soft program.
4.4.4. „Settings” tab
Figure 4.25. Configuration - Settings tab
Settings tab (Figure 4.25) allows to modify main settings of the program.
4.5. GROUP OPERATIONS
A group enables creating a collective current graph/report for a number of devices, which
the user wishes to view on one graph/report. A group consists of a maximum of 12 logical
devices.
The functions described in the next part of this manual are available in Groups tab of
Configuration menu.
Typical methods of grouping devices:
• measurement devices of the same physical value (e.g. temperature or humidity),
• devices located in the same places, e.g. “Assembly room”.
i
One measurement device can belong to different groups.
35
User manual for TRS system
Figure 4.26. Group operations
Creating a new group
In order to create a new group:
• click on the [New group] button,
• assign a name to the new group.
• Finish the operation pressing [ENTER] or clicking on empty area of the Groups list.
Removing a group
In order to remove a group:
• check the desired group on the Groups list,
• click on the [Remove group] button.
Changing group name
In order to change a group’s name:
• check the desired group on the Groups list,
• click on the group again,
• the group name will be highlighted
- the name can be edited. The edit can be cancelled
(restore previous name) by pressing the [ESC] key.
Upon completing the edit, confirm changes with
[ENTER] key.
Adding measurement devices to a group
In order to add a measurement device to a group:
• check the group, to which the device is to be added (the checked group is marked with a
green circle),
• then check one, or (holding down the [Ctrl] key) many devices of Input devices list,
• finish the procedure using the [>>] button.
36
User manual for TRS system
i
A maximum of 12 devices can be added to one group.
Removing a measurement device from a group
To remove a device from a Group:
• find the desired group on the Groups list,
• show the list of devices in the group using “+” mark,
• check the measurement device to be removed,
• finish the procedure using the [<<] button.
4.6. SIGNALISATION OF SYSTEM ALARM STATES
The SimCorder Soft application in the ALARM and SERVER version is equipped in
mechanisms allowing to use the signalisation modules TRS-01B in the system. These
modules can signalise different states using sound and light signals (especially alarm states
generated by input devices ).
In basic versions of application (SimCorder Soft - BASIC), informations of exceptions
and errors are accessible only as text messages (in Device infos tab of Current measures
menu). In the ALARM and SERVER version of SimCorder Soft, every message can occur
defined reaction (behaviour) of selected signalisation module - TRS-B1.
4.6.1. Defining of alarm states
To define alarm states an Alarms tab of „Configuration” menu is designed. Defining of
alarm states relies on creation of „list of alarm states” related to selected input devices
messages.
Figure 4.27. Defining alarm states
37
User manual for TRS system
Addition of alarm state
To add new alarm state to the list:
• create new name and description of the state – in edition windows below alarm list
• click [Add] button
Modification of selected alarm state
To modify name or description of previously defined alarm state:
• select (using mouse cursor) state from Defined alarms window
• change desired parameter (name or description)
• click [Replace] button
Deleting of alarm state
To delete previously defined alarm state from list:
• select (using mouse cursor) state from Defined alarms window
• click [Delete] button
4.6.2. Defining of relations between device messages and alarm states
To define which of device messages should cause appropriate alarm state, their relations
must be previously defined. This definition can be made in Devices tab of Configuration
menu.
Figure 4.28. Defining of relations between device messages and alarm states
38
User manual for TRS system
Addition of relation
To add new relation between device message and alarm state:
• activate „Advanced options” (using [Show advanced options] button)
• in section „Installed devices” select device from devices list (using mouse cursor)
• go to window „Input device properties” and in section „Device message -> alarm” select
desired device message, and one or more alarm states
• click [Apply] button
Modification or deleting of relations:
To modify or delete relation between device message and alarm state:
• In section „Device message -> alarm” of „Input device properties” select desired device
message (using mouse cursor),
• change desired check boxes related to alarm states
• click [Apply] button
i
Relations should be defined for all device messages, of selected input devices,
which has to be signalised by TRS-B1 modules
4.6.3. Defining of relations between alarm states and alarm devices
To define which of TRS-B1 alarm devices (available in the system) has to react to
particular alarm states, proper relations must to be defined. It is possible to define behaviours
of particular signalisation module to every alarm state. All these definitions can be made in
Devices tab of Configuration menu.
Figure 4.29. Defining of relations between alarm states and alarm devices
39
User manual for TRS system
Addition or modification of relation:
To make new relation:
• activate „Advanced options” (using [Show advanced options] button),
• in section „Installed devices” select alarm device from Installed devices list (using mouse
cursor)
• go to „Alarm device properties” window and in section „Alarm - Action” select desired
alarm state and reaction from drop down lists
• click [Apply] button
i
Individual alarm device can react on different alarm states related to the same or
different behaviours of the alarm device. If few alarm states occur simultaneously
(and every of them is related to one device) highest priority has alarm state related
to behaviour with longest sound signals.
Deletion of relation:
To delete relation:
• go to „Alarm device properties” window and in section „Alarm - Action” select “none”
option from drop down list
• click [Apply] button
4.6.4. Example configuration of alarm states signalisations
Example configuration is showed on Figure 4.30. Messages „a” and „c” of devices no. 1
and 2 causes the same reaction of alarm device in Warehouse, informing about occurrence
of some situations. Most of messages additionally is being signalised in Control Room, using
the same reaction of one alarm device. Message „d” of input device no. 2 (e.g. situations
which needs quick operator reaction) has been distinguished with different behaviour of alarm
device(s). Messages „k”, „l”, „m” of input device no. 3 cause the same alarm state (it can be
situations with the same meaning/priority).
40
message b
message k
message l
message m
Device messages
Input device no 3
Cold store
message a
message c
message d
Device messages
Input device no 2
message a
message b
message c
Device messages
Input device no 1
Warehouse
behaviour A
behaviour B
Behaviours
Alarm device for Cold store
behaviour F
State V
State Vl
behaviour E
Behaviours
Alarm device
in Control Room
State lV
State III
State lI
State l
Defined alarm
states
behaviour A
behaviour B
behaviour C
behaviour D
Behaviours
Alarm device for Warehouse
User manual for TRS system
Figure 4.30. Example configuration of alarm states signalisations
41
User manual for TRS system
4.7. GSM NOTIFICATION
The SimCorder Soft application in the ALARM and SERVER version has new functions,
which allow sending messages via GSM network. All messages can be sent to previously
defined telephone numbers. To activate GSM messaging function, connect GSM modem to
selected serial port (of PC) and set its parameters using Settings tab of Configuration menu
(Figure 4.31):
–
–
–
–
–
Installed option must be set as “yes”,
Port parameter sets serial port number (name) which GSM modem is connected to.
Baud rate parameter sets speed of the modem,
PIN parameter defines PIN number of SIM card installed into modem
GSM number (from 1 to 5) defines telephone numbers the messages will be sent to.
i
In basic versions of application (SimCorder Soft - BASIC), informations of
exceptions and errors are accessible only as text messages (in Device infos tab of
Current measures menu). GSM notification is not available in BASIC version.
Figure 4.31. Example of GSM modem settings
42
User manual for TRS system
4.8. APPLICATION CLOSING
Closing of the application causes stopping of measurements by SimCorder Soft. If data
logger is present in the system, then it intercepts functions of measurement and data
registration. All measurements made by data logger will be transferred to the SimCorder Soft
while application starts again. Maximum time of data recording is showed in message window
(Figure 4.32).
i
TERMINAL version of SimCorder Soft can not cooperate with data logger directly.
Figure 4.32. Message window informs user about maximum time of data recording
(it is relates to systems equipped in data logger).
If system is not equipped with data logger then other window will appear when application
is being closed. (Figure 4.33).
Figure 4.33. Message window informs user about stopping of data recording
(it is related to systems without data logger).
i
Before operation of data reading (from data logger) is being finished, it is impossible
to close application (software displays warning window), but while data reading is
stopped by user (e.g. power off, or abnormal program termination) then data logger
will not restarts data registration. In such case all measurements since abnormal
program termination to next application run will be lost. To be sure of data
recording continuation proper application termination should be done.
43
User manual for TRS system
4.9. LIST OF ERRORS AND FAULT DIAGNOSTICS
Symptom
Cause
All points are a red colour
and a question mark (?) is
displayed instead of current
values
converter fault or one of
converter's connections
is broken
Some points are a red colour
(and question marks are
displayed instead of current
values)
Transmission line fault
One of the points is a red
colour (and question mark is
displayed instead of current
value)
Transducer fault
44
Action
•
•
•
•
•
•
•
check converter power supply
check connection of transmission line with
converter
check correct operation of computer’s
serial port (e.g. by connecting mouse to
the port supporting the converter)
check connections on the first transducer
that "does not reply"
check continuity of transmission line from
the place where the lack of
communications occurred
check transducer connections
if the control LED flashes at high rate, then
the transducer has a faulty sensor.
User manual for TRS system
45
User manual for TRS system
46
User manual for TRS system
47
System requirements:
designed for
Windows
At least i486 computer,
Windows® 95 or newer,
Colour monitor with minimum resolution of 640 x 480,
20 MB of free hard drive space.
®
SIMEX
SIMEX Sp. z o.o. , ul. Wielopole 7
PL - 80-556 Gdańsk, Poland
tel. : (+48 58) 762-07-77, fax: (+48 58) 762-07-70
http://www.simex.com.pl, e-mail: [email protected]