1
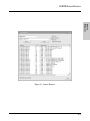
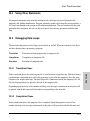
Using the Windows Interface
5.4
Using the Error Output Window
The Error Output window allows errors messages to be output to a separate window, instead of the
GAUSS Input - Output window. When an error occurrs, you can open to program of source file
directly from the Error Output window.
To open the program or source file, press F4 or double click the error message. The file will open
at the line the error occurred.
5.5
Using The Debugger
The debugger greatly simplifies program development. With all of the features of a dedicated
debugging system, the debugger can help you to quickly identify and solve logic errors at run-time.
The debugger is integrated into the multiple document interface of GAUSS; it uses the interface
tools, such as the edit windows, the Matrix Editor, and the Command Input - Output window for
debugging. So while using the debugger, you still have all the features of the edit windows and
Matrix Editor, along with GAUSS’s suite of debugging tools.
You use the debugger to watch the program code as it runs. Prior to running the debugger,
breakpoints and watch variables can be set to stop the program at points you set and provide
additional data as the code is run.
Windows GUI
5.5.1
Starting and Stopping the Debugger
You can start the debugger by clicking Go on the Debug menu or the Debug toolbar.
When starting the debugger, you can choose to debug the active file or to debug the main file of a
program. If you are debugging a single file and already have the file open, you can use the menu or
toolbar to start the debugger on the file, or simply type debug and the filename in the Command
Input - Output window.
When you start the debugger, the debugger automatically highlights the first line of code to be run.
Any breakpoints are shown in the left margin of the window.
5-7