1
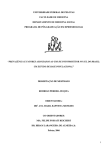
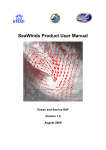
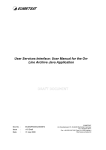
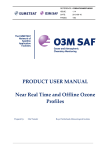
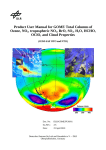
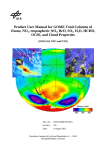
REFERENCE:
ISSUE:
DATE:
PAGE:
SAF/O3M/FMI/PUM/001
1.5
28.6.2013
1/ 16
PRODUCT USER MANUAL
Offline UV (OUV)
Products
Prepared by:
Jukka Kujanpää
Finnish Meteorological Institute
REFERENCE:
ISSUE:
DATE:
PAGE:
SAF/O3M/FMI/PUM/001
1.5
28.6.2013
2/ 16
Introduction to EUMETSAT Satellite Application Facility
on Ozone and Atmospheric Chemistry Monitoring (O3M SAF)
Background
The need for atmospheric chemistry monitoring was first realized when severe loss of stratospheric ozone
was detected over the Polar Regions. At the same time, increased levels of ultraviolet radiation were observed.
Ultraviolet radiation is known to be dangerous to humans and animals (causing e.g. skin cancer, cataract,
immune suppression) and having harmful effects on agriculture, forests and oceanic food chain. In
addition, the global warming - besides affecting the atmospheric chemistry - also enhances the ozone
depletion by cooling the stratosphere. Combined, these phenomena have immense effects on the whole
planet. Therefore, monitoring the chemical composition of the atmosphere is a very important duty for
EUMETSAT and the world-wide scientific community.
Objectives
The main objectives of the O3M SAF are to process, archive, validate and disseminate atmospheric composition products (O3 , NO2 , SO2 , OClO, HCHO, BrO, H2 O), aerosols and surface ultraviolet radiation
utilising the satellites of EUMETSAT. The majority of the O3M SAF products are based on data from
the GOME-2 spectrometer onboard MetOp-A satellite.
Another important task of the O3M SAF is the research and development in radiative transfer modelling
and inversion methods for obtaining long-term, high-quality atmospheric composition products from the
satellite measurements.
Product families
• Near real-time Total Column (NTO)
– O3 , NO2 , O3 Tropo, NO2 Tropo
• Near real-time Ozone Profile (NOP)
• Near real-time UV Index (NUV)
• Offline Total Column (OTO)
– O3 , NO2 , O3 Tropo, NO2 Tropo, SO2 , BrO, H2 O, HCHO, OClO
• Offline Ozone Profile (OOP)
• Offline Surface UV (OUV)
• Aerosols (ARS)
Product timeliness and dissemination
Data products are divided in two categories depending on how quickly they are available to users:
Near real-time products are available in less than three hours after measurement. These products are
disseminated via EUMETCast (NTO, NOP), GTS (NTO, NOP) or Internet (NUV).
Offline products are available in two weeks from the measurement and they are archived at the O3M SAF
archives in Finnish Meteorological Institute (OOP, OUV, ARS) and German Aerospace Center (OTO).
Only products with “pre-operational” or “operational” status are disseminated. Up-to-date status of the
products and ordering info is available on the O3M SAF website.
Information about the O3M SAF project, products and services: http://o3msaf.fmi.fi/
O3M SAF Helpdesk: [email protected]
REFERENCE:
ISSUE:
DATE:
PAGE:
SAF/O3M/FMI/PUM/001
1.5
28.6.2013
3/ 16
DOCUMENT STATUS SHEET
Issue
Date
Modified items / Reason for change
1.0
1.1
15.11.2006
04.05.2007
1.2
1.3
04.04.2008
12.02.2009
1.4
20.05.2013
1.5
28.06.2013
Initial revision of the full document
-moved algorithm description and error analysis to a separate ATBD as required by EUMETSAT
-updated the file naming convention
-added error fields
- clarified the setting of quality flags in section 3.2.; table 3 in section 5.1.2.;
tables 7 and 8 in section 5.1.4.
-added vitamin D weighting products
-removed SCUP-h weighting products
-introduced the homogenized cover page
-added the SAF introduction page
-renumbered tables and figures
-reformatted tables
- sect. 1.2: added acronyms
- sect. 1.3.2.: corrected the HDF5 link
- eq. 2.2: corrected O -> O(3P)
- table 2.1: swapped wavelength ranges of UVA and UVB
- p. 6: a HDF5 file -> an HDF5 file
- p. 9: corrected typos, changed ’produced operatively’ -> ’operationally
processed’, ’sending e-mail’ -> ’sending an email’
- sect 3.2.: rephrased the list on quality flag usage
SAF/O3M/FMI/PUM/001
1.5
28.6.2013
4/ 16
REFERENCE:
ISSUE:
DATE:
PAGE:
Contents
1
INTRODUCTION
1.1 Purpose and scope . . . . . . .
1.2 Acronyms . . . . . . . . . . .
1.3 References . . . . . . . . . . .
1.3.1 Applicable Documents
1.3.2 Reference Documents
.
.
.
.
.
.
.
.
.
.
.
.
.
.
.
.
.
.
.
.
.
.
.
.
.
.
.
.
.
.
.
.
.
.
.
.
.
.
.
.
.
.
.
.
.
.
.
.
.
.
.
.
.
.
.
.
.
.
.
.
.
.
.
.
.
.
.
.
.
.
.
.
.
.
.
.
.
.
.
.
.
.
.
.
.
.
.
.
.
.
.
.
.
.
.
.
.
.
.
.
.
.
.
.
.
.
.
.
.
.
.
.
.
.
.
.
.
.
.
.
.
.
.
.
.
.
.
.
.
.
.
.
.
.
.
.
.
.
.
.
.
.
.
.
.
.
.
.
.
.
.
.
.
.
.
5
5
5
5
5
5
2
Product overview
7
3
Product quality
3.1 Expected Accuracy and Validation . . . . . . . . . . . . . . . . . . . . . . . . . . . . .
3.2 Quality flags . . . . . . . . . . . . . . . . . . . . . . . . . . . . . . . . . . . . . . . . .
3.3 Current Quality Issues . . . . . . . . . . . . . . . . . . . . . . . . . . . . . . . . . . .
9
9
9
9
4
Processing, archiving and dissemination
4.1 Processing and archiving . . . . . . . . . . . . . . . . . . . . . . . . . . . . . . . . . .
4.2 Product ordering . . . . . . . . . . . . . . . . . . . . . . . . . . . . . . . . . . . . . .
4.3 User services . . . . . . . . . . . . . . . . . . . . . . . . . . . . . . . . . . . . . . . .
10
10
10
10
5
Product file format
5.1 File structure . . . . . . . . . . . . . . . . . . . . .
5.1.1 METADATA Group . . . . . . . . . . . . .
5.1.2 PRODUCT_SPECIFIC_METADATA Group
5.1.3 GRID_DESCRIPTION Group . . . . . . . .
5.1.4 GRID_PRODUCT Group . . . . . . . . . .
5.2 Data Types . . . . . . . . . . . . . . . . . . . . . .
5.3 File naming convention . . . . . . . . . . . . . . . .
11
11
11
12
12
12
15
15
.
.
.
.
.
.
.
.
.
.
.
.
.
.
.
.
.
.
.
.
.
A Traceability of metadata to Eumetsat Data Centre parameters
.
.
.
.
.
.
.
.
.
.
.
.
.
.
.
.
.
.
.
.
.
.
.
.
.
.
.
.
.
.
.
.
.
.
.
.
.
.
.
.
.
.
.
.
.
.
.
.
.
.
.
.
.
.
.
.
.
.
.
.
.
.
.
.
.
.
.
.
.
.
.
.
.
.
.
.
.
.
.
.
.
.
.
.
.
.
.
.
.
.
.
.
.
.
.
.
.
.
.
.
.
.
.
.
.
.
.
.
.
.
.
.
16
REFERENCE:
ISSUE:
DATE:
PAGE:
1
SAF/O3M/FMI/PUM/001
1.5
28.6.2013
5/ 16
INTRODUCTION
1.1
Purpose and scope
This document is the user manual of the O3M SAF Offline UV product (OUV). It includes the definition
of the product format. The algorithm and error analysis are described in a separate Algorithm Theoretical
Basis Document [AD1].
1.2
Acronyms
ARS
ATBD
AVHRR
CIE
DLR
DNA
EUMETCast
EUMETSAT
FMI
GOME-2
GTS
HDF
Internet
Metop
NOAA
NOP
NRT
NTO
NUV
O3M SAF
OOP
OTO
OUV
PUM
UMARF
UV
UVI
WHO
1.3
1.3.1
Aerosol Retrieval System / Aerosol product
Algorithm Theoretical Basis Document
Advanced Very High Resolution Radiometer
Commission Internationale de l’Éclairage, International Commission on Illumination
Deutsches Zentrum für Luft- und Raumfahrt, German Aerospace Center
Deoxyribonucleic acid
EUMETSAT’s broadcast system for environmental data
European Organisation for the Exploitation of Meteorological Satellites
Finnish Meteorological Institute
Global Ozone Monitoring Experiment-2
Global Telecommunications System
Hierarchial Data Format
International network
Meteorological Operational satellite programme
National Oceanic and Atmospheric Administration
Near real-time Ozone Profile product
Near real-time
Near real-time Total Ozone product
Near real-time UV product
Satellite Application Facility on Ozone and Atmospheric Chemistry Monitoring
Offline Ozone Profile product
Offline Total Ozone product
Offline UV product
Product User Manual
Unified Meteorological Archiving and Retrieval Facility
Ultraviolet radiation
UV Index
World Health Organization
References
Applicable Documents
[AD1] OUV Algorithm Theoretical Basis Document, SAF/O3M/FMI/ATBD/001, Issue 1.4, 28.6.2013.
[AD2] O3M SAF Product Requirements Document, SAF/O3M/FMI/RQ/PRD/001, Issue 1.3, 16.5.2013.
[AD3] UMARF to SAFs ICD, EUM/UMA/ICD/004, Issue 3.13, 14 Feb 2007.
[AD4] UMARF SAF Metadata Definition, EUM/UMA/TEN/030, Issue 1.7, 09 Feb 2007.
1.3.2
Reference Documents
[RD1] Global Solar UV Index: A Practical Guide, WHO, 2002, ISBN 92 4 159007 6, Annex C,
http://www.who.int/uv/publications/en/GlobalUVI.pdf
[RD2] McKinlay A.F and Diffey B.L., CIE Research Note, 6(1), 1987
[RD3] Setlow R.B., Proc. Nat. Acad. Sci. USA., 71, 3363-3366, 1974.
[RD4] Caldwell, M.M. “Solar UV Irradiation and the Growth and Development of Higher Plants”, pages 131-177 in Giese A.G (ed.)
Photophysiology, vol 6. Academic Press, New York, 1971
[RD5] CIE, 2006. Action spectrum for the production of previtamin D3 in human skin. Technical Report 174. International Commission on
Illumination.
[RD6] Kinne S. (2007): Towards an observation-tied AOD climatology, presentation in AT2 Aerosol Workshop, Bremen, June 2007.
REFERENCE:
ISSUE:
DATE:
PAGE:
SAF/O3M/FMI/PUM/001
1.5
28.6.2013
6/ 16
[RD7] Tanskanen, A., (2004) Lambertian surface albedo climatology at 360 nm from TOMS data using moving time-window technique. Proc.
XX Quadrennial Ozone Symposium, 1-8 June, Kos, Greece., pp 1159-1160.
[RD8] HDF5 File Format Specification, http://www.hdfgroup.org/HDF5/doc/H5.format.html
[RD9] Herman, J.R., and E. Celarier, “Earth surface reflectivity climatology at 340-380 nm from TOMS data.” J. Geophys. Res., 102, 28,00328,011, 1997.
REFERENCE:
ISSUE:
DATE:
PAGE:
2
SAF/O3M/FMI/PUM/001
1.5
28.6.2013
7/ 16
Product overview
The O3M SAF offline surface UV product is derived from the measurements of the operational
polar orbiting Metop and NOAA satellites. The product contains the most important quantities of the
Sun’s radiation that can be harmful to life and materials on the Earth. These quantities include daily
doses and maximum dose rates of integrated UV-B and UV-A radiation together with values obtained
by different biological weighting functions, the solar noon UV index [RD1], and quality control flags.
In addition, photolysis frequencies for photodissosiation of ozone and nitrogen dioxide are given for air
quality applications. The product is calculated in a 0.5 degree regular grid and stored in an HDF5 file.
The contents of the product file are listed in section 5. An example of the daily erythemal dose product
is shown in figure 2.1 below.
0.0
0.8
1.6
2.4
3.2
4.0
4.8
5.6
6.4
7.2
8.0
Figure 2.1: An example product field. Erythemal (CIE) daily dose [kJ/m2] on 12 May 2008. The global coverage
is limited by the swath of GOME-2 instrument, leaving stripes at low latitudes. The polar night and large solar
zenith angles limit the coverage at the winter pole.
The biological weighting functions (also known as action spectra) model responses of different biological entities to UV radiation. The currently applied functions are plotted in figure 2.2 (left) and a short
description of their meaning is given in table 2.1.
The photolysis frequencies jO(1 D) and jNO2 are the rate constants of the following two key reactions
in the chemistry of the troposphere:
O3 + hν(λ < 320nm) → O(1 D) + O2 ,
d[O(1 D)]
= jO(1 D) [O3 ]
dt
(2.1)
d[NO2 ]
= jNO2 [NO2 ]
(2.2)
dt
Absorption cross sections of ozone and nitrogen dioxide, and the quantum yields of the two reactions are
shown in figure 2.2 (right). The photolysis frequencies are currently given only at the surface level.
NO2 + hν(λ < 420nm) → NO + O(3 P), −
Table 2.1: Description of the biological weighting functions used in the OUV product.
Weighting function
Ref.
Integration wavelength range [nm]
Description
Measures the reddening of the skin due to sunburn. Also known as the erythemal weighting function. Used for UV index.
Measures the ability of UV irradiance to cause damage to unprotected DNA.
Measures the generalized response of plants to UV irradiance.
Integrated UVB radiation
Integrated UVA radiation
production of previtamin D3 in human skin
CIE
[RD2]
290 - 400
DNA
Plant
UVB
UVA
Vitamin D
[RD3]
[RD4]
[RD5]
290 - 400
290 - 400
290 - 315
315 - 400
290 - 330
REFERENCE:
ISSUE:
DATE:
PAGE:
101
cross section [cm2 /molec]
100
relative response
2.0 1e 18
CIE
DNA
Plant
vitD
10-1
10-2
10-3
absorption cross sections and quantum yields
σ(O3 ), 298K
σ(NO2 ), 298K 1.0
1.5
0.8
1.0
φ(O3 ), 298K 0.6
φ(NO2 ), 296K
quantum yield
102
SAF/O3M/FMI/PUM/001
1.5
28.6.2013
8/ 16
0.4
0.5
0.2
10-4
10-5280
300
320
340
360
wavelength [nm]
380
400
0.0
300
350
400
wavelength [nm]
450
5000.0
Figure 2.2: Left: the biological weighting functions: CIE (blue), DNA (green), Plant (red) and vitamin D (cyan).
Right: cross-sections (solid line) and quantum yields (dotted line) for ozone (blue) and NO2 (red).
The key factors affecting the surface UV radiation are ozone, clouds, aerosols and surface albedo.
The total ozone is obtained from the O3M SAF near real time total column ozone product (NTO). This
product is made by German Aerospace Center (DLR) and disseminated via the EUMETCast broadcasting
system. It is derived from the measurements of the GOME-2 instrument onboard Metop satellites.
The cloud optical depth is estimated from AVHRR channel 1 (visible) reflectances. AVHRR is also
onboard the Metop satellites. The sampling of the diurnal cloud cycle is improved by using additional
AVHRR data from the NOAA satellites, available through the data exchange between EUMETSAT and
NOAA. Because Metop is on a morning orbit and NOAA satellite on the afternoon orbit, at least two
samples of the diurnal cycle can be obtained globally (fig. 2.3). More overpasses are available at high
latitudes where the instrument swaths overlap for consecutive orbits. This sampling scheme provides a
sufficient compromise between the global coverage and sampling of the diurnal cycle. Moreover, the
processing data flow can be kept relatively simple because both the Metop and NOAA AVHRR data are
available through EUMETCast. The aerosol optical depth is currently taken from a climatology [RD6],
and the surface albedo from the climatologies of Tanskanen [RD7] and Herman et al. [RD9].
Metop
9:30
NOAA
14:30
Figure 2.3: The diurnal cycle of UV dose rate (clear-sky case shown for clarity) together with the sampling
achieved by Metop and NOAA AVHRR measurements. The sampling of the diurnal cycle is improved at high
latitudes where the instrument swaths overlap for consecutive orbits.
REFERENCE:
ISSUE:
DATE:
PAGE:
3
3.1
SAF/O3M/FMI/PUM/001
1.5
28.6.2013
9/ 16
Product quality
Expected Accuracy and Validation
The target product accuracy is 20 % against ground-based UV measurements. The surface UV product is validated by a validation service. This service, also located at FMI, performs two different
validation activities. Firstly, online quality monitoring compares new products with a time-series of
all previously processed products to detect any degration in the product quality. These online quality
monitoring plots are available at http://o3msaf.fmi.fi/uv_validation/online_quality.html. Secondly, the
UV product is fully validated against quality-checked ground-based measurements. These results are
provided as validation reports. The latest validation report is available on the O3M SAF web site at
http://o3msaf.fmi.fi/uv_validation/latest_report.html.
3.2
Quality flags
Quality flags (table 5.6) are set during the processing to indicate degraded product quality. Figure 3.1
shows example plots of the quality flags. These quality flags should be carefully examined when using the
product. In order to simplify basic quality control, three summary flags (table 5.7) have been designed:
QC_MISSING, QC_LOW_QUALITY and QC_MEDIUM_QUALITY. The user is encouraged to use these summary flags as follows:
• If invalid data is to be filtered out, apply QC_MISSING. This is also achieved by excluding fill values in
the data.
• If low data quality is to be filtered out, apply QC_LOW_QUALITY (it contains QC_MISSING).
• If medium quality data is to be filtered out apply QC_MEDIUM (it contains QC_LOW_QUALITY).
Figure 3.1: Example plots of the quality flags. The red color indicates where the flag is on. (left) The polar
night flag is set when the solar zenith angle is larger than 88 degrees and (right) the low quality flag is set when
it is larger than 70 degrees. The low quality flag is also set for other conditions, such as edges of ice sheets with
inhomogeneous surface albedo and mountains with sloped surfaces.
3.3
Current Quality Issues
The estimation of effective cloud optical depth from the AVHRR reflectances becomes prone to errors if
the solar zenith angle is larger than 70 degrees or if the surface albedo is high, and therefore the corresponding product values are flagged as of low quality. The product values are also flagged if insufficient
cloud data were available for the calculation of the diurnal integral.
Climatological values are currently used for surface albedo and aerosols. The surface albedo climatology fails during snow falling and melting periods, which vary from year to year. The aerosol climatology, on the other hand, tends to underestimate the aerosol loading in the boundary layer, especially
during the summer time.
REFERENCE:
ISSUE:
DATE:
PAGE:
4
4.1
SAF/O3M/FMI/PUM/001
1.5
28.6.2013
10/ 16
Processing, archiving and dissemination
Processing and archiving
The offline UV product is operationally processed with a maximum delay of 15 days between the satellite
measurements and the dissemination to the users. The actual delay depends on the operational computing
environment and on possible delays in getting the input data from different sources. The delay is typically
three days. The overall processing scheme is described below.
The input near real time total column ozone product (NTO) is produced by the German Aerospace
Center (DLR). It is sent to the EUMETCast uplink station at Usingen, Germany, where it is broadcasted
via telecommunication satellites (Eurobird). The NTO product is received at FMI, together with input
AVHRR level 1b products both from Metop and NOAA satellites.
The output OUV product is stored in the FMI Archive, from where it can be ordered via the Eumetsat
Data Centre. The processing data flow is depicted in figure 4.1 below.
Figure 4.1: Overall processing data flow.
4.2
Product ordering
The product can be ordered from the Eumetsat Data Centre at
http://www.eumetsat.int/Home/Main/DataAccess/EUMETSATDataCentre/index.htm. The product order will be transmitted to the FMI Archive, and the user will receive an e-mail containing the instructions
on how to download the data files.
4.3
User services
The helpdesk can be accessed through the O3M SAF web site at http://o3msaf.fmi.fi, or by sending an
email to [email protected].
REFERENCE:
ISSUE:
DATE:
PAGE:
5
SAF/O3M/FMI/PUM/001
1.5
28.6.2013
11/ 16
Product file format
This section describes the HDF5 format [RD8] of the offline UV product.
5.1
File structure
The data in the HDF5 file is organized under four groups: METADATA, PRODUCT_SPECIFIC_METADATA, GRID_DESCRIPTION
and GRID_PRODUCT. The file structure is shown in figure 5.1. The values in all groups are either copied from
the input data or calculated by the processor. The METADATA group contains the parameters required by the
/
METADATA
PRODUCT_SPECIFIC_METADATA
GRID_DESCRIPTION
GRID_PRODUCT
Figure 5.1: Structure of the HDF5 file.
Eumetsat Data Centre while the PRODUCT_SPECIFIC_METADATA group is used for additional information specific
to this product. The product fields are stored in a regular longitude-latitude grid. The grid parameters
are stored as attributes of the GRID_DESCRIPTION group whereas the product fields are stored as datasets in
the GRID_PRODUCT group. The x-dimension of the grid is the longitude and the y-dimension is the latitude.
The product fields are two-dimensional arrays of floating point or integer data. If a value for a grid
cell cannot be calculated, a fill value is written to the array. Each array has five attributes: Title, Unit,
FillValue, ValidRangeMin and ValidRangeMax. These are used to describe the contents of the array. The
organization of the data is illustrated in figure 5.2.
YNumCells
Latitude (y)
XNumCells
YStepDeg
YStartLat
Longitude (x)
XStartLon XStepDeg
Figure 5.2: Organization of the product fields in the HDF5 file.
5.1.1
METADATA Group
The content of the METADATA group is shown in the following table. All parameters are stored as attributes
of the group. The allowed values for the parameters that are required by the Eumetsat Data Centre are
consistent with the requirements given in [AD4]. The allowed values given in italics mean any value of
the given type (e.g. string means that the attribute can contain any string, within the size limit).
SAF/O3M/FMI/PUM/001
1.5
28.6.2013
12/ 16
REFERENCE:
ISSUE:
DATE:
PAGE:
Table 5.1: METADATA group contents.
Attribute name
Data type
Description
Allowed values
SatelliteID
OrbitType
InstrumentID
SensingStartTime
SensingEndTime
ProcessingCentre
ProcessingLevel
ProcessingMode
string
string
string
string
string
string
string
string
Platform identifier (mission and spacecraft the product originated from).
Orbit type of the spacecraft, indicating the coverage of the product.
Instrument which acquired the product.
UTC date and time at acquisition start of the product.
UTC date and time at acquisition end of the product.
Centre that generated the data.
Processing level applied for generation of the product.
Processing mode applied for generation of the product
ProcessingTime
ReferenceTime
ProductAlgorithmVersion
ParentProducts
BaseAlgorithmVersion
ProductType
ProductFormatVersion
OverallQualityFlag
QualityInformation
DegradedRecordCount
DegradedRecordPercentage
MissingDataCount
MissingDataPercentage
GranuleType
MapProjection
DispositionMode
string
string
string
string
string
string
string
string
string
int
int
int
int
string
string
string
UTC date and time at processing end of the product.
Time at which the product is defined to be valid.
Version of the algorithm that produced the product.
A list of the name of the parent products, upon which the product is based.
Version of the NTO product.
Abbreviated name for the product type, or rather product category.
Version number of the product format (= Issue of this User Manual document)
Overall quality flag for the product.
Several miscellaneous quality indicators for the product.
Number of degraded product values.
Percentage of degraded product values.
Number of missing product values.
Missing data percentage.
Type description of the item.
Projection used by the product
Disposition mode applied for generation of the product
M01,M02,M03, N15,N16,N17,N18, N19 etc.
LEO
GOME,AVHR
YYYY-MM-DDThh:mm:ss.ddd
YYYY-MM-DDThh:mm:ss.ddd
O3FMI
03
N=Nominal,
B=Backlogged,
R=Reprocessed,
V=Validation
YYYY-MM-DDThh:mm:ss.ddd
Same value as ProcessingTime
String<4>
NTO, AVHRR_level_1b
String<4>
O3MOUV
String<4>
OK or NOK
String<511>
Int
Int 0-100
Int
Int 0-100
DP
Geographic
O = Operational, P = Pre-operational
5.1.2
PRODUCT_SPECIFIC_METADATA Group
The product specific metadata are listed in the following table.
Table 5.2: PRODUCT_SPECIFIC_METADATA group contents.
Attribute name
Data type
Unit
Description
LowSunNoonSza
PolarNightNoonSza
ThickCloudsCod
HighAlbedoClearSky
HighAlbedoClearSkyPatm
InhomogeneousSurfaceHeightLimit
InhomogeneousSurfaceAlbedoLimit
float
float
float
float
float
float
float
degree
degree
none
none
atm
m
none
Limiting solar noon zenith angle for setting the QC_LOW_SUN quality flag.
Limiting solar noon zenith angle for setting the QC_POLAR_NIGHT quality flag.
Limiting cloud optical depth for setting the QC_THICK_CLOUDS quality flag.
Limiting surface albedo for setting the QC_HIGHALB_CLEARSKY quality flag.
Limiting surface pressure for setting the QC_HIGHALB_CLEARSKY quality flag.
Limiting surface height deviation for setting the QC_INHOMG_SURFACE quality flag.
Limiting surface albedo deviation for setting the QC_INHOMG_SURFACE quality flag.
5.1.3
GRID_DESCRIPTION Group
The grid parameters are stored as attributes of the
following table.
GRID_DESCRIPTION
group. The attributes are given in the
Table 5.3: GRID_DESCRIPTION group contents.
Attribute name
Data type
Unit
Description
XNumCells
YNumCells
XStartLon
YStartLat
XStepDeg
YStepDeg
int
int
float
float
float
float
N/A
N/A
degree
degree
degree
degree
Number of grid cells in the X direction
Number of grid cells in the Y direction
Longitude of the centre of the first grid cell in the X direction. Longitude ranges from -180 to +180.
Latitude of the centre of the first gird cell in the Y direction. Latitude ranges from -90 to +90.
Step (increment) between the grid cells in the X direction
Step (increment) between the grid cells in the Y direction
5.1.4
GRID_PRODUCT Group
The datasets in the GRID_PRODUCT group are given in the following table. The daily doses, daily maximum
dose rates and their error estimates are stored for the following four different biological weightings:
erythemal (“Cie”), DNA damage (“Dna”), generalized plant response (“Plant”) and vitamin D (“Vitd”),
together with integrated UV-B (290-315 nm) and UV-A (315-400 nm) radiation and the solar noon UV
index. In addition, the daily maximum photolysis frequencies of O(1 D) formation and NO2 photodissosiation are given. Attributes attached to all datasets in this group are listed in table 5.5. The contents
of the QualityFlags and the setting of the summary flags are listed in tables 5.6 and 5.7.
REFERENCE:
ISSUE:
DATE:
PAGE:
SAF/O3M/FMI/PUM/001
1.5
28.6.2013
13/ 16
Table 5.4: GRID_PRODUCT group contents.
Dataset name
Data type
Unit
Description
DailyDoseCie
DailyDoseCieLow
DailyDoseCieHigh
DailyDoseDna
DailyDoseDnaLow
DailyDoseDnaHigh
DailyDosePlant
DailyDosePlantLow
DailyDosePlantHigh
DailyDoseVitd
DailyDoseVitdLow
DailyDoseVitdHigh
DailyDoseUvb
DailyDoseUvbLow
DailyDoseUvbHigh
DailyDoseUva
DailyDoseUvaLow
DailyDoseUvaHigh
DailyMaxDoseRateCie
DailyMaxDoseRateCieLow
DailyMaxDoseRateCieHigh
DailyMaxDoseRateDna
DailyMaxDoseRateDnaLow
DailyMaxDoseRateDnaHigh
DailyMaxDoseRatePlant
DailyMaxDoseRatePlantLow
DailyMaxDoseRatePlantHigh
DailyMaxDoseRateVitd
DailyMaxDoseRateVitdLow
DailyMaxDoseRateVitdHigh
DailyMaxDoseRateUvb
DailyMaxDoseRateUvbLow
DailyMaxDoseRateUvbHigh
DailyMaxDoseRateUva
DailyMaxDoseRateUvaLow
DailyMaxDoseRateUvaHigh
DailyMaxJO1D
DailyMaxJO1DLow
DailyMaxJO1DLow
DailyMaxJNO2
DailyMaxJNO2Low
DailyMaxJNO2Low
SolarNoonUvIndex
SolarNoonUvIndexLow
SolarNoonUvIndexHigh
QualityFlags
float
kJ/m2
float
kJ/m2
float
kJ/m2
float
kJ/m2
float
kJ/m2
float
kJ/m2
float
mW/m2
float
mW/m2
float
mW/m2
float
mW/m2
float
mW/m2
float
mW/m2
float
1/s
float
1/s
float
N/A
int
N/A
Daily UV dose, CIE weighting
-low dose estimate
-high dose estimate
Daily UV dose, DNA damage weighting
-low dose estimate
-high dose estimate
Daily UV dose, Plant response weighting
-low dose estimate
-high dose estimate
Daily UV dose, Vitamin D synthesis weighting
-low dose estimate
-high dose estimate
Daily UV dose, integrated UV-B (290-315 nm)
-low dose estimate
-high dose estimate
Daily UV dose, integrated UV-A (315-400 nm)
-low dose estimate
-high dose estimate
Daily maximum dose rate, CIE weighting
-low dose rate estimate
-high dose rate estimate
Daily maximum dose rate, DNA damage weighting
-low dose rate estimate
-high dose rate estimate
Daily maximum dose rate, Plant response weighting
-low dose rate estimate
-high dose rate estimate
Daily maximum dose rate, Vitamin D synthesis weighting
-low dose rate estimate
-high dose rate estimate
Daily maximum dose rate, integrated UV-B (290-315 nm)
-low dose rate estimate
-high dose rate estimate
Daily maximum dose rate, integrated UV-A (315-400 nm)
-low dose rate estimate
-high dose rate estimate
Daily maximum j(O(1 D))
-low rate estimate
-high rate estimate
Daily maximum j(NO2 )
-low rate estimate
-high rate estimate
Solar noon UV index
-low index estimate
-high index estimate
Quality flags for the product. See table 5.6 for interpretation of the bits.
Table 5.5: Attributes for the GRID_PRODUCT group datasets.
Attribute name
Data type
Description
Title
Unit
FillValue
ValidRangeMin
ValidRangeMax
string
string
same as the dataset
same as the dataset
same as the dataset
Description of the dataset, e.g. “Solar noon UV index”
Unit of the values in the array, e.g. second
Number in the array, if actual data value is missing
Minimum allowed value for the data in the array
Maximum allowed value for the data in the array
REFERENCE:
ISSUE:
DATE:
PAGE:
SAF/O3M/FMI/PUM/001
1.5
28.6.2013
14/ 16
Table 5.6: Interpretation of the QualityField. Flags have the value 1 for on and 0 for off.
Bit
Name
Description
0
1
2
3
QC_MISSING
QC_LOW_QUALITY
QC_MEDIUM_QUALITY
QC_INHOMOG_SURFACE
4
5
OC_POLAR_NIGHT
QC_LOW_SUN
6
7
8
9
QC_OUTOFRANGE_INPUT
QC_NO_CLOUD_DATA
QC_POOR_DIURNAL_CLOUDS
QC_THICK_CLOUDS
10
11
12
QC_ALB_CLIM_IN_DYN_REG
QC_LUT_OVERFLOW
QC_HIGHALB_CLEARSKY
Data are missing.
At most low quality expected.
At most medium quality expected.
The surface UV varies too much within the grid cell because of surface inhomogenity. The flag is set if:
- surface height within the grid cell deviates from the mean value more than the value InhomogeneousSurfaceHeightLimit given in the
product specific metadata field.
- surface albedo within the grid cell and its nearby neighbours deviates more than the value InhomogeneousSurfaceAlbedoLimit given
in the product specific metadata field.
Polar night. The solar zenith angle is larger than the value PolarNightNoonSza given in the product specific metadata field.
The Sun is too low for reliable radiative transfer modelling of surface UV. The threshold solar zenith angle is given in the
LowSunNoonSza attribute of the product specific metadata field.
Out of range input data was detected, but the value could still be used in processing.
No cloud data were available.
Poor diurnal cloud coverage. This flag is set when insufficient cloud data are available to cover the diurnal cloud cycle.
Thick clouds were observed. This flag is set when optically thick clouds are observed during the day. Saturation of the atmospheric
reflectance as a function of the cloud optical depth prevents accurate estimation of the cloud optical depth, and therefore, the surface
UV flux cannot be accurately determined. The threshold cloud optical depth is given in the ThickCloudsCod attribute of the product
specific metadata field.
Surface albedo climatology was used in a dynamic region where albedo varies with the snow and ice cover.
Look-up table limits were exceeded and a value was extrapolated.
Clear-sky was assumed if surface albedo was larger than the value HighAlbedoClearSky and surface pressure was smaller than the
value HighAlbedoClearSkyPatm given in the product specific metadata field.
13-15
16-19
reserved for future use
QC_OZONE_SOURCE
20-23
24-27
28-31
QC_NUM_AM_COT
QC_NUM_PM_COT
QC_NOON_TO_COT
4 bits as an integer: source of total column ozone data. In the current version this is always 0 meaning GOME-2 total ozone (NTO or
OTO)
4 bits as an integer: number of cloud optical thickness observations in the morning, value 15 indicating 15 or more observations.
4 bits as an integer: number of cloud optical thickness observations in the afternoon, value 15 indicating 15 or more observations.
4 bits as an integer: minimum time in hours (rounding towards zero) between the solar noon and the nearest cloud optical thickness
(COT) observation
Table 5.7: Mapping of the quality flags to summary flags.
Summary flag
Summary flag is on if any of these flags is on.
QC_MISSING
QC_POLAR_NIGHT
QC_NO_CLOUD_DATA
QC_MISSING
QC_LOW_SUN
QC_OUTOFRANGE_INPUT
QC_LUT_OVERFLOW
QC_LOW_QUALITY
QC_POOR_DIURNAL_CLOUDS
QC_HIGHALB_CLEARSKY
QC_INHOMOG_SURFACE
QC_THICK_CLOUDS
QC_ALB_CLIM_IN_DYN_REG
QC_LOW_QUALITY
QC_MEDIUM_QUALITY
REFERENCE:
ISSUE:
DATE:
PAGE:
5.2
SAF/O3M/FMI/PUM/001
1.5
28.6.2013
15/ 16
Data Types
The data types to be used in the HDF5 files are listed in the table 5.8 below.
Table 5.8: Data types for the HDF5 files.
5.3
Data type
HDF5 predefined data type
char
short int
int
float
double
string
H5T_STD_I8LE
H5T_STD_I16LE
H5T_STD_I32LE
H5T_IEEE_F32LE
H5T_IEEE_F64LE
Fortran: H5T_FORTRAN_S1, C: H5T_C_S1
File naming convention
The file naming convention of the OUV product is depicted in figure 5.3.
YYYYMMDDv01p00.HDF5
extension
processor version, minor
processor version, major
day
month
year
Figure 5.3: The structure of the OUV file name.
REFERENCE:
ISSUE:
DATE:
PAGE:
A
SAF/O3M/FMI/PUM/001
1.5
28.6.2013
16/ 16
Traceability of metadata to Eumetsat Data Centre parameters
This appendix contains details related to the interface between the catalogue of the EUMETSAT Data
Centre (previously named as UMARF, this acronym is used here for clarity) and the FMI archive [AD3].
The metadata parameters [AD4] which are applicable to the O3MSAF products are stored in the HDF5
file as attributes in the Metadata group (table 5.1). The tracing of UMARF parameters to the attributes
in the product file is shown in table A.1 below. The attributes can only have values which are allowed by
UMARF.
Table A.1: Traceability of metadata to UMARF parameters
UMARF Short Name
Attribute Name
Notes
ASTI
GORT
LONS
LONE
LLAS
LLOS
LLAE
LLOE
LSVT
OCSA
OCLA
OCLO
OCTM
AIID
SMOD
SSBT
SSST
ABID
GNSP
RRCC
RRBT
RRST
PPRC
PPDT
PPST
GPLV
AVBA
AVPA
LMAP
LSCD
APXS
SNIT
AENV
GDMD
GPMD
APNM
APNA
SatelliteID
OrbitType
N/A
N/A
N/A
N/A
N/A
N/A
N/A
N/A
N/A
N/A
N/A
InstrumentID
N/A
SensingStartTime
SensingEndTime
N/A
N/A
N/A
N/A
N/A
ProcessingCentre
N/A
ProcessingTime
ProcessingLevel
BaseAlgorithmVersion
ProductAlgorithmVersion
Map Projection
N/A
N/A
ReferenceTime
N/A
Disposition Mode
ProcessingMode
ProductType
N/A
APPN
APAS
ParentProducts
Added by Archive
GNPO
GNPF
GNFV
QCCV
QQOV
QQAI
QDRC
QDRP
QDLC
QDLP
AARF
N/A
N/A
ProductFormatVersion
N/A
OverallQualityFlag
QualityInformation
DegradedRecordCount
DegradedRecordPercentage
MissingDataCount
MissingDataPercentage
Added by Archive
UUDT
GGTP
UDSP
N/A
GranuleType
N/A
Start Orbit Number
End Orbit Number
SubSatellitePointStartLat
SubSatellitePointStartLon
SubSatellitePointEndLat
SubSatellitePointEndLon
Ascending Node Crossing Date and Time
Occultation Satellite ID (TBC)
Occultation Latitude (TBC)
Occultation Longitude (TBC)
Occultation Date and Time (TBC)
InstrumentMode
Spectral Band IDs
Number of Spectral Bands
ReceivingCentre
Reception Start Date and Time
Ibid. End Date and Time
Processing Start Date and Time
Processing End Date and Time
SpatialCoverageModel
PixelSize
SourceEnvironment
Unique product identifier used in the O3M SAF archive; not included in the product
file, provided to UMARF by archive software
Product Actual Size; not included in the product file, provided to UMARF by archive
software
Native Pixel Order
ProductFormatType
Cloud Coverage
Archive Facility; not included in the product file, provided to UMARF by archive
software
Ingestion Date and Time
DispositionFlag, UMARF internal