1
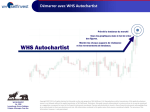
Autochartist™ Chart Patterns User Guide Contents Welcome to Autochartist™ Chart Patterns ................................................................................................. 2 Autochartist Chart Patterns Installation Instructions .................................................................................. 3 Logging in to Autochartist Chart Patterns ................................................................................................... 4 Explore the Interface ................................................................................................................................... 5 Standard Pattern View............................................................................................................................. 5 Create a Custom Standard Pattern Search .................................................................................................. 9 Advanced Search Options.......................................................................................................................... 12 Create a Custom Fibonacci Search......................................................................................................... 12 Advanced Fibonacci Search Options...................................................................................................... 15 View a Standard Pattern............................................................................................................................ 16 Autochartist – Standard Pattern Indicators (see image above)............................................................. 16 View and Analyze Forecast Regions for Standard Patterns ................................................................... 17 View a Fibonacci Pattern ........................................................................................................................... 19 Autochartist Fibonacci Pattern Indicators (see image above) ............................................................... 19 View and Analyze Forecasted Targets ................................................................................................... 20 Use Autochartist Chart Patterns to Place a Trade ..................................................................................... 21 Potential Trade Example #1 (Standard Pattern) .................................................................................... 21 Potential Trade Example #2 (Fibonacci) ................................................................................................ 22 Appendix 1: Pattern Recognition............................................................................................................... 24 Glossary of Terms ...................................................................................................................................... 28 Frequently Asked Questions...................................................................................................................... 30 CD04UK.073.120510 Welcome to Autochartist™ Chart Patterns Autochartist Chart Patterns scans markets across multiple timeframes to identify a variety of widely recognized chart patterns that have been time-‐tested to illustrate market trends and potential reversals of those trends. It then displays its findings in a quick-‐view matrix, giving you the opportunity to easily identify markets with emerging and completed patterns. Autochartist Chart Patterns also displays other valuable pattern information, which you can view collectively to quickly determine if the price pattern is providing a strong signal to place a trade. Not only does Autochartist Chart Patterns automatically identify price patterns such as flags, pennants, double-‐tops, double bottoms and triangles, it also identifies several Fibonacci-‐based patterns, including ABCD and three-‐drive. These are known as forward-‐looking indicators, typically offering higher-‐ probability trade opportunities. These patterns are based on time-‐tested technical analysis research to identify potential market entry and exit points as well as risk-‐management strategies. In addition to the Fibonacci-‐based patterns, Autochartist Chart Patterns offers three-‐point Fibonacci retracements and extensions, offering traders the opportunity to monitor potential Fibonacci patterns before they are identified. Fibonacci retracements and extensions are the building blocks used to identify Fibonacci patterns and forecast potential targets. This guide is intended to help you get started using Autochartist Chart Patterns as part of your overall trading strategy. CD04UK.073.120510 Autochartist Chart Patterns Installation Instructions You will receive an email that includes a link so you can download Autochartist Chart Patterns and your unique Autochartist login and account name. You’ll use these to install Autochartist Chart Patterns on your computer and log in. Note: Depending on your browser type and settings on your PC, a window may appear that enables you to save the download file to a specific folder. Save the Autochartist download to a file location where you can find it on your PC. You may even want to write down the file location. Downloading and Installing Autochartist Chart Patterns to your PC: 1. Open your preferred internet browser on your PC. 2. Use the link in your email to navigate to the Autochartist download. 3. Follow the instructions on the screen to download Autochartist Chart Patterns. Your browser may display a pop-‐up window, asking if you want to save the file. 4. Save the Autochartist setup.exe file to a file location where you can find it on your PC. 5. On your computer, navigate to the file location where you saved the Autochartist download. 6. Double-‐click the file and select Run. 7. Make sure the language you want is displayed. English is selected by default. When the language is selected, click OK. 8. When the Autochartist Setup Wizard appears, make sure all other applications are closed and click Next. 9. Use the scrollbar to review the disclaimer. When complete, click I Agree if you accept the terms of the agreement. 10. Make sure that the Autochartist application is being installed in the folder you want. By default, the location is C:\Program Files\Autochartist. If you want to change this, click in the Destination Folder field to type in a new location or click Browse to navigate to a new folder. When done, click Install. 11. Click Finish when complete. CD04UK.073.120510 Logging in to Autochartist Chart Patterns Once installed, you can use your login and account name to open Autochartist Chart Patterns. Logging in to Autochartist Chart Patterns: 1. Launch Autochartist Chart Patterns. If you used the default settings to install Autochartist Chart Patterns, click Start > All Programs > Autochartist and use the link in this folder to launch the application. 2. When the login window appears, enter your unique Autochartist login and account name. 3. Click Connect. For future logins, you may want to check the Connect Automatically box. This will save your credentials and allow the program to log-‐in automatically each time you start it. CD04UK.073.120510 Explore the Interface When you log in for the first time, the program displays the full list of complete and emerging standard patterns as well as the current Fibonacci-‐based patterns. Standard Pattern View 1 Complete Patterns: Shows a list of the most recent patterns with a breakout. The program defaults to the FX Majors 60 search, but you may create custom searches based on your own parameters. 2 Emerging Patterns: Shows a list of patterns which are forming, but are incomplete. No breakout has occurred. These patterns are meant to be used to enable the trader to be proactive, but should not be CD04UK.073.120510 used as a basis for trading until a breakout has occurred, and as always it’s best to use multiple tools in conjunction with each other. 3 Tool Bar: Contains buttons for creating a new search, deleting a search and editing a search. You can sort completed and emerging patterns by each of the column headings. For example, if you wanted to sort the completed patterns by quality, click the Quality heading and the chart will now be sorted from lowest quality to highest. To display from highest quality to lowest, click the heading again. When new patterns are found, Autochartist Chart Patterns sounds an alarm and displays an alert under your Windows® taskbar, which contains the number of new emerging and completed patterns detected. To view the new patterns, you can click the alert, or simply go to the main interface. New alerts appear on the matrix with a yellow starburst in the left column. IMPORTANT: Emerging patterns should never be used to develop a trading plan; only complete patterns, which have a breakout, can provide a market forecast. Autochartist Chart Patterns displays emerging patterns so traders can monitor market movements. CD04UK.073.120510 The Fibonacci Patterns tab has a slightly different appearance than the Standard Patterns interface. Fibonacci patterns do not appear as either emerging or completed. Instead, all identified patterns appear in one list. Because Autochartist does not identify Fibonacci patterns until they have reached their anticipated completion point, all Fibonacci patterns are considered completed. Additionally, the Volume, Uniformity and Initial Trend headers are not used, as they do not apply to these types of patterns. The column labeled Price Symmetry identifies how well the pattern fits with its ideal standards in terms of Fibonacci ratios. For example, with an ABCD pattern, ideally point C will be 61.8 or 78.6 percent of the AB line or “leg”. Price Symmetry measures how closely the identified pattern fits with that standard and others that apply to the other Fibonacci patterns. As with the standard patterns, you can sort the list by each of the column headings by clicking on the heading by which you wish to sort. For example, clicking on the Quality heading will sort the list by quality, from lowest to highest. Clicking the same heading again will sort the list by highest to lowest CD04UK.073.120510 quality. You can sort the columns located at the top from highest to lowest, including the symbol, interval, pattern, direction, time, etc. When new patterns are found, Autochartist Chart Patterns displays an alert under your windows taskbar, which contains the number of new emerging and completed patterns detected. To view the new patterns, you can click the alert, or simply go to the main interface. New alerts appear on the matrix with a yellow starburst in the left column. CD04UK.073.120510 Create a Custom Standard Pattern Search While the default setting for Autochartist Chart Patterns provides you with a scan of many types of price patterns over a wide range of time intervals, most traders prefer to start with a more basic setup. For example, your personal trading strategy may have you following one currency pair or just a few. In this instance, you wouldn’t want to be notified about patterns emerging for currency pairs you are not following. Similarly, if you tend to follow 30-‐minute or one-‐hour charts, you may not wish to be notified about emerging or completed patterns on the 15-‐minute charts. You can create customized searches using only the parameters you prefer to help you better focus the program to fit your personal strategy. For example, let’s say you want to focus your trading on the GBP/USD on a 30-‐minute chart. Creating a Custom Search for GBP/USD: 1. In the Autochartist Chart Patterns toolbar, click New Chart Pattern Search to open the Chart Pattern Search window. 2. In the Search Name field, enter a name for your search to help identify it (i.e., GBP/USD 30). 3. Select Symbols in the Search By box. CD04UK.073.120510 4. Under Exchange, select FOREX from the drop-‐down menu. 5. In the Symbol box, type GBP/USD and in the Interval menu, choose 30 minute. 6. Click button. 7. Click OK. to add the pair to your search. If you wish to cancel your search, click the Cancel Your new search appears as a tab at the top of the main window. To view your search, click the tab and your results will appear. Autochartist Chart Patterns will update your custom search each time new patterns emerge or are completed. You can also create searches that include multiple currency pairs and/or timeframes. For example, let’s say you wanted to see patterns for only the USD/JPY, EUR/JPY and GBP/JPY currency pairs. Furthermore, you wish to see only those emerging and completed patterns on the 60-‐minute chart. CD04UK.073.120510 Creating a Custom Search for USD/JPY, EUR/JPY and GBP/JPY Currency Pairs: 1. In Autochartist, click New Chart Pattern Search to open the Search Criteria window. 2. In the Search Name field, enter a name for your search to help identify it. 3. Select Symbols in the Search By box. 4. Under Exchange, select FOREX from the drop-‐down menu. 5. In the Symbol box, type USD/JPY and in the Interval menu, choose 60 minute. 6. Click 7. Repeat steps 4 and 5 to add the EUR/JPY and GBP/JPY symbols. to add the pair to your search. 8. Click OK. To display multiple timeframes in one search, simply follow the steps above again, but this time, choose another timeframe under the Interval menu. CD04UK.073.120510 Advanced Search Options You can further clarify your searches using the tabs at the bottom of the Chart Pattern Search window. Under the Characteristics tab, you can specify pattern directions, trend changes and the minimum pattern length. The Patterns tab enables you to specify only the patterns you wish to follow. Under the Quality tab, you can use the sliders to adjust the minimum Clarity, Uniformity, Initial Trend, Breakout Strength, Volume Increase and Overall Quality. Those adjustments can be especially helpful because each of those criteria is used by Autochartist to grade each pattern breakout for its potential to reach the forecast zone. By adjusting the minimums to search for higher quality patterns, you can eliminate notifications for breakouts with lower quality scores. It’s important to note, though, that higher pattern quality scores do not guarantee that a breakout will reach the forecast zone. All forecast prices should be confirmed using your own price level analysis. You can edit a custom search at any time by right-‐clicking on the tab and choosing Properties. You can delete a custom search by right-‐clicking on the search tab and selecting Delete. Create a Custom Fibonacci Search Creating a Custom Fibonacci Search for GBP/USD: 1. In Autochartist, click New Fibonacci Pattern Search to open the Fibonacci Pattern Search window. CD04UK.073.120510 2. In the Search Name box, enter a name for your search to help identify it (i.e., GBP/USD 30). 3. Select Symbols in the Search By box. 4. Under Exchange, select FOREX from the drop-‐down menu. 5. In the Symbol box, type GBP/USD and in the Interval menu, choose 30 minute. CD04UK.073.120510 6. Click 7. Click OK. to add the pair to your search. Your new search appears as a tab at the top of the main window. To view your search, click the tab and your results will appear. Autochartist Chart Patterns will update your custom search each time new patterns emerge or are completed. You can also create searches that include multiple currency pairs and/or timeframes. For example, let’s say you wanted to see patterns for only the USD/JPY, EUR/JPY and GBP/JPY currency pairs. Furthermore, you wish to see only those emerging and completed patterns on the 60-‐minute chart. Creating a Custom Fibonacci Pattern Search for USD/JPY, EUR/JPY and GBP/JPY Currency Pairs: 1. In Autochartist, click New Fibonacci Pattern Search to open the Fibonacci Pattern Search window. 2. In the Search Name box, enter a name for your search to help identify it. 3. Select Symbols in the Search By box. 4. Under Exchange, select FOREX from the drop-‐down menu. 5. In the Symbol box, type USD/JPY and in the Interval menu, choose 60 minute. 6. Click 7. Repeat steps 4 and 5 to add the EUR/JPY and GBP/JPY symbols. CD04UK.073.120510 to add the pair to your search. 8. Click OK. To display multiple timeframes in one search, simply follow the steps above again, but this time, choose another timeframe under the Interval menu. Advanced Fibonacci Search Options You can further clarify your searches using the tabs at the bottom of the Fibonacci Pattern Search window. Under the Characteristics tab, you can specify pattern directions and the minimum pattern length. Under the Quality tab, you can use the sliders to adjust the minimum Price Symmetry, Clarity and Overall Quality. By adjusting the minimums to search for higher quality patterns, you can help eliminate notifications for patterns with lower-‐quality scores. It’s important to note, though, that higher pattern quality scores do not guarantee that a pattern is valid or that the market will react as forecasted. All forecast prices should be confirmed using your own price level analysis. You can edit a custom search at any time by right-‐clicking on the tab and choosing Properties. You can delete a custom search by right-‐clicking on the search tab and selecting Delete. CD04UK.073.120510 View a Standard Pattern To view a completed or emerging chart pattern, double-‐click the row in the pattern matrix. The pattern will appear in a separate window, along with a number of pattern indicators and quality ratings. The Pattern Display shows the currency chart with current pattern detected (A). If the market changes and the trend no longer fits the shape of the pattern that was initially anticipated, Autochartist Chart Patterns displays a message indicating that the pattern is no longer valid. Autochartist Pattern Indicators (B) provide data about the strength of the pattern, as well as the type, size, and direction. Autochartist – Standard Pattern Indicators (see image above) 1. Exchange – The type of instrument you are trading. 2. Symbol – The instrument for which the pattern was found. 3. Interval – Time interval of the data on which the pattern was identified. If all patterns in your search were identified on the same interval, this column will be hidden. 4. Pattern– The type of pattern identified. 5. Pattern End – The date and time at which the pattern broke through either the support or resistance line. Note: Date is shown as day/month. 6. Trend Change– This is either a continuation or reversal. 7. Length – Length of the pattern. This is the amount of time that a pattern took to develop for that specific time frame. For example, a pattern length of 30 found on 60-‐minute interval would CD04UK.073.120510 mean that the pattern was formed over 30 hours. Generally, the longer the pattern, the more reliable it may be. 8. Direction – Direction in which the breakout occurred. An up arrow means the price broke through the resistance line. A down arrow means the price broke through the support line. In the case of emerging patterns, blank arrows (up or down) are used to indicate the anticipated breakout direction. 9. Quality – The average of all the other pattern indicators, offering an overall quality score. 10. Initial Trend – Quality of the trend preceding the pattern formation. A longer, steadier initial trend is an important component of a high-‐quality pattern. 11. Uniformity – How uniformly spaced the price turning points are that touch the support or resistance lines. Generally, the more uniform the turning points, the better the trend. 12. Clarity – The number of random price movements during the formation of the pattern. The less random price movements, the better the clarity score. 13. Breakout – The decisiveness with which the price broke through the support or resistance line. This quality measure is irrelevant for emerging patterns. 14. Volume – The relative amount of increase in the trading volume at the time of breakout through the support or resistance line. This quality measure is irrelevant for emerging patterns. This characteristic is only relevant to exchange-‐traded instruments, such as stocks or futures. 15. Forecast To/Forecast From -‐ The highest and lowest price levels in the forecast range of a completed pattern. View and Analyze Forecast Regions for Standard Patterns Autochartist Chart Patterns does not offer recommendations as to market entry and exit points, but based on its assessment of the various quality indicators, it does forecast target price regions when a breakout has occurred. When viewing a standard pattern, the price forecast region appears as a grey area on the chart. These regions, when combined with your own pricing analysis, may be used to determine a general idea of where you may wish to exit the market and collect any potential profits. CD04UK.073.120510 Market entry points should be determined using your own technical analysis as part of your regular trading strategy. Because forecast regions represent possible market movements, they should not be considered 100% accurate. Depending on the pattern, instrument, timeframe and market conditions, the forecast region may be as small as a few pips wide or as large as 10, 20 or even 100 pips or more. Furthermore, many factors affect market movements, so it is always possible that the market may not reach the forecasted region. Remember, Autochartist Chart Patterns does not offer recommendations or suggestions as to possible stop and limit order placement. Stops, limits and other risk management criteria should be determined by each trader as part of a comprehensive trading strategy. CD04UK.073.120510 View a Fibonacci Pattern To view a Fibonacci pattern, double-‐click on the row in the Fibonacci pattern matrix. Similar to standard patterns, the Fibonacci pattern will appear in a separate window, along with a number of pattern indicators and quality ratings. The Pattern Display shows the chart with the current pattern detected (A). If the market changes and the pattern are invalidated, Autochartist Chart Patterns will display a message indicating that the pattern is no longer valid. Autochartist Pattern Indicators(B) provide data about the strength and quality of the pattern, as well as the type and potential direction. Autochartist Fibonacci Pattern Indicators (see image above) 1. Exchange — The type of instrument you are trading. 2. Symbol — The instrument for which the pattern was found. 3. Interval — Time interval of the data on which the pattern was identified. If all patterns in your search were identified on the same interval (i.e., 30 minutes), this column will be hidden. 4. Pattern — The type of pattern identified. 5. Pattern End — The date and time at which the pattern reached its completion. Note: The date is shown as day/month. 6. Length — The amount of time that a pattern took to develop for that specific timeframe. For example, a pattern length of 30 found on a 60-‐minute interval would mean that the pattern was formed over 30 hours. 7. Direction — Direction in which the market is forecasted to move following the pattern’s end. 8. Quality — The average of all the other pattern indicators, offering an overall quality score. Note: A higher quality score does not guarantee that the market will behave as forecasted. 9. Time Symmetry — Identifies how well the pattern fits with its ideal standards in terms of timing. CD04UK.073.120510 10. Price Symmetry — Identifies how well the pattern fits with its ideal standards in terms of Fibonacci ratios. 11. Clarity — The number of random price movements during the pattern’s formation. The fewer price movements, the better the clarity score. 12. Targets — Indicate price targets determined by the Fibonacci retracements/extensions shown on the pattern chart. These are the levels Autochartist uses to determine where the market may move following pattern completion. View and Analyze Forecasted Targets Autochartist Chart Patterns does not offer recommendations as to market entry and exit points, but based on its assessment of the various quality indicators, it does forecast target prices, based on Fibonacci retracements and extensions, when a Fibonacci pattern has completed. When viewing the pattern, the price targets appear as both a Fibonacci retracement/extension on the chart and as price targets in the pattern indicators. When combined with your own pricing analysis, these targets may be used to determine a general idea of where you may wish to exit the market and collect any potential profits. Because target forecasts represent potential market movements, they should not be considered to be a “sure thing.” Many factors affect market movements, so it is always possible that the market may not react as forecasted. Remember, Autochartist Chart Patterns does not offer recommendations as to possible stop and limit order placement. Stops, limits and other risk management criteria should be determined by each trader as part of a comprehensive trading strategy. CD04UK.073.120510 Use Autochartist Chart Patterns to Place a Trade It’s important to understand that Autochartist Chart Patterns is not a trading strategy. It does not offer buy or sell signals and it does not recommend entry or exit points. However, when its advanced pattern recognition capabilities are combined with your own technical price analysis, it can be an excellent way to confirm or enhance your trade decisions. The examples below are for illustration purposes only and should not be interpreted as recommended strategies or suggestions for placing trades. Potential Trade Example #1 (Standard Pattern) Autochartist Chart Patterns alerts you that a completed pattern has occurred for the EUR/CHF currency pair on the 15-‐minute chart. You identify the new alert by the yellow starburst in the left-‐hand column and double-‐click on the pair’s line in the matrix to open the pattern. According to the program’s analysis, the forecasted region for the breakout is somewhere between 1.6210 and 1.6230 from its current price of 1.6199. After further examination of the pattern analysis provided by Autochartist, you note that the overall quality of the pattern is good and that the breakout appears to be relatively strong. CD04UK.073.120510 Looking at the pair’s 15-‐minute chart in your trading platform, you can apply a Fibonacci retracement* and discover that 1.6225 is a likely point of resistance. The Slow Stochastics indicator* also confirms that the pair appears to be moving to an upswing. Given that your technical analysis seems to confirm Autochartist’s assessment, you may decide to go long on the EUR/CHF. To place your order, click New Order in the menu at the top of your trading platform. In the window that appears, EUR/CHF as your currency pair. Your trading platform allows you to place an entire trade, including stops and limits, in one step with a parent & contingent (P&C) order. Choose Parent & Contingent as the order type. From your Fibonacci analysis, after choosing your stop level for risk management, you set your limit for 1.6220. Under this scenario, if the market moves in your favor, you will be set to collect potential profits at 1.6220, but with a stop in place, you are also protected from significant losses should the market fail to move in a favorable direction. Potential Trade Example #2 (Fibonacci) Autochartist Chart Patterns issues an alert that a new Fibonacci pattern has been identified for the EUR/JPY on the 60-‐minute chart. Opening the chart, you noticed that the overall quality of the pattern appears to be moderate, but the clarity appears to be relatively high. When you open your trading platform software, you’ll note that on the two-‐hour chart, the pair appears to be nearing an important support level. The MACD indicator also appears to be indicating a potential reversal. Based on your further analysis, you decide to enter the market. To place your order, click New Order in the menu at the top of your trading platform. In the window that appears, select EUR/JPY as your currency pair. You can place your entire trade, including stops and limits, in one step with a parent & contingent (P&C) order. Choose Parent & Contingent as the order CD04UK.073.120510 type. Based on your analysis, you decide to enter with a market order. After choosing your stop level for risk management, you set your limit for 132.15, or the 1.272 Fibonacci extension. Under this scenario, if the market moves in your favor, you will be set to collect potential profits at 132.15, but with a stop in place, you are also protected from significant losses should the market fail to move in a favorable direction. Note: The preceding information is not a recommendation to follow a particular trading strategy and is intended to show only how Autochartist Chart Patterns may be used to determine potential trades. Each trade should be considered carefully as to how it fits with your individual trading strategy, including risk tolerance. CD04UK.073.120510 Appendix 1: Pattern Recognition By default, Autochartist Chart Patterns searches for the following patterns: Fibonacci-Based Patterns Pattern Type ABCD What is it? Why is it important? How do I find it? Suggests a potential market reversal. The ABCD pattern comprises three consecutive price swings or trends. Resembles a lightning bolt on a chart. Helps identify potential buying and selling opportunities in nearly any market over nearly any timeframe. All other Fibonacci patterns are based on (or include) this pattern. May provide a stronger trade signal when it converges with other patterns. Each turning point (A, B, C, and D) represents a significant high or significant low on a price chart. These points define three consecutive price swings, or trends, which make up each of the three pattern “legs.” These are referred to as the AB leg, the BC leg, and the CD leg. Suggests a potential market reversal. Formed by three consecutive symmetrical mountain tops (bearish) or three consecutive symmetrical valleys (bullish) – Contains two connecting (intertwined) bearish ABCD patterns – Also contains a bearish butterfly pattern (completing at the third drive). Suggests the market may be at its most bullish or bearish, in which a more significant correction may occur. May offer an excellent risk-‐to-‐reward ratio. Pattern failure suggests a strong continuation may be in progress. Price and time symmetry are key, so the pattern should really stand out as three distinct, symmetrical drives to a top or bottom. Traders should remember that this pattern is typically less common. Three-‐Drive STANDARD PATTERNS Pattern Type Head and Shoulders Physical Characteristics When does it form? What does it indicate? Three successive peaks: middle being the highest and two outside being lower and relatively equal in height. Often signals an upcoming trend reversal. Inverse Head and Shoulders CD04UK.073.120510 After an uptrend. Three successive peaks: middle being the lowest and two outside being higher and relatively equal in height. Rectangles After a downtrend. A horizontal trading range During a pause in a trend. with two comparable highs and two comparable lows which can be connected to form two parallel lines that comprise a rectangle. Often signals an upcoming trend reversal. A consolidation zone or trading range. Channels A trading range between diagonal parallel lines. When an up or downtrend is formed between parallel support and resistance lines. Small rectangle trading range between diagonal parallel lines; short term. Typically following a sharp Often indicates a small advance or decline. change in direction before the previous trend resumes. A small symmetrical triangle that converges. Typically following a sharp Often indicates a small advance or decline. change in direction before the previous trend resumes. Sideways pattern with two converging trend lines. When an upper trend line is declining and a lower trend line is rising. Possibly either a reversal in the trend or a change in the slope of the current trend. Flags Pennants Symmetrical Triangles Ascending Triangles CD04UK.073.120510 Often represents a relatively even balance between buyers and sellers and may indicate the continuation of a previous trend. Two or more equal highs form a horizontal line at the top; two or more rising troughs form an ascending line that meets the horizontal line. During an uptrend. Often represents a continuation pattern if an established trend exists. Two or more equal lows form a horizontal line at the bottom; two or more declining peaks form a descending line that meets the horizontal line. During a downtrend. Often represents a continuation pattern if an established trend exists. Two converging lines slanted upward (rising wedge) or downward (falling wedge). During an uptrend or a downtrend. Often represents a continuation of the original trend. Two converging lines slanted upward (rising wedge) or downward (falling wedge). After an uptrend or a downtrend. Often represents a reversal in the original trend. Two consecutive, roughly equal peaks with a moderate trough in between. A major reversal pattern, it occurs after an extended uptrend. Often represents a reversal pattern that indicates a minor, if not long term, change from an uptrend to a downtrend. Descending Triangles Wedge Continuation Wedge Reversal Double Top Double Bottom CD04UK.073.120510 Two consecutive, roughly equal troughs with a moderate peak in between. Two consecutive, roughly equal troughs with a moderate peak in between. Often represents a reversal pattern that indicates a minor, if not long term, change from a downtrend to an uptrend. Three consecutive, roughly equal peaks; may at first resemble a double top. A major reversal pattern, it occurs after an extended uptrend. Often represents a reversal pattern that indicates a minor, if not long term, change from an uptrend to a downtrend. Three consecutive, roughly equal troughs; may at first resemble a double bottom. A major reversal pattern, it occurs after an extended downtrend. Often represents a reversal pattern that indicates a minor, if not long term, change from a downtrend to an uptrend. Triple Top Triple Bottoms CD04UK.073.120510 Glossary of Terms Breakout: A breakout occurs when price movement breaks the support or resistance provided by a current trend line. Autochartist Chart Patterns offers ratings of breakouts based on their strength. Completed Pattern: A pattern identified by Autochartist Chart Patterns where a breakout has occurred. Viewing a completed pattern will display Autochartist’s forecast of price movement. Currency Pair: Forex trading is the simultaneous buying and selling of currencies based on their value in relation to other currencies. Unlike many other types of trading, forex is always traded (and quoted) in pairs. When you buy one currency, you are selling another and vice versa. DiNapoli MACD: One of the DiNapoli D-‐Levels™ tools. The DiNapoli MACD enables traders to gauge market momentum and possible reversal points. Emerging Pattern: A pattern identified by Autochartist Chart Patterns where a breakout has not occurred. Traders should use emerging patterns only as hints as to where a market may be moving, not as the basis for placing a trade. Fibonacci Extensions: A very popular tool among traders whose strategies are based on technical analysis. Like Fibonacci retracements, Fibonacci extensions are derived from mathematical relationships based on ratios, the most important of which are 23.6%, 38.2%, 50%, 61.8% and 100%. They are used to help determine where a current move or trend may end. Fibonacci retracement: A very popular tool among traders whose strategies are based on technical analysis. Fibonacci retracements are derived from mathematical relationships based on ratios, the most important of which are 23.6%, 38.2%, 50%, 61.8% and 100%. A Fibonacci retracement is created by taking two extreme points on a chart (usually a peak and trough) and dividing the distance by those key ratios. Instrument: The financial instrument you are monitoring. This could be a currency pair, index, equity or other derivative instrument. Leg: One of the price movements in the ABCD pattern. A leg may be the line from point A to B, B to C, or C to D. Pattern: A pattern is the distinctive formation created by the movement of prices on a chart, identified by a line connecting common price points (closing prices, highs, lows) over a period of time. Autochartist Chart Patterns searches for and identifies 15 of the most common types of chart patterns. Range Trading: When a currency pair bounces repeatedly between relatively close support and resistance levels, it is said to be range-‐trading. Resistance Level: The price level at which, historically, a financial instrument has had difficulty trading above. Traders may use resistance levels to help determine entry or exit points. Slow Stochastics: A technical indicator that calculates the location of a current price in relation to its range over a period of bars, which may confirm price movement and help identify possible turning points. Support Level: The price level which, historically, a financial instrument has had difficulty falling below. Traders may use support levels to help determine entry or exit points. Target price range: The price levels that Autochartist Chart Patterns forecasts after a pattern is completed. CD04UK.073.120510 Technical analysis: The study of market movements based on past prices, patterns and trends in an attempt to forecast future prices, patterns and trends. Technical analysis varies between traders, but typically involves a number of pricing and timing indicators to determine the best prices and times to place high-‐probability trades. CD04UK.073.120510 Frequently Asked Questions Does the Autochartist Chart Patterns application tell me when to place a trade? No. Autochartist Chart Patterns examines chart movements to identify patterns that may provide insight into possible future market movements and price targets. Autochartist Chart Patterns forecasts should be combined with your own technical analysis to determine potential entry and exit points. When I view an emerging pattern, why is there no target price range indicated? An emerging pattern is one in which no price breakout has occurred, so Autochartist Chart Patterns is unable to forecast a potential price target range. Emerging patterns are displayed to enable traders to be more proactive by preparing for potential upcoming trades. Only completed patterns should be used to help determine possible trades. Will Autochartist Chart Patterns use a lot of my system resources? No. The amount of data that Autochartist Chart Patterns must examine requires more computing power than is available on a single personal computer, so all of the analysis is done on a series of powerful servers and then delivered to your personal computer via your Internet connection. I placed a trade using a completed pattern’s target price range, but the instrument failed to trade to that range. Why did this happen? As with any technical tool, Autochartist Chart Patterns cannot predict where the market will move, nor will it be correct 100% of the time. It offers forecasts of possible price movements based on emerging and completed patterns and the way those patterns have typically behaved in past markets. Many factors affect market movements, including financial news and human psychology. That is why it is extremely important to use Autochartist Chart Patterns as part of a comprehensive trading strategy, including multiple forms of technical analysis to confirm or enhance the program’s analysis. All potential trades should be weighed in terms of how it fits with your personal trading strategy, including risk appetite. What is the file size of the Autochartist Chart Patterns download? The Autochartist Chart Patterns download is 4.9 MB. CD04UK.073.120510