1
FEARLUS
Model 1-1-5
Bill Adam, Alessandro Gimona,
Nick Gotts, Luis Izquierdo
Alistair Law, Gary Polhill
Lee-Ann Sutherland
Dawn Parker
Macaulay Institute
Center for Social Complexity
Craigiebuckler, Aberdeen AB15 8QH
United Kingdom
George Mason University, Fairfax, VA
United States of America
Paulina Hetman,
Piotr Magnuszewski
Pete Edwards
Edoardo Pignotti, Alun Preece
Institute of Physics
Computing Science
Wrocław University of Technology,
50-370 Wrocław, Poland
University of Aberdeen, Aberdeen
AB24 3UE United Kingdom
Ben Davies
Aberdeen Business School
University of Aberdeen, Aberdeen
AB24 3QY United Kingdom
User Guide
by Gary Polhill, Nick Gotts & Luis Izquierdo
Contents
1 INTRODUCTION
1 2 INSTALLATION
1 3 SYNOPSIS AND COMMAND-LINE OPTIONS
2 3.1 Controlling the seed and random number generator
2 3.2 Controlling the (text) output
3.2.1 Debugging output
3.2.2 OWL ontology output
3.2.3 Report output
3 3 4 5 3.3 Interaction with the grid
5 3.4 Summary
6 4 ONTOLOGY
6 4.1 Environment
4.1.1 Land Cells and Land Parcels
4.1.2 Climate and Economy
4.1.3 Land Uses
7 7 11 11 4.2 Land Managers
4.2.1 Land Use decision making
4.2.2 Income generation
4.2.3 Social approval and disapproval
4.2.4 Land Parcel transfer: ELMM0-2
12 13 29 31 32 4.3 The Government Agent
4.3.1 Government classes implementing a reward for Land Uses
4.3.2 Government classes issuing limited rewards for Land Uses
4.3.3 Reward for Land Uses with a target coverage
4.3.4 Reward Land Uses in a contiguous cluster
4.3.5 Reward Land Uses in a cluster with a target coverage
4.3.6 Government classes aimed at controlling pollution
35 36 37 38 39 41 42 4.4 Schedule
4.4.1 Initial schedule
4.4.2 Main schedule
43 43 44 5 PARAMETER FILES
5.1 Model parameters
5.1.1 Model file
5.1.2 Climate and Economy change probability files
5.1.3 Subpopulation contest file
5.1.4 Subpopulation file
5.1.5 Strategy selector file
5.1.6 Events file
5.1.7 Trigger file
44 45 45 48 49 50 58 58 59 5.1.8 Land Use file
5.1.9 Climate and Economy files
5.1.10 Farm Scale Fixed Cost file
5.1.11 Yield and Income symbol tree files
5.1.12 Yield and Income lookup table files
5.1.13 Grid file
5.1.14 Government file
5.2 Observation parameters
5.2.1 Report configuration file
5.2.2 Observer file
59 59 60 60 61 61 63 64 64 66 6 BATCH MODE
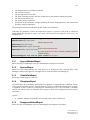
69 7 GUI MODE
70 7.1 Social system displays
7.1.1 Subpopulation displays
7.1.2 Land Manager displays
7.1.3 Land Market displays
72 72 77 79 7.2 Environment displays
7.2.1 Land Use displays
7.2.2 Land Parcel display
81 81 84 7.3 84 8 Debugging displays
OUTPUT
85 8.1 Reports
8.1.1 ApprovalNetworkReport
8.1.2 ApprovalReport
8.1.3 ClimateStateReport
8.1.4 ClumpinessReport
8.1.5 DisapprovalNetworkReport
8.1.6 EconomyStateReport
8.1.7 LandManagerGridFileReport
8.1.8 LandUseGridFileReport
8.1.9 LandUseReport
8.1.10 LandUseStateReport
8.1.11 LockInReport
8.1.12 MeanSubPopParamParcelReport
8.1.13 NetworkDistributionReport
8.1.14 NetworkMatrixReport
8.1.15 NetworkStatisticsReport
8.1.16 ParcelLandManagerReport
8.1.17 ParcelStateReport
8.1.18 ParcelSubPopReport
8.1.19 PollutionGridFileReport
8.1.20 PollutionReport
8.1.21 SpatialAutocorrelationReport
8.1.22 SubPopDeathReport
8.1.23 SubPopulationGridFileReport
8.1.24 TimeSeriesReport
8.1.25 WealthGridFileReport
8.1.26 YieldGridFileReport
85 86 86 86 86 86 87 87 87 87 87 87 87 87 88 88 88 88 88 88 89 89 89 89 89 90 90 8.2 91 Verbosity
8.2.1 8.2.2 8.2.3 8.2.4 8.2.5 8.2.6 8.2.7 8.2.8 8.2.9 8.2.10 8.2.11 8.2.12 8.2.13 8.2.14 8.2.15 8.2.16 8.2.17 8.2.18 8.2.19 8.2.20 8.2.21 8.2.22 8.2.23 8.2.24 8.2.25 8.2.26 8.2.27 8.2.28 8.2.29 8.2.30 8.2.31 8.2.32 8.2.33 8.2.34 8.2.35 8.2.36 8.2.37 8.2.38 8.2.39 8.2.40 8.2.41 8.2.42 8.2.43 8.2.44 8.2.45 8.2.46 8.3 9 Approval
CaseBase
CaseBaseDetail
Climate
Clumping
ClumpingDetail
ClumpingMinutiae
Decision
DecisionAlgorithm
DecisionAlgorithmDetail
Economy
FarmScaleFixedCosts
Government
GovernmentDetail
GovernmentFines/GovernmentRewards
GridFile
GridLayers
GUI
GUIKey
GUINeighbourhoodDetail
Harvest
Imitation
InitialLandUseAllocations
LandManagerChange
LandManagerCreation
LandManagerCreationDetail
LandManagerDestruction
LandParcelCreation
LandUseChange
LandUseCreation
LandUseMatch
LandUseMatchDetail
Learning
LookupTable
LookupTableLookups
Neighbourhood
NeighbourhoodDetail
Parameters
ParcelTransfers
ParcelTransfersDetail
Pollution
PollutionDetail
StrategyDetail
SubpopulationCreation and SubpopulationCreationDetail
Yield
YieldDetail
Ontology
STRATEGIES
9.1 Strategies following the ImitativeStrategy Protocol
9.1.1 Habit
9.1.2 Random Copying
9.1.3 Simple Copying
9.1.4 Simple Physical Copying
9.1.5 Yield Average Weighted Temporal Copying
9.1.6 Yield Random Optimum Temporal Copying
9.1.7 Yield Weighted Copying
91 91 91 92 92 92 92 92 93 93 94 94 94 94 95 95 95 96 96 96 97 98 98 99 99 99 99 100 100 100 100 100 100 101 101 101 102 103 104 104 105 105 105 105 106 106 106 108 108 108 108 109 109 109 109 109 9.1.8 Yield Weighted Temporal Copying
9.2 Strategies following the NonImitativeStrategy Protocol
9.2.1 Eccentric Specialist
9.2.2 Fickle
9.2.3 Grid File
9.2.4 Random
110 110 110 110 110 111 10 EVENTS
111 10.1 BadHarvestEvent
111 10.2 DisapprovalProportionEvent
111 10.3 HighWealthEvent
111 10.4 LandParcelSoldEvent
111 10.5 NeighbourDisapprovalEvent
111 10.6 NetLossEvent
111 10.7 NoRewardEvent
111 10.8 ThresholdDisapprovalEvent
112 11 TRIGGERS
11.1 AllLowPollutionTrigger
112 11.2 LandUseGroupTrigger
112 11.3 NeighbourPollutionTrigger
112 11.4 ThresholdPollutionTrigger
112 11.5 WorseLUThanMeTrigger
112 12 BIBLIOGRAPHY
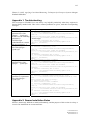
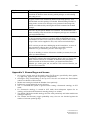
112 113 APPENDIX 1: TROUBLESHOOTING
115 APPENDIX 2: SWARM INSTALLATION NOTES
115 APPENDIX 3: KNOWN BUGS AND ISSUES
116 1
1
Introduction
This document outlines the usage of the FEARLUS model1-1-5 agent-based model of land-use
change. FEARLUS was developed at the Macaulay Institute by Nick Gotts, Alistair Law, and
Gary Polhill with contributions from Lee-Ann Sutherland, Luis Izquierdo and Bill Adam, whilst
ELMM, an additional component to simulate land markets was developed by Nick Gotts and
Gary Polhill, together with Dawn Parker from George Mason University. Various government
classes were developed in collaboration with Alessandro Gimona at the Macaulay Institute, and
Ben Davies at the University of Aberdeen Business School. Ontology features were developed in
collaboration with Pete Edwards, Edoardo Pignotti and Alun Preece at the University of
Aberdeen. (Alun has since moved to Cardiff University.) Reports on networks, time series and
spatial autocorrelation were developed in collaboration with Paulina Hetman and Piotr
Magnuszewski from Wrocław University of Technology. Model 1-1-5 is a discrete-event,
spatially explicit agent-based model of land use change, released under the GNU General Public
Licence.
Note that the FEARLUS software distribution now comes with an integrated species
metapopulation model (Stochastic Patch Occupancy Model, or SPOM), developed independently.
This manual does not cover the compilation or use of the SPOM or the integrated
FEARLUS+SPOM model.
The code is written in Objective-C, and is known to work with Swarm version 2.2 on a PC
running Windows XP or Vista, with Swarm 2.2 on a Sun running Solaris 8, with Paul Johnson’s
Swarm Linux RPMs on Fedora Core 6, with Swarm CVS extracted on 2006-06-12 configured
without the GUI on a Sun running Solaris 8 and a x86_64 Redhat enterprise Linux box, and using
a CVS-extracted version of Swarm on a SUSE Linux x84_64 box. Compilation on Mac OS-X
(Leopard) has also been successfully achieved with a version of Swarm extracted from CVS on
2008-04-09.
2
Installation
Before installing FEARLUS, make sure you have an appropriate version of Swarm installed on
your platform. Versions 2.2, 2.2.3 and CVS downloads of Swarm have been used. Your shell
environment should have the SWARMHOME environment variable set to the location of your
Swarm installation (often /usr if you have accepted default installation options for Swarm). You
make also find that to avoid some local settings in the Makefile, you need to set the
SWARMDATE environment variable (it doesn’t particularly matter what). Installation of
FEARLUS model 1-1-5 then involves unpacking the gzipped tar file, and compiling the source
code therein from a terminal window in Unix, or the Swarm >> Terminal application in
Windows:
gunzip –c FEARLUS-model1-1-5.tar.gz | tar xf –
cd model1-1-5
make fearlus
If the file fearlus.verby is not included in the distribution, you can build it with the following
command:
make –F Makefile-all fearlus.verby
The application should compile successfully without error (though some warnings may be
created, depending on which version of gcc you are using), creating the executable model1-1-5 on
a Unix platform, or model1-1-5.exe on Windows.
Created 2008-04-04
Modified 2008-04-18
Printed 2008-04-18
2
3
Synopsis and command-line options
In the synopsis below, curly brackets { } are used to denote one of a series of options separated by
a vertical bar | for an element value, square brackets [ ] are used to denote an optional element,
and angle brackets < > to describe some value the user should provide. Greyed out options denote
elements that are either deprecated or ignored.
fearlus-1.1.5
[-s]
[-S
<seed>]
[-X
<{seed|TIME|DEFAULT}>]
[-Z <{seed|TIME}>] [-n <RNG class>] [-b] [-m <mode>] [-t] [-v]
[-R <report configuration file> [-r <report output file> [-a]]]
[-D
<verbosity
specification>]
[-o
<observer
file>]
[-O <ontology file> [-U <ontology URI>] [-C <ontology class>]
[-A]]
[-G <grid URL> -g <grid user ID> -H <grid description> -j <grid
client java path>]
[–p <parameter file>]
fearlus-1.1.5 {--help|–?}
fearlus-1.1.5 –w
fearlus-1.1.5 -c
Though the option –p, to specify the parameter file, is denoted as optional above, the only cases in
which you would not give this option are when running model1-1-5 with the –O and –C options
to create an ontology of the model1-1-5 modelling framework, or when using the ––help, –w or –
c options to get a brief command line synopsis, a statement of (no) warranty, and conditions of
use respectively. The other most commonly used flag is the –b flag, which is used to specify a
batch mode run rather than the default GUI mode run. Batch mode is faster than GUI mode, and
suitable for running as a background process, but is typically used in conjunction with the –R and
–r options to obtain some output. If you are using GUI mode, then the –o option is strongly
recommended, as otherwise a very large number of windows are potentially generated. (If you
configured Swarm with the ––disable-gui option, then for obvious reasons, GUI mode will not be
available.)
The other command line options are explained below.
3.1
Controlling the seed and random number generator
A number of options are provided for controlling the seed. Beyond version 2.1.1, the Swarm
libraries have the default options –s and –S <seed> to do this. The option –X
<{<seed>|TIME|DEFAULT}> applies to FEARLUS models compiled with versions 2.1.1 and
earlier of Swarm that did not have the same flexibility in determining the seed. The –s option uses
the current time to determine the seed value to use. The –S option allows the user to specify a 32bit integer to use as seed. It is recommended that these two options be used rather than –X where
possible, but on a PC with version 2.1.1 of Swarm, use –X <seed> to get the same behaviour as –
S <seed> in later versions of Swarm. * Optionally, you can specify a second seed for use after the
initialisation schedule has completed (see section 4.4.1) using the –Z <{<seed>|TIME}> option.
This allows comparison between models with identical initial conditions. The seed specified
using the –X, –s, or –S options is used for the initialisation schedule, and the seed specified using
–Z is used thereafter.
Swarm provides several classes of pseudo-random number generator, and if you want to try using
a non-default generator (the default is MT19937gen), the –n option has been provided for you to
specify any of the Swarm library classes conforming to the SimpleRandomGenerator protocol. At
the time of writing, these classes are ACGgen, C2MRG3gen, C2TAUS1gen, C2TAUS2gen,
C2TAUS3gen, C3MWCgen, LCG1gen, LCG2gen, LCG3gen, MRG5gen, MRG6gen, MRG7gen,
*
Note that model1-1-5 has not been tested by the developers with Swarm 2.1.1 on a PC.
Created 2008-04-04
Modified 2008-04-18
Printed 2008-04-18
3
MWCAgen, MWCBgen, PMMLCG1gen, PMMLCG2gen, PMMLCG3gen, PMMLCG4gen,
PMMLCG5gen, PMMLCG6gen, PMMLCG7gen, PMMLCG8gen, PMMLCG9gen, PSWBgen,
RWC2gen, RWC8gen, SCGgen, SWB1gen, SWB2gen, SWB3gen, TT403gen, TT775gen, and
TT800gen. Not all of these classes are recommended for use. Consult the Swarm documentation
for more information.
In addition to the Swarm random number generator classes, if you have a QuantisTM quantum
random number generator device (see http://www.idquantique.com/products/quantis.htm),
FEARLUS provides the QRNGgen class for you to use. To compile it, you should set your
QUANTIS_HOME environment variable to the directory where header and library files can be
found for your device. If the header and library files are in different directories, you can also
specify one or both of QUANTIS_INCLUDE_HOME and QUANTIS_LIB_HOME in your
environment. If the library to pick up for your device is not called libquantis-usb.a (or libquantisusb.so), you should use the QUANTIS_LIB environment variable to specify the argument to the
linker in the –l compilation flag.
3.2
Controlling the (text) output
There are three forms of text output that the FEARLUS model can generate: debugging output,
ontology output and report output. These output options, which are not mutually exclusive, are
discussed in more detail in section 8. (The various displays that the FEARLUS model can
generate are discussed in section 7.)
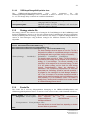
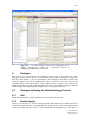
3.2.1
Debugging output
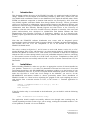
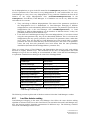
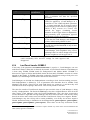
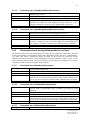
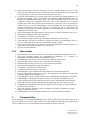
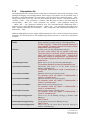
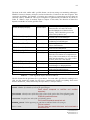
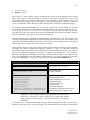
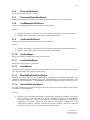
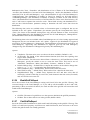
The debugging output has been developed using the concept of ‘verbosity level’, which is a
number that determines the level of information detail (roughly measured as number of different
types of messages) we want to obtain from the model as it runs. There are different types of
informative messages that the model can produce, and these are named according to the aspect of
the model they refer to (e.g. Climate, Economy, Decision …). Each of these types of message has
a particular verbosity level, which determines the minimum level of verbosity at which they will
be printed (Table 1). Thus, when running a simulation, those types of messages with a verbosity
level no greater than the verbosity level specified for the run are printed. Hence a high verbosity
level in a run means potentially many messages.
More technically, for debugging output use the –D flag. The argument to this flag consists of an
optional integer specifying the verbosity level for the run, followed by an optional list of types of
messages to include or exclude. The argument can be only an integer, only a list of message types
(each of them preceded by + or –), or both, but there must be a non-null argument. The integer,
which (if present) must appear before the list of messages, specifies the level of verbosity
required in the run. Messages are strings of characters printed to standard output by the model at
potentially every time-step, and which refer to some particular aspect of the model (e.g. Climate,
Economy, Decision …) that also gives a name to the message’s type. Each type of message (e.g.
Climate, Economy, Decision …) is assigned a value that determines its particular verbosity level
(minimum level of verbosity at which they will be printed). These values are specified in a file
named fearlus.verby, which in this way determines the ‘priority hierarchy’ of different types of
messages (Table 1).
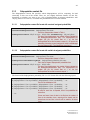
To include a verbosity message in the debugging output (regardless of its particular verbosity
level) give +message_name to the –D flag, and to prevent a verbosity message, give the –D flag –
message_name. For example, to include all messages at level 10 (or less) except
InitialLandUseAllocations and Clumping, give –D 10–InitialLandUseAllocations–Clumping
(make sure there is no space in the argument to the –D flag). The GUI messages will not be
included at any verbosity level. To force the inclusion of GUI and GUIKey, for example, use the
command line argument –D +GUI+GUIKey.
Created 2008-04-04
Modified 2008-04-18
Printed 2008-04-18
4
Verbosity message
Approval
CaseBase
CaseBaseDetail
Climate
Clumping
ClumpingDetail
ClumpingMinutiae
Decision
DecisionAlgorithm
DecisionAlgorithmDetail
Economy
FarmScaleFixedCosts
Government
GovernmentDetail
GovernmentFines
GovernmentRewards
GridFile
GridLayers
GUI
GUIKey
GUINeighbourhoodDetail
Harvest
Imitation
InitialLandUseAllocations
Level
250
550
1000
10
10
10000
100000
10
100
500
10
10
10
1000
20
20
100
1000
10
500
10
Verbosity message
LandManagerChange
LandManagerCreation
LandManagerCreationDetail
LandManagerDestruction
LandParcelCreation
LandUseChange
LandUseCreation
LandUseMatch
LandUseMatchDetail
Learning
LookupTable
LookupTableLookups
Neighbourhood
NeighbourhoodDetail
Parameters
ParcelTransfers
ParcelTransfersDetail
Pollution
PollutionDetail
StrategyDetail
SubpopulationCreation
SubpopulationCreationDetail
Yield
YieldDetail
Level
50
10
1000
10
10
50
10
100
10000
50
75
1000
1000
10000
1
10
100
10
100
1000
10
500
50
500
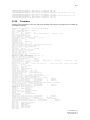
Table 1 — List of verbosity messages and their verbosity level (set in
fearlus.verby). The GUI verbosity messages cannot be enabled using an
integer argument to the –D option (unless you give them a verbosity
level in fearlus.verby or your own verbosity file); they must be
explicitly and individually specified on the command line (e.g. –D
+GUI+GUIKey).
The verbosity levels are set by default in a file called fearlus.verby in the source directory of the
model1-1-5 executable. You can override these settings by putting a file called fearlus.verby with
your required settings in the current working directory when you start the program, or you can
create a file with your own name, provided you have set an environment variable in your shell
called FEARLUS_VERBOSITY_FILE that contains the name of the file you created. If none of
these files exist, then numeric arguments to the –D flag specifying a verbosity level will be
ignored, and you should specify the debugging messages you want from Table 1 using a +
separated list (e.g. –D +Approval+Harvest+Pollution).
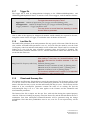
3.2.2
OWL ontology output
A prototype feature first introduced in model 1-0 is the ability to output an OWL ontology
describing the model. There are two main kinds of ontology that can be obtained: a framework
ontology, describing all the classes in FEARLUS, a model ontology describing all the classes
used in a particular model, and a model state ontology, describing all the classes used in a
particular model, and all the instances of those classes.
To get a framework ontology, you should run model1-1-5, specifying only the –O and –C options,
with no parameter file. (This is the only time when a parameter file is not required.) The program
will create a framework ontology from all descendants of the –C option argument, and save it to
the file named in the –O option argument. For the –C option argument, ‘SwarmObject’ is the
recommended value. Unfortunately this includes in the ontology several Swarm library classes
rather than only FEARLUS classes. You could give ‘FearlusThing’ as the –C option argument,
Created 2008-04-04
Modified 2008-04-18
Printed 2008-04-18
5
but the ontology will then not include the Environment class. If you want the ontology to have a
particular URI (the default is the name of the file), then you can specify this with the –U option.
To get a model state ontology and model ontology, give the –O (and possibly –U) option on the
command line, but not the –C option. In batch mode, an ontology will be written at the end of the
run describing the state of the system, unless you give the –A option, in which case an ontology is
created each year. In GUI mode, you will see an extra button on the control panel, labelled
‘Ontology’. Press this button any time you want an ontology to be saved describing the state of
the system. Due to the complexities involved in describing certain data structures, you will find
the description is not complete in all cases (e.g. some instance variables are missing, or do not
have a value). As indicated above, this is a prototype feature in FEARLUS, and issues such as this
are likely to be fixed in a later version.
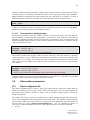
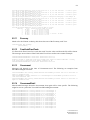
3.2.3
Report output
For specific report output, you need to create a report configuration file (see sections 5.2.1 and
8.1) indicating what reports you want made and when you want them to be run. This file is
specified using the –R option. Use the –r option to specify the file you want the report saved to,
which, if not specified, is fearlus-report.txt by default. The –a option is used if you are running
the model several times, and rather than creating lots of different report files, you want the reports
for all the runs to be stored in one file. If the –a option is given, then the report will be appended
to the file specified with the –r option if it exists already.
3.3
Interaction with the grid
In GUI mode, a button may be added to the ProcCtrl window to allow the parameter files you are
using to be uploaded to the grid. Currently this is designed only for interaction with the
FEARLUS-G application, which is assumed to be installed on your local machine. The –j option
is used to specify the path to the java FEARLUS-G client application, and the –G option to
specify the URL for the grid service. The –g and –H options are ignored currently, but reserved
for future use.
Created 2008-04-04
Modified 2008-04-18
Printed 2008-04-18
6
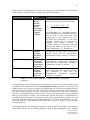
3.4
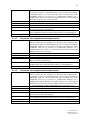
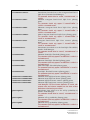
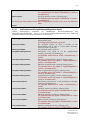
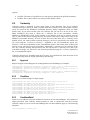
Summary
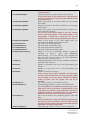
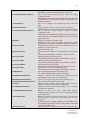
Command line flag
–a
Status
Optional
Effect
Appends to report file rather than creating a new one if it
exists.
–A
–b
–c
–C <class>
–D <verbosity>
Optional
Optional
Optional
Optional
Optional
Output an ontology each year
Run the model in batch rather than GUI mode.
Show the conditions of use and terminate
Top-level class for a framework ontology
Debugging output.
–g <grid user ID>
Ignored
Reserved for future use
–G <grid service URL>
Optional
URL for the FEARLUS-G grid service
–H <model desc>
Ignored
Reserved for future use
–j <java path>
–m <mode>
Optional
Ignored
Path to FEARLUS-G client
This is a Swarm argument.
–n <RNG class>
–o <file>
Class to use for random number generation
Specify a file containing a set of observer displays you
want in GUI mode.
Name of a file to save an ontology to
Specify a parameter file for the model.
–r <file>
–R <file>
Optional
Recommended
(Optional)
Optional
Typically
required
Optional
Optional
–s
–S <integer>
–t
–U <URI>
–V
–w
–X {integer | TIME |
DEFAULT}
–Z {integer | TIME}
–? ––help
Optional
Optional
Ignored
Optional
Ignored
Optional
Optional
(Deprecated)
Optional
Optional
–O <file>
–p <file>
File name to save report to if -R option specified.
Specify the report configuration file to generate the desired
reports.
Set the seed from the current system clock.
Set the seed from the specified argument.
This is a Swarm argument.
URI for the ontology
This is a Swarm argument.
Give a statement of (no) warranty and terminate.
Legacy way to set the seed — specify an integer, TIME, or
DEFAULT.
Specify a second seed to use after initialisation.
Gives a short help list. Depending on your shell, the -?
option is not recommended, as the ? is a wildcard character
in many shells, in which case the output when using -? is
most likely to be a rather unhelpful ‘no match’.
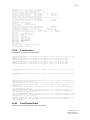
Table 2 — A list of the command line options that may be given to the
model1-1-5 executable.
4
Ontology
FEARLUS model1-1-5 is an agent-based spatially-explicit modelling system of land use change.
It is agent-based in the sense that it contains objects intended to represent human decision-makers
in the real world: farmers, or (more generally) land managers, and a government. These decisionmakers are explicitly and individually represented in FEARLUS model1-1-5. It is spatiallyexplicit in that it has land parcel objects that are topologically related to each other, decisionmaking processes that are bounded in their information sources to a spatial neighbourhood, and
outcomes that change the pattern of certain spatial features (specifically, land use). FEARLUS
model1-1-5 is a discrete-event simulation model; events in the simulation follow a cycle that is
intended to represent a year, and to which we will often refer as one time-step.
Created 2008-04-04
Modified 2008-04-18
Printed 2008-04-18
7
Henceforth, entities in the model will be referred to using Title Case to distinguish them from
real-world entities (e.g. Land Managers). Parameters will be referred to using bold Courier
New (e.g. envXSize).
4.1
Environment
The Environment consists of a rectangular grid of Land Cells that are grouped into Land Parcels,
a Climate, an Economy, and a set of possible Land Uses. We explain each of these in turn.
4.1.1
Land Cells and Land Parcels
The two main features of every Land Cell in the Environment are its set of neighbouring Land
Cells and its Biophysical Characteristics. Land Cells are also used as a repository for all
information contained in a grid file, if this is given in parameter gridFile.
4.1.1.1
Layering of geographical concepts in FEARLUS
Climate & Economy
Land Ownership
Land Use Decision
Biophysical Characteristics
Figure 1 — Layering of spatial concepts in FEARLUS.
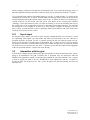
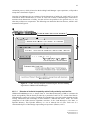
Figure 1 shows how geographical concepts are layered in FEARLUS. At the bottom sit the Land
Cells, which are assumed to be the minimum spatial units, and store the Biophysical
Characteristics and have an area. Changing the area of the cells allows you to vary the resolution
of the spatial representation and biophysical model. At the next level up are the Land Parcels,
each consisting of a number of contiguous Land Cells. These are the units of decision making for
Land Use, in that each Parcel is assumed to have a single Land Use. At the next level up are the
Farms, each consisting of a set of Land Parcels. These are the units of decision-maker: all Land
Parcels in one Farm are assumed to have the same Land Manager. The whole farm is sold, but
bought as individual land parcels. At the top layer are the Climate and Economy, which do not
vary spatially in model 1-1-5.
Note that certain Cells, coloured black in the Biophysical Characteristics layer, can be declared to
be blank. Such Cells play no part in the model, and have no Biophysical Characteristics, Land
Use, or owning Land Manager.
Created 2008-04-04
Modified 2008-04-18
Printed 2008-04-18
8
4.1.1.2
Topology and Neighbourhood Function of the set of Land Cells
Land Cells are arranged on a rectangular grid (envXSize × envYSize). The Topology of the
grid specifies what happens at the edges of the grid, and the Neighbourhood Function specifies
more generally the size and shape of Land Cells’ neighbourhoods. Topology and Neighbourhood
Function together determine which Land Cells in the grid have which other Land Cells as spatial
neighbours (environmentType).
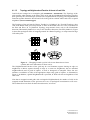
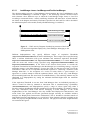
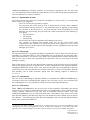
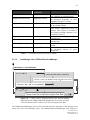
The Topology of the grid may be Planar, Toroidal, or Cylindrical. In a Toroidal Topology, edge
cells at the North of the grid ‘wrap-around’ to those at the South (and vice versa), as do those at
the East and West. In a Cylindrical Topology wrap-around occurs only in the North/South
direction (HorizontalCylindrical) or only in the East/West direction (VerticalCylindrical). Figure
2 shows the topological effect of wrapping around. In a Planar Topology, no wrap-around of edge
Cells takes place.
Figure 2 — Wrapping around a grid of cells in one dimension to form a
cylinder and in two dimensions to form a torus.
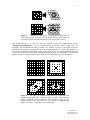
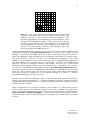
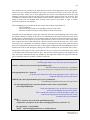
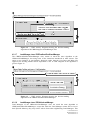
The Neighbourhood Function of the grid may be von Neumann (squares sharing an edge are
neighbours) or Moore (squares sharing an edge or a corner are neighbours), the two standard
neighbourhoods used in grids of squares, as well as hexagonal or triangular. These last two
simulate a tessellation of cells of the appropriate shape using grids of squares, as illustrated in
Figure 3. In addition, a global Neighbourhood is provided, in which all cells are neighbours of all
other cells.
Note that in wrapped around grids with a triangular Neighbourhood, the number of cells in the
wrapped around dimension of the grid must be even, or topological inconsistencies will occur.
The software does not check for these inconsistencies, so beware.
Created 2008-04-04
Modified 2008-04-18
Printed 2008-04-18
9
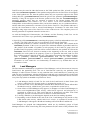
Figure 3 — Simulation of hexagonal and triangular neighbourhoods
using grids of squares. In each case the neighbourhood of the third cell
up and to the right from the bottom-left corner of the grid is shown.
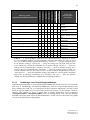
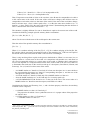
The neighbourhood of a cell can also be adjusted using the neighbourhood radius
(neighbourhoodRadius). For all Neighbourhood Functions except global and von
Neumann, the neighbourhood radius specifies the number of steps to be taken using the
Neighbourhood Function to include all cells in the neighbourhood (i.e. a radius of 2 implies two
steps of the Neighbourhood Function, radius 3 three steps, and so on). The neighbourhood radius
is irrelevant in the case of the global Neighbourhood, and in the von Neumann, it specifies the
number of steps in a North, South, East or West direction. Examples are given in Figure 4.
Figure 4 — The effect of neighbourhood radius on various different
Neighbourhood Functions (clockwise from top left: von Neumann,
Moore, triangular, and hexagonal). The outermost cells of the
neighbourhood of the centremost cell is shown for a neighbourhood
radius of 1 (black), 2 (dark grey) and 3 (light grey).
Created 2008-04-04
Modified 2008-04-18
Printed 2008-04-18
10
4.1.1.3
Biophysical Characteristics of individual Land Cells
Each individual Land Cell has certain Biophysical Characteristics, which vary spatially (in that
each Land Cell has its own individual Biophysical Characteristics), but not temporally (i.e. the
Characteristics remain unchanged during the course of a run). The Biophysical Characteristics are
described by a set of symbols that are read in from the Yield symbol tree file, specified by a
parameter (yieldTreeFile). This file contains collections of symbols for the Climate, the
Land Use, and the Biophysical Characteristics concepts. The name of the concept to use for the
Biophysical Characteristics is contained in another parameter (biophysGroupName). (The
parameters are named such that each concept is referred to as a ‘group’.)
The Biophysical Characteristics are represented by a property value list. Each element of the
property value list corresponds to a property intended to represent some aspect of the Biophysical
Characteristics (e.g. ‘Soil’ or ‘Gradient’), and the element itself takes its value from one of a set
of symbols belonging to that property (examples in the case of ‘Soil’ might be ‘Clay’ or ‘Loam’).
The number of properties, the name of each property, and the set of symbols belonging to each
property are specified in the Yield symbol tree file. A single property can be used to describe the
Biophysical Characteristics; for example ‘Land_Capability_Agriculture’ with symbols ‘Class_1’,
‘Class_2’, ‘Class_3.1’, etc.
There are two alternative ways of creating the Land Cell Biophysical Characteristics (specified by
useGridFile):
a) Loading them from a file (gridFile; see section 5.1.13).
b) Creating them stochastically at the beginning of the run. The Biophysical Characteristics
property value list in each Land Cell is assigned a random symbol for each property with
uniform probability. Optionally, a clumping algorithm may be specified, with the purpose of
making neighbouring Land Parcels more similar in their Biophysical Characteristics than the
random distribution (clumping). Model 1-1-5 has two clumping algorithms. One
(StateSwappingClumper) swaps property value lists between pairs of randomly selected Land
Cells if this increases the total similarity of Cells to their neighbours. (The random selection is
unaffected by the number of times a Cell has been selected for swapping symbols previously.)
The other clumping algorithm (SymbolSwappingClumper) operates similarly to
StateSwappingClumper, but swaps the symbols in each property one at a time between the
pairs of randomly selected Land Cells rather than the whole state. Both clumpers have a
parameter (nCycles), by default 100, which specifies the number of pairs of Land Cells to
randomly select. It is not currently possible to clump some symbols whilst leaving others with
the random allocation. Biophysical Characteristics loaded from a grid file can also not be
clumped.
4.1.1.4
Composition of Land Parcels and georeferencing
The Land Parcels each consist of one or more contiguous Land Cells. You can use the
xCellsPerParcel and yCellsPerParcel parameters to create a regular rectangular grid
of Land Parcels from the Land Cells automatically. Alternatively, model 1-1-5 has a facility for
writing to and reading from text files with a format that is close to ARC’s grid text file format,
though not actually readable by ARC without some editing, and some editing would also be
required for a file created by ARC to be readable by FEARLUS (see 5.1.13 for more details). You
specify the file to use with the gridFile parameter, and whether or not to use it with the
useGridFile parameter. This allows arbitrary groupings of Land Cells into Land Parcels, and
a non-rectangular simulated area, by specifying blank Cells using the nodata_value field in
the grid file. Grid files can be used to load in various aspects of the initial state of the model. The
following details the layers in the grid file that you can specify:
Created 2008-04-04
Modified 2008-04-18
Printed 2008-04-18
11
•
•
•
•
•
FEARLUS-LandParcelID: Each cell in the following matrix should contain an integer
representing an identifier for the Land Parcel the Land Cell corresponding to the cell in
the matrix belongs to.
FEARLUS-Biophys property: Each cell in the following matrix should contain the name
of the symbol to set the in specified property of the Biophysical Characteristics property
value list of the corresponding Land Cell.
FEARLUS-LandManagerID Initial: Each cell in the following matrix should contain an
integer identifier for the Land Manager owning the Land Parcel of the corresponding
Land Cell. This allows the specification of how Parcels are grouped into Estates. Note: if
there are more than one Land Cells in a Parcel, one of the Cells will be taken as the
‘representative’ Cell, and the entry in the corresponding matrix cell will determine the
Land Manager of the Parcel. The choice of representative Cell should be considered
arbitrary, so it is in your interest to ensure that the same Land Manager identifier is
recorded in all matrix cells corresponding to Land Cells that comprise a single Land
Parcel.
FEARLUS-SubPopulationID Initial: As per FEARLUS-LandManagerID, but sets the
Subpopulation of the Land Manager. The same note applies.
FEARLUS-LandUseID Initial: Each cell in the following matrix should contain an
integer identifier for the Land Use of the Land Parcel. A similar note applies as for Land
Manager ID and SubPopulation ID.
These data can also be saved to a grid file if the grid file specified in the parameter gridFile
does not exist and its use is stipulated (useGridFile). It is also possible to use a
GridFileReport to save Yield, Income, Pollution and Account information to the grid file.
GridFileReport operates like any other report, allowing these data to be saved for any Year during
the run. By default the data are saved to the gridFile, but the file to use for any particular
report can be specified as an option to the report (section 8.1 has more details). These will be
written as floating point numbers.
Land Parcels are neighbours if they have neighbouring Land Cells.
4.1.2
Climate and Economy
Climate and Economy are also represented using property value lists. The symbols for the
Climate are specified along with the Biophysical Characteristics in the Yield symbol tree file in a
group with name climateGroupName, whilst those for the Economy are specified in the
Income symbol tree file (incomeTreeFile) in a group with name economyGroupName. In
contrast to the Biophysical Characteristics, the Climate and Economy do not vary spatially, but
may change with each cycle of the model. There are two alternative ways in which each of these
property value lists can be set (specified by useClimateFile; useEconomyFile):
a) Loading them from a file (climateFile; economyFile) containing the property value
lists to use (see section 5.1.9).
b) Using model parameters to control a stochastic process for setting them. The Climate and
Economy property value lists are determined initially at random, with an equal probability for
each symbol within a symbol property. The probability of changing each Year for each
property is given in a file (climateChangeProbFile; economyChangeProbFile)
(see section 5.1.2). A probability of 0 means no change, 1 a certain change. To get a uniform
random probability of any symbol in the property being selected each Year, the probability
should be set to (n - 1) / n, where n is the number of symbols in the property.
4.1.3
Land Uses
Each Land Use in a simulation is represented using a property value list and four numbers. These
do not change temporally, and do not vary spatially either. The symbols and properties for the
Created 2008-04-04
Modified 2008-04-18
Printed 2008-04-18
12
Land Uses may be stored in either the Income or the Yield symbol tree files, or both, in a group
with name landUseGroupName. If the symbols and properties for the Land Uses do not appear
in the Yield symbol tree file, then the position where they are expected to appear in the Yield
lookup table file (yieldTableFile) should be given in the parameter yieldTreeLUpos.
Similarly, if they do not appear in the Income symbol tree file, then the incomeTreeLUpos
parameter specifies where they are expected to appear in the Income lookup table file
incomeTableFile. (See sections 5.1.1, 5.1.11 and 5.1.12 for more information on how
lookup tables are described in parameter files.) Of the four numbers, one is a pollution indicator,
and the other three parameterise economies of scale for the Land Use. The pollution indicator is
used by the Government to fine or reward Land Managers. Economies of scale allow Land
Managers using larger areas of the Land Use to have reduced costs. The complete process of
Income generation is explained in detail in section 4.2.2.
As with the Biophysical Characteristics, the Climate, and the Economy, Land Uses can be
constructed in one of two ways (specified by useLandUseFile):
a) Specifying a file (landUseFile) containing the property value lists and numbers to use (see
section 5.1.8). This is the only way to set economies of scale for the Land Uses.
b) Using model parameters to control a stochastic process for setting them. This is based on the
nLandUse parameter. If this is zero or equal to the maximum number of possible Land Uses
(the product of the number of symbols in each property of the Land Use group), then all
possible Land Use property value lists will be created. Otherwise, the symbols for each of the
nLandUse Land Uses are chosen at random at the beginning of the run, with an equal
probability for each symbol in its property. (There is no guarantee that each Land Use will
have a unique property value list in this case.) The number representing the pollution is drawn
from a probability distribution (pollutionDist) than can be either uniform
(pollutionMin, pollutionMax) or normal (pollutionMean, pollutionVar).
Economies of scale cannot be set stochastically in model1-1-5; by default there are no
economies of scale.
4.2
Land Managers
The Environment is inhabited by a population of Land Managers, each of whom owns at least one
Land Parcel, but potentially more. The set of Land Parcels owned by one particular Land
Manager is called a Farm or Estate. At any particular time, each Land Parcel is owned by one
(and only one) Land Manager, who has allocated one (and only one) certain Land Use in the Land
Parcel, using a particular decision-making algorithm. Land Managers undertake various activities
every time-step (which is intended to represent one Year):
a) Land Managers decide a Land Use for each of the Land Parcels in their Estate (this
activity, called Land Use decision making, is explained in section 4.2.1).
b) At the end of the Year, Land Managers calculate their annual income, which affects their
Wealth (this activity, called Income generation, is explained in section 4.2.2).
c) Some classes of Land Managers may approve or disapprove of other Land Managers in
their social neighbourhood (this activity, called Social approval and disapproval, is
explained in section 4.2.3). This social approval or disapproval can affect some Land
Managers’ decision on what Land Use to select for certain Land Parcels.
d) Learning. Whether or not this happens depends on the decision making algorithm.
e) Depending on their Wealth at the end of the Year, Land Managers may decide to buy
Land Parcels (this activity, called Land Parcel transfer, is explained in section 4.2.4).
Land Managers with negative Wealth are bankrupt, and sell all their Land Parcels.
Land Managers are grouped into Subpopulations, which are, by definition, groups of Land
Managers that have been created using the same parameter file (the names of the parameter files
Created 2008-04-04
Modified 2008-04-18
Printed 2008-04-18
13
for all Subpopulations are given in the file named in the subPopFile parameter). The structure
of such a parameter file is the same for every Subpopulation in a run (and therefore, for every
Land Manager in a run), since every Subpopulation in any particular simulation run must be an
instance of one single Subpopulation class (ClassForSubPopulations in the
subPopFile). Nevertheless, Land Managers in a simulation run can be very different from
each other for two reasons:
1. They can belong to different Subpopulations: The nature of the parameters specified at
the Subpopulation level is fundamental, so Land Managers belonging to different
Subpopulations can be substantially different. In particular, one parameter specified in the
Subpopulation file is the Land Manager class (landManagerClass), i.e. Land
Managers in different Subpopulations can be instances of different classes, so they can
potentially make decisions in different ways.
2. Even when two Land Managers belong to the same Subpopulation (i.e. have been created
using the same parameter file), they can be substantially different. This is so because the
Subpopulation file may specify probability distributions for parameter values, rather than
exact values. Thus, the fact that two Land Managers have been created using a common
parameter file does not mean that they must necessarily have the same set of parameter
values, but only that such parameters have been drawn from the same probability
distribution (determined in the Subpopulation’s parameter file).
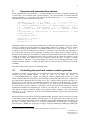
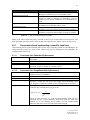
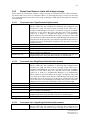
There are various classes of Land Manager and Subpopulation that may be used, each making
decisions in slightly different ways. The constraints on the class of Subpopulation that Land
Managers of a given class can belong to are summarised in Table 3. Note that all Land Managers
in a particular simulation must belong to the same class of Subpopulation.
Land Manager Class
Subpopulation class
LandManager
SubPopulation
PositiveLandManager
SubPopulation
DelayedChangeLandManager
DelayedChangeSubPopulation
CBRSocialLandManager
CBRSocialSubPopulation
CBRSocialParcelLandManager
CBRSocialSubPopulation
CBRStrategyLandManager
CBRStrategySubPopulation
CBRNetApprovalLandManager
CBRStrategySubPopulation
CBRFarmScaleProfitLandManager
CBRStrategySubPopulation
CBRAdviceLandManager
CBRAdviceSubPopulation
CBRDelayedChangeLandManager CBRDelayedChangeSubPopulation
Table 3 — Summary of classes of Subpopulation that various classes of
Land Manager can belong to.
The following sections explain each of the three main activities that Land Managers conduct.
4.2.1
Land Use decision making
Land Managers belonging to the same Land Manager class follow the same decision making
algorithm to allocate Land Uses to their Land Parcels, but remember that each Land Manager may
have this decision making algorithm parameterised in different ways. The following considers
each of the Land Manager classes in turn.
Created 2008-04-04
Modified 2008-04-18
Printed 2008-04-18
14
4.2.1.1
Land Manager classes: LandManager and PositiveLandManager
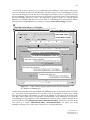
The decision-making process of Land Managers that instantiate the class LandManager or the
class PositiveLandManager is sketched in Figure 5. The underlying structure consists of three
main elements—three different ways in which the Land Manager might choose a Land Use
according to contextual factors—namely satisficing, imitation, and innovation. A fourth element,
not shown in the diagram and entirely artefactual, specifies how the Land Use will be decided in
the initialisation phase of the model (usually a Random Strategy is used here).
Figure 5 — UML Activity Diagram of underlying structure of the Land
Use Decision Algorithm employed by Land Managers belonging to the
SubPopulation class.
Different Subpopulations may specify different ranges of Aspiration Thresholds
(aspirationThresholdDist) for their Land Managers. These ranges can be specified using
either a uniform distribution (with given minimum and maximum Aspiration Thresholds:
aspirationThresholdMin and aspirationThresholdMax), or a normal distribution
(with the mean and variance being specified using aspirationThresholdMean and
aspirationThresholdVar). If the Yield of the decision Parcel meets or exceeds the
Aspiration Threshold of the Land Manager, then the Manager uses a satisficing strategy. A typical
satisficing strategy is the Habit Strategy—just use the Land Use that was used last year on the
Land Parcel. Thus, the use of Aspiration Thresholds represents a “satisficing” element to Land
Manager behaviour—i.e. the acceptance of a course of action which is “good enough”, as
opposed to a (riskier) attempt to find the optimum (Simon, 1955). In this way, Land Manager
decision-making behaviour has some basis in established theory. The satisficing element may be
eliminated in a Subpopulation by setting the minimum threshold higher than the maximum
possible Income.
If the Aspiration Threshold is not met, then Land Managers have an individual propensity to
choose a Land Use either by imitation or innovation. This is simulated using a probability
(imitateProbDist), and Subpopulations specify a range of values (again using either a
normal or uniform distribution) that their members have for this probability. An imitative strategy
uses only information about Land Parcels belonging to Land Managers in the social
neighbourhood of the Land Manager: this may include their Biophysical Characteristics, and
recent Land Uses applied and Income generated (though currently no available imitative
strategies use Biophysical Characteristics information). This is intended to simulate transfer of
information between Land Managers on a social basis. Some imitative strategies available in the
model use physical neighbourhoods instead, however. The physical and social neighbourhoods
are contrasted in Figure 6.
Created 2008-04-04
Modified 2008-04-18
Printed 2008-04-18
15
O
O M N M M
L
K
K
O
A M M M
E
E
L
L
O
O M A
E
E
E
K
J
P
P
A
A
Z
E
J
J
Y
P
O
H
A
Z
Z
F
X
Y
B
Q
Q
H
F
F
F
G
X
B
B
R
S
H
F
G
G
X
C
Z
D
S
T
U
V
G
I
C
C
W
S
T
V
V
I
I
Figure 6 — The social and physical neighbourhoods contrasted. Each
cell in the Environment above is given a letter according to the Land
Manager who owns it. The solid line denotes the boundary of the
physical neighbourhood of Land Manager Z in an Environment with a
von Neumann neighbourhood radius 1. These consist of those Parcels
that share a border with one of the Parcels owned by Z. By contrast, the
social neighbourhood, shown by a grey shading to the included cells,
consists of all Land Parcels owned by Land Managers with Land
Parcels in the physical neighbourhood of Z.
Another parameter that imitative strategies may or may not use as part of their algorithm is the
Neighbourhood Weighting (neighbourWeightDist), for which a range of values for Land
Managers is specified at the Subpopulation level. This is intended to represent the degree to
which Land Managers weight information from neighbouring Land Parcels as opposed to their
own when choosing a Land Use to imitate. At a Neighbourhood Weighting of zero, Land
Managers only pay attention to their own Land Parcels, and at a Neighbourhood Weighting of
one, Land Managers give equal weight to all information. In general, the Neighbourhood
Weighting can be any non-negative floating point number. The one way in which Land
Managers’ decision-making processes may be changed during a simulation run is a legacy
provision for the Neighbourhood Weighting to change (changeNeighbourWeightDist). It
specifies the amount to add to the Neighbourhood Weighting of a Land Manager for each Land
Parcel lost, and to subtract from it for each Land Parcel gained. This addition and subtraction
takes place during the learning step in the schedule, though if it leads to a negative
Neighbourhood Weighting, it will be set to zero.
The other way in which Land Managers choose a Land Use when their Aspiration Threshold is
not met is by innovation (probability = 1 – Imitative Probability). Innovative strategies do not use
neighbourhood information, but involve some other principled algorithm for deciding a Land Use
to apply from those available.
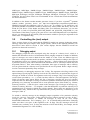
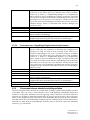
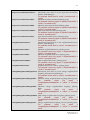
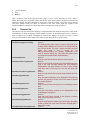
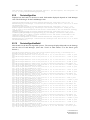
Table 4 compares the list of strategies available for use in model 1-1-5. More detail is given in
section 9. Both imitative and innovative strategies may involve examining data from earlier
Years. To this end, Subpopulations specify a range of values for the Memory of Land Managers
(memorySizeMin and memorySizeMax) — which specifies the maximum number of Years’
Climate, Economy, Land Use and Yield data the Land Manager may examine when choosing the
Land Use.
Created 2008-04-04
Modified 2008-04-18
Printed 2008-04-18
Imitative?
Historical?
Memory?
Phys/Soc
Optimum?
Deterministic?
Nbr wgt?
16
EccentricSpecialistStrategy
N
Y
N
-
-
-
-
FickleStrategy
N
N
N
-
-
-
-
GridFileStrategy
N
N
N
-
-
-
-
HabitStrategy
NoStrategy
N
-
Y
-
N
-
-
-
-
-
RandomCopyingStrategy
Y
Y
N
S
N
-
Y
RandomStrategy
SimpleCopyingStrategy
N
Y
N
Y
N
N
S
N
N
-
Y
SimplePhysicalCopyingStrategy
Y
Y
N
P
N
-
Y
YieldAverageWeightedTemporalCopyingStrategy
YieldRandomOptimumTemporalCopyingStrategy
YieldWeightedCopyingStrategy
YieldWeightedTemporalCopyingStrategy
Y
Y
Y
Y
Y
Y
Y
Y
Y
Y
N
Y
S
S
S
S
N
Y
N
N
N
-
Y
Y
Y
Y
Strategy name
Land Use
scoring basis /
description
Random LU first time retained
thereafter
Random LU selected to use on
all Parcels
LU as per grid file with layer
for given year
Retain LU on Parcel
For when a particular decision
algorithm element won’t be
used
Random if alternative exists in
neighbourhood
Random
Times LU appears in
neighbourhood
Times LU appears in
neighbourhood
Last N years’ average income
Last N years’ income
Last year’s income
Last N years’ income
Table 4 — A list of strategies (other than Case-Based Reasoning, described in section
4.2.1.2) available in model1-1-5, their properties and a brief description. LU refers to Land
Use. The column headings indicate the following: ‘Imitative?’ — Can the strategy be used
as an imitative strategy? ‘Historical?’ — Does the strategy use any data from previous
years? (Meaning it would be unsuitable for an initial strategy) ‘Memory?’ — Does the
strategy use the Land Manager’s memory? ‘Soc/Phys’ — Does an imitative strategy use a
social or physical neighbourhood? ‘Optimum?’ — Does the strategy choose a Land Use
with the highest score? (If not, Land Uses are selected at random weighted by their score.)
‘Deterministic?’ — Does the optimising strategy deal with two or more equally maximum
high scores by choosing consistently (or at random)? ‘Nbr wgt?’ — Does an imitative
strategy use the Land Manager’s neighbourhood weighting property?
4.2.1.2
Land Manager class: DelayedChangeLandManager
Land Managers belonging to the DelayedChangeLandManager decide Land Uses in much the
same way as LandManager and PositiveLandManager, with the exception that Managers will
delay changing the Land Use of a Land Parcel if their Aspiration Threshold is not met on that
Parcel for a given number of consecutive Years (referred to in Figure 7 as the manager’s Years to
Change). This number of Years is drawn from a uniform distribution set by parameters
(changeDelayMin, changeDelayMax) from the Subpopulation. Note that the Manager
remembers how long each Parcel has had unsatisfactory Yield; Land Use decisions being made
on a Parcel by Parcel basis independently.
Created 2008-04-04
Modified 2008-04-18
Printed 2008-04-18
17
Figure 7 — UML Activity Diagram of the decision making algorithm
of the DelayedChangeLandManager
4.2.1.3
Land Manager class: CBRSocialLandManager
In this section we explain how Land Managers of the CBRSocialLandManager class make
decisions. CBRSocialLandManagers have two top level concerns (or dimensions of utility) that
they take into account when selecting Land Uses for their Land Parcels. They are concerned both
about profit and about the social acceptability of their actions. Similarly to the Land Manager
classes explained in section 4.2.1.1, CBRSocialLandManagers follow a “satisficing approach” in
the sense that if they meet both their profit and their social approval aspiration thresholds
(profitAspirationDist and approvalAspirationDist, both set using probability
distributions at the Subpopulation level), then they (effectively) use the Habit Strategy for all their
Land Parcels—they keep the same Land Use that was used last year on every Land Parcel they
own. Note that the profit aspiration threshold is set at the Estate level, and does not change if the
Land Managers acquires more Land Parcels—a somewhat unrealistic feature addressed in some
of the other CBR Land Manager classes. If they do not meet both aspiration thresholds, they set
up a Decision Process for each of the Land Parcels they own. The following gives a brief
overview of this Decision Process, which is subsequently explained in more detail.
Land Uses
Estimated
Profit
Pareto Front
Estimated Social
Acceptability
Figure 8 — Estimation of the social acceptability and the profit that
different Land Uses provide in a certain Land Parcel.
The Decision Process begins with an estimation of the social acceptability and the profit that each
of the possible Land Uses will give to the Land Manager in the considered Land Parcel. This
Created 2008-04-04
Modified 2008-04-18
Printed 2008-04-18
18
estimation process, which is based on the deciding Land Manager’s past experience, will produce
a map that is sketched in Figure 8.
Once the Land Manager has an estimate of both dimensions of utility for each Land Use in the
Land Parcel under consideration, it is time to select one of them. Land Managers would like to
maximise both dimensions of utility, but this will not be possible in the general case, so very
often they will have to compromise. The following text details the Decision Process, which is also
summarised in Figure 9.
Figure 9 — UML Activity Diagram summarising the decision-making
algorithm for CBRSocialLandManagers.
4.2.1.3.1 Estimation of the Social Acceptability and the Profit provided by each Land Use
CBRSocialLandManagers use a simple form of Case-Based Reasoning (CBR) to estimate the
Social Acceptability and the Profit provided by a particular Land Use in a certain Land Parcel.
CBR basically consists of “solving a problem by remembering a previous similar situation and by
reusing information and knowledge of that situation” (Aamodt and Plaza, 1994). The main
component of the CBR selection algorithm used here is the Land Manager’s Case Base, or
Episodic Memory. This Episodic Memory is a set of ordered lists of cases. Each case is a
contextualised piece of knowledge representing an experience (Watson, 1997).
Created 2008-04-04
Modified 2008-04-18
Printed 2008-04-18
19
CBRSocialLandManagers calculate estimates by retrieving an appropriate case for each Land
Use. The following sections explain the representation of cases, their storage, their retaining, their
retrieval, and their use to derive estimates.
4.2.1.3.1.1 Representation of cases
One case represents the experience lived by the case-holder at a certain Year Y on a certain Land
Parcel. Thus, a case comprises:
− The Year Y where the experience occurred.
− The perceived state of the world in Year Y, which consists of some of the conditions
that interacted with the decision (i.e. the particular Land Use applied) in determining
the outcome of that decision (i.e. the profit and the social acceptability the Land
Manager got). Specifically, the perceived state of the world consists of the following 3
descriptors:
o The Land Parcel
o The Climate
o The Economy
− The decision: the Land Use applied to the Land Parcel at Year Y.
− The outcome of applying the selected Land Use on the Land Parcel under
consideration. This consists of the profit and the net Social Approval (i.e. the overall
balance between Social Approval and Disapproval from Neighbours) that the Land
Manager got in Year Y.
4.2.1.3.1.2 Case storage
The Episodic Memory is organized in different compartments, each of which stores all the cases
pertaining to a particular Land Use. The compartments are not arranged in any particular order:
they form an unsorted set. In contrast, cases within each compartment are stored in ordered lists,
with the first cases in these lists representing the experiences that are most fresh in the Land
Manager’s memory.
Thus, at the end of a Year, the cases derived from experience of the current Year are stored at the
head of the appropriate lists in random order. In each compartment of the Episodic Memory,
immediately behind the current Year’s cases, there are the other cases corresponding to previous
experiences in an order such that the most recently used cases (i.e. those cases that have been the
best matching case in earlier decisions) appear first; this ordering sequence is detailed in
4.2.1.3.1.4.
4.2.1.3.1.3 Case retention
The size of the Land Managers’ Episodic Memory is unlimited for CBRSocialLandManagers;
some other classes have limited Episodic Memory size (see below). Every case experienced by
the Land Manager (in every Land Parcel owned) is stored in their Episodic Memory.
4.2.1.3.1.4 Case retrieval
When CBRSocialLandManagers do not meet one of their Aspiration Thresholds, they decide
which Land Use to apply in each Land Parcel they own independently. They consider the most
recently acquired Land Parcels first. This may be potentially relevant because every time
CBRSocialLandManagers set up a Decision Process for a Land Parcel, they retrieve cases from
their Episodic Memory, and this retrieval process can modify the order in which cases are kept in
their Memory * . The following describes how Land Managers come up with the map sketched in
Figure 8 for a particular Land Parcel.
*
In any case, the order in which Land Parcels are considered will never prevent the Land Manager from
remembering one of the most appropriate cases for each specific Land Parcel. It may affect only which
particular case is selected among a set of cases where all of them are perceived as equally appropriate.
Created 2008-04-04
Modified 2008-04-18
Printed 2008-04-18
20
The estimates for each Land Use are taken directly from the most appropriate case for the specific
Land Use in the considered Land Parcel given the current perceived state of the world. The two
factors that affect which case is most appropriate are recency and similarity between the Land
Manager’s perception of the current state of the world and that at the time the case occurred. This
is intended to (crudely) mimic some features of how human cognition works—that we are most
likely to recall cases we thought about recently, and accept or reject them as input to current
decisions on the basis of similarity.
The Land Manager’s perception about the current state of the world consists of:
− The Land Parcel.
− The most recent Climate (corresponding to the previous Year).
− The most recent Economy (corresponding to the previous Year).
Note that since Land Managers make their Land Use decisions at the beginning of the Year (when
the Climate and the Economy for that Year are still unknown) their perceived current state of the
world cannot be formed by the set of conditions that will interact with their decision to produce
the outcome at the end of the Year. In the representation of cases, however, the state of the world
does comprise the factors that affected the outcome which is stored in the same case. Thus, when
retrieving a case considering its similarity with the current perceived state of the world and using
that case to guesstimate the outcome, there is the implicit assumption that Land Managers believe
that the state of the world during the coming Year will be similar to the current state of the world.
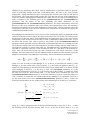
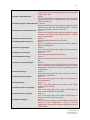
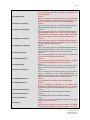
The specific retrieval process for a given Land Use lu given a perceived current state of the world
st is detailed in the following text box in grey. This text box contains pseudo-code (aligned to the
left), and some comments in blue ink (aligned to the right) that explain the processes that the
piece of pseudo-code next to them is meant to represent:
Retrieve the list of cases where lu was applied: episodicMemory[lu].
Land Manager thinks of previous times where he applied lu.
firstCase = Remove first case from episodicMemory[lu]
The most salient case in memory is remembered
(this is one of last year’s experiences if lu was applied then)
mostAppropriateCase = firstCase
So far this most salient case is the most appropriate, but it is about to be
compared with other previous experiences
WHILE (The end of episodicMemory[lu] is not reached) DO
Land Manager remembers other previous experiences
IF mostAppropriateCase is a perfect match for state of the world st THEN
break loop WHILE-DO
If the most appropriate case up until now is just perfect,
then the Land Manager does not look further.
This is intended to represent a situation in which no other case
could be more appropriate and (maybe because of that)
no further cases are remembered
ELSE
aCase = Remove next case from episodicMemory[lu].
comparison = [Compare: aCase with: mostAppropriateCase relativeTo: st ]
IF comparison == moreSimilar
THEN Add mostAppropriateCase to consideredCases
Created 2008-04-04
Modified 2008-04-18
Printed 2008-04-18
21
mostAppropriateCase = aCase
aCase is more similar to st than mostAppropriateCase is,
so aCase is now the most appropriate.
The previously mostAppropriateCase is added to
a list of cases that have been considered
IF comparison == lessSimilar
THEN Add aCase to rejectedCases
aCase is less similar to st than mostAppropriateCase is,
so aCase is rejected (this can be understood as if aCase
did not even come to the Land Manager’s mind in the first place)
IF comparison == incomparable
THEN Add aCase to consideredCases
aCase and mostAppropriateCase are incommensurably close to st.
This means that aCase is more similar to st than mostAppropriateCase in some respects,
and less so in others.
Thus, aCase has been considered, but it does not replace the most appropriate case
IF comparison == equallySimilar
THEN Add aCase to consideredCases
aCase and mostAppropriateCase are equally close to st.
Thus, aCase has been considered, but it does not replace the most appropriate case
end of loop WHILE-DO
// end of running through episodicMemory[lu]
Randomise rejectedCases and add them at the beginning of episodicMemory[lu]
Randomise consideredCases and add them at the beginning of episodicMemory[lu]
Add mostAppropriateCase at the beginning of episodicMemory[lu]
The process of remembering some previous experiences and considering them
has made them more salient, and they will be remembered more easily
the next time the Land Manager tries to remember a previous experience
Understanding the algorithm may be assisted with reference to an example. Imagine the following
list is the episodic memory for a particular land use, before it is consulted using the above
algorithm to find the most appropriate case:
[H, C1, C2, R1, R2, R3, B, C3, C4, C5, C6, R4, C7, R5, R6, ...]
where H is the head of the list before the episodic memory is consulted (and the best case from
the last consultation), B is to be the best (i.e. most appropriate) case for this consultation, C1-n are
to be the ‘considered cases’ (those which are not found to be less similar to the state of the world
than the best case found at that time) and R1-n are to be the ‘rejected cases’ (those which are
found to be less similar to the state of the world than the best case found at that time). The
ordering of the episodic memory after consultation is then:
[B, C, R],
where C is a random ordering of the list [H, C1-n] and R is a random ordering of the list [R1-n].
In terms of the ordering of which case is known to be better than which other case (i.e. using ‘>’
for ‘more-similar’ and ‘<’ for ‘less-similar’), we know that:
R1-3 < H
R4-n < B
B>H
Created 2008-04-04
Modified 2008-04-18
Printed 2008-04-18
22
Either (C1-2 < B and C1-2 > H) or (C1-2 incomparable-to H)
Either (C3-n < B) or (C3-n incomparable-to B)
Thus, H represents some kind of a bias to the case base, since B must be comparable-to it relative
to the current state of the world. If the state of the world never changes, then all best cases are
comparable-to each other relative to that state of the world. If the state of the world does change,
then for all time steps, t, B(t) is either equal to B(t – 1) or B(t) has state more similar to S(t – 1)
than B(t – 1) does, where S(t) is the state of the world at time t. (Remembering that the decision at
time t is based on the state of the world at time t – 1.)
The situation is slightly different if a state is found that is equal to the current state of the world.
Consider the following example episodic memory before consultation:
[H, C1, C2, R1, R2, R3, E, ... ]
where E is the case with the state of the world equal to the current state.
Then the order of the episodic memory after consultation is:
[E, C, R, ...]
Where C is a random ordering of the list [H, C1, C2], R a random ordering of the list [R1, R2,
R3] and the ellipsis represents an unchanged order to the remaining list. * If H has state equal to
the current state of the world, then the order of the case base is unchanged.
There is only one thing left to explain in the process detailed above: When is a case more, less, or
equally similar to a certain state of the world st in comparison with another case, and when are
two cases incomparable relative to a certain state of the world st? Whether these contingencies
occur or not depends on a comparison between the states of the world of the two cases relative to
st. Remember that each state of the world is made up of 3 descriptors (Land Parcel, Climate, and
Economy). Let A, B, and C be three states of the world.
− A is MORE similar to C than B is if and only if at least one descriptor in A is more similar to
the corresponding descriptor in C than B’s corresponding descriptor is, and the rest of the
descriptors are equally similar to C as B’s.
− A is LESS similar to C than B is if and only if B is MORE similar to C than A is.
− A has the SAME similarity to C as B if and only if A is exactly equal to B.
− A is INCOMPARABLE with B relative to C in the rest of the cases. This occurs when A is
MORE similar to C than B in some descriptors, and LESS so in others.
Considering the Climate and Economy, let u, v, and w be three property value lists, the similarity
of which is to be compared.
− u is MORE similar to w than v is if and only if
The properties for which v has a symbol the same as w is a proper subset of the properties
for which u does.
− u is LESS similar to w than v is if and only if
v is MORE similar to w than u is.
*
For a closer correspondence with the earlier imperfect matching example, R should be a random ordering
of the list [R1, R2, R3, …], since all cases in the ellipsis will be less similar to the state of the world than E,
the perfectly matching case.
Created 2008-04-04
Modified 2008-04-18
Printed 2008-04-18
23
− u has the SAME similarity to w as v if and only if
u is equal to v.
− u is INCOMPARABLE with v relative to w in the rest of the cases.
Relative distance is used as a proxy for Land Parcels’ similarity to each other if the parameter
alwaysUseProximity is set to 1. Thus, for three Land Parcels, u, v and w, u is MORE
similar to w than v if and only if u is closer to w than v (using Euclidean distance between the coordinates of the base Cell of each Parcel), and has the SAME similarity to w as v if and only if u
and v are equidistant to w. The base Cell of a Parcel is the Cell closest to its centre. If
alwaysUseProximity is set to 0, and u, v and w have one Cell each, or each of u, v and w
have uniform Biophysical Characteristics on their Cells, then Parcels are compared using the
property value lists of their Biophysical Characteristics, similarly to the Climate and Economy. If
alwaysUseProximity is 0 and neither of the above conditions on u, v and w’s Biophysical
Characteristics are met, then Euclidean distance is used for similarity.
4.2.1.3.1.5 Calculation of estimates from the most appropriate cases
The only circumstance under which the process described in the previous section will not retrieve
a case is when the compartment for Land Use lu in the Land Manager’s Episodic Memory is
empty. If that is the case, then the Land Manager will estimate the Profit and the Social Approval
for that Land Use in the considered Land Parcel given the current perceived state of the world
taking the respective Aspiration Thresholds as estimates for Profit and Social Approval. If, on the
other hand, the retrieval process does produce a case, the estimates are exactly those that appear
in the case.
4.2.1.3.2 Selection of a specific Land Use in the two-dimensional plane of utilities
This section explains how Land Managers select one Land Use once they have an estimation of
Profit and Social Approval for each of them (see Figure 8). In the general case there will not be a
Land Use that outperforms the rest in both dimensions of utility, so Land Managers will have to
compromise. This is done using a compensatory approach, i.e. assuming that high performance
for one dimension of utility may be traded-off against poorer performance for another, to
maximise an overall index of worth or utility called Combined Utility. The Combined Utility is
calculated using a linear function which guarantees that only Pareto optimal combinations are
selected (as long as weights, which may also be referred to as salience, are positive).
Combined_Utility[lu] = profit[lu] * profit_weight + approval[lu] * approval_weight
Once the Combined Utility of every Land Use is calculated, the Land Manager selects one at
random among those with equal maximum Combined Utility. Note that this process assumes
profit and approval are all stored in cases for the same Land Use across the whole Estate each
Year. It is thus appropriate only when each Estate consists of a single Land Parcel, which is
currently the only way to ensure that one Land Use is applied across the whole Estate. The
allowEstateGrowth parameter will, if set to 0, prevent Land Managers from buying new
Land Parcels.
The values for each dimension of utility are not standardised; thus, the ratio of the weights
functions as an “exchange rate” between the units of the different dimensions of utility (e.g. £50 /
unit_of_approval). Accordingly, this ratio represents the current relative level of concern about
the two dimensions. When using this type of weighting, as long as the weights do not change, the
marginal rate of substitution between the two dimensions of utility remains constant, i.e.
independent of the actual values of profit[lu] and approval[lu]. Therefore, at the time of making a
particular decision, since the weights are constant, the marginal rate of substitution is constant
too.
Created 2008-04-04
Modified 2008-04-18
Printed 2008-04-18
24
The weights for each of the two dimensions of utility are in general different for each Land
Manager, and they can also vary in time for each particular Land Manager depending on the
occurrence of certain Events (this process is detailed below). Specifically, each Land Manager has
a minimum value for each of the two weights (profitMinSalienceDist and
approvalMinSalienceDist), and a certain amount of units of “mobile worry”
(salienceMarginDist) that they can assign to either dimension of utility to form the actual
weights. These three values are specified at the Subpopulation level, using a probability
distribution, and they satisfy the following constraint for each Land Manager:
profitMinSalienceDist + approvalMinSalienceDist + salienceMarginDist =
= CONSTANT =
= profit_weight + approval_weight
The “mobile worry” is initially divided between the two dimensions in the ratio
profitMinSalienceDist / approvalMinSalienceDist, so the first values of profit_weight and
approval_weight satisfy the following constraint:
profit_weight / approval_weight = profitMinSalienceDist / approvalMinSalienceDist
From then onwards, particular Events (e.g. a neighbour going bankrupt; making an overall loss in
the Year; or an increase in the number of disapproving neighbours) will cause a shift of a certain
number of units of mobile worry (salienceAdjustDist), provided there are any to be
shifted, i.e. provided profit_weight remains no lower than profitMinSalienceDist, and
approval_weight no lower than approvalMinSalienceDist.
What Events cause what reaction in Land Managers is specified at the Subpopulation level using
the file eventFile. The structure of this file is explained in section 5.1.6, and the set of
available events is summarised in Table 5 and detailed in section 10; an example of an event file
is given below:
BEGIN EVENT BadHarvestEvent
Response: incProfitSalience
MeanHarvestThreshold: 9.0
END
BEGIN EVENT NeighbourDisapprovalEvent
Response: incApprovalSalience
END
Created 2008-04-04
Modified 2008-04-18
Printed 2008-04-18
25
Event class
Configuration
parameters
Description
BadHarvestEvent
MeanHarvestThreshold
DisapprovalProportionEvent
DisapprovalThreshold
HighWealthEvent
RichThreshold
LandParcelSoldEvent
none
NeighbourDisapprovalEvent
none
NetLossEvent
none
NoRewardEvent
none
ThresholdDisapprovalEvent
DisapprovalThreshold
The average Yield from Land Parcels
is less than the specified threshold.
The Land Manager has had more than
the threshold proportion of their
neighbours disapprove of them.
The Land Manager’s Account exceeds
the specified threshold.
The Land Manager has had to sell a
Land Parcel. [Deprecated since in
contrast with versions of FEARLUS
not featuring ELMM, Managers now
sell all their Parcels.]
A neighbour has disapproved of the
Land Manager.
The Land Manager’s Profit this Year is
less than zero.
The Government has not issued a
reward.
The Land Manager has had more than
the threshold amount of gross
disapproval.
Table 5 — A summary of the Event classes available.
4.2.1.4
Land Manager class: CBRSocialParcelLandManager
Figure 10 — UML Activity Diagram showing the decision-making
algorithm for the CBRSocialParcelLandManager class. Refer to Figure
9 for more detail on how Land Uses are chosen using the Case Base.
The CBRSocialLandManager class has the issue that the Profit Aspiration is not changed as the
Estate size of the Land Manager grows. The CBRSocialParcelLandManager class attempts to
Created 2008-04-04
Modified 2008-04-18
Printed 2008-04-18
26
address this by allowing the Profit Aspiration to refer to the Net Profit made by a particular Land
Parcel (the Land Parcel’s gross Income per unit area less the Break-Even Threshold). A UML
Activity Diagram illustrating the changes in the algorithm is provided in Figure 10. One issue
with this class is that the Land Parcel Net Profit does not include any Reward or Fines from the
Government agent, meaning that Land Managers’ decisions will not be affected by this. Another
is that it does not address the issue that the amount Approval as well as Profit can be changed by
Estate size.
4.2.1.5
Land Manager class: CBRStrategyLandManager
CBRStrategyLandManagers decide as per CBRSocialParcelLandManagers, except that when
their Aspiration Thresholds are not reached they have a chance (determined by their individual
value drawn from the Subpopulation distribution determined by parameters pCBRDist,
pCBRMin, pCBRMax, pCBRMean and pCBRVar) of using Case Based Reasoning as opposed to
a Strategy from Table 4 when choosing a Land Use. When using a Strategy, they have a
probability (sampled from Subpopulation parameters pImitateDist, pImitateMin,
pImitateMax, pImitateMean and pImitateVar) of using an imitative rather than a nonimitative Strategy. For those Strategies that work with a Memory, the size of the Memory is
determined by sampling from a uniform distribution at Subpopulation level with parameters
memorySizeMin and memorySizeMax. CBRStrategyLandManagers can thus be made to
behave in exactly the same way as LandManagers with HabitStrategy as their contentment
Strategy (pCBR = 0), or in exactly the same way as CBRSocialParcelLandManagers (pCBR = 1).
Refer to Table 4 for a list of Strategies available.
Figure 11 — UML Activity Diagram showing part of the decisionmaking algorithm of Land Managers of the CBRStrategyLandManager
class. This algorithm replaces the ‘Choose a Land Use for the Parcel
using the Case Base’ steps in the algorithm shown in Figure 10 for the
CBRSocialParcelLandManager class.
4.2.1.6
Land Manager class: CBRNetApprovalLandManager
The CBRNetApprovalLandManager class builds on the CBRStrategyLandManager class by
dealing with the issue that the amount of possible Approval a Land Manager can get changes with
Estate size. Another issue, that Land Managers may not care about the Approval or Disapproval
they get from other Managers they Disapprove of is also catered for. When considering whether
the Social Aspiration is met, Land Managers of this class compute the mean net Approval
(Approval – Disapproval) from the set of Managers they have not Disapproved of. The UML
diagram is given below in Figure 12.
Created 2008-04-04
Modified 2008-04-18
Printed 2008-04-18
27
Figure 12 — UML Activity Diagram showing the decision-making
algorithm of the CBRNetApprovalLandManager class.
4.2.1.7
Land Manager class: CBRFarmScaleProfitLandManager
The CBRFarmScaleProfitLandManager class returns to much the same algorithm as the
CBRSocialLandManager, but using some of the extensions introduced in other classes: The
option to use imitative or non-imitative Strategies rather than the Case Base and Mean Net
Approval for deciding whether Social Aspiration is met. A UML Diagram of the algorithm is
given in Figure 13.
Figure 13 — UML Activity Diagram showing the decision-making
algorithm of the CBRFarmScaleProfitLandManager.
4.2.1.8
Land Manager class: CBRAdviceLandManager
Land Managers of the CBRAdviceLandManager class use much the same algorithm as
CBRFarmScaleProfitLandManager, except that when the Land Manager cannot find a Case in
their Episodic Memory, they may ask for Advice from other neighbouring Land Managers. This
Created 2008-04-04
Modified 2008-04-18
Printed 2008-04-18
28
is done using an Advice Strategy to sort neighbouring Land Managers in the order in which they
are to be consulted for Advice. Land Managers will offer Advice to any Land Manager of whom
they have not Disapproved and who have not Disapproved of them. Advice is given by returning
the best matching Case from the Case Base for the Land Use and state of the world supplied by
the Land Manager asking for Advice. The algorithm is given in Figure 14. Various Advice
Strategies are available, and these are listed in Table 6. Land Managers are assigned their Advice
Strategy from the Subpopulation they belong to, using the adviceStrategy parameter.
Figure 14 — UML Activity Diagram depicting the decision algorithm
of CBRAdviceLandManagers.
Another feature introduced for the CBRAdviceLandManager class is limitations on the Case Base
size. Two limits can be imposed on the Case Base. One is the amount of time a Case will be
stored in the Case Base, and another is a limit on the number of Cases that can be stored in the
Case Base. These limits can be used together, or independently. These limitations are assigned to
Land Managers using parameters in the Subpopulation, which specify a uniform distribution for
the time limit on Cases (CBTimeLimitMin, CBTimeLimitMax), and for the size limit on the
Case Base as a whole (CBSizeLimitMin, CBSizeLimitMax). In either case, Land
Managers assigned a size or time limit of zero have no corresponding limit.
Created 2008-04-04
Modified 2008-04-18
Printed 2008-04-18
29
Advice Strategy class
Description
NoAdviceStrategy
For use if you want to ensure Land Managers of this
class do not seek any Advice. An empty list of Advisors
is returned.
The Advice list is a randomly ordered list of neighbours
with whom there has been no Disapproval.
The Advice list is a list of neighbours sorted in
descending order of Profit.
The Advice list is a randomly ordered list of neighbours
belonging to the same Subpopulation as the Manager
seeking Advice.
NoDisapproverAdviceStrategy
ProfitMakerAdviceStrategy
SameSubPopulationAdviceStrategy
Table 6 — The Advice Strategy
CBRAdviceLandManagers to use.
4.2.1.9
classes
available
for
Land Manager class: CBRDelayedChangeLandManager
CBRDelayedChangeLandManagers use the same algorithm as CBRAdviceLandManager, with
the exception that Land Uses are not changed until a number of consecutive Years of Aspirations
not being met have gone by. The number of consecutive Years to use (‘Years to Change’ in the
UML diagram in Figure 15) is set from a uniform distribution in the Subpopulation, using the
parameters changeDelayMin and changeDelayMax.
Figure 15 — UML Activity Diagram showing the decision making
algorithm of the CBRDelayedChangeLandManager.
4.2.2
Income generation
Land Managers in model1-1-5 survive by generating sufficient Income to prevent them from
becoming bankrupt. Every Land Manager starts the simulation with a certain amount of Wealth in
their account, for which a range of values is specified at the Subpopulation level
(initialAccountDist). From then on, in general, there are three potential sources of
Income:
a) Land Managers can obtain income from harvesting each of their Land Parcels and selling the
crop in the market. The amount of Yield obtained in a Land Parcel for a particular crop in
model1-1-5 depends on two factors: the (local) Biophysical Characteristics of the Land Parcel,
and the (global) Climatic conditions. Yield is then transformed in the (global) market into more or
less money depending on the (global) Economic conditions and running costs. The following
explains this process in detail.
From version 0-8-3 onwards, lookup tables have replaced earlier-used bitstrings as the means by
which economic returns from Land Use decisions are calculated. There are two lookup tables in
Created 2008-04-04
Modified 2008-04-18
Printed 2008-04-18
30
FEARLUS. One determines how much Yield is obtained from a particular Land Use decision,
which is predictably enough termed the ‘Yield lookup table’, the other is the ‘Gross Income
lookup table’, which determines the price received per unit Yield for each Land Use and state of
the Economy. The Yield lookup table provides the Yield per unit area for each combination of
Land Use, Climate and Biophysical Characteristics states. The set of symbols determining these
states is supplied in the filenames given in the yieldTreeFile and incomeTreeFile
parameters, and the names of the files containing the tables themselves in the
yieldTableFile and incomeTableFile parameters. The factors determining Yield and
Income are thus now completely under user control; these factors being set by the (arbitrary)
properties and symbols for each of the Biophysical Characteristics, Climate, Economy and Land
Use property value lists. Note, however, that the more such factors are included, the greater the
combinatorial demand for data.
Since Biophysical Characteristics vary at Cell level, the Yield lookup table is consulted in turn for
each Cell in the Parcel. The Yield for the Parcel is the sum of the Cell Yields. The Gross Income
for the Parcel is then the Parcel Yield multiplied by the appropriate entry in the Gross Income
lookup table. From the Parcel Gross Income, a value is subtracted for Parcel-scale costs, to give
the Parcel Net Income. This value is given by the product of the breakEvenThreshold
parameter (which represents a Parcel-scale break-even threshold per unit area, assuming no Land
Use Economy-of-Scale), the area of the Land Parcel, and the Economy-of-Scale of the Land Use.
The Economy-of-Scale is a factor in the range 0-1, determined by the Land Manager’s total area
allocated to a particular Land Use. If the Economy-of-Scale is 1, then there is no Economy-ofScale. Once the Parcel Net Income has been calculated for each Parcel owned by a Land
Manager, the Farm Scale Fixed Costs are subtracted from the total Parcel Net Income to give the
amount to increment the Land Manager’s Account by. This is summarised in the formula:
ΔAm =
[∑
p∈Pm
g (E , U p ) ⋅
(∑
c∈C p
)
]
a ⋅ y (Bc , C ,U p ) − b ⋅ a p ⋅ s (U p , z (U p , m )) − f
where Am is the Account of Land Manager m, Pm is the set of Land Parcels owned by Land
Manager m, E is the current state of the Economy, Up is the Land Use applied to Parcel p, g()
returns the Gross Income per unit Yield from the Gross Income lookup table, Cp is the set of Land
Cells belonging to Parcel p, a is the area of each cell (cellArea parameter), Bc is the
Biophysical Characteristics of Cell c, C is the current state of the Climate, y() returns the Yield
per unit area from the Yield lookup table, b is the Break Even Threshold per unit area
(breakEvenThreshold parameter), ap is the area of Parcel p (equal to a times the number of
cells p contains), z() returns the area currently allocated by Manager m to a particular Land Use, f
are the Farm Scale Fixed Costs (farmScaleFixedCosts parameter), and s() returns the
Economy-of-Scale due to an area α allocated by one Land Manager to a Land Use U as follows:
⎧1
⎪σ
⎪ U
⎪ σ1U
⎪⎪
s (U , α ) = ⎨σ U + (1 − σ U ) γ U − α
γ U − βU
⎪
⎪
1
⎪
α − βU
⎪1 + (σ U − 1)
⎪⎩
γ U − βU
σ U = 1; α ≤ β U
α ≥ γ U ,σ U < 1
α ≥ γ U ,σ U > 1
β U < α < γ U ,σ U < 1
β U < α < γ U ,σ U > 1
where βU, γU and σU parameterise the Economy-of-Scale function for Land Use U. If σU < 1, then
the Economy-of-Scale decreases linearly from 1 to σU as the area increases from βU to γU. If
Created 2008-04-04
Modified 2008-04-18
Printed 2008-04-18
31
σU > 1, then the Economy-of-Scale decreases as an inverse function of σU as the area increases
from βU to γU, from 1 to 1/ σU. *
(a)
(b)
Figure 16 — Sketches of the Economy-of-Scale curve. (a) σU < 1.
(b) σU > 1.
The Farm Scale Fixed Costs can be a constant, or they can be loaded from a file
(farmScaleFixedCostsFile parameter). If both the farmScaleFixedCosts and
farmScaleFixedCostsFile parameters are specified, then the values loaded from the file
will over-ride the farmScaleFixedCosts parameter. If the file contains fewer Farm Scale
Fixed Cost values than the number of Years in the simulation, a warning will be issued and the
value will remain constant at whatever the last value read from the file is once the end of the file
is reached.
b) Off-farm Income. This is determined by a normal distribution (truncated to have a minimum of
zero) for each Land Manager, with mean and variance each taken from uniform distributions at
Subpopulation level, in parameters offFarmIncomeMeanMin, offFarmIncomeMeanMax,
offFarmIncomeVarMin and offFarmIncomeVarMax.
c) The third potential source of Income for the Land Managers is the Government Agent
(governmentClass; governmentFile) in the model. Government Agents issue fines or
rewards to Land Managers according to policy goals. See section 4.3.
4.2.3
Social approval and disapproval
The social approval model in FEARLUS allows modelling Land Managers who are motivated by
more than financial reward. All classes of Land Manager except LandManager,
PositiveLandManager and DelayedChangeLandManager provide this functionality. The social
approval model in FEARLUS comprises a list of Triggers for each Land Manager, which are
rules that determine when and how much a Land Manager will Approve or Disapprove of another
Land Manager. Land Managers may only Approve or Disapprove of other Land Managers in their
social neighbourhood. The Trigger classes available in model 1-1-5 are explained in more detail
in section 11, and listed in Table 7. Each Trigger rule has as parameters the amount of Approval
or Disapproval the Land Manager will apply, according to whether the appropriate conditions are
met. These amounts can be set to zero where, for example, a rule that possibly issues both
Approval and Disapproval is required only to issue one of them; indeed, in many cases it would
be nonsense to do otherwise.
*
The Economy-of-Scale is thus unfortunately somewhat misnamed; from its name one would expect it to
increase with area, but since it is a multiplier of the Parcel’s Break-Even Threshold, it functions to reduce
fixed costs as a factor, which is how one would expect economies of scale to operate in general. If σU > 1,
then it is at least true that a larger σU means a larger economy of scale.
Created 2008-04-04
Modified 2008-04-18
Printed 2008-04-18
32
Trigger class
Configuration
parameters
Description
AllLowPollutionTrigger
PollutionThreshold
LandUseGroupTrigger
LandUseSymbols
NeighbourPollutionTrigger*
none
ThresholdPollutionTrigger
PollutionThreshold
WorseLUThanMeTrigger*
none
Approve of Land Managers whose Parcels all
have a pollution less than the specified
threshold.
Approve or disapprove of any aspect of the
Land Use applied by a Land Manager on a
Land Parcel. The LandUseSymbols parameter
is a comma-separated list of property/symbol
pairs belonging to the Land Use symbol group,
which, if they co-occur on a Parcel, will
activate the trigger. Combining several
instances of this Trigger allows for disjunction,
and potentially quite sophisticated approval
and disapproval rules for Land Use.
Approve of neighbours whose mean pollution
is less than the Land Manager, and disapprove
of those whose mean pollution is more.
Disapprove of a Land Manager if the pollution
exceeds the specified threshold on any of their
Land Parcels.
Find the most polluting Land Use used by the
Land Manager. Each neighbour using a more
polluting Land Use will be disapproved of, and
all other neighbours will be approved of.
Table 7 — A summary of the Trigger classes available. Starred classes
could consistently have non-zero settings for both approval and
disapproval.
4.2.4
Land Parcel transfer: ELMM0-2
If and only if the parameter allowEstateGrowth is equal to 1, Land Managers can own
multi-Parcel Estates. When this is allowed, the transfer of Land Parcels between Land Managers
is done using ELMM. ELMM stands for Endogenised Land Market Model. ELMM0-1 is
discussed in a paper to ESSA 2005 (Polhill, Parker & Gotts 2005). ELMM0-2 consists of a minor
upgrade to that model. In ELMM, rather than exchanging Land Parcels using a fixed price as in
FEARLUS, Land Managers bid for their Land Parcels in an auction.
Land Managers are divided into Subpopulations according to their decision-making processes.
Each Subpopulation is defined by a set of parameters that determine how its member Land
Managers will decide a Land Use for each Land Parcel (see section 4.2.1) and how they will
make decisions about acquiring Land Parcels. This section pertains to the latter.
The rules for transfer of Land Parcels depend in part on which class of Land Manager is being
used by a Subpopulation. The PositiveLandManager class has a slight difference from all of the
other classes. Land Managers from the PositiveLandManager class who have non-positive
accrued Wealth are regarded as being bankrupt, and must sell off all their Land Parcels; whilst
those from all the other classes must sell off their Land Parcels if they have negative Wealth. *
Land Managers may also sell up with a certain probability, even if they do not have negative
Wealth, determined using a distribution in the Subpopulation (pSellUpDist, pSellUpMin,
pSellUpMax, pSellUpMean, pSellUpVar). Since these are the only restrictions on the
*
The PositiveLandManager class was created to explore whether any of the issues raised in Edmonds and
Hales (2003) applied to FEARLUS.
Created 2008-04-04
Modified 2008-04-18
Printed 2008-04-18
33
length of time a Land Manager may spend in the simulation, a Land Manager is better thought of
as representing a farming business or family, than an individual farmer.
Bidding Strategy class
Configuration
options
Description
DiscountingBiddingStrategy
rateDist,
rateMin,
rateMax,
rateMean,
rateVar,
windowMin,
windowMax,
lpwgtMin,
lpwgtMax
The bid price, bmp, of Land Manager m for
Parcel p is given by the following formula:
FixedPriceBiddingStrategy
WealthMultipleBiddingStrategy
YieldMultipleBiddingStrategy
priceDist,
priceMin,
priceMax,
priceMean,
priceVar
wealthcDist,
wealthcMin,
wealthcMax,
wealthcMean,
wealthcVar
yieldcDist,
yieldcMin,
yieldcMax,
yieldcMean,
yieldcVar
bmp =
(1 − wm )Pm − wm (y p − T )
rm
where lpwgtMin ≤ wm ≤ lpwgtMax represents
how much Manager m is concerned with the
Parcel’s Yield or their own profit when
making bids, yp is the Yield of Parcel p, T is
the Break Even Threshold, rm is the Land
Manager’s ‘interest rate’ or perceived risk,
sampled from rateDist (‘normal’ or
‘uniform’), and Pm is the mean profit the
Manager has made over the last nm Years,
where windowMin ≤ nm ≤ windowMax
The bid price is a fixed price. Each Land
Manager has their own fixed, constant price
offered, taken from the Subpopulation
distribution priceDist (‘normal’ or ‘uniform’)
The bid price is a constant multiple of the
Land Manager’s account. The coefficient is
taken from the Subpopulation distribution
wealthcDist (‘normal’ or ‘uniform’)
The bid price is a constant multiple of the
most recent Yield of the Land Parcel for sale.
The coefficient is taken from the
Subpopulation
distribution
yieldcDist
(‘normal’ or ‘uniform’)
Table 8 — The Bidding Strategies available and their configuration
parameters.
All Land Managers in the neighbourhood of a Land Parcel being put up for sale are notified of the
availability of the Land Parcel. If the socialNeighbourSales parameter is 1, then the social
neighbourhood is used, otherwise the physical neighbourhood is used. Each Land Manager has an
individual Land Offer Threshold, which specifies the amount of Wealth they must have before
they will consider putting in a bid for a Land Parcel. Assuming the Land Offer Threshold is
exceeded, Land Managers then proceed to make a bid price for the Land Parcel using a Bidding
Strategy. If the bid price is negative, the potential bid is ignored. From this set of potential bids, a
Land Parcel Selection Strategy is then used to choose which bids will actually be made. The total
of all bids made must ensure the Land Offer Threshold is still in the Land Manager’s Account.
The Land Allocator is then notified of all the bids made. If a bid is negative or zero, the Land
Allocator ignores it.
The Bidding and Selection Strategies available are listed in Table 8 and Table 9. Note that the
configuration options for the Bidding Strategies apply at the Subpopulation level, defining
Created 2008-04-04
Modified 2008-04-18
Printed 2008-04-18
34
distributions for parameters of member Land Managers that, once set for an individual Land
Manager, do not change.
Selection Strategy class
Description
BuyCheapestSelectionStrategy
Intended to represent an acquisitive strategy for accumulation
of Land, Managers using this strategy bid for the Parcels they
give the least value to. This is a bit odd, however, as
presumably the bids will not be particular competitive, and if
the Manager did win, the Parcels themselves are not estimated
by the Manager to have much value.
Managers using this strategy bid for the Parcels they value
most highly first.
A random selection of bids is made. Note that some Bidding
Strategies (such as Wealth Multiple) do not discriminate
among Land Parcels.
BuyDearestSelectionStrategy
RandomSelectionStrategy
Table 9 — The Land Parcel Selection Strategies available.
Figure 17 — UML Activity Diagram summarising some of the
transactions and parameters involved in the transfer of a Land Parcel
from one Land Manager to another.
Once the Land Allocator has received all the bids from existing Land Managers for a Land Parcel,
it generates an in-migrant bid from a randomly chosen Subpopulation, using that Subpopulation’s
In-migrant Offer Price Distribution. Note that if a large Estate is for sale, and the
socialNeighbourSales parameter is 0, then all Parcels in the middle of the Estate (i.e.
those not physically neighbouring a Parcel owned by another Land Manager) will be sold to inmigrant Land Managers. The winning bid is then the largest bid made (or if two or more bids
have equal maximum offer price, then a uniform random choice is made among them). The Land
Created 2008-04-04
Modified 2008-04-18
Printed 2008-04-18
35
Manager making the winning bid is then the new owner of the Land Parcel. If a Vickrey auction
has been specified, then the price of the exchange is that of the second-highest bidder. If only one
bid is made in a Vickrey auction, or if a first price sealed bid auction is specified (by setting the
vickrey parameter to 0), then the winning bid price is the price of the exchange. The process is
summarised in Figure 17, though this is not a comprehensive depiction.
4.3
The Government Agent
The Government Agent offers the possibility of implementing policies designed to influence Land
Managers’ Land Use decisions. There is no direct communication between Land Managers and
the Government during the decision-making process to find out what actions they can take to
increase their chance of obtaining an award or reduce their chance of being fined. Despite this, the
Government can still influence behaviour in those Land Manager classes where Financial
Aspirations are based on Profit rather than returns from individual Land Parcels. The Government
Agent classes (governmentClass; governmentFile) implemented in model1-1-5 are
listed in what follows, and summarised in Table 10.
Government class
Description
BudgetClusterActivityGovernment
As per ClusterActivityGovernment, but rewards are
given as a share of a fixed Budget.
As per RewardActivityGovernment, but rewards are
given as a share of a fixed Budget.
As per TargetActivityGovernment, but rewards are
given as a share of a fixed Budget.
As per TargetClusterActivityGovernment, but rewards
are given as a share of a fixed Budget.
As per BudgetClusterActivityGovernment, but with a
Cap on the reward a Manager can receive.
As per BudgetRewardActivityGovernment, but with a
Cap on the reward a Manager can receive.
As per BudgetTargetActivityGovernment, but with a
Cap on the reward a Manager can receive.
As per BudgetTargetClusterActivityGovernment, but
with a Cap on the reward a Manager can receive.
As per ClusterActivityGovernment, but with a Cap on
the reward a Manager can receive.
As per RewardActivityGovernment, but with a Cap on
the reward a Manager can receive.
As per TargetActivityGovernment, but with a Cap on the
reward a Manager can receive.
As per TargetClusterActivityGovernment, but with a
Cap on the reward a Manager can receive.
A reward is issued for using an awardable Land Use,
with extra if neighbours have the same Use.
A limited number of awards are made to Managers
where a minimum number of contiguous Parcels have
the same Land Use.
A reward is issued to every Land Manager for each
Parcel they own if the Pollution is less than a threshold.
A reward is issued for each Land Parcel using an
awardable Land Use.
A reward is issued to every Land Manager if the total
Pollution is less than a threshold.
As per NbrSubsetActivityGovernment, with awards
BudgetRewardActivityGovernment
BudgetTargetActivityGovernment
BudgetTargetClusterActivityGovernment
CappedBudgetClusterActivityGovernment
CappedBudgetRewardActivityGovernment
CappedBudgetTargetActivityGovernment
CappedBudgetTargetClusterActivityGovernment
CappedClusterActivityGovernment
CappedRewardActivityGovernment
CappedTargetActivityGovernment
CappedTargetClusterActivityGovernment
ClusterActivityGovernment
NbrSubsetActivityGovernment
ParcelRewardingGovernment
RewardActivityGovernment
RewardingGovernment
SortNbrSubsetActivityGovernment
Created 2008-04-04
Modified 2008-04-18
Printed 2008-04-18
36
Government class
SortSubsetActivityGovernment
SubsetActivityGovernment
TargetActivityGovernment
TargetClusterActivityGovernment
Description
made in descending order of the number of awards
Managers would have received without the limit.
As per SubsetActivityGovernment, but the limited
awards are made to Managers in descending order of
number of awards they would have received without the
limit.
As per RewardActivityGovernment, but with a limit on
the number of awards that will be made.
As per RewardActivityGovernment, but rewards are
issued for a Land Use until a target coverage is reached.
As per ClusterActivityGovernment, but rewards are
issued for a Land Use until a target coverage is reached.
Table 10 — The Government classes available.
Many of the classes allow the policy (rewards or fines) to be issued within a restricted zone. The
Zone parameter provides various ways for this to be specified; for details, refer to section 5.1.14.
4.3.1
Government classes implementing a reward for Land Uses
The following classes of Government offer various ways of issuing rewards to Land Managers for
using particular Land Uses. Some of the classes may also be configured to fine Managers for
using particular Land Uses.
4.3.1.1
Government class: RewardActivityGovernment
Description
Parameter
Zone:…
LandUse: label reward
4.3.1.2
Issues a specified reward to Land Managers based on the Land Uses
they apply.
Parameter description
The zone in which to issue a reward (default everywhere).
For each awardable Land Use, a reward per unit area should be
specified. Negative rewards are treated as fines.
Government class: BudgetRewardActivityGovernment
Description
Parameter
Zone:…
LandUse: label reward
Budget: budget
Issues rewards as a share of a fixed budget, which must be spent
(unless no-one is awardable).
Parameter description
The zone in which to issue rewards (default everywhere).
For each awardable Land Use, the associated reward parameter
specifies a weight per unit area of the budget the Land Manager will
get. Negative rewards are treated as fines, implemented as specified.
The budget to use. A Land Manager (m)’s reward r(m, p) for the use of
Land Use u(p) on land parcel p is given by:
r (m, p ) = a p ru ( p )
b
∑q aq ru (q )
where ap is the area of p, ru(p) is the reward weight for Land Use u(p)
specified by the reward parameter associated with the Land Use
(default 0), b is the budget, and q iterates over all awarded Land
Parcels in the policy zone to get the total reward weight.
Created 2008-04-04
Modified 2008-04-18
Printed 2008-04-18
37
4.3.1.3
Government class: CappedRewardActivityGovernment
Description
Parameter
Zone:…
LandUse: label reward
Cap: cap
4.3.1.4
Government class: CappedBudgetRewardActivityGovernment
Description
Parameter
Zone:…
LandUse: label reward
Budget: budget
Cap: cap
4.3.2
Issues rewards, but with a cap on the total amount any one Land
Manager may receive.
Parameter description
The zone in which to issue rewards (default everywhere).
For each awardable Land Use, the associated reward parameter
specifies the reward the Land Manager will get (subject to a cap).
Negative rewards are treated as fines, implemented as specified.
Specify the maximum amount any Land Manager will receive.
Issues rewards as shares of a fixed budget (see 4.3.1.2), but with a cap
on the total amount any one Land Manager may receive.
Parameter description
The zone in which to issue rewards (default everywhere).
For each awardable Land Use, the associated reward parameter
specifies a weight per unit area of the budget the Land Manager will
get. Negative rewards are treated as fines, implemented as specified.
Specify the budget the Government has to spend
Specify the maximum amount any Land Manager will receive.
Government classes issuing limited rewards for Land Uses
The following classes reward certain Land Uses where they are applied to Land Parcels, but with
a limit on the number of rewards that will be made. With these classes, therefore, Land Managers’
can affect each others’ potential for being rewarded for their Land Use decisions. In the
NbrSubsetActivityGovernment and SortNbrSubsetActivityGovernment classes, there is the
further potential in that rewards are not given unless a Parcel is part of a contiguous set of at least
a specified number of Parcels using the same Land Use.
4.3.2.1
Government class: SubsetActivityGovernment
Description
Parameter
Zone:…
LandUse: label reward
MaxNRewards: max
4.3.2.2
Government class: SortSubsetActivityGovernment
Description
Parameter
Zone:…
LandUse: label reward
MaxNRewards: max
4.3.2.3
Issues rewards as specified for each Land Use, but only a (random) set
of n rewards will be issued.
Parameter description
The zone in which to issue rewards (default everywhere).
For each awardable Land Use, the associated reward parameter
specifies the reward per unit area to give, if the reward is chosen to be
given. Negative rewards are treated as fines, implemented as specified.
Specify the number of rewards to be given.
Issues rewards as specified for each Land Use, but a subset of rewards
will be made, in descending order of number of awards per Land
Manager.
Parameter description
The zone in which to issue rewards (default everywhere).
For each awardable Land Use, the associated reward parameter
specifies the reward per unit area to give, if the reward is chosen to be
given. Negative rewards are treated as fines, implemented as specified.
Specify the number of rewards to be given.
Government class: NbrSubsetActivityGovernment
Description
Issues rewards as specified for each Land Use on those Parcels with at
Created 2008-04-04
Modified 2008-04-18
Printed 2008-04-18
38
Parameter
Zone:…
LandUse: label reward
MaxNRewards: max
MinNNeighbours: min
4.3.2.4
Government class: SortNbrSubsetActivityGovernment
Description
Parameter
Zone:…
LandUse: label reward
MaxNRewards: max
MinNNeighbours: min
4.3.3
least n neighbours having the same Land Use. There is a limit on the
number of awards that can be made. Rewards are selected randomly.
Parameter description
The zone in which to issue rewards (default everywhere).
For each awardable Land Use, the associated reward parameter
specifies the reward per unit area to give, if the reward is chosen to be
given. Negative rewards are treated as fines, implemented as specified.
Specify the number of rewards to be given.
The minimum number of neighbouring Parcels required having the
same Land Use before the reward will be given.
Issues rewards as specified for each Land Use on those Parcels with at
least n neighbours having the same Land Use. There is a limit on the
number of awards that can be made. Rewards are made in descending
order of number of neighbours having the same Land Use.
Parameter description
The zone in which to issue rewards (default everywhere).
For each awardable Land Use, the associated reward parameter
specifies the reward per unit area to give, if the reward is chosen to be
given. Negative rewards are treated as fines, implemented as specified.
Specify the number of rewards to be given.
The minimum number of neighbouring Parcels required to have the
same Land Use before the reward will be given.
Reward for Land Uses with a target coverage
The Government classes in this section issue rewards to Land Managers to achieve a target
coverage for certain Land Uses. Rewards are issued only when the target coverage for an
awardable Land Use is not achieved.
4.3.3.1
Government class: TargetActivityGovernment
Description
Parameter
Zone:…
LandUse: label target%
Reward: reward
4.3.3.2
Issues a fixed reward for any Land Use the coverage of which in the
policy zone is less than a target
Parameter description
The zone in which to issue rewards (default everywhere).
For each awardable Land Use, gives the target coverage.
The reward per unit area to be given for any awardable Land Use when
the coverage is less than the target.
Government class: BudgetTargetActivityGovernment
Description
Parameter
Zone:…
LandUse: label target%
Reward: reward
Budget: budget
Issues a fixed reward for any Land Use the coverage of which in the
policy zone is less than a target, with a fixed budget that must get
spent.
Parameter description
The zone in which to issue rewards (default everywhere).
For each awardable Land Use, gives the target coverage.
The reward share per unit area to be given for any awardable Land Use
when the coverage is less than the target. (In fact, this parameter is
irrelevant. Since the rewards are the same for each Land Use, all that
matters is the number of rewards and the area of the Parcel.)
The budget to use for the awards.
Created 2008-04-04
Modified 2008-04-18
Printed 2008-04-18
39
4.3.3.3
Government class: CappedTargetActivityGovernment
Description
Parameter
Zone:…
LandUse: label target%
Reward: reward
Cap: cap
4.3.3.4
Government class: CappedBudgetTargetActivityGovernment
Description
Parameter
Zone:…
LandUse: label target%
Reward: reward
Budget: budget
Cap: cap
4.3.4
Issues a fixed reward for any Land Use the coverage of which in the
policy zone is less than a target, with cap on the reward that a Land
Manager can receive in a Year.
Parameter description
The zone in which to issue rewards (default everywhere).
For each awardable Land Use, gives the target coverage.
The reward per unit area to be given for any awardable Land Use when
the coverage is less than the target, subject to the cap.
The upper limit on any one Land Manager’s total reward for the Year.
Issues a fixed reward for any Land Use the coverage of which in the
policy zone is less than a target, with a fixed budget that must get
spent, subject to a cap.
Parameter description
The zone in which to issue rewards (default everywhere).
For each awardable Land Use, gives the target coverage.
The reward share per unit area to be given for any awardable Land Use
when the coverage is less than the target. (In fact, this parameter is
irrelevant. Since the rewards are the same for each Land Use, all that
matters is the number of rewards and the area of the Parcel.)
The budget to use for the awards.
The cap on the total reward a Land Manager can receive in a Year.
Reward Land Uses in a contiguous cluster
The following is a series of Government classes that encourage clusters of contiguous areas of
Land Uses, but in a slightly different manner to the NbrSubsetActivityGovernment and
SortNbrSubsetActivityGovernment classes. Here, Managers are given an award even if an
awardable Land Use is not part of a contiguous cluster of Parcels having the same Land Use.
However, encouragement for Land Uses in a contiguous area is given through offering an extra
award for neighbouring Parcels having the same Land Use.
4.3.4.1
Government class: ClusterActivityGovernment
Description
Parameter
Zone:…
LandUse: label
Reward: reward
NbrReward: nbr
4.3.4.2
Land Managers are awarded for putting awardable Land Uses on
Parcels where this will contribute to increasing the contiguous area
devoted to a Land Use. Land Managers are given a reward for using an
awardable Land Use on any Parcel they own, and then extra if the
awardable Land Use is used by a neighbouring Manager on a
neighbouring Parcel.
Parameter description
The zone in which to issue rewards (default everywhere).
List of awardable Land Uses.
The reward per unit area to be given for any awardable Land Use on a
Parcel owned by the Manager.
The reward per unit area to be given for any awardable Land Use on a
neighbouring Parcel using the same Land Use as the Manager’s.
Government class: BudgetClusterActivityGovernment
Description
Land Managers are awarded for putting awardable Land Uses on
Created 2008-04-04
Modified 2008-04-18
Printed 2008-04-18
40
Parameter
Zone:…
LandUse: label
Reward: reward
NbrReward: nbr
Budget: budget
4.3.4.3
Government class: CappedClusterActivityGovernment
Description
Parameter
Zone:…
LandUse: label
Reward: reward
NbrReward: nbr
Cap: cap
4.3.4.4
Parcels where this will contribute to increasing the contiguous area
devoted to a Land Use. Land Managers are given a reward for using an
awardable Land Use on any Parcel they own, and then extra if the
awardable Land Use is used by a neighbouring Manager on a
neighbouring Parcel. Rewards are made as shares of a fixed budget
that must be spent if any reward is made.
Parameter description
The zone in which to issue rewards (default everywhere).
List of awardable Land Uses.
The reward share per unit area to be given for any awardable Land Use
on a Parcel owned by the Manager.
The reward share per unit area to be given for any awardable Land Use
on a neighbouring Parcel using the same Land Use as the Manager’s.
The budget
Land Managers are awarded for putting awardable Land Uses on
Parcels where this will contribute to increasing the contiguous area
devoted to a Land Use. Land Managers are given a reward for using an
awardable Land Use on any Parcel they own, and then extra if the
awardable Land Use is used by a neighbouring Manager on a
neighbouring Parcel. There is a cap on the total reward any one Land
Manager may receive in a Year.
Parameter description
The zone in which to issue rewards (default everywhere).
List of awardable Land Uses.
The reward per unit area to be given for any awardable Land Use on a
Parcel owned by the Manager.
The reward per unit area to be given for any awardable Land Use on a
neighbouring Parcel using the same Land Use as the Manager’s.
The maximum reward a Manager may receive per Year.
Government class: BudgetClusterActivityGovernment
Description
Parameter
Zone:…
LandUse: label
Reward: reward
NbrReward: nbr
Budget: budget
Cap: cap
Land Managers are awarded for putting awardable Land Uses on
Parcels where this will contribute to increasing the contiguous area
devoted to a Land Use. Land Managers are given a reward for using an
awardable Land Use on any Parcel they own, and then extra if the
awardable Land Use is used by a neighbouring Manager on a
neighbouring Parcel. Rewards are made as shares of a fixed budget
that must be spent if any reward is made, with the exception that there
is a cap on the total reward a Land Manager may receive per Year.
Parameter description
The zone in which to issue rewards (default everywhere).
List of awardable Land Uses.
The reward share per unit area to be given for any awardable Land Use
on a Parcel owned by the Manager.
The reward share per unit area to be given for any awardable Land Use
on a neighbouring Parcel using the same Land Use as the Manager’s.
The budget
The cap
Created 2008-04-04
Modified 2008-04-18
Printed 2008-04-18
41
4.3.5
Reward Land Uses in a cluster with a target coverage
These classes of Government combine a target coverage for certain Land Uses with a preference
for these Land Uses to be in a contiguous cluster. To encourage the target coverage of the Land
Uses to be maintained once achieved, rewards to Managers made before the target was achieved
are maintained.
4.3.5.1
Government class: TargetClusterActivityGovernment
Description
Parameter
Zone:…
LandUse: label target%
Reward: reward
NbrReward: nbr
4.3.5.2
Government class: BudgetTargetClusterActivityGovernment
Description
Parameter
Zone:…
LandUse: label target%
Reward: reward
NbrReward: nbr
Budget: budget
4.3.5.3
Land Managers are awarded for putting awardable Land Uses on
Parcels where this will contribute to increasing the contiguous area
devoted to a Land Use until a target coverage of the Land Use is
reached. Land Managers are given a reward for using an awardable
Land Use on any parcel they own, and then extra if the awardable
Land Use is used by a neighbouring Manager on a neighbouring
Parcel. However, the Government has a target coverage for each Land
Use, which if exceeded, means that any Land Manager not awarded for
that Land Use in the previous year cannot be awarded for the Land Use
in this Year (even if Managers awarded in the previous Year have
changed activity).
Parameter description
The zone in which to issue rewards (default everywhere).
List of awardable Land Uses.
The reward per unit area to be given for any awardable Land Use on a
Parcel owned by the Manager.
The reward per unit area to be given for any awardable Land Use on a
neighbouring Parcel using the same Land Use as the Manager’s.
Land Managers are rewarded for putting awardable Land Uses on
Parcels where this will contribute to increasing the contiguous area
devoted to a Land Use until a target coverage of the Land Use is
reached. Land Managers are given a reward for using an awardable
Land Use on any Parcel they own, and then extra if the awardable
Land Use is used by a neighbouring Manager on a neighbouring
Parcel. However, the Government has a target coverage for each Land
Use, which if exceeded, means that any Land Manager not awarded for
that Land Use in the previous Year cannot be awarded for the Land
Use in this Year (even if Managers awarded in the previous Year have
changed activity). Rewards are divided as shares of a fixed budget.
Parameter description
The zone in which to issue rewards (default everywhere).
List of awardable Land Uses.
The reward per unit area to be given for any awardable Land Use on a
Parcel owned by the Manager.
The reward per unit area to be given for any awardable Land Use on a
neighbouring Parcel using the same Land Use as the Manager’s.
The budget
Government class: CappedTargetClusterActivityGovernment
Description
Land Managers are awarded for putting awardable Land Uses on
Parcels where this will contribute to increasing the contiguous area
devoted to a Land Use until a target coverage of the Land Use is
Created 2008-04-04
Modified 2008-04-18
Printed 2008-04-18
42
Parameter
Zone:…
LandUse: label target%
Reward: reward
NbrReward: nbr
Cap: cap
4.3.5.4
Government class: CappedBudgetTargetClusterActivityGovernment
Description
Parameter
Zone:…
LandUse: label target%
Reward: reward
NbrReward: nbr
Budget: budget
Cap: cap
4.3.6
reached. Land Managers are given a reward for using an awardable
Land Use on any Parcel they own, and then extra if the awardable
Land Use is used by a neighbouring Manager on a neighbouring
Parcel. However, the Government has a target coverage for each Land
Use, which if exceeded, means that any Land Manager not awarded for
that Land Use in the previous Year cannot be awarded for the Land
Use in this Year (even if Managers awarded in the previous Year have
changed activity). There is a maximum total reward a Manager can
receive per Year.
Parameter description
The zone in which to issue rewards (default everywhere).
List of awardable Land Uses.
The reward per unit area to be given for any awardable Land Use on a
Parcel owned by the Manager.
The reward per unit area to be given for any awardable Land Use on a
neighbouring Parcel using the same Land Use as the Manager’s.
The cap
Land Managers are awarded for putting awardable Land Uses on
Parcels where this will contribute to increasing the contiguous area
devoted to a Land Use until a target coverage of the Land Use is
reached. Land Managers are given a reward for using an awardable
Land Use on any Parcel they own, and then extra if the awardable
Land Use is used by a neighbouring Manager on a neighbouring
Parcel. However, the Government has a target coverage for each Land
Use, which if exceeded, means that any Land Manager not awarded for
that Land Use in the previous Year cannot be awarded for the Land
Use in this Year (even if Managers awarded in the previous Year have
changed activity). Rewards are divided as shares of a fixed budget,
subject to a cap.
Parameter description
The zone in which to issue rewards (default everywhere).
List of awardable Land Uses.
The reward per unit area to be given for any awardable Land Use on a
Parcel owned by the Manager.
The reward per unit area to be given for any awardable Land Use on a
neighbouring Parcel using the same Land Use as the Manager’s.
The budget
The cap
Government classes aimed at controlling pollution
These Government classes all work on a similar basis: issuing a reward if total pollution is below
a threshold. This can create a social dilemma, since Land Managers individually might have
incentives to ignore the pollution created by applying certain Land Uses (since their Land Use
decisions are not likely to determine whether they are going to get the reward or not), but if they
all do so, they might not get the reward at all, and consequently they may end up worse off than if
they had chosen more environmentally friendly Land Uses (and had got the reward). Rewards per
Land Parcel, rather than per Land Manager, would be more in line with current environmental
schemes (e.g. CAP reform).
Created 2008-04-04
Modified 2008-04-18
Printed 2008-04-18
43
4.3.6.1
Government class: RewardingGovernment
Description
Parameter
Reward: reward
PollutionThreshold: pt
4.3.6.2
Government class: ParcelRewardingGovernment
Description
Parameter
Reward: reward
PollutionThreshold: pt
4.4
The reward is issued to all Land Managers if the total pollution from
the Land Uses applied to the Environment is less than the pollution
threshold.
Parameter description
The reward to be given to each Manager if the pollution threshold is
met.
The threshold below which the reward will be given.
The reward is issued to all Land Managers for each Land Parcel they
own if the total pollution from the Land Uses applied to the
Environment is less than the pollution threshold.
Parameter description
The reward per Parcel to be given to each Manager if the pollution
threshold is met.
The threshold below which the reward will be given.
Schedule
The model contains two schedules, one to run during initialisation, the other to run thereafter. The
main difference between the two (apart from the creation of various objects) is that Land
Managers do not accrue Wealth or exchange Land Parcels during the initialisation schedule, and
they use a different strategy to decide the Land Use. Before starting the initial schedule, the
following actions are undertaken to build the simulation:
•
•
•
•
•
4.4.1
•
Create the Environment.
Create the Land Allocator.
Create the Land Cells and Land Parcels. If a grid file is specified, exists, and contains the
FEARLUS-LandParcelID layer, then allocate Cells to Parcels as per this layer. Otherwise
use the parameters to allocate Cells to Parcels. If a grid file was specified, exists and
contains a FEARLUS-Biophys X layer (where X is a Biophysical Characteristics symbol
property name) then allocate Biophysical Characteristics as per that layer. Otherwise, or
for all Biophysical Characteristics not specified in the grid file, assign each Cell random
initial Biophysical Characteristics, with each symbol within a property having equal
probability of being selected for each Cell. If a grid file has not been specified, then use
the clumper if specified. If a grid file is specified but does not exist, then write the Land
Parcel IDs and Biophysical Characteristics to the grid file.
Create the Land Uses. If a Land Use file has been specified and it exists, then load the
Land Use property value lists, and their associated pollution and economy of scale from
the Land Use file. If the nLandUse parameter is 0 or equal to the number of possible
Land Uses given the symbols in each property, then create all the possible Land Uses
from the set of symbols in each property assigned to the Land Use concept. Otherwise,
create the specified Land Uses using random choices of symbols for each property.
Assign the Land Uses a random pollution from a normal distribution specified by the
pollutionMean and pollutionVar parameters, and no economy of scale.
Create the Government.
Initial schedule
Determine the initial Climate, which may involve it being loaded from a file if a file
name was given and the file exists. If a file name was given but the file does not exist, the
Climate property value lists will be saved to that file each cycle.
Created 2008-04-04
Modified 2008-04-18
Printed 2008-04-18
44
•
•
•
•
•
•
•
•
•
4.4.2
•
•
•
•
•
•
•
•
•
•
•
•
•
•
•
•
5
Determine the initial Economy, which may involve it being loaded from a file if a file
name was given and the file exists. If a file name was given but the file does not exist, the
Economy property value lists will be saved to that file each cycle.
Create the Land Managers and assign them to the Land Parcels and Subpopulations. If a
grid file is specified, exists, and contains the FEARLUS-SubPopulationID Initial or
FEARLUS-LandManagerID Initial layers, then this information will be used in the
assignment. Otherwise, parameters exist that allow Land Managers to be initially
assigned more than one Land Parcel. Essentially they specify the size of a rectangle of
Land Parcels to give to each Land Manager. A whole number of these rectangles must fit
into the Environment grid. If the grid file is specified but did not exist when the
simulation started, then the initial assignments of Land Managers to Land Parcels and
Subpopulations will be saved.
Each Land Manager then determines the initial Land Use of the Land Parcel(s) they own.
Determine the Pollution from each Land Parcel.
Calculate the Yield from each Land Parcel.
If a Government agent has been specified, then it undertakes its actions here.
Land Managers calculate the profit they would have made in the initialisation Year, in
case it is needed, but the profit is not accumulated to their Account.
If the user has requested a second seed to use after the initialisation schedule (with the -Z
option) then set the random generator to use that seed.
Activate the main schedule.
Main schedule
Increment the Year counter. (Each cycle in the model is intended to represent one year.)
The Land Allocator updates the Subpopulation probabilities if a sequence of
Subpopulation probabilities has been specified in a file.
Land Managers each choose a Land Use for the Land Parcels they own.
Determine the Climate (and save it to a file if this was specified).
Determine the Economy (and save it to a file if this was specified).
Determine the Pollution from each Land Parcel.
Calculate the Yield from each Land Parcel.
Conduct Government actions, if specified.
Land Managers accrue Wealth from their Land Parcels and Off-farm Income.
If the Land Managers belong to a class that implements the approval model, then
determine Approvals and Disapprovals.
Land Managers learn from their experience (e.g. CBR Managers update their Case Base).
Land Managers with negative Wealth (or in the case of PositiveLandManagers, nonpositive Wealth) put all their Land Parcels up for sale by informing the Land Allocator.
The Land Allocator notifies Land Managers neighbouring each Land Parcel for sale.
Neighbouring Land Managers generate any bids they wish to make for each Land Parcel
they have been notified of.
The Land Allocator conducts an auction, assigning a (possibly in-migrant) new Land
Manager to the Land Parcels.
Land Managers who sold all their Land Parcels are removed from the schedule.
Parameter files
In the following section, a bold Courier font is used to indicate text that must appear in the
file as is, whilst an italic Times font is used for text that should be replaced by some appropriate
value. Comments are in a red Arial Narrow font and should not appear in the file.
Created 2008-04-04
Modified 2008-04-18
Printed 2008-04-18
45
5.1
Model parameters
Many model parameters take double precision floating point values. Floating point arithmetic is a
means of doing calculations with non-integers and large numbers whilst using a finite number of
bits. In the case of double precision, this is typically an 8-byte word, or 64 bits. Clearly, using this
finite number of bits means that not all numbers between -1.7976931348623157E+308 and
+1.7976931348623157E+308 (see /usr/include/float.h) can be represented accurately. Trivially, in
fact, only 264 or just over 1019 such numbers can maximally be represented. Inevitably, therefore,
floating point arithmetic involves a degree of approximation. Whilst this may be acceptable for
most intents and purposes (double precision giving 15 significant figures of accuracy), there are
some quite simple cases where inaccuracies can occur (try comparing 0.4 + 0.4 + 0.4 – 0.4 – 0.4 –
0.4 with zero, for example). In non-linear applications, such as FEARLUS, where decisions
depend critically on such things as comparisons of floating point numbers with zero, even slight
inaccuracies can have unexpected emergent effects (Polhill, Izquierdo and Gotts 2006). These
inaccuracies can occur simply because the number in question has a recurring fraction in binary
notation (e.g. 0.4 = 0.0110 0110 …), or because a small number is added to a large number (e.g.
134217728 + 0.00000001 = 134217728). FEARLUS model 1-1-5 does not currently deal
effectively with such problems. In general they should be avoidable by ensuring that any floating
point parameters set to non-integral values use decimals that are sums of negative powers of two
— e.g. 0.5 (2-1), 0.75 (2-1 + 2-2), 0.1875 (2-3 + 2-4), and that the model is not left running for a huge
number of Years (which makes the sum of large and small numbers more likely to be an issue).
5.1.1
Model file
The model file is the main parameter file, and it is this that should be supplied as argument to the
–p flag on the command line. The ‘environmentType’ parameter needs a little explanation. The
value given is a string consisting of a Topology and Neighbourhood Function, separated by a
minus sign. The Topology may be one of ‘Global’, ‘Planar’, ‘HorizontalCylindrical’,
‘VerticalCylindrical’, or ‘Toroidal’. The Neighbourhood Function may be one of
‘TriangularVonNeumann’, ‘VonNeumann’, ‘HexagonalParallelogram’, ‘Moore’, or ‘Global’.
Thus examples for this parameter value are such strings as ‘Planar-VonNeumann’, ‘ToroidalHexagonalParallelogram’, or ‘HorizontalCylindrical-Moore’. The ‘Global’ Topology and
‘Global’ Neighbourhood are intended to be used exclusively together, in the environment type
‘Global-Global’. Combining the Global Topology or Neighbourhood with any other
Neighbourhood or Topology is an error, but will not cause the model to fail.
The ‘clumping’ parameter also needs some explanation. The value to use for this parameter is a
string in which the type of clumper and any parameters it needs are given. The format of this
string is clumper:param1=value1;param2=value2;…;paramN=valueN. Two clumpers are
available in model1-1-5: ‘SymbolSwappingClumper’, and ‘StateSwappingClumper’, described
earlier in this document. Both have one optional parameter ‘nCycles’ specifying how many times
to do a swap (by default 100). Examples of settings for the ‘clumping’ parameter are
‘StateSwappingClumper:Cycles=500’, or ‘SymbolSwappingClumper’.
If no clumping is
required, then the string ‘None’ should be used.
The model file format is given below:
@begin
environmentType
neighbourhoodRadius
yieldTreeLUpos
Environment type string, as described in the main text
Neighbourhood radius (integer)
The neighbourhoodRadius must be less than half of both
envXSize and envYSize. This is not validated, but violating this
constraint will result in invalid neighbourhoods being computed.
Position of Land Use group in Yield Tree (integer)
If the Land Use group is only described in the Income symbol tree
Created 2008-04-04
Modified 2008-04-18
Printed 2008-04-18
46
incomeTreeLUpos
climateGroupName
economyGroupName
landUseGroupName
biophysGroupName
yieldTreeFile
yieldTableFile
incomeTreeFile
incomeTableFile
alwaysUseProximity
clumping
envXSize
envYSize
nLandUse
landUseFile
useLandUseFile
economyFile
useEconomyFile
file, this says which group in the Yield lookup table file pertains to
Land Use symbols.
Position of Land Use group in Income Tree (integer)
If the Land Use group is only described in the Yield symbol tree
file, this says which group in the Income lookup table file pertains
to Land Use symbols.
Name of the group in the Yield symbol tree representing
the Climate.
Name of the group in the Income symbol tree representing
the Economy.
Name of the group in the Yield and Income symbol trees
representing the Land Use.
The Land Use group need only appear in one of the Yield and
Income symbol trees (though it must always appear in both
lookup tables). If absent from a symbol tree file, then the
yieldTreeLUpos or incomeTreeLUpos parameter should be used.
Name of the group in the Yield lookup table tree
representing the Biophysical Characteristics.
File name of the Yield symbol tree.
File name of the Yield lookup table.
File name of the Income symbol tree.
File name of the Income lookup table.
Whether or not to use Euclidean distance to judge the
similarity of Parcels’, rather than Biophysical
Characteristics, even if the Parcels being compared all
have one Cell each, or each use the same Biophysical
Characteristics on all their Cells.
Clumping algorithm to use and any parameter settings as
described in the main text
Number of horizontal cells to use in the Environment grid
(Integer)
Number of vertical cells to use in the Environment grid
(Integer)
Number of Land Uses (integer)
If zero or equal to the number of possible Land Use property
value lists, then all combinations of Land Use property symbols
will be available as Land Use options. Otherwise the specified
number of random Land Use property value lists will be
generated.
File to use to load (or save) Land Uses from
Flag indicating whether or not to use the landUseFile
The useLandUseFile and landUseFile parameters are used to
either load or save the Land Uses to. If useLandUseFile is 0, the
Land Uses are not loaded or saved, regardless of the value of
landUseFile. Otherwise, if landUseFile exists, the Land Uses are
loaded from the file, and if not, the Land Uses are saved.
File to use to load (or save) Economy property value lists
from
If the file contains fewer Years’ worth of Economy property value
lists than are used in the model run, then once those in the file
are used up random property value lists are generated using the
probabilities in economyChangeProbFile.
Flag indicating whether or not to use the economyFile
Created 2008-04-04
Modified 2008-04-18
Printed 2008-04-18
47
economyChangeProbFile
climateFile
useClimateFile
climateChangeProbFile
maxYear
infiniteTime
pollutionDist
pollutionMin
pollutionMax
pollutionMean
pollutionVar
subPopFile
breakEvenThreshold
farmScaleFixedCosts
farmScaleFixedCostsFile
vickrey
allowEstateGrowth
socialNeighbourSales
nInitXParcels
nInitYParcels
Again, the file won’t be used unless the corresponding ‘use…’
parameter = 1, and the load/save behaviour is the same.
File to load the Economy property value list change
probabilities from.
Unfortunately the economyChangeProbFile must exist and have
a valid format even if an existent economyFile has enough Years
of property value lists.
File to use to load (or save) Climate property value lists
from
Flag indicating whether or not to use the climateFile
climateFile behaviour is just the same as economyFile behaviour.
File to load the Climate property value list change
probabilities from.
Unfortunately the climateChangeProbFile must exist and have a
valid format even if an existent climateFile has enough Years of
property value lists.
Number of iterations of annual cycle
Essential for batch runs! The number entered here should
actually be one more than the maximum Year you want reported.
Flag indicating whether or not to run indefinitely (1 to run
indefinitely, 0 to use maxYear)
Must be 0 for batch runs!
Distribution from which to set the pollution of each Land
Use
This parameter should either be ‘normal’, ‘uniform’ or ‘none’.
Minimum pollution (floating point)
This parameter should only appear if ‘pollutionDist’ is ‘uniform’.
Maximum pollution (floating point)
This parameter should only appear if ‘pollutionDist’ is ‘uniform’.
Mean pollution (floating point)
This parameter should only appear if ‘pollutionDist’ is ‘normal’.
Pollution account variance (floating point)
This parameter should only appear if ‘pollutionDist’ is ‘normal’.
File to load Subpopulation contest data from
The number of Subpopulations is taken from this file.
Amount to subtract from Yield to get Wealth accrued to
Land Manager per unit area (floating point)
Fixed costs to apply at the farm scale (floating point)
File to load farm-scale fixed costs from
Whether or not to hold a Vickrey rather than a first-price
sealed bid auction for Land Parcels (Boolean)
Whether or not to allow Land Managers to own multiple
Land Parcels (Boolean)
Whether or not to use social rather than physical
neighbourhood of Parcels for sell when notifying potential
buyers (Boolean)
Number of initial horizontal Land Parcels to endow the
Land Managers created at the beginning of the run with
(integer)
envXSize must be an integer multiple of this parameter value.
The parameter is ignored if a grid file is being used in read mode
(i.e. to load any data at all).
Number of initial vertical Land Parcels to endow the Land
Created 2008-04-04
Modified 2008-04-18
Printed 2008-04-18
48
cellArea
xCellsPerParcel
yCellsPerParcel
xllcorner
yllcorner
gridFile
useGridFile
governmentClass
governmentFile
Managers created at the beginning of the run with
(integer)
envYSize must be an integer multiple of this parameter value.
The parameter is ignored if a grid file is being used in read mode
and contains the FEARLUS-LandParcelID layer.
Area of a Land Cell (floating point)
If Land Cells are not loaded from a grid file, the number of
horizontal Cells per Parcel (integer)
envYSize must be an integer multiple of this parameter value.
The parameter is ignored if a grid file is being used in read mode
and contains the FEARLUS-LandParcelID layer.
If Land Cells are not loaded from a grid file, the number of
vertical Cells per Parcel (integer)
envYSize must be an integer multiple of this parameter value.
The parameter is ignored if a grid file is being used in read mode
(i.e. to load any data at all).
Georeference for lower left X co-ordinate of the space
(floating point)
This parameter is ignored by FEARLUS, but is used when saving
grid files.
Georeference for lower left Y co-ordinate of the space
(floating point)
This parameter is ignored by FEARLUS, but is used when saving
grid files.
Name of a grid file to load or save spatial data to/from
If useGridFile=1 and the file does not exist, it will be created.
Whether or not to use the gridFile specified (Boolean)
Name of the class to use for the Government
Use NoGovernment if you don’t want a Government
File from which to load Government configuration
parameters
@end
5.1.2
Climate and Economy change probability files
The Climate and Economy change probability files both have the same format. They are used to
specify the probability of changing the Symbol in each Property. The format is given below:
NumberOfElements: Number of properties (integer)
The number entered here is the number of properties of the
relevant (Climate or Economy) group.
d Probability this property will change to a different symbol each Year (floating point)
The above line should appear the number of times indicated by
the NumberOfElements entry. Probabilities should be zero for
any property with only one symbol.
In earlier versions of FEARLUS it was possible to not have the Climate or Economy affect Yield
or Income by having zero length bitstrings. A similar effect can be achieved here in two ways.
One is to use a wildcard for all Climate or Economy properties in the appropriate lookup table
file. The other is to use a Climate or Economy with one property containing a single symbol.
Created 2008-04-04
Modified 2008-04-18
Printed 2008-04-18
49
5.1.3
Subpopulation contest file
The Subpopulation contest file specifies which Subpopulations will be competing for land
ownership in this run of the model. There are two slightly different formats for this file,
depending on whether you want to use a file of Subpopulation in-migrant probabilities with
varying values Year-on-Year, or whether the probabilities are to remain constant.
5.1.3.1
Subpopulation contest file format with constant in-migrant probabilities
NumberOfSubPopulations: Number of Subpopulations in the contest (integer)
ClassForSubPopulations: Subpopulation class name
One of the Subpopulation classes in Table 1.
SubPopulationFile SP file no (int): SP file name Probability: SP prob (float)
The above line should appear the number of times indicated by
the NumberOfSubPopulations entry. The Subpopulation file
number (SP file no) should start at 1 on the first
SubPopulationFile line and increase in steps of 1. SP prob is the
probability of choosing a new (in-migrant or initial) Land Manager
from that Subpopulation. The probabilities must sum to 1.
5.1.3.2
Subpopulation contest file format with variable in-migrant probabilities
NumberOfSubPopulations: Number of Subpopulations in the contest (integer)
ClassForSubPopulations: Subpopulation class name
One of the Subpopulation classes in Table 1.
SubPopulationProbabilityFile: Subpopulation probability file name
File to load in-migrant Subpopulation probabilities from.
SubPopulationFile SP file no (int): SP file name
The above line should appear the number of times indicated by
the NumberOfSubPopulations entry. The Subpopulation file
number (SP file no) should start at 1 on the first
SubPopulationFile line and increase in steps of 1.
The format of the Subpopulation probability file is a CSV format file with the following layout:
Year,Subpopulation 1 label,Subpopulation 2 label, ... etc. for each Subpopulation
0,Subpopulation 1 Year 0 probability,Subpopulation 2 Year 0 probability, ... etc.
Year 0 is the initialisation Year.
1,Subpopulation 1 Year 1 probability,Subpopulation 2 Year 1 probability, ... etc.
2,Subpopulation 1 Year 2 probability,Subpopulation 2 Year 2 probability, ... etc.
3,Subpopulation 1 Year 3 probability,Subpopulation 2 Year 3 probability, ... etc.
An entry for each Year is expected, even if the probabilities do
not change.
... etc.
If there are fewer Years of data in the file than the number of
Years in the simulation, then a warning will be issued, and the
values from the last Year in the file will be used for all further
Years.
Created 2008-04-04
Modified 2008-04-18
Printed 2008-04-18
50
5.1.4
Subpopulation file
The Subpopulation file contains details of the ranges of parameters that will be assigned to Land
Managers belonging to this Subpopulation. Some ranges of parameters can be specified using a
normal or a uniform distribution. In each of these cases, there will be a parameter called ‘…Dist’
that specifies which to use (the value for which should be either ‘normal’, ‘truncated-normal’ or
‘uniform’). If the ‘…Dist’ parameter is ‘uniform’, then the range of values is specified using the
corresponding ‘…Min’ and ‘…Max’ parameters, for ‘normal’ ‘...Dist’ parameter setting, the
‘…Mean’ and ‘…Var’ parameters should be used. The ‘truncated-normal’ distribution takes a
sample from a normal distribution using the ‘...Mean’ and ‘...Var’ parameters, but samples less
than a stipulated minimum are truncated to ‘...Min’, and greater than a stipulated maximum are
truncated to ‘...Max’.
Different Subpopulation classes require different parameters. The overall file format and common
parameters are described below, with additional parameters specific to each class in subsections
to follow.
@begin
label
colour
landManagerClass
initialAccountDist
initialAccountMin
initialAccountMax
initialAccountMean
initialAccountVar
biddingStrategyClass
biddingStrategyConfig
selectionStrategyClass
String containing a unique name for this Subpopulation
The label is optional — a label will be generated automatically if
none is specified. The label is of most use in GUI mode to tell the
Subpopulations apart on the graphs.
A colour to use for this Subpopulation (integer)
The colour is also optional, and only relevant in GUI mode.
Colours are preset in a colourmap, and they are indexed by this
integer, which should be a positive integer. Colours will be
automatically assigned to Subpopulations if not specified here.
The only reason to specify the colour is for consistency across a
number of runs.
Which class to use to represent the Land Managers.
This parameter depends on the class of Subpopulation to use.
Distribution from which to set the initial account of
member Land Managers
This parameter should either be ‘normal’, ‘truncated-normal’, or
‘uniform’.
Minimum initial account (floating point)
This parameter should only appear if ‘initialAccountDist’ is
‘uniform’ or ‘truncated-normal’.
Maximum initial account (floating point)
This parameter should only appear if ‘initialAccountDist’ is
‘uniform’ or ‘truncated-normal’.
Mean initial account (floating point)
This parameter should only appear if ‘initialAccountDist’ is
‘normal’ or ‘truncated-normal’.
Initial account variance (floating point)
This parameter should only appear if ‘initialAccountDist’ is
‘normal’ or ‘truncated-normal’.
Class to use for the Bidding Strategy of member Land
Managers
Refer to Table 8.
Configuration string for the Bidding Strategy
Refer to Table 8.
Class to use for the Land Parcel Selection Strategy of
member Land Managers
Created 2008-04-04
Modified 2008-04-18
Printed 2008-04-18
51
incomerPriceDist
incomerPriceMin
incomerPriceMax
incomerPriceMean
incomerPriceVar
landOfferDist
landOfferMin
landOfferMax
landOfferMean
landOfferVar
offFarmIncomeMeanMin
offFarmIncomeMeanMax
offFarmIncomeVarMin
offFarmIncomeVarMax
pSellUpDist
pSellUpMin
pSellUpMax
Refer to Table 9.
Distribution from which to set the in-migrant Land Parcel
Offer Price of member Land Managers
This parameter should either be ‘normal’, ‘truncated-normal’, or
‘uniform’.
Minimum in-migrant Land Parcel Offer Price (floating
point)
This parameter should only appear if ‘incomerPriceDIst’ is
‘uniform’ or ‘truncated-normal’.
Maximum in-migrant Land Parcel Offer Price (floating
point)
This parameter should only appear if ‘incomerPriceDist’ is
‘uniform’ or ‘truncated-normal’.
Mean in-migrant Land Parcel Offer Price (floating point)
This parameter should only appear if ‘incomerPriceDist’ is
‘normal’ or ‘truncated-normal’.
In-migrant Land Parcel Offer Price variance (floating
point)
This parameter should only appear if ‘incomerPriceDist’ is
‘normal’ or ‘truncated-normal’.
Distribution from which to set the Land Offer Threshold of
member Land Managers
This parameter should either be ‘normal’, ‘truncated-normal’ or
‘uniform’.
Minimum Land Offer Threshold (floating point)
This parameter should only appear if ‘landOfferDist’ is ‘uniform’ or
‘truncated-normal’.
Maximum Land Offer Threshold (floating point)
This parameter should only appear if ‘landOfferDist’ is ‘uniform’ or
‘truncated-normal’.
Mean Land Offer Threshold (floating point)
This parameter should only appear if ‘landOfferDist’ is ‘normal’ or
‘truncated-normal’.
Land Offer Threshold variance (floating point)
This parameter should only appear if ‘landOfferDist’ is ‘normal’ or
‘truncated-normal’.
Minimum mean Off Farm Income (floating point)
Maximum mean Off Farm Income (floating point)
Minimum Off Farm Income variance (floating point)
Maximum Off Farm Income variance (floating point)
Land Managers’ Off Farm Income distribution is normal, with
constant mean and variance sampled from the above uniform
distributions at the time they are created.
Distribution from which to set the sell-up probability of
member Land Managers
This parameter should either be ‘normal’, ‘truncated-normal’ or
‘uniform’.
Minimum sell-up probability (floating point)
This parameter should only appear if ‘landOfferDist’ is ‘uniform’ or
‘truncated-normal’.
Maximum sell-up probability (floating point)
This parameter should only appear if ‘landOfferDist’ is ‘uniform’ or
‘truncated-normal’.
Created 2008-04-04
Modified 2008-04-18
Printed 2008-04-18
52
Mean sell-up probability (floating point)
This parameter should only appear if ‘landOfferDist’ is ‘normal’ or
‘truncated-normal’.
pSellUpVar
Sell-up probability variance (floating point)
This parameter should only appear if ‘landOfferDist’ is ‘normal’ or
‘truncated-normal’.
You should now add parameters for the class of Subpopulation you wish to use, as per the subsections
below.
@end
pSellUpMean
5.1.4.1
SubPopulation and DelayedChangeSubPopulation classes
Defines Subpopulation parameters for LandManager, PositiveLandManager and
DelayedChangeLandManager classes. For the DelayedChangeSubPopulation class, additional
parameters should be specified, as detailed in section 5.1.4.2.
strategySelectorFile
memorySizeMin
memorySizeMax
neighbourWeightDist
neighbourWeightMin
neighbourWeightMax
neighbourWeightMean
neighbourWeightVar
imitateProbDist
imitateProbMin
imitateProbMax
imitateProbMean
imitateProbVar
The name of a file to get the strategies for this
Subpopulation from
The strategy selector file format is given later.
The minimum number of Years a member of this
Subpopulation will be able to recall Climate, Economy,
Yield and Land Use data for.
The maximum number of Years…
Distribution from which to set the neighbourhood
weighting of member Land Managers
This parameter should either be ‘normal’, ‘truncated-normal’, or
‘uniform’.
Minimum neighbourhood weighting (floating point)
This parameter should only appear if ‘neighbourWeightDist’ is
‘uniform’ or ‘truncated-normal’.
Maximum neighbourhood weighting (floating point)
This parameter should only appear if ‘neighbourWeightDist’ is
‘uniform’ or ‘truncated-normal’.
Mean neighbourhood weighting (floating point)
This parameter should only appear if ‘neighbourWeightDist’ is
‘normal’ or ‘truncated-normal’.
Neighbourhood weighting variance (floating point)
This parameter should only appear if ‘neighbourWeightDist’ is
‘normal’ or ‘truncated-normal’.
Distribution from which to set the probability of imitation
of member Land Managers
This parameter should either be ‘normal’, ‘truncated-normal’, or
‘uniform’.
Minimum imitation probability (floating point)
This parameter should only appear if ‘imitateProbDist’ is ‘uniform’
or ‘truncated-normal’.
Maximum imitation probability (floating point)
This parameter should only appear if ‘imitateProbDist’ is ‘uniform’
or ‘truncated-normal’.
Mean imitation probability (floating point)
This parameter should only appear if ‘imitateProbDist’ is ‘normal’
or ‘truncated-normal’.
Imitation probability variance (floating point)
This parameter should only appear if ‘imitateProbDist’ is ‘normal’
Created 2008-04-04
Modified 2008-04-18
Printed 2008-04-18
53
or ‘truncated-normal’.
Distribution from which to set the aspiration threshold of
member Land Managers
This parameter should either be ‘normal’, ‘truncated-normal’, or
‘uniform’.
aspirationThresholdMin
Minimum aspiration threshold (floating point)
This parameter should only appear if ‘aspirationThresholdDist’ is
‘uniform’ or ‘truncated-normal’.
aspirationThresholdMax
Maximum aspiration threshold (floating point)
This parameter should only appear if ‘aspirationThresholdDist’ is
‘uniform’ or ‘truncated-normal’.
aspirationThresholdMean
Mean aspiration threshold (floating point)
This parameter should only appear if ‘aspirationThresholdDist’ is
‘normal’ or ‘truncated-normal’.
aspirationThresholdVar
Aspiration threshold variance (floating point)
This parameter should only appear if ‘aspirationThresholdDist’ is
‘normal’ or ‘truncated-normal’.
neighbourNoiseDist
Distribution from which to set the neighbourhood noise of
member Land Managers
This parameter should either be ‘normal’, ‘truncated-normal’ or
‘uniform’.
neighbourNoiseMin
Minimum neighbourhood noise (floating point)
This parameter should only appear if ‘neighbourNoiseDist’ is
‘uniform’ or ‘truncated-normal’.
neighbourNoiseMax
Maximum neighbourhood noise (floating point)
This parameter should only appear if ‘neighbourNoiseDist’ is
‘uniform’ or ‘truncated-normal’.
neighbourNoiseMean
Mean neighbourhood noise (floating point)
This parameter should only appear if ‘neighbourNoiseDist’ is
‘normal’ or ‘truncated-normal’.
neighbourNoiseVar
Neighbourhood noise variance (floating point)
This parameter should only appear if ‘neighbourNoiseDist’ is
‘normal’ or ‘truncated-normal’.
changeNeighbourWeightDist Distribution from which to set the change neighbourhood
weighting of member Land Managers
This parameter should either be ‘normal’, ‘truncated-normal’ or
‘uniform’.
changeNeighbourWeightMin Minimum change neighbourhood weighting (floating point)
This
parameter
should
only
appear
if
‘changeNeighbourhoodWeightDist’ is ‘uniform’ or ‘truncatednormal’.
changeNeighbourWeightMax Maximum change neighbourhood weighting (floating
point)
This
parameter
should
only
appear
if
‘changeNeighbourhoodWeightDist’ is ‘uniform’ or ‘truncatednormal’.
changeNeighbourWeightMean Mean change neighbourhood weighting (floating point)
This
parameter
should
only
appear
if
‘changeNeighbourhoodWeightDist’ is ‘normal’ or ‘truncatednormal’.
changeNeighbourWeightVar Change neighbourhood weighting variance (floating point)
This
parameter
should
only
appear
if
‘changeNeighbourhoodWeightDist’ is ‘normal’ or ‘truncatednormal’.
aspirationThresholdDist
Created 2008-04-04
Modified 2008-04-18
Printed 2008-04-18
54
5.1.4.2
DelayedChangeSubPopulation class
The change delay is taken from a uniform distribution. DelayedChangeSubPopulations will also
use parameters in section 5.1.4.1.
changeDelayMin
changeDelayMax
5.1.4.3
Minimum number of Years a Manager will wait before
changing Land Use (integer)
Maximum number of Years a Manager will wait before
changing Land Use (integer)
CBRSocialSubPopulation, CBRStrategySubPopulation,
CBRAdviceSubPopulation and CBRDelayedChangeSubPopulation classes
Defines Subpopulation parameters for CBRSocialLandManager, CBRSocialParcelLandManager,
CBRStrategyLandManager, CBRNetApprovalLandManager, CBRFarmScaleProfitLandManager,
CBRAdviceLandManager
and
CBRDelayedChangeLandManager
classes.
For
CBRStrategySubPopulation, CBRAdviceSubPopulation and CBRDelayedChangeSubPopulation,
additional parameters are required, detailed in section 5.1.4.4. CBRAdviceSubPopulation and
CBRDelayedChangeSubPopulation require further parameters outlined in section 5.1.4.5.
CBRDelayedChangeSubPopulation has yet further parameters, in section 0.
triggerFile
eventFile
profitMinSalienceDist
profitMinSalienceMin
profitMinSalienceMax
profitMinSalienceMean
profitMinSalienceVar
approvalMinSalienceDist
approvalMinSalienceMin
approvalMinSalienceMax
Location of a file containing the Triggers for this
Subpopulation
The trigger file format is given later.
Location of a file containing the Events for this
Subpopulation
The event file format is given later.
Distribution from which to set the profit minimum salience
of member Land Managers
This parameter should either be ‘normal’, ‘truncated-normal’ or
‘uniform’.
Minimum profit minimum salience (floating point)
This parameter should only appear if ‘profitMinSalienceDist’ is
‘uniform’ or ‘truncated-normal’.
Maximum profit minimum salience (floating point)
This parameter should only appear if ‘profitMinSalienceDist’ is
‘uniform’ or ‘truncated-normal’.
Mean profit minimum salience (floating point)
This parameter should only appear if ‘profitMinSalienceDist’ is
‘normal’ or ‘truncated-normal’.
Profit minimum salience variance (floating point)
This parameter should only appear if ‘profitMinSalienceDist’ is
‘normal’ or ‘truncated-normal’.
Distribution from which to set the approval minimum
salience of member Land Managers
This parameter should either be ‘normal’, ‘truncated-normal’ or
‘uniform’.
Minimum approval minimum salience (floating point)
This parameter should only appear if ‘approvalMinSalienceDist’ is
‘uniform’ or ‘truncated-normal’.
Maximum approval minimum salience (floating point)
This parameter should only appear if ‘approvalMinSalienceDist’ is
‘uniform’ or ‘truncated-normal’.
Created 2008-04-04
Modified 2008-04-18
Printed 2008-04-18
55
approvalMinSalienceMean
approvalMinSalienceVar
salienceMarginDist
salienceMarginMin
salienceMarginMax
salienceMarginMean
salienceMarginVar
salienceAdjustDist
salienceAdjustMin
salienceAdjustMax
salienceAdjustMean
salienceAdjustVar
profitAspirationDist
profitAspirationMin
profitAspirationMax
profitAspirationMean
profitAspirationVar
Mean approval minimum salience (floating point)
This parameter should only appear if ‘approvalMinSalienceDist’ is
‘normal’ or ‘truncated-normal’.
Approval minimum salience variance (floating point)
This parameter should only appear if ‘approvalMinSalienceDist’ is
‘normal’ or ‘truncated-normal’.
Distribution from which to set the salience margin of
member Land Managers
This parameter should either be ‘normal’, ‘truncated-normal’ or
‘uniform’.
Minimum salience margin (floating point)
This parameter should only appear if ‘salienceMarginDist’ is
‘uniform’ or ‘truncated-normal’.
Maximum salience margin (floating point)
This parameter should only appear if ‘salienceMarginDist’ is
‘uniform’ or ‘truncated-normal’.
Mean salience margin (floating point)
This parameter should only appear if ‘salienceMarginDist’ is
‘normal’ or ‘truncated-normal’.
Salience margin variance (floating point)
This parameter should only appear if ‘salienceMarginDist’ is
‘normal’ or ‘truncated-normal’.
Distribution from which to set the salience adjustment of
member Land Managers
This parameter should either be ‘normal’, ‘truncated-normal’ or
‘uniform’.
Minimum salience adjustment (floating point)
This parameter should only appear if ‘salienceAdjustDist’ is
‘uniform’ or ‘truncated-normal’.
Maximum salience adjustment (floating point)
This parameter should only appear if ‘salienceAdjustDist’ is
‘uniform’ or ‘truncated-normal’.
Mean salience adjustment (floating point)
This parameter should only appear if ‘salienceAdjustDist’ is
‘normal’ or ‘truncated-normal’.
Salience adjustment variance (floating point)
This parameter should only appear if ‘salienceAdjustDist’ is
‘normal’ or ‘truncated-normal’.
Distribution from which to set the profit aspiration of
member Land Managers
This parameter should either be ‘normal’, ‘truncated-normal’ or
‘uniform’.
Minimum profit aspiration (floating point)
This parameter should only appear if ‘profitAspirationDist’ is
‘uniform’ or ‘truncated-normal’.
Maximum profit aspiration (floating point)
This parameter should only appear if ‘profitAspirationDist’ is
‘uniform’ or ‘truncated-normal’.
Mean profit aspiration (floating point)
This parameter should only appear if ‘profitAspirationDist’ is
‘normal’ or ‘truncated-normal’.
Profit aspiration variance (floating point)
This parameter should only appear if ‘profitAspirationDist’ is
Created 2008-04-04
Modified 2008-04-18
Printed 2008-04-18
56
approvalAspirationDist
approvalAspirationMin
approvalAspirationMax
approvalAspirationMean
approvalAspirationVar
5.1.4.4
‘normal’ or ‘truncated-normal’.
Distribution from which to set the approval aspiration of
member Land Managers
This parameter should either be ‘normal’, ‘truncated-normal’ or
‘uniform’.
Minimum approval aspiration (floating point)
This parameter should only appear if ‘approvalAspirationDist’ is
‘uniform’ or ‘truncated-normal’.
Maximum approval aspiration (floating point)
This parameter should only appear if ‘approvalAspirationDist’ is
‘uniform’ or ‘truncated-normal’.
Mean approval aspiration (floating point)
This parameter should only appear if ‘approvalAspirationDist’ is
‘normal’ or ‘truncated-normal’.
Approval aspiration variance (floating point)
This parameter should only appear if ‘approvalAspirationDist’ is
‘normal’ or ‘truncated-normal’.
CBRStrategySubPopulation class
Defines
Subpopulation
parameters
for
CBRStrategyLandManager,
CBRNetApprovalLandManager, CBRFarmScaleProfitLandManager, CBRAdviceLandManager
and CBRDelayedChangeLandManager classes in addition to those specified in section 5.1.4.3.
pCBRDist
pCBRMin
pCBRMax
pCBRMean
pCBRVar
pImitateDist
pImitateMin
pImitateMax
Distribution from which to set the probability of using
Case Based Reasoning when the Aspiration of member
Land Managers is not met
This parameter should either be ‘normal’, ‘truncated-normal’ or
‘uniform’.
Minimum probability of using Case Based Reasoning when
the Aspiration is not met (floating point)
This parameter should only appear if ‘pCBRDist’ is ‘uniform’ or
‘truncated-normal’.
Maximum probability of using Case Based Reasoning
when the Aspiration is not met (floating point)
This parameter should only appear if ‘pCBRDist’ is ‘uniform’ or
‘truncated-normal’.
Mean probability of using Case Based Reasoning when the
Aspiration is not met (floating point)
This parameter should only appear if ‘pCBRDist’ is ‘normal’ or
‘truncated-normal’.
Probability of using Case Based Reasoning when the
Aspiration is not met variance (floating point)
This parameter should only appear if ‘pCBRDist’ is ‘normal’ or
‘truncated-normal’.
Distribution from which to set the probability of using the
Imitative Strategy of member Land Managers
This parameter should either be ‘normal’, ‘truncated-normal’ or
‘uniform’.
Minimum probability of using the Imitative Strategy
(floating point)
This parameter should only appear if ‘pImitateDist’ is ‘uniform’ or
‘truncated-normal’.
Maximum probability of using the Imitative Strategy
Created 2008-04-04
Modified 2008-04-18
Printed 2008-04-18
57
pImitateMean
pImitateVar
memorySizeMin
memorySizeMax
imitativeStrategy
experimentationStrategy
5.1.4.5
(floating point)
This parameter should only appear if ‘pImitateDist’ is ‘uniform’ or
‘truncated-normal’.
Mean probability of using the Imitative Strategy (floating
point)
This parameter should only appear if ‘pImitateDist’ is ‘normal’ or
‘truncated-normal’.
Probability of using the Imitative Strategy variance
(floating point)
This parameter should only appear if ‘pImitateDist’ is ‘normal’ or
‘truncated-normal’.
Minimum memory size for Imitative and Experimentation
Strategies (integer)
Maximum memory size for Imitative and Experimentation
Strategies (integer)
Name of Imitative Strategy class to use
See Table 4, Strategies with a Y in the Imitative? column. Use
‘NoStrategy’ if pImitate is 0 or pCBR is 1 for all member Land
Managers.
Name of Experimentation Strategy class to use
See Table 4, Strategies with an N in the Imitative? column. Use
‘NoStrategy’ if pImitate is 1 or pCBR is 1 for all member Land
Managers.
CBRAdviceSubPopulation class
The CBRAdviceSubPopulation class provides parameters for CBRAdviceLandManager and
CBRDelayedChangeLandManager classes in addition to those in sections 5.1.4.3 and 5.1.4.4.
These parameters define the limits on the case base and the strategy for seeking Advice. The case
base limits use uniform distributions to specify limits on the number of cases that can be stored in
the case base, and the number of Years cases will be remembered for. The limits can be set to 0 to
indicate no constraint. A somewhat counter-intuitive (and not recommended) option is to set the
minimum of the limit to zero and the maximum to something else. In such a case, the uniform
distribution of limited case bases will be from 1 to the maximum limit; with an unlimited case
base given to some Land Managers with probability 1/(L + 1), where L is the limit.
CBTimeLimitMin
CBTimeLimitMax
CBSizeLimitMin
CBSizeLimitMax
adviceStrategy
Minimum number of Years Land Managers may store
cases for (integer)
Use 0 for an unlimited case base time limit.
Maximum number of Years Land Managers may store
cases for (integer)
This can be non-zero if CBTimeLimitMin is 0, though this is not
recommended practice.
Minimum size of the case base (integer)
Use 0 for an unlimited case base size.
Maximum size of the case base (integer)
This can be non-zero if CBSizeLimitMin is 0, though this is not
recommended practice.
The name of the Advice Strategy class that will be used to
decide who to seek Advice from
See Table 6 for a list of options.
Created 2008-04-04
Modified 2008-04-18
Printed 2008-04-18
58
5.1.4.6
CBRDelayedChangeSubPopulation class
The
CBRDelayedChangeSubPopulation
class
gives
parameters
for
the
CBRDelayedChangeLandManager class in addition to those in sections 5.1.4.3, 5.1.4.4 and
5.1.4.5. The change delay is taken from a uniform distribution.
changeDelayMin
changeDelayMax
5.1.5
Minimum number of Years a Manager will wait before
changing Land Use (integer)
Maximum number of Years a Manager will wait before
changing Land Use (integer)
Strategy selector file
The strategy selector file contains a list of strategies for Land Managers in the LandManager and
PositiveLandManager classes to use for each element in the Land Manager Decision Algorithm,
and the probability that the strategy will be selected. This allows, if required, Subpopulations to
consist of Land Managers using different strategies for different elements in the Decision
Algorithm.
NumberOfStrategyClasses: Number of strategies appearing in this file (integer)
Class AboveThresholdProbability \
BelowThresholdNonImitativeProbability \
BelowThresholdImitativeProbability InitialProbability
The above headings should all appear on one line. The file is
designed to be readable in a spreadsheet package, so separating
the headings with tabs is a good idea, though not necessary.
Name of strategy
Probability1 Probability2 Probability3 Probability4
The strategy names are given in Table 4. The first probability is
the probability the strategy will be assigned as the contentment
strategy of a Land Manager. The second probability is the
probability it will be assigned as the innovative strategy. The third
is for the imitative strategy, and the fourth the initial strategy
(typically ‘RandomStrategy’). Where the distributions of
parameters in the corresponding Subpopulation file have been
appropriately set, ‘NoStrategy’ should be used with probability 1
to generate an error message if the Land Manager attempts to
use it. Thus, for example, if the minimum aspiration threshold is
greater than the maximum possible yield, then NoStrategy should
have probability 1.0 in the Probability1 column. The number of
strategy lines in the file should correspond to the number entered
for ‘NumberOfStrategyClasses’ above.
5.1.6
Events file
The events file is used by Subpopulations belonging to the CBRSocialSubPopulation and
CBRStrategySubPopulation classes. It consists of one or more events, each formatted as follows:
BEGIN EVENT Event class name The event class names are given in Table 5.
Response: Event response Event
responses
are
one
of
‘incProfitSalience’,
‘incApprovalSalience’,
‘decProfitSalience’
or
‘decApprovalSalience’.
Event parameter: Event parameter value
There may be zero or more of these lines, depending on whether
the event takes any parameters.
END
Created 2008-04-04
Modified 2008-04-18
Printed 2008-04-18
59
5.1.7
Trigger file
The trigger file is used by Subpopulations belonging to the CBRSocialSubPopulation and
CBRStrategySubPopulation classes. It consists of one or more triggers, each formatted as follows:
BEGIN TRIGGER Trigger class name
The trigger class names are given in Table 7.
Approval: Amount of approval to give if trigger activated (floating point)
Disapproval: Amount of disapproval to give if trigger activated (floating point)
Trigger parameter: Trigger parameter value
There may be zero or more of these lines, depending on whether
the event takes any parameters.
END
One or other of the approval or disapproval amounts would normally be expected to be zero,
though for certain classes of Trigger, it could make sense for both to be non-zero.
5.1.8
Land Use file
The landUseFile parameter in the main parameter file may specify a file name. If the file does not
exist, and the useLandUseFile parameter is set to 1, this will cause the model to save the Land
Use Property value lists and other information in a file of that name. These Land Uses can then be
loaded in to a run with the same nLandUse parameter value, and Land Use Symbols. The
useLandUseFile parameter should be set to 1, and the landUseFile contain the name of the file
saved from the earlier run.
NumberOfLandUses: Number of Land Uses (integer)
When loading in Land Uses, the ‘NumberOfLandUses’ value
given here must equal the nLandUse parameter in the main
model file.
LU({Land Use Property value lists} Pollution (floating point)
Minimum area for economies of scale, β (floating point)
Maximum area for economies of scale, γ (floating point)
Maximum economy of scale, σ (floating point))
The line above is repeated for each Land Use. For an explanation
of parameters β, γ, and σ see section 4.2.2.
5.1.9
Climate and Economy files
The Climate and Economy files both have exactly the same format. The Economy will be saved
to a file for each Year the model runs if the economyFile parameter in the main parameter file
names a file that does not yet exist, and the useEconomyFile flag is set to 1. The Economy will be
loaded in if the economyFile parameter contains the name of an existing file and the
useEconomyFile flag is set to 1. The same applies to the Climate, and the climateFile and
useClimateFile parameters.
The format of the file is simple: one line per Year, with each line having the required property
value list. If the run is loading in property value lists from a file, and the file ends before the run’s
termination Year, then subsequent Climates/Economies will be generated using the change
probabilities. Note that these probabilities must be set, even if it is not expected they will be
needed.
Created 2008-04-04
Modified 2008-04-18
Printed 2008-04-18
60
5.1.10
Farm Scale Fixed Cost file
The farm scale fixed cost file consists simply of a series of floating point numbers separated by
white space (a new line is recommended), to be used in consecutive Years as the
farmScaleFixedCosts parameter. If the simulation continues beyond the end of the farm scale
fixed cost file, then the farmScaleFixedCosts parameter will remain constant at the last value
loaded. The Farm Scale Fixed Cost value to use during initialisation would be the
farmScaleFixedCosts parameter value. Note, however, that since no harvest takes place during
initialisation, this value would not have any influence on the model. The first
farmScaleFixedCosts value loaded from the farm scale fixed cost file will therefore be that to use
in Year 1.
5.1.11
Yield and Income symbol tree files
Symbol tree files define the organisation of symbols that may collectively describe the state of
various aspects of the system. In the case of the Yield symbol tree file, the aspects of the system
to describe are the Biophysical Characteristics of the Land Cells, the Climate and the Land Uses.
In the case of the Income symbol tree file, the aspects of the system to describe are the Land Uses
and the Economy. Each of these aspects is called a ‘concept’, and each concept may have an
arbitrary number of properties into which the symbols describing the state of the concept are
organised. Each property may be thought of as a dimension of the concept. Within each property,
an arbitrary number of symbols may be defined, which exhaustively specify the values that the
concept may have in that dimension. Property names for Climate, Economy, Biophysical
Characteristics and Land Uses should not overlap. The format of the file is sensitive to white
space characters. The name of each concept is passed to FEARLUS in the model file as one of the
parameters
landUseGroupName,
biophysGroupName,
climateGroupName
or
economyGroupName.
Names of concepts, properties and symbols should not contain
white space, and should start with an alphabetic character (upper
or lower case).
tab Name of Property 1 of Concept 1
This is expected to start on the next line after the name of the
concept.
tab tab
Symbol1.1.1 Symbol1.1.2 Symbol1.1.3 …
Again, starts on the next line, and so on for the rest of the file.
Symbols are separated by white space.
tab Name of Property 2 of Concept 1
tab tab
Symbol1.2.1 Symbol1.2.2 Symbol1.2.3 …
tab
…
Continue for all properties of concept 1.
Name of Concept 2
tab Name of Property 1 of Concept 2
tab tab
Symbol2.1.1 Symbol2.1.2 Symbol2.1.3 …
tab Name of Property 2 of Concept 2
tab tab
Symbol1.2.1 Symbol1.2.2 Symbol1.2.3 …
tab
…
Continue for all properties of concept 2.
…
Continue for all concepts.
Name of Concept 1
The following is an example file:
Climate
Temperature
Cold Warm Hot
Rainfall
Created 2008-04-04
Modified 2008-04-18
Printed 2008-04-18
61
Drought Average Flood
Variability
Predictable Unpredictable
BiophysicalCharacteristics
LCAClass
ClassI ClassII ClassIII ClassIV ClassV ClassVI
LandUse
Crop
Arable Livestock
Management
Intensive Extensive
5.1.12
Yield and Income lookup table files
The lookup table files contain the data that provide the consequences for each combination of
property value lists in the groups concerned. The first line of the file contains the names of the
properties in the order that they appear in the corresponding symbol tree file, separated by white
space. Thereafter, each line consists of one symbol for each property (again, separated by white
space) followed by a floating point number that is the outcome (Yield per unit area or Income per
unit Yield, according to which table the file is for) for the given sequence of states. A wildcard
character (‘*’) can be used in place of the name of a symbol name to represent that all symbols in
that property have the same outcome, when combined with the other combination of symbols in
that row. A specific sequence of states may be matched more than once in the table file when
wildcards are used; in this case the last match is the one used. This suggests a general to specific
ordering of entries, where entry X is more general than (or equal to) entry Y iff all wildcards in Y
are also wildcards in X. If an entry is not made, then the default value is zero. (An alternative
default value can be specified with a row consisting entirely of wildcards for all properties, with
the preferred value as the outcome.) The content of the file is read until the first empty line is
encountered, with all subsequent content ignored.
Property1.1
symbol/*
symbol/*
…
Property1.2
symbol/*
symbol/*
…
…
…
Property2.1
symbol/*
symbol/*
…
…
…
outcome (float)
outcome (float)
The following is an example file, corresponding to the example symbol tree file given earlier:
Temperature
*
Cold
*
Warm
5.1.13
Rainfall
*
*
Drought
Average
Variability
*
Predictable
*
Predictable
LCAClass
*
*
*
ClassI
Crop
*
Arable
*
Arable
Management
*
Extensive
*
Intensive
5.0
3.0
2.0
20.0
Grid file
The grid file format loosely follows the ARC .grd file format. The chief difference between this
file format and that of ARC is that more than one allocation of cell values can be made to the
same georeference in a series of layers, each layer covering one allocation of cell values under the
same layer heading.
Created 2008-04-04
Modified 2008-04-18
Printed 2008-04-18
62
The data in the cells, unlike ARC .grd file format, can be any string not containing whitespace.
FEARLUS stores in memory all layers read in from the file, even those it does not recognise. This
creates the possibility, for example, of creating new strategies or reports that use layer data not
currently used by FEARLUS. The layers recognised or generated by FEARLUS are shown in
Table 11. Where a layer is marked ‘Input or Output’ in this table, the direction of data flow
depends on whether or not the grid file exists.
Layer name
Input/Output
Description
FEARLUS-Biophys Property
Input or Output
FEARLUS-LandManagerID Initial
Input or Output
FEARLUS-LandManagerID Year x
Output
FEARLUS-LandParcelID
Input or Output
FEARLUS-LandUseID Initial
Input or Output
FEARLUS-LandUseID Year x
FEARLUS-PolicyZone
Output
Input or Output
FEARLUS-Pollution Year x
FEARLUS-SubPopulationID Initial
Output
Input or Output
FEARLUS-SubPopulationID Year x
Output
FEARLUS-Wealth Year x
FEARLUS-Yield Year x
Output
Output
Use this to pass in the Biophysical
Characteristics of Land Cells in the
specified Biophysical Characteristics
Property. These should be given as the
name of the Symbol to use.
Use this to pass in initial allocations of
Land Parcels to Land Managers
Generated by
LandManagerGridFileReport
Use this to pass in the allocations of Land
Cells to Land Parcels
Use this to pass in the initial allocations of
Land Uses to Land Parcels
Generated by LandUseGridFileReport
Use this to pass in the required Zone in
which the Government is to implement its
policy, if the Government is of a class that
offers this functionality. Use 1 for a cell in
the Zone, and 0 for a cell outside.
Generated by PollutionGridFileReport
Use this to pass in the initial allocations of
Land Managers to Subpopulations
Generated by
SubPopulationGridFileReport
Generated by WealthGridFileReport
Generated by YieldGridFileReport
Table 11 — A list of grid file layers used in FEARLUS.
The file format for the grid data file is given below. To create ARC .grd files for reading in to a
GIS, one file should be created for each layer, containing the header (everything from nrows
down to NODATA_value) followed by the layer data (i.e. no layer name).
nrows Number of rows of cells in the grid (integer)
ncols Number of columns of cells in the grid (integer)
These should correspond to envYSize and envXSize
respectively.
xllcorner Georeference of the lower-left corner of the grid on the X-axis (floating point)
yllcorner Georeference of the lower-left corner of the grid on the Y-axis (floating point)
FEARLUS ignores these values.
cellsize Length of one side of the cell (floating point)
This is used to compute the area of each cell.
NODATA_value Value appearing in grid data to indicate blank cells (integer)
This line is optional.
Layer 1 name
The layer name may contain white space, and is terminated at
the end of the line
Created 2008-04-04
Modified 2008-04-18
Printed 2008-04-18
63
Layer 1 data…
Layer data is written for all cells in the grid, starting at the top,
separate by white space. By convention, each row is put on one
line.
Layer 2 name
Layer 2 data…
… and so on for all layers to be specified in the file. At least one layer must be specified.
5.1.14
Government file
The Government file contains parameter settings for the Government class. The format is case
sensitive, and specified with one parameter per line thus:
Government parameter: Government parameter value
The Government parameters used by different classes are detailed in section 4.3. Some
parameters merit further explanation, and these are detailed below.
5.1.14.1
Government file: Zone parameter
Many Government classes use the ‘Zone’ parameter to specify the cells that appear in the Zone.
(A Parcel is in the Zone if any of its Cells are in the Zone.) The Zone parameter can be specified
in a number of ways, depending on the Zone required.
To stipulate that all Cells are in the Policy Zone, use the following:
Zone: all
The above is the default option, so Government classes using the Zone parameter needn’t specify
it. However, it is probably better to be explicit.
To select a random proportion of Cells for the Policy Zone, use:
Zone: Proportion percentage%
To use a rectangle of Cells for the Policy Zone, do:
Zone: [xll,yll|xur,yur]
where (xll, yll) is the co-ordinate of the lower-left cell of the rectangle, and (xur, yur) is that of the
upper right; co-ordinates starting at (0, 0) and ending at (envXSize – 1, envYSize – 1).
A specific list of Cells can be specified using a series of Zone parameters, with the following
format:
Zone: (xcell1,ycell1)
Zone: (xcell2,ycell2)
Zone: (xcell3,ycell3)
… and so on for all cells to be included in the Policy Zone.
To use the grid file (specified using the gridFile parameter in the main model file) to load in
the Policy Zone from a layer entitled FEARLUS-PolicyZone, use:
Zone: grid
Created 2008-04-04
Modified 2008-04-18
Printed 2008-04-18
64
These five different ways of specifying a Policy Zone cannot be mixed, except that a Policy Zone
specified using one of the first four methods can be saved to the grid file by using the Zone:
grid parameter setting after the other method has been specified. For example, to create a
random proportion of Cells in the Policy Zone which are then saved to the grid file, do:
Zone: Proportion percentage%
Zone: grid
A later run could then use the same Policy Zone by reading the grid file saved and using Zone:
grid on its own to pick up the Cells randomly selected.
5.1.14.2
Government file: LandUse parameter
The LandUse parameter occurs in a number of classes, and is used to specify a set of Land Uses
the Government is concerned with, and possibly to associated a value with each. The LandUse
parameter is applied repeatedly for each Land Use the Government is to be concerned with. The
following illustrates the format for a class in which a simple list of Land Uses is required, with no
value to associate with each.
LandUse: Land Use label 1
LandUse: Land Use label 2
LandUse: Land Use label 3
… and so on for all Land Uses the Government is concerned with.
The Land Use label is the property value list of the Land Use, with each symbol (or property
value) separated by a space. Where the Government class requires a value to be associated with
each Land Use (e.g. a target or a reward), this value is simply separated from the Land Use label
with a space; the class simply expects the last word on the line to be the value to associate with
the Land Use:
LandUse: Land Use label 1 value 1
LandUse: Land Use label 2 value 2
LandUse: Land Use label 3 value 3
… and so on for all Land Uses and associated values the Government is concerned with.
Typically, there is no need to provide information for all Land Uses. Land Uses not specified
using the LandUse parameter are ignored by the Government.
5.2
Observation parameters
5.2.1
Report configuration file
The report configuration file is used to specify the reports that are required as output from the
model, any options for those reports, and in what Years the reports are to be made. Reports are
discussed in more detail in section 8.1, where a list of currently available reports is also to be
found in subsections.
The format of this file is a series of statements in a simple language separated by white space.
Every report configuration file must finish with the word “End”. The simplest configuration file
consists solely of this word, and will call every report each Year. Optionally, the first statement in
the file can be one saying “DefaultYearsToReport: Year list” (without the quotes). A
Year list is a comma-separated list of terms, where each term may be one of the following:
• integer1
Created 2008-04-04
Modified 2008-04-18
Printed 2008-04-18
65
•
•
integer2-integer3
Every integer4
Here, integer1 is greater than or equal to 0, and specifies a fixed Year in which the report will be
made. Next, integer2 is also greater than or equal to 0, and integer3 is greater than integer2, and
they together specify an inclusive fixed range of Years in which to report. Finally, integer4 is a
repeat interval. The report will be called in Year 0 (the initialisation Year), and then in intervals
of integer4 thereafter. There must be no white space between a term and a comma following it.
For example: “DefaultYearsToReport: 7, 9, Every 20, 70-80, Every 99, 199” would, in a run with
the maxYear parameter set to 200, stipulate the default that reports would be called in Years 0, 7,
9, 20, 40, 60, 70, 71, 72, 73, 74, 75, 76, 77, 78, 79, 80, 99, 100, 120, 140, 160, 180, 198, and 199.
Note that Year 200 is not reported on; the maxYear parameter specifies the Year before which to
stop the simulation, and reports are never issued for that Year.
The next simplest report configuration file besides that consisting only of the word “End” is one
consisting of a DefaultYearsToReport statement followed by the word “End”. For example, a file
containing “DefaultYearsToReport: 200 End” would specify (in a run with maxYear more than or
equal to 201) that all reports were to be written in Year 200.
More typically, however, only a few of the available reports listed in section 8.1 will be required.
Following the optional DefaultYearsToReport statement, a series of statements should be
specified for each report required. Each such statement consists of the name of the report class (as
given in the subsection headings in section 8.1), followed (if required) by a list of options,
followed (if DefaultYearsToReport have not been specified and the report is not required every
Year, or the defaults are to be over-ridden for this report) by a Year list. An option list is preceded
by the term “Options:” if it appears, and a Year list by the term “YearsToReport:”.
Report configuration file
What it does
End
DefaultYearsToReport: Every 10
End
ParcelSubPopReport
YearsToReport: 200
End
DefaultYearsToReport: Every 1
ClimateStateReport
EconomyStateReport
ClumpinessReport
Options: Histo
YearsToReport: 0
TimeSeriesReport
Options: TimeSeries=Expenditure,
NoSingleRowSeries, ShowThisYear
End
Every report, every Year.
Every report, every 10 Years.
ParcelSubPopReport
in Year 200 only.
ClimateStateReport and
EconomyStateReport every Year,
ClumpinessReport
showing a histogram
in Year 0 only,
and TimeSeriesReport
showing the Expenditure time series,
without single row, with this Year.
Table 12 — Some example report configuration files. Note that spacing
in the file is irrelevant so long as white space of some kind appears
where it appears in the example — the layout shown here is to improve
readability.
An option list is a comma-separated list of option terms specifying the value of each option.
Options come in two forms, variables and flags. The following shows the format for setting them:
Created 2008-04-04
Modified 2008-04-18
Printed 2008-04-18
66
•
•
•
variable1=value
flag1
Noflag2
Here, variable1 is set to the specified value, flag1 is set to “True” and flag2 is set to “False”.
When specifying a list of options, there must be no white space between an option term and any
following comma, but there should be a white space after the comma. Any report having options
will have default values for them. In model1-1-5 the only report with any option is the
ClumpinessReport, which has a Histo flag. Some examples are given in Table 12.
5.2.2
Observer file
The observer file specifies which displays are required when the model is being run in GUI mode.
The default is to show all displays, which, unless you have an unusually large screen, is likely to
lead to rather a lot of clutter. Examples of each of the displays are given in section 7 which
discusses GUI mode in more detail. The format of the observer file is given below:
@begin
showStrategyColourKey
showUseRaster
showSuitabilityRaster
showProfitabilityRaster
showBiophysRaster
showManagerRaster
showSubPopRaster
showStrategyRaster
showUseChangeRaster
showManagerChangeRaster
boolean
The Strategy raster shows a colour on each Land Parcel for the
Strategy used to determine its Land Use. This display shows the
key to those colours. The value 1 means the raster should be
shown, the value 0 that it should not. For
CBRSocialSubPopulations, the ‘Strategy’ corresponds to the
mode of decision making (e.g. case base with perfect match,
case base with imperfect match, experimentation).
boolean
Show the Land Parcels coloured by their current Land Use.
boolean
Show the Land Parcels coloured by the most suitable Land Use.
(That is, the Land Use best matching the local Biophysical
Characteristics and global Climate.) A cross is drawn through
Cells where there is more than one Land Use with equal best
match.
boolean
Show the Land Parcels coloured by the most profitable Land Use.
boolean
Show the spatial distribution of the Biophysical Characteristics
symbols, one property at a time. Click on the raster to advance
the property displayed.
boolean
Show the Land Parcels coloured by the Land Managers owning
them.
boolean
Show the Land Parcels coloured by the Subpopulation of the
Land Managers owning them.
boolean
Show the Land Parcels coloured by the Strategy or decision
mode used to choose their Land Use.
boolean
Show the Land Parcels in shades of grey according to the relative
number of times their Land Uses have been changed (black =
least, white = most).
boolean
Created 2008-04-04
Modified 2008-04-18
Printed 2008-04-18
67
Show the Land Parcels in shades of grey according to the relative
number of times their Land Managers have been changed (black
= least, white = most).
showPriceRankRaster
boolean
Show the Land Parcels in shades of grey according to the relative
most recent price (black = cheapest, white = most expensive,
yellow = not sold yet).
showAveragePriceRankRaster boolean
Show the Land Parcels in shades of grey according to the relative
average price at which they have been sold (black = cheapest,
white = most expensive, yellow = not sold yet).
showTotalPriceRankRaster boolean
Show the Land Parcels in shades of grey according to the relative
total price of all times they have been sold (black = cheapest,
white = most expensive).
showParcelBoundaries
boolean
Show the boundaries between the Land Parcels.
showManagerBoundaries
boolean
Show the boundaries between the Land Parcels owned by
different Land Managers.
showStrategyGraph
boolean
Show a time series graph of the number of times each decision
mode has been used.
showPollutionGraph
boolean
Show a time series graph of the total Pollution.
showUseMarketGraph
boolean
Show a time series graph of the price per unit Yield of each Land
Use.
showParcelsOwnedGraph
boolean
Show a time series graph of the total number of Land Parcels
owned by members of each Subpopulation. If there is only one
Subpopulation, show the mean, minimum and maximum over all
Land Managers.
showYieldGraph
boolean
Show a time series graph of the mean, minimum and maximum
Yield from the Land Parcels.
showPopulationGraph
boolean
Show a time series graph of the number of Land Managers in
each Subpopulation.
showUseGraph
boolean
Show a time series graph of the number of Land Parcels
assigned to each Land Use.
showProfitabilityGraph
boolean
Show a time series graph of the number of Land Parcels for
which each Land Use is the most profitable.
showSuitabilityGraph
boolean
Show a time series graph of the number of Land Parcels for
which each Land Use is the most suitable.
showWealthGraph
boolean
Show a time series graph of the mean Wealth accumulated by
members of each Subpopulation. If there is only one
Subpopulation, show the mean, minimum and maximum over all
Land Managers.
Created 2008-04-04
Modified 2008-04-18
Printed 2008-04-18
68
showDeathGraph
showAgeGraph
showUtilityGraph
showSalienceGraph
showApprovedGraph
showApprovingGraph
showPriceGraph
showNewBidGraph
showBidGraph
showSalienceDist
showManagersDist
showNWeightDist
showThresholdDist
showImitProbDist
nHistogramBins
zoomSize
boolean
Show a time series graph of the number of bankruptcies from
each Subpopulation.
boolean
Show a time series graph of the mean Age (in Years) of members
of each Subpopulation. If there is only one Subpopulation, show
the mean, minimum and maximum over all Land Managers.
boolean
Show a time series graph for each CBRSocialSubPopulation or
CBRStrategySubPopulation of the utility of its members.
boolean
Show a time series graph for each CBRSocialSubPopulation or
CBRStrategySubPopulation of the mean log (profit salience /
approval salience) of its members. (Hence negative values show
more approval salience, positive values more profit salience.)
boolean
Show a time series graph for each CBRSocialSubPopulation or
CBRStrategySubPopulation of the number of times its members
have been approved and disapproved.
boolean
Show a time series graph for each CBRSocialSubPopulation or
CBRStrategySubPopulation of the number of times its members
have approved or disapproved of another Land Manager.
boolean
Show a time series graph of the mean, minimum and maximum
price at which Land Parcels have been sold.
boolean
Show a time series graph of the mean bids offered by in-migrant
members of each Subpopulation for each Land Parcel.
boolean
Show a time series graph of the mean bids offered by non-inmigrant members of each Subpopulation for each Land Parcel.
boolean
Show a distribution of the current mean log (profit salience /
approval salience) for each CBRSocialSubPopulation or
CBRStrategySubPopulation. (Hence negative values show more
approval salience, positive values more profit salience.)
boolean
Show a distribution of the Estate size of Land Managers.
boolean
Show (if appropriate) a distribution of the Neighbourhood
Weighting over members of each Subpopulation — so, one graph
for each Subpopulation with parameters set to allow this to vary.
boolean
As showNWeightDist, but for the Aspiration Threshold.
boolean
As showNWeightDist, but for the Imitation Probability.
integer
Number of bins to use in the distribution graphs. (So, all graphs
have the same number of bins…)
integer
How many units of 250 pixels to make the rasters. This multiple
of 250 pixels will determine the number of pixels to use for the
Created 2008-04-04
Modified 2008-04-18
Printed 2008-04-18
69
displayFrequency
larger dimension of the Environment. So, if the zoomSize is 2 and
the Environment has 10 horizontal Land Parcels and 4 vertical,
then all raster displays will be 500 pixels across by 200 pixels
down.
integer
How often to update the display of all rasters and graphs.
The following are provided for debugging purposes:
showZoneGraph
showObserverZone
showModelZone
showScratchZone
showManagerZone
showCaseZone
showObserverZoneDetail
showModelZoneDetail
showScratchZoneDetail
showManagerZoneDetail
showCaseZoneDetail
boolean
Show a time series graph of the size (in terms of number of
allocated pointers) of various zones (a Swarm term for areas of
computer memory). The zones to display depend on the setting
of the following parameters.
boolean
Show the ObserverSwarn zone in the zone graph.
boolean
Show the ModelSwarm zone in the zone graph.
boolean
Show scratchZone in the zone graph. This is particularly useful
for trapping memory leaks!
boolean
Show a zone containing all the Land managers in the zone graph.
boolean
Show a zone containing all the case bases in the zone graph.
boolean
Show the numbers of members of each class in the
ObserverSwarm zone, in a table to stdout.
boolean
Does for ModelSwarm zone what showObserverSwarmDetail
does for ObserverSwarm zone…
boolean
…as does this for scratchZone…
boolean
…this for a zone containing all Land Managers…
boolean
…and this for a zone containing all case bases.
@end
6
Batch mode
As mentioned in section 3, to run FEARLUS in batch mode, give the -b flag to the command line.
Any debugging output specified with the -D flag will be sent to stdout, along with standard
messages that can’t be optionally made to disappear showing (among other things) when each
Year is started. You should give the -D, or the -R and -r flags to get some output from the model,
otherwise there is little point in running it. If you are not giving the -D flag, then stdout should be
redirected to /dev/null to discard it, particularly if you are running the process in the background
(this works on both Unix and Cygwin—see below for an example command). Successful
termination is indicated by a 0 exit status. More on the output options can be found in section 8.
The -p flag should also be used to specify the model parameters for the run, and unless the run is
being used to test the model, the -s flag should be given to specify an arbitrary seed (or -S with a
specific seed).
Created 2008-04-04
Modified 2008-04-18
Printed 2008-04-18
70
Bear in mind that using the -s flag to vary the seed could result in duplicate seeds being used
(though this is not very likely), as the -s flag generates a seed from the system clock and process
ID. There are two ways of approaching this: either check the output (all the output options give
the seed used) and discard duplicates, or prepare a list of unique seeds in advance for each
sequence of runs, and cycle through them using the -S option. The latter option would require
some sort of script to start off each run.
Another point to note for series of runs is that the -a flag will append any reports specified with
the -R option to the file specified with the -r option. For large numbers of runs, this can prevent
directories being cluttered with large numbers of report files.
A typical command to run the model in batch mode would look like this:
/full/path/to/model1-1-5 -p MyParams.model
MyReportOutputFile -s -a > /dev/null
-R
MyReports.cfg
-r
One point to note from this example is that the model is being run from the directory containing
all the parameter files. If this is not done, then all filenames in parameter files should use full
paths. This latter approach could be useful in maintaining a database of parameter file settings
using the filesystem, but would impact the portability of the parameter files.
7
GUI mode
GUI mode is typically used for exploratory runs of the model, and for generating pictures for
diagrams. A large number of displays are possible in GUI mode, and it is suggested that an
observer file (section 5.2.2) be used to select the displays required. These, and any options for
setting them, are all illustrated in the ensuing subsections. Note that if the executable version of
FEARLUS has been compiled against a non-GUI version of Swarm, then GUI mode will, as you
might expect, not be available.
In earlier versions of FEARLUS, the GUI could be used to enter parameters for the model.
Though some parameters (chiefly those in the main model file) can be adjusted from the GUI,
you are now expected to supply an argument to the –p command line option. * The GUI can still
be used to decide which displays to use, though probably most of the runs you will want to do
will use the same displays, and since it gets tiresome to enter the displays all the time, you are
recommended to create an observer file and give it as argument to the –o command line option.
When the model is first started, three windows appear much as per Figure 18. You can use the
GUI to make changes to the observer displays and to the parameters shown if you want to. You
can also enter values for the seed for the run, and, if required, the seed to use after initialisation.
You cannot change the observer settings or parameters once the run has started. If you do decide
to change any parameter or observer settings, make sure you hit return after each modification in
the text box.
*
So, it’s not really an ‘option’…
Created 2008-04-04
Modified 2008-04-18
Printed 2008-04-18
71
Figure 18 — The three windows that pop up on starting model1-1-5.
Note that the Ontology button only appears on the ProcCtrl window
(leftmost shown) if the –O command-line option is given.
When you are happy with the settings, click the ‘Start’ or ‘Next’ buttons on the ProcCtrl display
to start the simulation. The ‘Stop’ button on the ProcCtrl display temporarily stops the simulation.
You can then start it again with the ‘Start’ or ‘Next’ button (the latter advancing one time step and
then stopping), or exit the application with the ‘Quit’ button. The ‘Save’ button saves the position
of some of the displays on the screen, which can be useful to save you having to move the
displays all the time. The saved window positions should be automatically restored the next time
you run FEARLUS, though this functionality seems to have varied degrees of reliability on
different platforms.
One other point worth mentioning about GUI mode is that the maxYear parameter behaves
differently in GUI mode than it does in batch mode. In batch mode, maxYear is necessary to
specify when the simulation should terminate. In GUI mode, however, this is not required, as the
‘Quit’ button is there for you to exit at any time. If the infiniteTime parameter is 0, then the
simulation will pause at maxYear. You can then click ‘Next’ or ‘Start’ to keep running, or ‘Quit’
to exit. (Beware of this facility, especially for large simulations. Note that between time steps the
GUIs are not redrawn, e.g. if a window is moved in front of them. This is a useful way of telling
whether the GUI is waiting for input from you.)
Note that if you scroll the ObserverSwarm probe window, you are given two buttons, which
toggle the display of the Parcel and Manager boundaries (Figure 19). If you click them while the
simulation is stopped (i.e. prior to first clicking the ‘Start’ or ‘Next’ button, after clicking the
‘Stop’ button, or when the maxYear time step is reached if infiniteTime is 0), you have to click
the ‘Next’ or ‘Start’ buttons to see the effect.
Created 2008-04-04
Modified 2008-04-18
Printed 2008-04-18
72
(a)
(b)
(c)
Figure 19 — The boundary display toggle buttons on the
ObserverSwarm probe map (a), and the effect of pressing the
‘toggleParcelBoundaries’ button on the display provided when
showManagerRaster is 1: (b) before clicking ‘Next’ on ProcCtrl to see
the effect; (c) after.
7.1
Social system displays
7.1.1
Subpopulation displays
Various displays are available to compare Subpopulations, with some specific to the class of
Subpopulation. The following displays are available for all Subpopulation classes. Subsequent
subsections show those displays specific to certain classes of Subpopulation.
Figure 20 — showPopulationGraph = 1.
Created 2008-04-04
Modified 2008-04-18
Printed 2008-04-18
73
Figure 21 — showAgeGraph = 1.
Figure 22 — showWealthGraph = 1.
Figure 23 — showDeathGraph = 1.
Created 2008-04-04
Modified 2008-04-18
Printed 2008-04-18
74
Figure 24 — showParcelsOwnedGraph = 1.
Figure 25 — showManagersDist = 1.
Figure 26 — showSubPopRaster = 1. Black lines are drawn between
Parcels owned by different Land Managers, white lines between Land
Cells belonging to different Land Parcels.
Created 2008-04-04
Modified 2008-04-18
Printed 2008-04-18
75
7.1.1.1
SubPopulation class Subpopulation displays
Figure 27 — showImitProbDist = 1 with nHistogramBins = 8.
Figure 28 — showNWeightDist = 1 with nHistogramBins = 8.
Figure 29 — showThresholdDist = 1 with nHistogramBins = 8.
7.1.1.2
CBRSocialSubPopulation, CBRStrategySubPopulation,
CBRAdviceSubPopulation and CBRDelayedChangeSubPopulation class
Subpopulation displays
These classes of Subpopulation all have social Approval and Disapproval operating among
member Land Managers. Various displays are provided to show some of the behaviour.
Created 2008-04-04
Modified 2008-04-18
Printed 2008-04-18
76
(a)
(b)
Figure 30 — showApprovedGraph = 1. One graph is shown for each
Subpopulation, as illustrated.
(a)
(b)
Figure 31 — showApprovingGraph = 1. One graph is shown for each
Subpopulation as shown.
(a)
(b)
Figure 32 — showSalienceDist = 1 with nHistogramBins = 8. One
graph is created for each Subpopulation.
Created 2008-04-04
Modified 2008-04-18
Printed 2008-04-18
77
Figure 33 — showSalienceGraph = 1.
Figure 34 — showUtilityGraph = 1. The utility of a Land Manager is
given by: profit salience × profit + approval salience × approval.
7.1.2
Land Manager displays
Note that probes, a powerful facility in Swarm, allow you to explore and change the settings of
instance variables in objects. Probes are accessed from the Land Manager raster shown in Figure
38. See Figure 39.
(a)
(b)
Figure 35 — showStrategyRaster = 1. (a) CBRSocialSubPopulation
class (b) SubPopulation class.
Created 2008-04-04
Modified 2008-04-18
Printed 2008-04-18
78
(a)
(b)
Figure 36 — showStrategyColourKey = 1. (a) For Subpopulation class
CBRSocialSubPopulation, (b) For SubPopulation—here only those
strategies used by any of the SubPopulation classes are displayed.
(a)
(b)
Figure 37 — showStrategyGraph = 1. One graph is drawn for each
Subpopulation. (a) An example from a CBRStrategySubPopulation. (b)
An example from a SubPopulation.
(a)
(b)
Figure 38 — (a) showManagerRaster = 1. A black boundary is drawn between
Parcels owned by different Land Managers, and a white boundary between Cells
belonging to different Parcels. Diagonal black and white lines through the Cells
indicate a bankruptcy. (b) showManagerChangeRaster = 1. (Not from the same
model run as (a).) Lighter shades of grey indicate more changes of Land Manager.
Yellow Parcels indicate no change of Manager.
Created 2008-04-04
Modified 2008-04-18
Printed 2008-04-18
79
(a)
(b)
(c)
Figure 39 — Using the Swarm probes. (a) The Land Cell probe
window obtained by right-clicking on a Cell in the Land Manager
raster. (b) The Land Parcel probe window obtained by right-clicking the
light grey LandParcel value of the lp instance variable of the LandCell
instance in (a). (c) Land Manager probe window obtained by rightclicking the light grey LandManager value of the landManager instance
variable of the LandParcel instance in (b).
7.1.3
Land Market displays
Figure 40 shows the displays given when the (a) showPriceRankRaster, (b)
showAveragePriceRankRaster, and (c) showTotalPriceRankRaster parameters are set to 1 in the
ObserverSwarm. Figure 41 shows that for the showBidGraph, Figure 42 for showNewBidGraph,
and Figure 43 for showPriceGraph.
(a)
(b)
(c)
Figure 40 — ELMM rasters: (a) showPriceRankRaster = 1, (b)
showAveragePriceRankRaster = 1, (c) showTotalPriceRankRaster = 1.
Created 2008-04-04
Modified 2008-04-18
Printed 2008-04-18
80
Figure 41 — Time series graph of bids made by various
Subpopulations over time.
Figure 42 — Time series graph of bids made by in-migrant Land
Managers from each Subpopulation.
Figure 43 — Time series graph of most recent prices offered for Land
Parcels.
Created 2008-04-04
Modified 2008-04-18
Printed 2008-04-18
81
7.2
Environment displays
7.2.1
Land Use displays
(a)
(b)
Figure 44 — showUseRaster = 1 from two different simulations: (a) multi-Cell
Land Parcels loaded from a grid file, (b) single-Cell Land Parcels (with Parcel and
Manager boundaries switched off from the ObserverSwarm probe). You can leftclick on a Land Cell to see its neighbourhood. This is shown with a black border in
(b) for a Cell (with diagonal lines through it) in the top left quadrant in a large
contiguous area of the Land Use represented in pink. This run used a hexagonal
neighbourhood of radius 1.
Figure 45 — showUseGraph = 1.
Created 2008-04-04
Modified 2008-04-18
Printed 2008-04-18
82
Figure 46 — showUseChangeRaster = 1. Lighter shades of grey mean
more changes of Land Use. Yellow means none (not applicable here).
(a)
(b)
Figure 47 — (a) showProfitabilityRaster = 1. The most profitable Land
Use is shown. Diagonal lines indicate more than one equally maximally
profitable Land Use. (Not applicable in this case.) (b)
showProfitabilityGraph = 1.
Created 2008-04-04
Modified 2008-04-18
Printed 2008-04-18
83
(a)
(b)
Figure 48 — (a) showSuitabilityRaster = 1. The most suitable Land
Use (highest Yield) is displayed on the raster. Diagonal lines through
Cells indicate there is more than one such Land Use (not applicable
here). (b) showSuitabilityGraph = 1.
Figure 49 — showYieldGraph = 1.
(a)
(b)
Figure 50 — showUseMarketGraph = 1: (a) with many possible
property value lists for the Economy, (b) with only one possible
property value list for the Economy (akin to zero bits in the bitstring in
earlier versions).
Created 2008-04-04
Modified 2008-04-18
Printed 2008-04-18
84
7.2.2
Land Parcel display
(a)
(b)
Figure 51 — showBiophysRaster parameter = 1. This shows the spatial distribution
of one symbol group of the Biophysical Characteristics at a time. Use the left and
right mouse buttons to cycle from one symbol group to the next. The group
displayed is shown in the title bar of the window. The run shown in (a) and (b) has
two groups.
Figure 52 — showPollutionGraph = 1.
7.3
Debugging displays
Various options in the Observer file allow the display of information about memory usage in
FEARLUS, which uses Swarm zones to store objects. The showXxxZoneDetail options give more
detailed information, breaking down the contents of the zone by class. Some example output for
showCaseZoneDetail = 1 follows:
AssocArray: 201
List_linked: 3485
Array_c: 201
Tuple: 269
CBRCase: 678
CBRState: 678
LTGroupState: 1356
CBROutcome: 678
Created 2008-04-04
Modified 2008-04-18
Printed 2008-04-18
85
Figure 53 — showZoneGraph = 1 with showObserverZone = 1,
showModelZone = 1, showScratchZone = 1, showManagerZone = 1
and showCaseZone = 1.
8
Output
There are three forms of output the model can be made to generate. With the -D option, various
debugging ‘verbosity’ messages will be written to stdout, which can be useful for checking the
inner workings of a number of key methods in the model. The debugging output is not overly well
structured, however, making it difficult to reproduce what went on in the model automatically.
Report outputs are designed to provide a flexible programming environment that allows reports to
be created with structured output focussed on the particular information required. The downside,
of course, is that you have to program them yourself if none of the existing reports provide the
information required. Ontology output is a prototype feature allowing a description of the model
and its current state to be automatically created.
8.1
Reports
The report software environment was created to provide a flexible infrastructure for users to
create their own reports — generating an efficient set of outputs in the sense that the output
generated is only that which is required. The list of reports compiled in with model1-1-5 is given
in subsections to this section.
To get report output, you need to create a report configuration file, the format of which is
described in section 5.2.1. You then need to specify the configuration file on the command line
using the -R option, and a name for report files with the -r option. The name of the file actually
created may differ from the argument to the –r command-line option:
1. If the filename does not end with ‘.txt’, then add this string to the end of the filename.
2. If the file exists, then insert a 5 digit number between the terminating .txt and the rest of
the name, starting at 00001 and incrementing in steps of 1 until a non-existing file name
is found.
The -a flag can be specified to cause the reports to be appended to an existing file rather than
using step 2 above.
The report output is designed to be highly structured, making it easy to parse using appropriately
written software. It is also intended to be readable with spreadsheet applications (using a tab
delimiter). The output consists of two sections — the parameters and the report itself. The
parameters section begins with the line ‘BEGIN<tab>Parameters’, and includes the following
information:
•
The version of the model (in this case model1-1-5).
Created 2008-04-04
Modified 2008-04-18
Printed 2008-04-18
86
•
•
•
•
•
•
•
The path used to the executable command.
The version of Swarm.
The real and effective user IDs.
The name, operating system, and CPU architecture of the machine running the model.
The date the model was run.
The seed(s) for the simulation.
Full details of the parameter settings, including the model, Subpopulations, and Climate and
Economy change probabilities.
The parameter section then ends with the line ‘END<tab>Parameters’.
Following the parameter section, the output from reports is given for each Year in which the
configuration file specified a report to be made. The format of the output for each Year is as
detailed below:
BEGIN<tab>Report for end of year:<tab>Year of report
BEGIN<tab>Report class name
Report output goes here
END<tab>Report class name
BEGIN<tab>Another report class name
Another report output goes here
END<tab>Another report class name
Any other reports for this Year are similarly delimited by BEGIN
and END sections
END<tab>Report for end of year:<tab>Year of report
8.1.1
ApprovalNetworkReport
Shows for each Land Manager a list of Land Managers that approved of them.
8.1.2
ApprovalReport
Shows for each Land Manager the total approval or disapproval they awarded other Land
Managers, and the total approval or disapproval received from other Land Managers.
8.1.3
ClimateStateReport
Shows the Climate property value list.
8.1.4
ClumpinessReport
For each Land Cell, a randomly selected Moore neighbour is compared with a randomly chosen
Cell a specified number of times. This information is used to compute the mean distance at which
a neighbour is more similar in its Biophysical Characteristics to a Land Cell than a randomly
chosen Cell. This provides an indication of the degree to which Cells’ Biophysical Characteristics
are similar.
Options:
•
8.1.5
Samples: Number of randomly chosen Land Cells to select (default 10).
DisapprovalNetworkReport
Shows for each Land Manager a list of Land Managers that disapproved of them.
Created 2008-04-04
Modified 2008-04-18
Printed 2008-04-18
87
8.1.6
EconomyStateReport
Shows the Economy property value list.
8.1.7
GovernmentExpenditureReport
Shows the amount the Government spent rewarding Land Managers in the reporting Year.
8.1.8
LandManagerGridFileReport
Saves the Land Manager owning each Land Cell to the grid file.
Options:
•
•
GridFile: The name of a grid file to save the report to (default is the gridFile parameter).
NoData: The no-data value to use in the grid file (default -9999).
8.1.9
LandUseGridFileReport
Saves the Land Use applied to each Land Cell to the grid file.
Options:
•
•
GridFile: The name of a grid file to save the report to (default is the gridFile parameter).
NoData: The no-data value to use in the grid file (default -9999).
8.1.10
LandUseReport
Shows the number of Land Parcels using each Land Use.
8.1.11
LandUseStateReport
Shows all Land Use property value lists.
8.1.12
LockInReport
If there has been a change in the truth of the statement “All Land Parcels are using the same Land
Use” this Year, then give a message to that effect.
8.1.13
MeanSubPopParamParcelReport
Displays the mean value of the Neighbourhood Weighting, the Imitation Probability, the
Aspiration Threshold and the Memory Size of the Land Managers owning each Land Parcel. This
mean is over the Land Parcels, so Land Managers owning n Land Parcels will be counted n times.
8.1.14
NetworkDistributionReport
For each requested social network, the report provides a histogram of the number of links against
the number of Land Managers.
Options:
•
Network: The network that information is required for (default all available). This can be
one of ‘Vendors’ (who sold a Parcel to whom), ‘Neighbours’ (who is a social neighbour
of whom), ‘Approvers’ (who are the approvers of whom), ‘Disapprovers’ (who are the
disapprovers of whom), ‘Approved’ (who approved of whom), ‘Disapproved’ (who
disapproved of whom), ‘Advisors’ (who are the advisors of whom), ‘Advisees’ (who was
advised by whom) or ‘All’ to explicitly request all of the above.
Created 2008-04-04
Modified 2008-04-18
Printed 2008-04-18
88
8.1.15
NetworkMatrixReport
For each requested social network, in each requested Year to report, a CSV file is created
containing the network matrix. This matrix has one row and one column for each Land Manager,
with a 1 entered in each element where the row Land Manager is connected to the column Land
Manager and a zero otherwise.
Options:
•
•
Network: As per NetworkDistributionReport.
Prefix: Allows a prefix (possibly including a full path) to be put in front of the default file
name for each matrix produced.
8.1.16
NetworkStatisticsReport
Provides a number of statistics * for each requested network. Where the network is not fully
connected (i.e. where there exist Land Managers between which there is no path), the statistics are
computed for fully connected subsets of Land Managers. The statistics include the diameter,
mean path length, assortativity, density, and clustering coefficient. For undirected networks, the
closeness centrality and centralisation index are also computed.
Options:
•
•
Network: As per NetworkDistributionReport.
NotConnected: Set the number to use in the geodesic distance matrix for nodes in the
network that are not connected. (Default infinity.)
8.1.17
ParcelLandManagerReport
Shows a distribution of the Estate size of the Land Managers (the number of Land Managers
owning each number of Land Parcels).
Options:
•
Sorted (flag — default True): Sort in ascending order of number of Land Parcels owned
8.1.18
ParcelStateReport
Shows all Land Parcel Biophysical Characteristics property value lists.
8.1.19
ParcelSubPopReport
Shows the number of Land Parcels owned by Land Managers of each Subpopulation
8.1.20
PollutionGridFileReport
Saves the Pollution of the Land Use in each Land Cell to the grid file. Warning: The Pollution is
per Land Parcel, and if two or more Cells belong to a Parcel, then there will seem to be more
Pollution than there is. **
Options:
*
These statistics, and the means of computing them, were supplied in a document circulated in the CAVES
(Complexity, Agents, Volatility, Evidence and Scale) EU FP6 NEST Pathfinder project on Tackling
Complexity in Science. (Document title: ‘CAVES Generalization Framework’; by Paulina Hetman and
Piotr Magnuszewski.)
**
This is arguably a bug since the Pollution should probably be per unit area rather than per Land Parcel.
Created 2008-04-04
Modified 2008-04-18
Printed 2008-04-18
89
•
•
GridFile: The name of a grid file to save the report to (default is the gridFile parameter).
NoData: The no-data value to use in the grid file (default -9999).
8.1.21
PollutionReport
Shows the total amount of Pollution.
8.1.22
SpatialAutocorrelationReport
Computes the autocorrelation index and p-value (using non-free sampling, of a specified number
of samples) of the requested spatial data. *
Options:
•
•
SpatialData: The spatial data to report on (default all of them), which can be one of:
‘Price’ (the most recent Price of Land Parcels), ‘LandUse’ (the Land Use applied to Land
Parcels), ‘OwnerChange’ (the number of times the Parcels have changed owner),
‘LandUseChange’ (the number of times the Parcels have changed Land Use), ‘Yield’ (the
most recent Yield of the Land Parcels), ‘Income’ (the most recent Income of the Land
Parcels), or use ‘All’ to explicitly request all of them.
NSamples: The number of samples (i.e. random distributions of the data) to use for
computing the p-value (default 1000).
8.1.23
SubPopDeathReport
Shows the number of Land Managers from each Subpopulation that have lost all their Land
Parcels this Year.
8.1.24
SubPopulationGridFileReport
Saves the Subpopulation of the Land Manager owning each Land Cell to the grid file.
Options:
•
•
8.1.25
GridFile: The name of a grid file to save the report to (default is the gridFile parameter).
NoData: The no-data value to use in the grid file (default -9999).
TimeSeriesReport
Computes the kurtosis, tail exponent and autocorrelation function for the requested time series. **
Numerous time series are available. The default (somewhat mislabelled ‘All’) is to show:
‘Pollution’ (the total Pollution in the Environment), ‘Population’ (the number of Land Managers),
‘LandUse’ (for each Land Use, the number of Land Parcels to which it is applied), ‘Suitability’
(for each Land Use, the number of Land Parcels for which it is (one of) the most suitable; i.e.
maximally Yield generating), ‘Profitability’ (for each Land Use, the number of Parcels for which
it is (one of) the most profitable; i.e. maximally Wealth generating), ‘LandUseMarket’ (for each
Land Use its current Market Value; i.e. the amount returned from the Income lookup table given
the current state of the Economy), ‘SubPopBids’ (for each Subpopulation, the average amount bid
by member Land Managers for Land Parcels), ‘SubPopCount’ (for each Subpopulation, the
number of member Land Managers), ‘SubPopParcels’ (for each Subpopulation, the number of
Parcels owned by its members), ‘SubPopBankruptcies’ (for each Subpopulation, the number of
*
These statistics, and the means of computing them, were supplied in a document circulated in the CAVES
(Complexity, Agents, Volatility, Evidence and Scale) EU FP6 NEST Pathfinder project on Tackling
Complexity in Science. (Document title: ‘CAVES Generalization Framework’; by Paulina Hetman and
Piotr Magnuszewski.)
**
As were these.
Created 2008-04-04
Modified 2008-04-18
Printed 2008-04-18
90
bankruptcies this Year), ‘EstateSize’ (the distribution of size of Estate of all Land Managers),
‘Account’ (the distribution of Account of all Land Managers), ‘Profit’ (the distribution of Profit
earned this Year by all Land Managers), ‘Age’ (the distribution of Age of all Land Managers),
‘LandUseChange’ (the distribution of number of Land Use changes on all Land Parcels),
‘LandManagerChange’ (the distribution of number of changes of owner on all Land Parcels),
‘Price’ (the distribution of most recent Price of all Land Parcels). Those series listed as being “for
each x” will create a separate time series for each x. Those listed as being “the distribution of x”
will use the CollectiveSource parameter setting to determine the time series data from the
distribution.
The following time series are available where a Government agent is configured, but are not
included in the ‘All’ option: ‘Expenditure’ (the amount spent by the Government this Year),
‘Fines’ (for classes of Government issuing Fines only, the total amount of Fines received this
Year), ‘ManagerRewards’ (the distribution of rewards for all Land Managers), ‘ManagerFines’
(the distribution of fines for all Land Managers).
The following time series are available where Land Managers are of a class issuing Approval and
Disapproval, but are not included in the ‘All’ option: ‘Approval’ (the distribution of Approval
received by all Land Managers), ‘Disapproval’ (the distribution of Disapproval received by all
Land Managers), ‘Approving’ (the distribution of Approval given by all Land Managers),
‘Disapproving’ (the distribution of Disapproval given by all Land Managers).
Options:
•
•
•
•
•
•
•
TimeSeries: The time series to use (see above for those available). Default is ‘All’.
ACFLength: The length of the autocorrelation function (back from the reporting time
step) to show (default 20).
CollectiveSource: For time series derived from a collection (e.g. all Land Parcels or Land
Managers), specify the statistic to use to create the time series. This can be one of
‘Minimum’, ‘Maximum’, ‘Mean’ (the default), ‘Variance’, ‘Median’ or ‘Total’.
RelativeChange (flag — default False): Compute the statistics on the relative change time
series xt = |yt – yt – 1|/ yt – 1 as opposed to the original time series yt.
ShowTimeSeries (flag — default False): Write out the whole time series.
ShowThisYear (flag — default False): Write out this Year’s data for the time series.
SingleRowSeries (flag — default True): Separate the ACF and time series data (if
written) by column. If this flag is set to False, each element in the time series (if written)
and ACF will be on its own row.
8.1.26
WealthGridFileReport
Saves the Account of the Land Manager owning each Land Cell to the grid file. Warning: The
Account belongs to the Land Manager, so if you add up all the numbers in the Land Cells,
particularly if there are multi-Cell Parcels, the total Account in the grid file will exceed the total
wealth of the Land Managers.
Options:
•
•
8.1.27
GridFile: The name of a grid file to save the report to (default is the gridFile parameter).
NoData: The no-data value to use in the grid file (default -9999).
YieldGridFileReport
Saves the Yield of the Land Parcel to which each Land Cell belongs to the grid file. Warning: The
Yield is a Land Parcel property, and if there are multi-Cell Parcels, there will seem to be more
Yield in the grid file than was actually generated.
Created 2008-04-04
Modified 2008-04-18
Printed 2008-04-18
91
Options:
•
•
8.2
GridFile: The name of a grid file to save the report to (default is the gridFile parameter).
NoData: The no-data value to use in the grid file (default -9999).
Verbosity
Verbosity output is explained in some detail earlier in this document. The set of available
verbosity messages is shown in Table 1 together with their verbosity levels. The default verbosity
levels are created in the FEARLUS executable directory during compilation when you make
fearlus.verby. If you want to define your own verbosity file you can do so in one of two ways.
When FEARLUS first starts it checks for a verbosity file in the environment variable
FEARLUS_VERBOSITY_FILE. If that variable is not defined, or the file it contains does not
exist, it looks in the current working directory for fearlus.verby before using fearlus.verby in the
FEARLUS executable directory. If none of these files exist, then there are no verbosity levels
defined, and if you want to obtain verbosity messages you have to specifically state which ones
you want using the +verbosity1+verbosity2… argument to the –D command-line option (see
section 3.2.1 for more information on this command-line option). The format of the verbosity file
consists of one verbosity message from Table 1 followed by a verbosity level on each line of the
file. Any verbosity message not specified in the file will not have a verbosity level, and if you
want these messages you will have to ask for them specifically using the +verbosity argument to
the –D command-line option.
Verbosity messages are formatted with the Year they are generated first, then the name of the
verbosity message, then the output generated by that message.
8.2.1
Approval
Reports all approval and disapprovals exchanged between Land Managers. Examples:
00006:Approval: Manager 604 disapproves of manager 510 amount 1 due to LandUseGroupTrigger
00006:Approval: Land manager 510 accepts disapproval 1 from manager 604
00006:Approval: Manager 604 neither approves nor disapproves of manager 469 due to
LandUseGroupTrigger
00006:Approval: Manager 604 disapproves of manager 492 amount 1 due to LandUseGroupTrigger
00006:Approval: Land manager 492 accepts disapproval 1 from manager 604
8.2.2
CaseBase
Reports on case base lookups. Example output:
00002:CaseBase:
00002:CaseBase:
00002:CaseBase:
00002:CaseBase:
00002:CaseBase:
00002:CaseBase:
00002:CaseBase:
00002:CaseBase:
00002:CaseBase:
00002:CaseBase:
8.2.3
The first case was the best case when looking up
Re-ordering episodic memory for land use 12
The best case was other than the first case when
Re-ordering episodic memory for land use 1
The best case was other than the first case when
Re-ordering episodic memory for land use 3
The best case was other than the first case when
Re-ordering episodic memory for land use 1
The first case was the best case when looking up
Re-ordering episodic memory for land use 3
land use 12
looking up land use 1
looking up land use 3
looking up land use 1
land use 3
CaseBaseDetail
Detail on cases added to and removed from the case base of each Land Manager. Vast amounts of
output generated. This verbosity should possibly be used in conjunction with the Learning
verbosity output so you can see the Land Manager the case base additions apply to. The following
illustrates:
00002:CaseBaseDetail: Adding case:
Created 2008-04-04
Modified 2008-04-18
Printed 2008-04-18
92
CASE:
Time: 2
STATE:
Biophysical Characteristics: (land parcel 14, 24)
Climate: {LowVar Cold}
Economy: {Bear HighXch}
DECISION:
Land Use ID: 11
OUTCOME:
Profit: -1.91596
Approval: 14
00002:Learning: Land Manager 37 added the following case to their case base:
CASE:
Time: 2
STATE:
Biophysical Characteristics: (land parcel 14, 24)
Climate: {LowVar Cold}
Economy: {Bear HighXch}
DECISION:
Land Use ID: 11
OUTCOME:
Profit: -1.91596
Approval: 14
00002:Learning: Event NeighbourDisapprovalEvent has happened to land manager 37
00002:Learning: Land manager 37 increased approval salience by 0.447726 to 7.13571
8.2.4
Climate
Shows the Climate state each Year. Examples:
00151:Climate: New climate:
{LowVar Cool}
From file:
suddenchange150.clim
00152:Climate: New climate:
{HighVar Warm}
8.2.5
Clumping
Shows the Biophysical Characteristics symbols states after clumping is completed:
00000:Clumping: New
LandCell at
LandCell at
LandCell at
LandCell at
LandCell at
LandCell at
LandCell at
biophysical characteristics for land cells:
(0, 0): {LCA-IV Flat}
(0, 1): {LCA-II Steep}
(0, 2): {LCA-V Flat}
(0, 3): {LCA-I Steep}
(0, 4): {LCA-V Steep}
(0, 5): {LCA-V Steep}
(0, 6): {LCA-III Flat}
…etc.
8.2.6
ClumpingDetail
Though available as a verbosity message, none of the currently implemented clumping classes
issue any of these messages.
8.2.7
ClumpingMinutiae
Though available as a verbosity message, none of the currently implemented clumping classes
issue any of these messages.
8.2.8
Decision
Shows (for SubPopulation class members) the decision each Land Manager made.
00007:Decision: Land manager 191 selected land use 5 (Barley Organic) for land parcel 741
at (18, 20) using method EccentricSpecialistStrategy
00007:Decision: Land manager 201 selected land use 5 (Barley Organic) for land parcel 718
at (17, 37) using method HabitStrategy
00007:Decision: Land manager 201 selected land use 4 (Beef Non-organic) for land parcel
839 at (20, 38) using method HabitStrategy
Created 2008-04-04
Modified 2008-04-18
Printed 2008-04-18
93
00007:Decision: Land manager 202 selected land use 1 (Oat Non-organic) for land parcel 723
at (18, 2) using method RandomCopyingStrategy
8.2.9
DecisionAlgorithm
Explains how the Land Use decision is made. Information displayed depends on Land Manager
class. The following is for the LandManager class:
00008:DecisionAlgorithm: Allocation method selected for land parcel 1528 at (38, 7):
HabitStrategy by land manager 1775 because the income per unit area 47.7381 is at or above
the threshold 6.27957
00008:DecisionAlgorithm: Allocation method selected for land parcel 714 at (17, 33):
EccentricSpecialistStrategy by land manager 1785 because land parcel's income per unit
area 74.4769 is below threshold 99 and choice 0.033238 made to use non-imitative strategy
(probability 1)
00008:DecisionAlgorithm: Allocation method selected for land parcel 832 at (20, 31):
YieldAverageWeightedTemporalCopyingStrategy by land manager 1799 because land parcel's
income per unit area 3.44321 is below threshold 31.5377 and choice 0.23301 made to use
imitative strategy (probability 1)
00008:DecisionAlgorithm: Allocation method selected for land parcel 873 at (21, 32):
HabitStrategy by land manager 1799 because the income per unit area 38.5537 is at or above
the threshold 31.5377
8.2.10
DecisionAlgorithmDetail
More details on the decision algorithm process. The message displayed depends on the Strategy
and the class of Land Manager. (Note that ‘Yield’ in what follows is in fact Parcel gross
Income’.)
00001:DecisionAlgorithmDetail: Using yield average weighted copying strategy of land manager 119 to
determine land use for land parcel 438 at (10, 37)
00001:DecisionAlgorithmDetail: Yield of land parcel 478 at (11, 37) with land use 3 = 6.52427 (0 years
ago)
00001:DecisionAlgorithmDetail: Yield of land parcel 477 at (11, 36) with land use 3 = 7.31036 (0 years
ago)
00001:DecisionAlgorithmDetail: Yield of land parcel 438 at (10, 37) with land use 5 = 21.5991 (0 years
ago)
00001:DecisionAlgorithmDetail: Yield of land parcel 437 at (10, 36) with land use 5 = 11.0888 (0 years
ago)
00001:DecisionAlgorithmDetail: Adding scores for yield of land parcels belonging to land manager 120
00001:DecisionAlgorithmDetail: Yield of land parcel 480 at (11, 39) with land use 2 = 0.996947 (0 years
ago). Score of land use incremented by 1.49685
00001:DecisionAlgorithmDetail: Yield of land parcel 479 at (11, 38) with land use 6 = 4.70202 (0 years
ago). Score of land use incremented by 7.05975
00001:DecisionAlgorithmDetail: Yield of land parcel 440 at (10, 39) with land use 2 = 1.60527 (0 years
ago). Score of land use incremented by 2.4102
00001:DecisionAlgorithmDetail: Yield of land parcel 439 at (10, 38) with land use 1 = 10.4426 (0 years
ago). Score of land use incremented by 15.6788
00001:DecisionAlgorithmDetail: Adding scores for yield of land parcels belonging to land manager 139
00001:DecisionAlgorithmDetail: Yield of land parcel 558 at (13, 37) with land use 6 = 11.0115 (0 years
ago). Score of land use incremented by 16.533
00001:DecisionAlgorithmDetail: Yield of land parcel 557 at (13, 36) with land use 3 = 4.984 (0 years
ago). Score of land use incremented by 7.48312
00001:DecisionAlgorithmDetail: Yield of land parcel 518 at (12, 37) with land use 2 = 0.932038 (0 years
ago). Score of land use incremented by 1.39939
00001:DecisionAlgorithmDetail: Yield of land parcel 517 at (12, 36) with land use 5 = 23.4248 (0 years
ago). Score of land use incremented by 35.1707
00001:DecisionAlgorithmDetail: Adding scores for yield of land parcels belonging to land manager 140
00001:DecisionAlgorithmDetail: Yield of land parcel 560 at (13, 39) with land use 5 = 85.5547 (0 years
ago). Score of land use incremented by 128.454
00001:DecisionAlgorithmDetail: Yield of land parcel 559 at (13, 38) with land use 4 = 11.4882 (0 years
ago). Score of land use incremented by 17.2487
00001:DecisionAlgorithmDetail: Yield of land parcel 520 at (12, 39) with land use 6 = 21.0123 (0 years
ago). Score of land use incremented by 31.5485
00001:DecisionAlgorithmDetail: Yield of land parcel 519 at (12, 38) with land use 1 = 11.4743 (0 years
ago). Score of land use incremented by 17.2279
00001:DecisionAlgorithmDetail: Adding scores for yield of land parcels belonging to land manager 118
00001:DecisionAlgorithmDetail: Yield of land parcel 476 at (11, 35) with land use 4 = 28.6623 (0 years
ago). Score of land use incremented by 43.0344
00001:DecisionAlgorithmDetail: Yield of land parcel 475 at (11, 34) with land use 3 = 0.203348 (0 years
ago). Score of land use incremented by 0.305313
00001:DecisionAlgorithmDetail: Yield of land parcel 436 at (10, 35) with land use 6 = 10.4426 (0 years
ago). Score of land use incremented by 15.6788
00001:DecisionAlgorithmDetail: Yield of land parcel 435 at (10, 34) with land use 1 = 7.91554 (0 years
ago). Score of land use incremented by 11.8846
00001:DecisionAlgorithmDetail: Adding scores for yield of land parcels belonging to land manager 99
00001:DecisionAlgorithmDetail: Yield of land parcel 398 at (9, 37) with land use 5 = 25.1875 (0 years
ago). Score of land use incremented by 37.8173
Created 2008-04-04
Modified 2008-04-18
Printed 2008-04-18
94
00001:DecisionAlgorithmDetail: Yield of land parcel 397 at (9, 36) with land use
ago). Score of land use incremented by 17.2279
00001:DecisionAlgorithmDetail: Yield of land parcel 358 at (8, 37) with land use
ago). Score of land use incremented by 10.976
00001:DecisionAlgorithmDetail: Yield of land parcel 357 at (8, 36) with land use
ago). Score of land use incremented by 3.15247
00001:DecisionAlgorithmDetail: Adding scores for yield of land parcels belonging
00001:DecisionAlgorithmDetail: Yield of land parcel 396 at (9, 35) with land use
ago). Score of land use incremented by 17.2487
00001:DecisionAlgorithmDetail: Yield of land parcel 395 at (9, 34) with land use
ago). Score of land use incremented by 11.1622
00001:DecisionAlgorithmDetail: Yield of land parcel 356 at (8, 35) with land use
ago). Score of land use incremented by 32.4295
00001:DecisionAlgorithmDetail: Yield of land parcel 355 at (8, 34) with land use
ago). Score of land use incremented by 43.0344
00001:DecisionAlgorithmDetail: Choice of land use made as follows
Land Use
Score
Cumulative score range for choice
1
14.9305
0 <= choice < 14.9305
2
1.76881
14.9305 <= choice < 16.6993
3
6.70196
16.6993 <= choice < 23.4012
4
30.1416
23.4012 <= choice < 53.5428
5
44.4266
53.5428 <= choice < 97.9694 <-- choice = 59.4225
6
17.6096
97.9694 <= choice < 115.579
8.2.11
6 = 11.4743 (0 years
3 = 7.31036 (0 years
3 = 2.09965 (0 years
to land manager 98
4 = 11.4882 (0 years
3 = 7.43436 (0 years
5 = 21.5991 (0 years
4 = 28.6623 (0 years
Economy
Much as for the Climate verbosity, this shows the state of the Economy each Year:
00003:Economy: New economy:
{Bull LowXch}
8.2.12
FarmScaleFixedCosts
If a Farm Scale Fixed Cost file is used, then each Year the value read from the file will be shown.
The messages are not shown if the Farm Scale Fixed Costs are/become constant. Example:
00008:FarmScaleFixedCosts: Farm scale fixed costs set to
00009:FarmScaleFixedCosts: Farm scale fixed costs set to
Warning: Failed to read next farm scale fixed costs from
file. Farm scale fixed costs will remain constant at 43.
00010:FarmScaleFixedCosts: Farm scale fixed costs set to
8.2.13
67
43
file manual-CBR.fsfc. Closing
43
Government
Messages will depend on the class of Government used. The following are examples from
ParcelRewardingGovernment:
00010:Government: Not issuing reward because environment pollution 1587.12 is more than or
equal to threshold 1550
00011:Government: Issuing reward to all land managers as environment pollution 1513.5 is
less than threshold 1550
00012:Government: Not issuing reward because environment pollution 1695.67 is more than or
equal to threshold 1550
8.2.14
GovernmentDetail
More detailed messages about the Government, that again will be class specific. The following
might be seen in a particular Year with ParcelRewardingGovernment.
00043:GovernmentDetail:
00043:GovernmentDetail:
00043:GovernmentDetail:
00043:GovernmentDetail:
00043:GovernmentDetail:
00043:GovernmentDetail:
00043:GovernmentDetail:
00043:GovernmentDetail:
00043:GovernmentDetail:
00043:GovernmentDetail:
00043:GovernmentDetail:
00043:GovernmentDetail:
00043:GovernmentDetail:
00043:GovernmentDetail:
Issuing
Issuing
Issuing
Issuing
Issuing
Issuing
Issuing
Issuing
Issuing
Issuing
Issuing
Issuing
Issuing
Issuing
reward
reward
reward
reward
reward
reward
reward
reward
reward
reward
reward
reward
reward
reward
100 to land manager 4
130 to land manager 5
110 to land manager 2
90 to land manager 6
160 to land manager 3
120 to land manager 1
10 to land manager 8
10 to land manager 10
10 to land manager 12
10 to land manager 14
20 to land manager 22
10 to land manager 36
10 to land manager 38
10 to land manager 39
Created 2008-04-04
Modified 2008-04-18
Printed 2008-04-18
95
00043:GovernmentDetail: Issuing reward 10 to land manager 40
00043:GovernmentDetail: Issuing reward 10 to land manager 41
00043:GovernmentDetail: Issuing reward 10 to land manager 42
8.2.15
GovernmentFines/GovernmentRewards
If the Government class issues fines or rewards to Land Managers, these messages will confirm
their receipt:
00036:GovernmentRewards:
00036:GovernmentRewards:
00036:GovernmentRewards:
00036:GovernmentRewards:
00036:GovernmentRewards:
00036:GovernmentRewards:
00036:GovernmentRewards:
00036:GovernmentRewards:
00036:GovernmentRewards:
00036:GovernmentRewards:
00036:GovernmentRewards:
00036:GovernmentRewards:
00036:GovernmentRewards:
00036:GovernmentRewards:
00036:GovernmentRewards:
00036:GovernmentRewards:
00036:GovernmentRewards:
00036:GovernmentRewards:
00036:GovernmentRewards:
00036:GovernmentRewards:
00036:GovernmentRewards:
00036:GovernmentRewards:
00036:GovernmentRewards:
00036:GovernmentRewards:
00036:GovernmentRewards:
00036:GovernmentRewards:
00036:GovernmentRewards:
00036:GovernmentRewards:
00036:GovernmentRewards:
00036:GovernmentRewards:
00036:GovernmentRewards:
00036:GovernmentRewards:
00036:GovernmentRewards:
00036:GovernmentRewards:
00036:GovernmentRewards:
00036:GovernmentRewards:
00036:GovernmentRewards:
00036:GovernmentRewards:
8.2.16
Land
Land
Land
Land
Land
Land
Land
Land
Land
Land
Land
Land
Land
Land
Land
Land
Land
Land
Land
Land
Land
Land
Land
Land
Land
Land
Land
Land
Land
Land
Land
Land
Land
Land
Land
Land
Land
Land
Manager
Manager
Manager
Manager
Manager
Manager
Manager
Manager
Manager
Manager
Manager
Manager
Manager
Manager
Manager
Manager
Manager
Manager
Manager
Manager
Manager
Manager
Manager
Manager
Manager
Manager
Manager
Manager
Manager
Manager
Manager
Manager
Manager
Manager
Manager
Manager
Manager
Manager
56 accepts reward of 150. Account now 11094.7
45 accepts reward of 70. Account now 2720.75
65 accepts reward of 90. Account now 4362.25
67 accepts reward of 150. Account now 3827.2
36 accepts reward of 110. Account now 2596.51
44 accepts reward of 40. Account now 1121.95
75 accepts reward of 130. Account now 3708.75
78 accepts reward of 180. Account now 9086.38
25 accepts reward of 70. Account now 4456.16
23 accepts reward of 90. Account now 5135.51
33 accepts reward of 40. Account now 3661.63
43 accepts reward of 110. Account now 4828.92
53 accepts reward of 170. Account now 8407.78
83 accepts reward of 140. Account now 5847.26
86 accepts reward of 70. Account now 4232.01
69 accepts reward of 40. Account now 4135.57
59 accepts reward of 60. Account now 2919.23
49 accepts reward of 280. Account now 14511.8
32 accepts reward of 70. Account now 4643.78
42 accepts reward of 50. Account now 2072.99
52 accepts reward of 50. Account now 2616.09
93 accepts reward of 200. Account now 14233.1
96 accepts reward of 130. Account now 8265.42
90 accepts reward of 190. Account now 5765.25
70 accepts reward of 90. Account now 3391.25
50 accepts reward of 60. Account now 1328.23
10 accepts reward of 40. Account now 3968.21
9 accepts reward of 200. Account now 6628.59
8 accepts reward of 80. Account now 5422.55
7 accepts reward of 150. Account now 9438.95
5 accepts reward of 120. Account now 11263.9
4 accepts reward of 110. Account now 3328.22
2 accepts reward of 90. Account now 4065.76
21 accepts reward of 160. Account now 3753.18
41 accepts reward of 50. Account now 1619.19
51 accepts reward of 50. Account now 2720.01
71 accepts reward of 110. Account now 5739.12
109 accepts reward of 10. Account now 202.538
GridFile
Messages confirming loading/saving of layers from/to the grid file, if specified:
00000:GridFile:
00000:GridFile:
00000:GridFile:
00000:GridFile:
00000:GridFile:
00000:GridFile:
00000:GridFile:
Created new grid file manual.grd
Appended layer *FEARLUS-LandParcelID to grid file manual.grd
Appended layer *FEARLUS-Biophys LCAClass to grid file manual.grd
Appended layer *FEARLUS-Biophys Slope to grid file manual.grd
Appended layer *FEARLUS-SubPopulationID Initial to grid file manual.grd
Appended layer *FEARLUS-LandManagerID Initial to grid file manual.grd
Appended layer *FEARLUS-LandUseID Initial to grid file manual.grd
00000:GridFile:
00000:GridFile:
00000:GridFile:
00000:GridFile:
00000:GridFile:
00000:GridFile:
Loaded
Loaded
Loaded
Loaded
Loaded
Loaded
8.2.17
layer
layer
layer
layer
layer
layer
FEARLUS-LandParcelID from grid file manual.grd
FEARLUS-Biophys LCAClass from grid file manual.grd
FEARLUS-Biophys Slope from grid file manual.grd
FEARLUS-SubPopulationID Initial from grid file manual.grd
FEARLUS-LandManagerID Initial from grid file manual.grd
FEARLUS-LandUseID Initial from grid file manual.grd
GridLayers
Detailed messages on setting and accessing information in the grid. Some examples follow:
Created 2008-04-04
Modified 2008-04-18
Printed 2008-04-18
96
00000:GridLayers: Setting layer FEARLUS-LandParcelID to value 1 in cell (0, 0)
00000:GridLayers: Setting layer FEARLUS-LandParcelID to value 1 in cell (1, 0)
00000:GridLayers: Setting layer FEARLUS-Biophys LCAClass to value LCA-V in cell (5, 4)
00000:GridLayers: Setting layer FEARLUS-Biophys LCAClass to value LCA-V in cell (6, 4)
00000:GridLayers: Setting layer FEARLUS-LandUseID Initial to value 7 in cell (4, 14)
00000:GridLayers: Setting layer FEARLUS-LandUseID Initial to value 7 in cell (5, 14)
00000:GridLayers: Accessing layer FEARLUS-LandManagerID Initial with value 60 in cell
(22, 36)
00000:GridLayers: Accessing layer FEARLUS-SubPopulationID Initial with value 1 in cell
(20, 36)
8.2.18
GUI
Indication of colourmap information:
00000:GUI: Allocated 240 colours
8.2.19
GUIKey
Details of additions to the decision component key. The following is an example for
CBRSocialSubPopulation classes:
00000:GUIKey:
00000:GUIKey:
00000:GUIKey:
00000:GUIKey:
00000:GUIKey:
00000:GUIKey:
00000:GUIKey:
00000:GUIKey:
00000:GUIKey:
8.2.20
Adding
Adding
Adding
Adding
Adding
Adding
Adding
Adding
Adding
decision
decision
decision
decision
decision
decision
decision
decision
decision
component
component
component
component
component
component
component
component
component
ExperimentationMode to key
ExperimentationStrategy to key
HabitMode to key
ImitationStrategy to key
ImperfectAdviceMode to key
ImperfectMatchMode to key
InitialMode to key
PerfectAdviceMode to key
PerfectMatchMode to key
GUINeighbourhoodDetail
Details of the process used when a Cell is left-clicked in the Land Use raster to decide where to
draw boundaries between neighbours and non-neighbours of the clicked cell (see Figure 44(b)). A
brief excerpt of the kind of output obtained follows:
00013:GUINeighbourhoodDetail: Land Parcel 316 at
00013:GUINeighbourhoodDetail: Land Parcel 316 at
...drawing a line between 316 and 316 at
00013:GUINeighbourhoodDetail: Land Parcel 316 at
...drawing a line between 316 and 316 at
00013:GUINeighbourhoodDetail: Land Parcel 317 at
00013:GUINeighbourhoodDetail: ...and not visited
00013:GUINeighbourhoodDetail: Land Parcel 317 at
00013:GUINeighbourhoodDetail: Land Parcel 317 at
00013:GUINeighbourhoodDetail: ...and not visited
00013:GUINeighbourhoodDetail: Land Parcel 317 at
00013:GUINeighbourhoodDetail: Land Parcel 297 at
00013:GUINeighbourhoodDetail: ...and not visited
00013:GUINeighbourhoodDetail: Land Parcel 297 at
00013:GUINeighbourhoodDetail: Land Parcel 297 at
00013:GUINeighbourhoodDetail: ...and not visited
00013:GUINeighbourhoodDetail: Land Parcel 297 at
00013:GUINeighbourhoodDetail: Land Parcel 277 at
...drawing a line between 277 and 297 at
00013:GUINeighbourhoodDetail: Land Parcel 296 at
00013:GUINeighbourhoodDetail: ...and not visited
00013:GUINeighbourhoodDetail: Land Parcel 296 at
00013:GUINeighbourhoodDetail: Land Parcel 276 at
...drawing a line between 276 and 296 at
00013:GUINeighbourhoodDetail: Land Parcel 296 at
00013:GUINeighbourhoodDetail: ...and not visited
00013:GUINeighbourhoodDetail: Land Parcel 296 at
00013:GUINeighbourhoodDetail: Land Parcel 276 at
...drawing a line between 276 and 296 at
00013:GUINeighbourhoodDetail: Land Parcel 295 at
00013:GUINeighbourhoodDetail: ...and not visited
00013:GUINeighbourhoodDetail: Land Parcel 295 at
00013:GUINeighbourhoodDetail: Land Parcel 275 at
...drawing a line between 275 and 295 at
00013:GUINeighbourhoodDetail: Land Parcel 295 at
(31, 31)
(30, 31)
(31, 31)
(31, 30)
(31, 31)
(31, 32)
already
(31, 32)
(30, 32)
already
(30, 32)
(29, 32)
already
(29, 32)
(28, 32)
already
(28, 32)
(27, 32)
(28, 32)
(28, 31)
already
(28, 31)
(27, 31)
(28, 31)
(28, 30)
already
(28, 30)
(27, 30)
(28, 30)
(28, 29)
already
(28, 29)
(27, 29)
(28, 29)
(28, 28)
drawing neighbours of 316 at (30, 30)
is not a neighbour of 316 at (30, 30)...
is not a neighbour of 316 at (30, 30)...
is a neighbour of 316 at (30, 30)...
drawing neighbours of 316 at (30, 30)
is a neighbour of 316 at (30, 30)...
drawing neighbours of 316 at (30, 30)
is a neighbour of 316 at (30, 30)...
drawing neighbours of 316 at (30, 30)
is a neighbour of 316 at (30, 30)...
drawing neighbours of 316 at (30, 30)
is not a neighbour of 316 at (30, 30)...
is a neighbour of 316 at (30, 30)...
drawing neighbours of 316 at (30, 30)
is not a neighbour of 316 at (30, 30)...
is a neighbour of 316 at (30, 30)...
drawing neighbours of 316 at (30, 30)
is not a neighbour of 316 at (30, 30)...
is a neighbour of 316 at (30, 30)...
drawing neighbours of 316 at (30, 30)
is not a neighbour of 316 at (30, 30)...
is a neighbour of 316 at (30, 30)...
Created 2008-04-04
Modified 2008-04-18
Printed 2008-04-18
97
00013:GUINeighbourhoodDetail: ...and not visited already
00013:GUINeighbourhoodDetail: Land Parcel 295 at (28, 28) drawing neighbours of
00013:GUINeighbourhoodDetail: Land Parcel 275 at (27, 28) is not a neighbour of
...drawing a line between 275 and 295 at (28, 28)
00013:GUINeighbourhoodDetail: Land Parcel 294 at (28, 27) is not a neighbour of
...drawing a line between 294 and 295 at (28, 28)
00013:GUINeighbourhoodDetail: Land Parcel 295 at (28, 29) is a neighbour of 316
00013:GUINeighbourhoodDetail: ...but it has already been visited
00013:GUINeighbourhoodDetail: Land Parcel 295 at (29, 28) is a neighbour of 316
00013:GUINeighbourhoodDetail: ...and not visited already
00013:GUINeighbourhoodDetail: Land Parcel 295 at (29, 28) drawing neighbours of
00013:GUINeighbourhoodDetail: Land Parcel 295 at (28, 28) is a neighbour of 316
00013:GUINeighbourhoodDetail: ...but it has already been visited
00013:GUINeighbourhoodDetail: Land Parcel 294 at (29, 27) is not a neighbour of
...drawing a line between 294 and 295 at (29, 28)
00013:GUINeighbourhoodDetail: Land Parcel 295 at (29, 29) is a neighbour of 316
00013:GUINeighbourhoodDetail: ...and not visited already
8.2.21
316 at (30, 30)
316 at (30, 30)...
316 at (30, 30)...
at (30, 30)...
at (30, 30)...
316 at (30, 30)
at (30, 30)...
316 at (30, 30)...
at (30, 30)...
Harvest
Details of the harvest process each Year, including all information on how income is generated
from the Parcels. The following shows the messages that might be generated for one Land
Manager.
00093:Harvest: Economy of scale for land use 3 (Barley Organic) on land parcel 242 at (24,
2) used by land manager 71 with total area 10.4 for this land use: 1
00093:Harvest: Land manager 71 harvesting yield (12.9431) with income (127.329) from land
parcel 242 at (24, 2) with break-even threshold 78. Account 19532.4 will be incremented by
49.3294 to 19581.8
00093:Harvest: Economy of scale for land use 3 (Barley Organic) on land parcel 262 at (26,
2) used by land manager 71 with total area 10.4 for this land use: 1
00093:Harvest: Land manager 71 harvesting yield (11.4706) with income (112.844) from land
parcel 262 at (26, 2) with break-even threshold 78. Account 19581.8 will be incremented by
34.8438 to 19616.6
00093:Harvest: Economy of scale for land use 3 (Barley Organic) on land parcel 261 at (26,
0) used by land manager 71 with total area 10.4 for this land use: 1
00093:Harvest: Land manager 71 harvesting yield (18.5459) with income (182.448) from land
parcel 261 at (26, 0) with break-even threshold 78. Account 19616.6 will be incremented by
104.448 to 19721.1
00093:Harvest: Economy of scale for land use 8 (Beef Non-organic) on land parcel 322 at
(32, 2) used by land manager 71 with total area 18.2 for this land use: 1
00093:Harvest: Land manager 71 harvesting yield (9.84443) with income (98.3511) from land
parcel 322 at (32, 2) with break-even threshold 78. Account 19721.1 will be incremented by
20.3511 to 19741.4
00093:Harvest: Economy of scale for land use 8 (Beef Non-organic) on land parcel 263 at
(26, 4) used by land manager 71 with total area 18.2 for this land use: 1
00093:Harvest: Land manager 71 harvesting yield (7.25756) with income (72.5069) from land
parcel 263 at (26, 4) with break-even threshold 78. Account 19741.4 will be incremented by
-5.49313 to 19735.9
00093:Harvest: Economy of scale for land use 8 (Beef Non-organic) on land parcel 283 at
(28, 4) used by land manager 71 with total area 18.2 for this land use: 1
00093:Harvest: Land manager 71 harvesting yield (10.6) with income (105.9) from land
parcel 283 at (28, 4) with break-even threshold 78. Account 19735.9 will be incremented by
27.8996 to 19763.8
00093:Harvest: Economy of scale for land use 3 (Barley Organic) on land parcel 303 at (30,
4) used by land manager 71 with total area 10.4 for this land use: 1
00093:Harvest: Land manager 71 harvesting yield (10.8089) with income (106.334) from land
parcel 303 at (30, 4) with break-even threshold 78. Account 19763.8 will be incremented by
28.3338 to 19792.1
00093:Harvest: Economy of scale for land use 8 (Beef Non-organic) on land parcel 301 at
(30, 0) used by land manager 71 with total area 18.2 for this land use: 1
00093:Harvest: Land manager 71 harvesting yield (8.45528) with income (84.4728) from land
parcel 301 at (30, 0) with break-even threshold 78. Account 19792.1 will be incremented by
6.47278 to 19798.6
00093:Harvest: Economy of scale for land use 8 (Beef Non-organic) on land parcel 281 at
(28, 0) used by land manager 71 with total area 18.2 for this land use: 1
00093:Harvest: Land manager 71 harvesting yield (10.5645) with income (105.545) from land
parcel 281 at (28, 0) with break-even threshold 78. Account 19798.6 will be incremented by
27.5449 to 19826.2
00093:Harvest: Economy of scale for land use 8 (Beef Non-organic) on land parcel 302 at
(30, 2) used by land manager 71 with total area 18.2 for this land use: 1
00093:Harvest: Land manager 71 harvesting yield (8.45389) with income (84.4589) from land
parcel 302 at (30, 2) with break-even threshold 78. Account 19826.2 will be incremented by
6.45891 to 19832.6
00093:Harvest: Economy of scale for land use 8 (Beef Non-organic) on land parcel 282 at
(28, 2) used by land manager 71 with total area 18.2 for this land use: 1
Created 2008-04-04
Modified 2008-04-18
Printed 2008-04-18
98
00093:Harvest: Land manager 71 harvesting yield (12.2313) with income (122.198) from land
parcel 282 at (28, 2) with break-even threshold 78. Account 19832.6 will be incremented by
44.1977 to 19876.8
00093:Harvest: Account of land manager 71 decremented by 43 to 19833.8 for farm scale
fixed costs
00093:Harvest: Account of land manager 71 incremented by 0 to 19833.8 for off farm income
8.2.22
Imitation
Confirms the neighbourhood searched by imitative Strategies by writing in the number of times
each Land Parcel is consulted. This should be 1 for all Land Parcels in the Social Neighbourhood
for all currently available imitative Strategies, and the verbosity message can be used to confirm
there is no undue bias. A lot of output is generated, the following showing the output for one
Land Parcel decision in one Year:
00001:Imitation: Land parcels consulted by land manager 195 when selecting land use 5
(Barley Organic) for land parcel 750 at (18, 29) using
YieldAverageWeightedTemporalCopyingStrategy:
|0123456789012345678901234567890123456789
-+---------------------------------------0|0000000000000000000000000000000000000000
1|0000000000000000000000000000000000000000
2|0000000000000000000000000000000000000000
3|0000000000000000000000000000000000000000
4|0000000000000000000000000000000000000000
5|0000000000000000000000000000000000000000
6|0000000000000000000000000000000000000000
7|0000000000000000000000000000000000000000
8|0000000000000000000000000000000000000000
9|0000000000000000000000000000000000000000
0|0000000000000000000000000000000000000000
1|0000000000000000000000000000000000000000
2|0000000000000000000000000000000000000000
3|0000000000000000000000000000000000000000
4|0000000000000000000000000000000000000000
5|0000000000000000000000000000000000000000
6|0000000000000000111100000000000000000000
7|0000000000000000111100000000000000000000
8|0000000000000000111111000000000000000000
9|0000000000000000111111000000000000000000
0|0000000000000000001111000000000000000000
1|0000000000000000001111000000000000000000
2|0000000000000000000000000000000000000000
3|0000000000000000000000000000000000000000
4|0000000000000000000000000000000000000000
5|0000000000000000000000000000000000000000
6|0000000000000000000000000000000000000000
7|0000000000000000000000000000000000000000
8|0000000000000000000000000000000000000000
9|0000000000000000000000000000000000000000
8.2.23
InitialLandUseAllocations
Shows, during Year 0, the Land Uses allocated to each Land Parcel. The following shows an
excerpt from example output.
00000:InitialLandUseAllocations: Land manager 398 selected initial land use 2 (Barley Nonorganic) for land parcel 1556 at (38, 35) using method RandomStrategy
00000:InitialLandUseAllocations: Allocation method selected for land parcel 1555 at (38,
34): RandomStrategy by land manager 398 because it is year 0
00000:InitialLandUseAllocations: Land manager 398 selected initial land use 6 (Oat Nonorganic) for land parcel 1555 at (38, 34) using method RandomStrategy
Created 2008-04-04
Modified 2008-04-18
Printed 2008-04-18
99
00000:InitialLandUseAllocations: Allocation method selected for land parcel
37): RandomStrategy by land manager 399 because it is year 0
00000:InitialLandUseAllocations: Land manager 399 selected initial land use
Organic) for land parcel 1598 at (39, 37) using method RandomStrategy
00000:InitialLandUseAllocations: Allocation method selected for land parcel
36): RandomStrategy by land manager 399 because it is year 0
00000:InitialLandUseAllocations: Land manager 399 selected initial land use
organic) for land parcel 1597 at (39, 36) using method RandomStrategy
00000:InitialLandUseAllocations: Allocation method selected for land parcel
37): RandomStrategy by land manager 399 because it is year 0
00000:InitialLandUseAllocations: Land manager 399 selected initial land use
organic) for land parcel 1558 at (38, 37) using method RandomStrategy
00000:InitialLandUseAllocations: Allocation method selected for land parcel
36): RandomStrategy by land manager 399 because it is year 0
00000:InitialLandUseAllocations: Land manager 399 selected initial land use
organic) for land parcel 1557 at (38, 36) using method RandomStrategy
00000:InitialLandUseAllocations: Allocation method selected for land parcel
39): RandomStrategy by land manager 400 because it is year 0
00000:InitialLandUseAllocations: Land manager 400 selected initial land use
organic) for land parcel 1600 at (39, 39) using method RandomStrategy
8.2.24
1598 at (39,
3 (Oat
1597 at (39,
1 (Oat Non1558 at (38,
1 (Oat Non1557 at (38,
4 (Beef Non1600 at (39,
6 (Oat Non-
LandManagerChange
Shows the update of Land Managers owning each Land Parcel each Year. Note that ownership of
all Land Parcels is shown, not just those with a change of Land Manager. The following is an
excerpt of output for one Year.
00005:LandManagerChange:
00005:LandManagerChange:
00005:LandManagerChange:
00005:LandManagerChange:
00005:LandManagerChange:
00005:LandManagerChange:
8.2.25
Updated
Updated
Updated
Updated
Updated
Updated
land
land
land
land
land
land
manager
manager
manager
manager
manager
manager
of
of
of
of
of
of
parcel
parcel
parcel
parcel
parcel
parcel
1576
1577
1578
1579
1580
1581
at
at
at
at
at
at
(39,
(39,
(39,
(39,
(39,
(39,
15)
16)
17)
18)
19)
20)
from
from
from
from
from
from
388 to 388
917 to 1705
917 to 1707
921 to 1708
922 to 12
12 to 12
LandManagerCreation
Details of new Land Managers created during initialisation and the Parcels they have been
assigned to:
00000:LandManagerCreation: Initial subpopulation for land parcel 261 at (26, 0) taken from
grid file manual.grd cell (26, 0)
00000:LandManagerCreation: Initial land manager ID for land parcel 261 at (26, 0) taken
from grid file manual.grd cell (26, 0)
00000:LandManagerCreation: Assigned land parcel 261 at (26, 0) to land manager ID 61 of
subpopulation ID 1
The above shows output when a grid file is used. Below, when assignment is done without a grid
file.
00000:LandManagerCreation:
00000:LandManagerCreation:
00000:LandManagerCreation:
00000:LandManagerCreation:
00000:LandManagerCreation:
8.2.26
Created land manager
Assigned land parcel
Assigned land parcel
Assigned land parcel
Assigned land parcel
ID 95
369 at
370 at
389 at
390 at
(36,
(36,
(37,
(37,
16)
17)
16)
17)
to
to
to
to
land
land
land
land
manager
manager
manager
manager
ID
ID
ID
ID
95
95
95
95
LandManagerCreationDetail
More information on the creation of each Land Manager showing how the Subpopulation they
belong to was selected. The following is an example for one Land Manager:
00008:LandManagerCreationDetail: Sub-population of a new land manager selected as follows:
Sub-pop Probability (Cumulative)
1
0.5 (0.5)
2
0.5 (1) <-- choice = 0.771853
8.2.27
LandManagerDestruction
Brief information on the ID of each bankrupt Land Manager each Year.
Created 2008-04-04
Modified 2008-04-18
Printed 2008-04-18
100
00004:LandManagerDestruction:
00004:LandManagerDestruction:
00004:LandManagerDestruction:
00004:LandManagerDestruction:
00004:LandManagerDestruction:
00004:LandManagerDestruction:
00004:LandManagerDestruction:
00004:LandManagerDestruction:
8.2.28
Killing
Killing
Killing
Killing
Killing
Killing
Killing
Killing
land
land
land
land
land
land
land
land
manager
manager
manager
manager
manager
manager
manager
manager
55
85
89
12
94
126
133
139
LandParcelCreation
Details during model initialisation of all Land Parcels and Land Cells created. The following is an
excerpt of the output generated:
00000:LandParcelCreation:
00000:LandParcelCreation:
00000:LandParcelCreation:
00000:LandParcelCreation:
00000:LandParcelCreation:
00000:LandParcelCreation:
00000:LandParcelCreation:
00000:LandParcelCreation:
00000:LandParcelCreation:
00000:LandParcelCreation:
00000:LandParcelCreation:
00000:LandParcelCreation:
00000:LandParcelCreation:
8.2.29
Created land cell at (32, 0)
Created land cell at (33, 0)
Created land cell at (34, 0)
Created land cell at (35, 0)
Created land cell at (36, 0)
Created land cell at (37, 0)
Created land cell at (38, 0)
Created land cell at (39, 0)
Added land cell at (20, 20) to land
Added land cell at (21, 20) to land
Added land cell at (21, 21) to land
Added land cell at (20, 21) to land
Cell at (19, 21) is a blank cell
parcel
parcel
parcel
parcel
ID
ID
ID
ID
51
51
51
51
LandUseChange
Shows the update of Land Uses for each Land Parcel each Year. Note that information is shown
even if the Land Use does not change. The following is an example excerpt from one Year’s
output:
00021:LandUseChange:
00021:LandUseChange:
00021:LandUseChange:
00021:LandUseChange:
00021:LandUseChange:
00021:LandUseChange:
00021:LandUseChange:
00021:LandUseChange:
8.2.30
Updated
Updated
Updated
Updated
Updated
Updated
Updated
Updated
land
land
land
land
land
land
land
land
use
use
use
use
use
use
use
use
of
of
of
of
of
of
of
of
parcel
parcel
parcel
parcel
parcel
parcel
parcel
parcel
234
214
194
174
154
134
133
132
at
at
at
at
at
at
at
at
(22,
(20,
(18,
(16,
(14,
(12,
(12,
(12,
26)
26)
26)
26)
26)
26)
24)
22)
from
from
from
from
from
from
from
from
2
2
3
3
8
7
7
7
to
to
to
to
to
to
to
to
3
3
9
9
7
12
7
7
LandUseCreation
Messages pertaining to the creation of Land Uses. e.g.:
00000:LandUseCreation: Created land use 1 (Wheat Organic):
LU({Wheat
Organic}
1.569747051519291e+01
0.000000000000000e+00
1.000000000000000e+00)
8.2.31
0.000000000000000e+00
LandUseMatch
This is a legacy verbosity message that is no longer issued.
8.2.32
LandUseMatchDetail
This is a legacy verbosity message that is no longer issued.
8.2.33
Learning
Output obtained here depends on Land Manager class. The following is an example for the
CBRSocialParcelLandManager class, providing details of case base update and processing of
Events:
00002:Learning: Land Manager 412 added the following case to their case base:
CASE:
Time: 2
Created 2008-04-04
Modified 2008-04-18
Printed 2008-04-18
101
STATE:
00002:Learning:
00002:Learning:
00002:Learning:
00002:Learning:
00002:Learning:
00002:Learning:
00002:Learning:
8.2.34
Biophysical Characteristics: (land parcel 32, 0)
Climate: {LowVar Cold}
Economy: {Bear LowXch}
DECISION:
Land Use ID: 12
OUTCOME:
Profit: -28.655
Approval: -7
Event ThresholdDisapprovalEvent has happened to land manager 412
Land manager 412 increased approval salience by 0.135393 to 3.62844
Event NoRewardEvent has happened to land manager 412
Land manager 412 increased approval salience by 0.135393 to 3.76384
Event LandParcelSoldEvent has not happened to land manager 412
Event BadHarvestEvent has happened to land manager 412
Land manager 412 increased profit salience by 0.135393 to 6.79688
LookupTable
Confirms locations of lookup tables read (note that five dashes replace the Year of the verbosity
message because at this stage the Environment has not been created):
-----:LookupTable:
-----:LookupTable:
-----:LookupTable:
-----:LookupTable:
-----:LookupTable:
-----:LookupTable:
8.2.35
Loading lookup table tree from file yield.tree
Loading lookup table tree from file income.tree
Populating lookup table from file yield.data
Lookup table file yield.data contains names
Populating lookup table from file income.data
Lookup table file income.data contains names
LookupTableLookups
Information on values set and accessed in the Lookup Tables. This generates a large amount of
output. Note that the names of symbols are converted to numeric references during lookups, and
unfortunately the latter are rather unhelpfully shown as demonstrated in the excerpts below:
-----:LookupTableLookups: Setting the value for a lookup table:
{LowVar,Cool,LCA-V,Steep,Lamb,Organic} position 1196: value 8.40118
00001:LookupTableLookups: Looking up the value for a lookup table:
[3,4,10,14,18,22] position 1027: value 9.44183
8.2.36
Neighbourhood
Shows how neighbourhoods are calculated for each Cell. Output is arranged such that toroidal
topology influences are also shown virtually (areas bordered by +), with the main Environment in
the middle (area bordered by #).
00000:Neighbourhood: Adding (1, 15) to list of neighbours of (2, 16)
00000:Neighbourhood: Adding (2, 15) to list of neighbours of (2, 16)
00000:Neighbourhood: Adding (3, 15) to list of neighbours of (2, 16)
00000:Neighbourhood: Adding (1, 16) to list of neighbours of (2, 16)
00000:Neighbourhood: Adding (2, 16) to list of neighbours of (2, 16)
00000:Neighbourhood: Adding (3, 16) to list of neighbours of (2, 16)
00000:Neighbourhood: Adding (1, 17) to list of neighbours of (2, 16)
00000:Neighbourhood: Adding (2, 17) to list of neighbours of (2, 16)
00000:Neighbourhood: Adding (3, 17) to list of neighbours of (2, 16)
00000:Neighbourhood: MooreNeighbourhood PlanarTopology neighbourhood of (2, 16) with radius 1:
0123456789012345678901234567890123456789 0123456789012345678901234567890123456789 0123456789012345678901234567890123456789
++++++++++++++++++++++++++++++++++++++++++++++++++++++++++++++++++++++++++++++++++++++++++++++++++++++++++++++++++++++++++++
0+
+
+
+
1+
+
+
+
2+
+
+
+
3+
+
+
+
4+
+
+
+
5+
+
+
+
6+
+
+
+
7+
+
+
+
8+
+
+
+
9+
+
+
+
0+
+
+
+
1+
+
+
+
2+
+
+
+
3+
+
+
+
4+
+
+
+
5+
+
+
+
6+
+
+
+
7+
+
+
+
8+
+
+
+
9+
+
+
+
0+
+
+
+
1+
+
+
+
2+
+
+
+
3+
+
+
+
4+
+
+
+
5+
+
+
+
Created 2008-04-04
Modified 2008-04-18
Printed 2008-04-18
102
6+
+
+
+
7+
+
+
+
8+
+
+
+
9+
+
+
+
0+
+
+
+
1+
+
+
+
2+
+
+
+
3+
+
+
+
4+
+
+
+
5+
+
+
+
6+
+
+
+
7+
+
+
+
8+
+
+
+
9+
+
+
+
+++++++++++++++++++++++++++++++++++++++++##########################################+++++++++++++++++++++++++++++++++++++++++
0+
#
#
+
1+
#
#
+
2+
#
#
+
3+
#
#
+
4+
#
#
+
5+
#
#
+
6+
#
#
+
7+
#
#
+
8+
#
#
+
9+
#
#
+
0+
#
#
+
1+
#
#
+
2+
#
#
+
3+
#
#
+
4+
#
#
+
5+
# ...
#
+
6+
# .X.
#
+
7+
# ...
#
+
8+
#
#
+
9+
#
#
+
0+
#
#
+
1+
#
#
+
2+
#
#
+
3+
#
#
+
4+
#
#
+
5+
#
#
+
6+
#
#
+
7+
#
#
+
8+
#
#
+
9+
#
#
+
0+
#
#
+
1+
#
#
+
2+
#
#
+
3+
#
#
+
4+
#
#
+
5+
#
#
+
6+
#
#
+
7+
#
#
+
8+
#
#
+
9+
#
#
+
+++++++++++++++++++++++++++++++++++++++++##########################################+++++++++++++++++++++++++++++++++++++++++
0+
+
+
+
1+
+
+
+
2+
+
+
+
3+
+
+
+
4+
+
+
+
5+
+
+
+
6+
+
+
+
7+
+
+
+
8+
+
+
+
9+
+
+
+
0+
+
+
+
1+
+
+
+
2+
+
+
+
3+
+
+
+
4+
+
+
+
5+
+
+
+
6+
+
+
+
7+
+
+
+
8+
+
+
+
9+
+
+
+
0+
+
+
+
1+
+
+
+
2+
+
+
+
3+
+
+
+
4+
+
+
+
5+
+
+
+
6+
+
+
+
7+
+
+
+
8+
+
+
+
9+
+
+
+
0+
+
+
+
1+
+
+
+
2+
+
+
+
3+
+
+
+
4+
+
+
+
5+
+
+
+
6+
+
+
+
7+
+
+
+
8+
+
+
+
9+
+
+
+
++++++++++++++++++++++++++++++++++++++++++++++++++++++++++++++++++++++++++++++++++++++++++++++++++++++++++++++++++++++++++++
Key:
[#]-Env
[+]-WrapEnv
[ ]-NotSearch
[.]-Nbr
[!]-WrapNbr
[:]-Nbr&WrapN
[*]-Srch
[?]-WrapSrch
8.2.37
NeighbourhoodDetail
Step-by-step detail of the creation of neighbour lists for each Cell.
00000:NeighbourhoodDetail: Cell at (36, 31) added to neighbour list of cell at (37, 32)
00000:NeighbourhoodDetail: Next search co-ordinate: (37, 31)
00000:NeighbourhoodDetail: Next search co-ordinate: (38, 31)
00000:NeighbourhoodDetail: Next search co-ordinate: (36, 32)
00000:NeighbourhoodDetail: Cell at (36, 32) added to neighbour list of cell at (37, 32)
00000:NeighbourhoodDetail: Next search co-ordinate: (37, 32)
00000:NeighbourhoodDetail: Cell at (37, 32) already belongs to neighbour list of cell at
(37, 32) or they are one and the same parcel -- not added
Created 2008-04-04
Modified 2008-04-18
Printed 2008-04-18
103
00000:NeighbourhoodDetail:
00000:NeighbourhoodDetail:
00000:NeighbourhoodDetail:
00000:NeighbourhoodDetail:
00000:NeighbourhoodDetail:
00000:NeighbourhoodDetail:
00000:NeighbourhoodDetail:
8.2.38
Next
Next
Cell
Next
Cell
Next
Next
search co-ordinate: (38, 32)
search co-ordinate: (36, 33)
at (36, 33) added to neighbour list of cell at (37, 32)
search co-ordinate: (37, 33)
at (37, 33) added to neighbour list of cell at (37, 32)
search co-ordinate: (38, 33)
search co-ordinate: (36, 34)
Parameters
Details of the parameters of the run, and some metadata. The format is designed to be readable by
spreadsheet software.
00000:Parameters: Model being built using the following parameters:
Version:
model1-1-5
Path:
/example/fearlus/model1-1-5/model1-1-5
Swarm: /example/swarm-2.2/
User:
Real:
eg
Effective:
eg
Machine:
Name:
example OS:
SunOS 5.8 Generic_117350-38
Architecture:
sun4u
Date:
2007/05/18 17:47:37
Run ID: 83090CD5/464DD8A8/00001B0A
Seed for simulation:
321654789
<Swarm>
Separate seed for use after initialisation:
<Not Used>
Random Number Generator:
MT19937gen
Termination year:
151
Unbounded time: NO
Environment type:
Planar-Moore
Neighbourhood radius:
1
Number of land uses:
12
(ALL)
Clumping of biophysical properties:
SymbolSwappingClumper:nCycles=100
Number of horizontal cells in the Environment: 40
Number of vertical cells in the Environment:
40
Area of one cell:
0.65
Georeference:
xllcorner:
0
yllcorner:
0
Number of horizontal cells in one Parcel:
2
Number of vertical cells in one Parcel: 2
Break even yield threshold:
35
Farm scale fixed costs: 5
Farm scale fixed costs file:
manual-CBR.fsfc
Allow Estate Growth:
YES
Always use proximity in CBR biophysical comparisons:
NO
Auction:
First price sealed bid
Number of X initial Parcels for Managers:
2
Number of Y initial Parcels for Managers:
2
Land use pollution distribution:
normal
Land use pollution mean:
20
variance:
10
Yield lookup table:
Structure file: yield.tree
Biophysical group:
Biophysical
Land Use group: LandUse Position:
Not used
Table data file:
yield.data
Economic return lookup table:
Structure file: income.tree
Economy group: Economy
Position:
Not used
Table data file:
income.data
Grid file:
manual.grd
Land Use file: Not used
Climate file:
suddenchange150.clim
?
Economy file:
Not used
Climate change probabilities:
0.0625 0.0625
Economy change probabilities:
0.09375 0.09375
Subpopulation super class:
CBRSocialSubPopulation
Begin Subpopulations
Sub-population ID:
1
Label: Conservationists
Probability of land manager belonging to this sub-population:
0.5
Land Manager class:
CBRSocialParcelLandManager
Initial account distribution:
normal Mean:
50
Variance:
10
Probability of selling up distribution: uniform Minimum:
0
Maximum:0
Incomer offer price distribution:
uniform Minimum:
5
Maximum:5
Land offer threshold distribution:
uniform Minimum:
10
Maximum:10
Bidding strategy class: WealthMultipleBiddingStrategy
Bidding strategy configuration string: wealthcDist=uniform;wealthcMin=0.1;wealthcMax=0.1
Selection strategy class:
RandomSelectionStrategy
Off-farm income mean distribution:
uniform Minimum:
7
Maximum:7
Off-farm income variance distribution: uniform Minimum:
2
Maximum:2
Trigger list:
Trigger class: NeighbourPollutionTrigger
Approval:
1
Disapproval:
1
Trigger class: LandUseGroupTrigger
Approval:
0
Disapproval:
1
Land use symbols
Management/Non-organic
Trigger class: LandUseGroupTrigger
Approval:
1
Disapproval:
0
Land use symbols
Management/Organic
End of triggers
Minimum profit salience distribution:
uniform Minimum:
1
Maximum:2
Minimum approval salience distribution: uniform Minimum:
2
Maximum:4
Salience margin distribution:
uniform Minimum:
4
Maximum:
8
Salience adjustment distribution:
uniform Minimum:
0.125
Maximum:0.5
Profit aspiration threshold distribution:
uniform Minimum:
5
Maximum: 5
Approval aspiration threshold distribution:
uniform Minimum:
3
Maximum: 3
Event list:
Event class:
NeighbourDisapprovalEvent
Event action:
incApprovalSalience
Event class:
NoRewardEvent
Event action:
decProfitSalience
Event class:
LandParcelSoldEvent
Event action:
incProfitSalience
End of events
Climate group:
Climate
Land Use group: LandUse
Created 2008-04-04
Modified 2008-04-18
Printed 2008-04-18
104
Sub-population ID:
2
Label: Productivists
Probability of land manager belonging to this sub-population:
0.5
Land Manager class:
CBRSocialParcelLandManager
Initial account distribution:
normal Mean:
50
Variance:
10
Probability of selling up distribution: uniform Minimum:
0
Maximum:0
Incomer offer price distribution:
uniform Minimum:
5
Maximum:5
Land offer threshold distribution:
uniform Minimum:
10
Maximum:10
Bidding strategy class: WealthMultipleBiddingStrategy
Bidding strategy configuration string: wealthcDist=uniform;wealthcMin=0.2;wealthcMax=0.2
Selection strategy class:
RandomSelectionStrategy
Off-farm income mean distribution:
uniform Minimum:
0
Maximum:0
Off-farm income variance distribution: uniform Minimum:
0
Maximum:0
Trigger list:
Trigger class: LandUseGroupTrigger
Approval:
0
Disapproval:
1
Land use symbols
Management/Organic
End of triggers
Minimum profit salience distribution:
uniform Minimum:
2
Maximum:4
Minimum approval salience distribution: uniform Minimum:
1
Maximum:2
Salience margin distribution:
uniform Minimum:
4
Maximum:
8
Salience adjustment distribution:
uniform Minimum:
0.125
Maximum:0.5
Profit aspiration threshold distribution:
uniform Minimum:
10
Maximum: 10
Approval aspiration threshold distribution:
uniform Minimum:
0
Maximum: 0
Event list:
Event class:
ThresholdDisapprovalEvent
Event action:
incApprovalSalience
Disapproval threshold: 3
Event class:
NoRewardEvent
Event action:
decProfitSalience
Event class:
LandParcelSoldEvent
Event action:
incProfitSalience
Event class:
BadHarvestEvent
Event action:
incProfitSalience
Mean Harvest Threshold: 30
End of events
End of Subpopulations
Government class:
ParcelRewardingGovernment
Pollution threshold
1550
Low pollution reward per land manager
10
8.2.39
ParcelTransfers
Information on transfers of Land Parcels:
00005:ParcelTransfers:
parcels up for sale
00005:ParcelTransfers:
00005:ParcelTransfers:
00005:ParcelTransfers:
00005:ParcelTransfers:
00005:ParcelTransfers:
Land manager 41 has negative account -44.174, so puts all their
Land
Land
Land
Land
Land
manager
manager
manager
manager
manager
41
41
41
41
41
puts
puts
puts
puts
puts
parcel
parcel
parcel
parcel
parcel
141
181
161
182
162
at
at
at
at
at
(14,
(18,
(16,
(18,
(16,
0)
0)
0)
2)
2)
up
up
up
up
up
for
for
for
for
for
sale
sale
sale
sale
sale
…
00005:ParcelTransfers: Land manager 105 loses no land parcels this year since account
114.874 >= 0
00005:ParcelTransfers: Land manager 169 loses no land parcels this year since account
43.2032 >= 0
…
00005:ParcelTransfers: Transferred land parcel 212 at (20, 22) from land manager 56 to
land manager 45 at price 15.8997
00005:ParcelTransfers: Adding land parcel 212 at 20, 22 to land mgr 45 at price 15.8997
00005:ParcelTransfers: Winning bidder is new land manager 299 from subpopulation
Productivists
00005:ParcelTransfers: Transferred land parcel 232 at (22, 22) from land manager 56 to
land manager 299 at price 5
00005:ParcelTransfers: Adding land parcel 232 at 22, 22 to land mgr 299 at price 5
00005:ParcelTransfers: Transferred land parcel 231 at (22, 20) from land manager 56 to
land manager 55 at price 10.1058
00005:ParcelTransfers: Adding land parcel 231 at 22, 20 to land mgr 55 at price 10.1058
00005:ParcelTransfers: Transferred land parcel 211 at (20, 20) from land manager 56 to
land manager 45 at price 15.8997
00005:ParcelTransfers: Adding land parcel 211 at 20, 20 to land mgr 45 at price 15.8997
00005:ParcelTransfers: Winning bidder is new land manager 300 from subpopulation
Conservationists
8.2.40
ParcelTransfersDetail
Information on the bids made for each Land Parcel:
Created 2008-04-04
Modified 2008-04-18
Printed 2008-04-18
105
00006:ParcelTransfersDetail: List of bids for land parcel 259 at (24, 36):
Land manager 334 bid 1.98978
Land manager 331 bid 2.84026
New land manager from subpopulation CBRSocialSubPopulation bid 5
00006:ParcelTransfersDetail: List of bids for land parcel 239 at (22, 36):
New land manager from subpopulation CBRSocialSubPopulation bid 5
Land manager 330 bid 5.84422
00006:ParcelTransfersDetail: List of bids for land parcel 240 at (22, 38):
New land manager from subpopulation CBRSocialSubPopulation bid 5
00006:ParcelTransfersDetail: List of bids for land parcel 339 at (32, 36):
New land manager from subpopulation CBRSocialSubPopulation bid 5
Land manager 366 bid 6.88196
Land manager 371 bid 16.353
00006:ParcelTransfersDetail: List of bids for land parcel 340 at (32, 38):
New land manager from subpopulation CBRSocialSubPopulation bid 5
00006:ParcelTransfersDetail: List of bids for land parcel 338 at (32, 34):
Land manager 453 bid 1.90922
Land manager 328 bid 2.10052
New land manager from subpopulation CBRSocialSubPopulation bid 5
Land manager 366 bid 6.88196
Land manager 371 bid 16.353
8.2.41
Pollution
Statement of the total Pollution each Year:
00004:Pollution: Total pollution for this year is 1340.5
8.2.42
PollutionDetail
Details on the Pollution from each Parcel each Year:
00003:PollutionDetail: Pollution from land parcel 12 at (0, 22) with land manager 7 is 2.63081
00003:PollutionDetail: Pollution from land parcel 11 at (0, 20) with land manager 5 is 2.63942
00003:PollutionDetail: Pollution from land parcel 10 at (0, 18) with land manager 5 is 4.95538
… etc.
8.2.43
StrategyDetail
Shows, for those Strategies using a scoring mechanism for Land Uses, details of how the scores
are calculated as the Strategy progresses:
00001:StrategyDetail: Score of Land Use 1 (Oat Non-organic) incremented by 10.4426.
Average was 0 / 0 = NaN and is now 10.4426 / 1 = 10.4426
00001:StrategyDetail: Score of Land Use 1 (Oat Non-organic) incremented by 7.91554.
Average was 10.4426 / 1 = 10.4426 and is now 18.3581 / 2 = 9.17907
00001:StrategyDetail: Score of Land Use 1 (Oat Non-organic) incremented by 7.91554.
Average was 18.3581 / 2 = 9.17907 and is now 26.2737 / 3 = 8.75789
00001:StrategyDetail: Score of Land Use 1 (Oat Non-organic) incremented by 7.91554.
Average was 26.2737 / 3 = 8.75789 and is now 34.1892 / 4 = 8.54731
00001:StrategyDetail: Score of Land Use 6 (Oat Non-organic) incremented by 40.6713.
Average was 0 / 0 = NaN and is now 40.6713 / 1 = 40.6713
00001:StrategyDetail: Score of Land Use 2 (Barley Non-organic) incremented by 0.722105.
Average was 0 / 0 = NaN and is now 0.722105 / 1 = 0.722105
00001:StrategyDetail: Score of Land Use 4 (Beef Non-organic) incremented by 6.66468.
Average was 0 / 0 = NaN and is now 6.66468 / 1 = 6.66468
00001:StrategyDetail: Score of Land Use 4 (Beef Non-organic) incremented by 22.2365.
Average was 6.66468 / 1 = 6.66468 and is now 28.9012 / 2 = 14.4506
8.2.44
SubpopulationCreation and SubpopulationCreationDetail
Information on the Subpopulations as they are loaded from a file. The following is an example
from a run using the SubPopulation class:
-----:SubpopulationCreation: Loading strategy type probabilities from file: Experimenters.ss
-----:SubpopulationCreationDetail: RandomStrategy -- aboveP: 0, belowNonImitP: 1, belowImitP: 0, initialP: 1
-----:SubpopulationCreationDetail: RandomCopyingStrategy -- aboveP: 0, belowNonImitP: 0, belowImitP: 1, initialP: 0
-----:SubpopulationCreationDetail: HabitStrategy -- aboveP: 1, belowNonImitP: 0, belowImitP: 0, initialP: 0
-----:SubpopulationCreation: Loading strategy type probabilities from file: Specialists.ss
-----:SubpopulationCreationDetail: RandomStrategy -- aboveP: 0, belowNonImitP: 0, belowImitP: 0, initialP: 1
Created 2008-04-04
Modified 2008-04-18
Printed 2008-04-18
106
-----:SubpopulationCreationDetail: EccentricSpecialistStrategy -- aboveP: 0, belowNonImitP: 1, belowImitP: 0, initialP:
0
-----:SubpopulationCreationDetail: NoStrategy -- aboveP: 1, belowNonImitP: 0, belowImitP: 1, initialP: 0
-----:SubpopulationCreation: Loading strategy type probabilities from file: Imitators.ss
-----:SubpopulationCreationDetail:
-----:SubpopulationCreationDetail:
-----:SubpopulationCreationDetail:
belowImitP: 1, initialP: 0
-----:SubpopulationCreationDetail:
8.2.45
HabitStrategy -- aboveP: 1, belowNonImitP: 0, belowImitP: 0, initialP: 0
NoStrategy -- aboveP: 0, belowNonImitP: 1, belowImitP: 0, initialP: 0
YieldAverageWeightedTemporalCopyingStrategy -- aboveP: 0, belowNonImitP: 0,
RandomStrategy -- aboveP: 0, belowNonImitP: 0, belowImitP: 0, initialP: 1
Yield
Yield and Income information for each Land Parcel each Year:
00011:Yield:
00011:Yield:
00011:Yield:
00011:Yield:
New
New
New
New
yield
yield
yield
yield
for
for
for
for
Land
Land
Land
Land
Parcel
Parcel
Parcel
Parcel
1425
1426
1427
1428
at
at
at
at
(35,
(35,
(35,
(35,
24):
25):
26):
27):
9.64783; income 86.665
9.64783; income 86.665
5.5722; income 50.0543
0.299377; income 1.86928
… etc.
8.2.46
YieldDetail
Detailed information on the Yield and Income:
00002:YieldDetail: Lookup of yield for situation:
{LowVar Cold}{LCA-I Steep}LU({Beef Non-organic} 0.000000000000000e+00
0.000000000000000e+00 0.000000000000000e+00 1.000000000000000e+00) = 7.645569
00002:YieldDetail: Lookup of income for situation:
LU({Beef Non-organic} 0.000000000000000e+00 0.000000000000000e+00
0.000000000000000e+00 1.000000000000000e+00){Bull LowXch} = 4.777527
00002:YieldDetail: Lookup of yield for situation:
{LowVar Cold}{LCA-III Flat}LU({Oat Non-organic} 0.000000000000000e+00
0.000000000000000e+00 0.000000000000000e+00 1.000000000000000e+00) = 9.434509
00002:YieldDetail: Lookup of income for situation:
LU({Oat Non-organic} 0.000000000000000e+00 0.000000000000000e+00
0.000000000000000e+00 1.000000000000000e+00){Bull LowXch} = 6.048279
00002:YieldDetail: Lookup of yield for situation:
{LowVar Cold}{LCA-II Flat}LU({Barley Organic} 0.000000000000000e+00
0.000000000000000e+00 0.000000000000000e+00 1.000000000000000e+00) = 8.291016
8.3
Ontology
There are three different kinds of ontology that can be created:
•
•
•
Framework ontology. This contains all classes in the software that are subclasses of a
specified root class (by default, SwarmObject, which results in a number of irrelevant
Swarm library classes being included).
Model ontology. This contains all classes contained in the Parameter, Environment,
LandAllocator (which contains the Land Managers), and Government object instance
variables, as well as the classes of these objects themselves. That is, it is intended that this
ontology contain the classes of any instance of any object in the model.
Model state ontology. This contains, in addition to the model ontology (possibly by
importing the model ontology), all instances of the classes in the model ontology at the
time the model state ontology is created.
Ontology output is requested by giving the –O command-line option. By default, it has the
‘unnamed OWL’ URI, as per Protégé: http://www.owl-ontologies.com/unnamed.owl. To use a
different URI, give the URI as argument to the –U command-line option. You will not really
notice a practical difference except in the case of the model state ontology, where imports are
used.
If no model file is given (i.e. no –p command-line option), then a framework ontology will be
created. To create a framework ontology from a non-default root class (e.g. FearlusThing, which
unfortunately doesn’t have the Environment as a subclass), give an argument to the –C commandline option.
Created 2008-04-04
Modified 2008-04-18
Printed 2008-04-18
107
If a model file is given, then the behaviour depends on whether the program is running batch
mode or GUI mode. In batch mode, a model state ontology containing a model ontology will be
created after the schedule has stopped in the specified Year. In GUI mode if the –O commandline option is given, an extra button is added to the ProcCtrl window, labelled ‘Ontology’. If you
push this button before the simulation has started (i.e. before pushing ‘Start’ or ‘Next’ for the first
time), a framework ontology is created, using the SwarmObject class as the root class. Thereafter,
a model ontology is created along with a separate model state ontology that imports the model
ontology. (It is suggested if this feature is used that you supply an appropriate URI to the model
ontology—e.g. file:/full/path/to/the/ontology.owl, where the file the path points to is the name of
the file given as argument to the –O command-line option, and the path is the path you would use
in Protégé to open the ontology.) This allows you to create several model state ontologies during
the course of one simulation. The model state ontologies will have a slightly different name than
the –O command-line option argument to reflect the Year in which they were created.
The ontology generation process uses Obj-C’s rather rudimentary reflection functionality to
convert the objects and classes in the simulation to individuals and concepts in the ontology.
Since OO programming languages and description logics are formalisms with different semantics
and purposes, naturally the translation process is not trivial. Some objects and classes in the
model are at least intended to represent ontologically significant entities, but this prototype
ontology generation feature rather too rigidly translates the OO structure into the ontology.
In particular, the OO inheritance hierarchy cannot be relied on, as it is in this prototype feature, to
reflect the concept hierarchy in the ontology. In some cases, it works quite well. For example,
ThresholdDisapprovalEvent is a subclass of NeighbourDisapprovalEvent, and since all instances
of ThresholdDisapprovalEvents could, by their definition, also be instances of a
NeighbourDisapprovalEvent, it would be correct to say that ThresholdDisapprovalEvent is a
subconcept of NeighbourDisapprovalEvent. In other cases, however, the OO hierarchy can be
utterly misleading. For example, CBRStrategyLandManager is a subclass of
CBRSocialParcelLandManager in the OO hierarchy, because it adds extra functionality to the
latter. However, since setting pCBR of a CBRStrategyLandManager to 1.0 means it behaves in
exactly the same way as a CBRSocialParcelLandManager, the former is a more general concept
than the latter. Thus in the ontology, we could define CBRSocialParcelLandManager as a
subconcept of CBRStrategyLandManager with the restriction that pCBR = 1.0.
A second problem is that of data structures. Associative arrays are used in several places in
FEARLUS, but you will find that in the ontology they are not given a proper treatment. Some
other issues mean that not all data about instances are captured.
The other issue with this feature is the relationship between instance variables in OO and
properties in the ontology. Properties enjoy a more independent relationship with concepts in an
ontology than instance variables do with classes. The approach of this prototype ontology
generation process is to create properties by joining the name of the instance variable with the
class, so that properties only belong to one concept.
Many of the above issues can be resolved by adopting coding conventions to highlight the
ontologically significant aspects of the software. Whilst this will have to wait for future versions
of FEARLUS, the existing approach still has its uses in being able to summarise the state of the
system at any one time. (The diagram at the front of the manual is a network of approval and
disapproval between Land Managers created using OntoViz from a model state ontology.)
Created 2008-04-04
Modified 2008-04-18
Printed 2008-04-18
108
Figure 54 — A model ontology viewed in the Individuals tab in
Protégé, allowing the settings for a particular instance of
CBRStrategyLandManager to be viewed.
9
Strategies
This section gives more detail on the algorithms used to select a Land Parcel by various
Strategies, than was given in Table 4. Note that many of the imitative Strategies do a little more
than their name implies — the score calculated is often affected by the number of times each
Land Use appears in the social neighbourhood. Thus, a Land Use with a low score in each
individual Parcel could end up being chosen simply because it appears more often in the
neighbourhood than one with a high individual-Parcel score. Such imitative Strategies therefore
make an implicit assumption that their neighbours are choosing good Land Uses.
9.1
Strategies following the ImitativeStrategy Protocol
9.1.1
Habit
Retain the same Land Use on the Land Parcel as was used the previous Year.
9.1.2
Random Copying
Choose a new Land Use (i.e. one not currently applied to the Land Parcel) at random from the set
of Land Uses appearing in the social neighbourhood. If all Land Uses in the social neighbourhood
are the same, keep the same Land Use. If the neighbourhood weighting is zero, then choose a
Created 2008-04-04
Modified 2008-04-18
Printed 2008-04-18
109
Land Use at random from the set of Land Uses currently being used on the Land Manager’s own
Land Parcels.
9.1.3
Simple Copying
Choose a Land Use at random, weighted by a score calculated as follows:
•
•
•
Initialise scores for all Land Uses to 0.
Loop through each Land Parcel LPS owned by the Land Manager LM making the decision.
• Get the Land Use LU of LPS.
• Add 1.0 to the score for LU.
Loop through all Land Parcels LPN in the social neighbourhood of LM.
• Get the Land Use LU of LPN.
• Add Neighbourhood Weighting to the score for LU.
9.1.4
Simple Physical Copying
The Simple Physical Copying Strategy chooses a Land Use in the same way as the Simple
Copying Strategy, but the physical rather than the social neighbourhood is used. That is, the set of
Land Parcels examined are those belonging to the Land Manager and the physical neighbours of
these Parcels.
9.1.5
Yield Average Weighted Temporal Copying
Choose a Land Use at random, weighted by a score calculated as follows:
•
•
•
•
Initialise scores for all Land Uses to 0.
Initialise counters for all Land Uses to 0.
Loop i through the last T Years of data according to the Land Manager’s memory.
• Loop through each Land Parcel LPS owned by the Land Manager LM making the
decision.
• Get the Income per unit area * Y and Land Use LU of LPS for Year i.
• Add Y to the score for LU.
• Increment the counter for LU.
• Loop through all Land Parcels LPN in the social neighbourhood of LM.
• Get the Income per unit area Y and Land Use LU of LPN for Year i.
• Add Y × Neighbourhood Weighting to the score for LU.
• Increment the counter for LU.
For each Land Use, divide its score by its counter.
This Strategy is similar to Yield Weighted Temporal Copying Strategy, but it averages out the
scores according to the number of times the Land Use appears in the social neighbourhood during
the period of time examined.
9.1.6
Yield Random Optimum Temporal Copying
Choose a Land Use at random from those with equal maximum score as calculated for the Yield
Average Weighted Temporal Copying Strategy above.
9.1.7
Yield Weighted Copying
Choose a Land Use at random, weighted by a score calculated as follows:
*
So this, and the other Yield... strategy classes should really be named Income... instead. This is a legacy of
earlier versions of FEARLUS (retained for backward compatibility) where the ontological differences
between Yield and Income were not so pronounced.
Created 2008-04-04
Modified 2008-04-18
Printed 2008-04-18
110
•
•
•
Initialise scores for all Land Uses to 0.
Loop through each Land Parcel LPS owned by the Land Manager LM making the decision.
• Get the last Income Y and Land Use LU of LPS.
• Add Y to the score for LU.
Loop through all Land Parcels LPN in the social neighbourhood of LM.
• Get the last Income Y and Land Use LU of LPN.
• Add Y × Neighbourhood Weighting to the score for LU.
9.1.8
Yield Weighted Temporal Copying
Choose a Land Use at random, weighted by a score calculated as follows:
•
•
Initialise scores for all Land Uses to 0.
Loop i through the last T Years of data according to the Land Manager’s memory.
• Loop through each Land Parcel LPS owned by the Land Manager LM making the
decision.
• Get the Income Y and Land Use LU of LPS for Year i.
• Add Y to the score for LU.
• Loop through all Land Parcels LPN in the social neighbourhood of LM.
• Get the Income Y and Land Use LU of LPN for Year i.
• Add Y × Neighbourhood Weighting to the score for LU.
This Strategy is the Yield Weighted Copying Strategy, but looks back over a longer period of
time than just the last Year.
9.2
Strategies following the NonImitativeStrategy Protocol
9.2.1
Eccentric Specialist
The algorithm for choosing the Land Use is as follows:
•
•
The first time this Strategy is asked for a Land Use, choose one at random from all Land
Uses, remember that chosen, and return it as the Land Use selected.
Thereafter, return the Land Use chosen the first time.
Land Managers using this Strategy have a favourite Land Use chosen at random when they first
decide a Land Use, which they always use thereafter.
9.2.2
Fickle
The algorithm for choosing the Land Use is as follows:
•
•
The first time this Strategy is asked for a Land Use this Year, choose one at random,
remember it, and return it as the Land Use selected.
For all other Parcels on which the Land Manager has to decide a Land Use using this Strategy
this Year, return the remembered Land Use.
Land Managers using this Strategy use the same Land Use chosen at random on all Land Parcels
they own (whose context means they use this Strategy) each Year.
9.2.3
Grid File
Use the Land Use specified as being allocated to the Land Parcel in the grid file passed in to
FEARLUS with layer name ‘FEARLUS-LandUseID Year yyy’, where yyy is the current Year. If
Created 2008-04-04
Modified 2008-04-18
Printed 2008-04-18
111
no such layer exists containing data for the Land Parcel’s representative Land Cell, then the
simulation will abort.
9.2.4
Random
Choose a Land Use at random.
10
Events
This section provides details on how the occurrence of each class of Event is determined.
10.1
•
•
•
10.2
•
•
•
10.3
•
10.4
BadHarvestEvent
Compute the sum of the Yield per unit area over all Land Parcels owned
Compute the average Yield per unit area by dividing the sum by the number of Land
Parcels owned.
If the average computed is greater than the specified threshold, then the Event has
occurred.
DisapprovalProportionEvent
Compute the number of neighbours
Compute the total amount of disapproval received from neighbours. (Note that this is
gross disapproval, not disapproval – approval.)
If the total divided by the number of neighbours (i.e. the proportion of neighbours
disapproving) is more than or equal to the threshold, then the Event has occurred.
HighWealthEvent
If the Account of the Land Manager is more than or equal to the specified threshold, then
the Event has occurred.
LandParcelSoldEvent
This is a legacy from earlier versions of FEARLUS. Now that ELMM controls the Land Parcel
transfer mechanism, Land Managers have to sell all their Land Parcels at once, rather than one at
a time. Such Land Managers are bankrupt, so any adjustment of salience that occurs will be
irrelevant.
•
10.5
•
10.6
•
10.7
•
If the Land Manager has sold any Land Parcels this Year, then the Event has occurred.
NeighbourDisapprovalEvent
If the total disapproval this Land Manager has received this Year is more than zero, then
the Event has occurred.
NetLossEvent
If the Profit of the Land Manager is less than zero, then the Event has occurred.
NoRewardEvent
If the Land Manager has not received any financial reward from the Government (no
matter what its value, including zero and event negative numbers!), then the event has
occurred.
Created 2008-04-04
Modified 2008-04-18
Printed 2008-04-18
112
10.8
•
ThresholdDisapprovalEvent
If the total disapproval this Land Manager has received this Year is more than the
specified threshold, then the Event has occurred.
11
Triggers
11.1
AllLowPollutionTrigger
This trigger will only trigger approval of a Land Manager.
•
•
•
11.2
Set the approval of the Land Manager to the specified amount in the Trigger file.
Loop through the Land Parcels owned by the Land Manager to potentially be approved
of.
• If any Land Parcel has pollution greater than the specified threshold, set the approval
to zero.
Give the Land Manager the computed amount of approval.
LandUseGroupTrigger
This trigger may approve or disapprove (or even both!) of a Land Manager.
•
11.3
Loop through the Land Parcels owned by the Land Manager
• If any Land Parcel has a Land Use matching the property/symbol pair list given as
parameter, then issue the Land Manager the specified amounts of approval and
disapproval.
NeighbourPollutionTrigger
This trigger may approve or disapprove (but not both) of a Land Manager.
•
•
•
•
11.4
Loop through the Land Parcels owned by this Land Manager and determine the mean
pollution.
Loop through the Land Parcels owned by the Land Manager to potentially be approved or
disapproved of, and determine the mean pollution.
If the mean pollution of this Land Manager is greater than the Land Manager to
potentially be approved or disapproved of, then give the Land Manager the specified
amount of approval.
If the mean pollution of this Land Manager is less than the Land Manager to potentially
be approved or disapproved of, then give the Land Manager the specified amount of
disapproval.
ThresholdPollutionTrigger
This trigger will only disapprove of a Land Manager.
•
11.5
Loop through the Land Parcels owned by the Land Manager to potentially be disapproved
of.
• If any Land Parcel has a Land Use with a Pollution amount greater than the specified
threshold, then give the Land Manager the specified amount of disapproval.
WorseLUThanMeTrigger
This trigger will approve or disapprove (but not both) of a Land Manager.
•
Find the pollution generated by the most polluting Land Use applied by this Land
Manager.
Created 2008-04-04
Modified 2008-04-18
Printed 2008-04-18
113
•
•
•
12
Find the pollution generated by the most polluting Land Use applied by the neighbouring
Land Manager.
Disapprove of the neighbour if the most polluting Land Use is more polluting than that of
this Land Manager.
Otherwise, approve of the neighbour.
Bibliography
This section covers papers referred to in the manual, and further supplies a comprehensive set of
references to FEARLUS work.
Aamodt, A. and Plaza, E. (1994). Case-Based Reasoning: Foundational Issues, Methodological
Variations, and System Approaches. AI Communications. IOS Press, Vol. 7, no. 1, pp. 39-59.
Edmonds, B. and Hales, D. (2003) Replication, replication and replication: Some hard lessons
from model alignment. Journal of Artificial Societies and Social Simulation 6 (4), 11.
http://jasss.soc.surrey.ac.uk/6/4/11.html.
Gotts, N. M. and Polhill, J. G. (2007). Using collective rewards and social interactions to control
agricultural pollution: Explorations with FEARLUS-W. In Amblard, F. (ed.) Interdisciplinary
Approaches to the Simulation of Social Phenomena. Fourth Conference of the European Social
Simulation Association, Toulouse, France, 10-14 September 2007. pp. 253-262.
Gotts, N. M., Polhill, J. G. and Adam, W. A. (2003). Simulation and analysis in agent-based
modelling of land use change. First Conference of the European Social Simulation Association,
September
18-21
2003,
Groningen,
The
Netherlands.
http://www.unikoblenz.de/~kgt/ESSA/ESSA1/gotts_polhill_adam-rev.pdf
Gotts, N. M., Polhill, J. G. and Law, A. N. R. (2003). Aspiration levels in a land use simulation.
Cybernetics and Systems 34, 663-683.
Gotts, N. M., Polhill, J. G., Law, A. N. R. and Izquierdo, L. R. (2003). Dynamics of imitation in a
land use simulation. In Proceedings of the 2nd International Symposium on Imitation in Animals
and Artefacts, University of Wales Aberystwyth, 7-11 April 2003. pp. 39-46.
Izquierdo, L. R., Gotts, N. M. and Polhill, J. G. (2003). FEARLUS-W: An agent-based model of
river basin land use and water management. In Dijst, M., Schot, P. and de Jong, K. (eds.) Framing
Land Use Dynamics. International Conference 16-18 April 2003, Faculty of Geographical
Sciences, Utrecht University, Utrecht, The Netherlands. pp. 163-165.
Izquierdo, L. R., Gotts, N. M. and Polhill, J. G. (2004). Case-based reasoning, social dilemmas,
and a new equilibrium concept. Journal of Artificial Societies and Social Simulation 7 (3), 1.
http://jasss.soc.surrey.ac.uk/7/3/1.html.
Izquierdo, L. R., Polhill, J. G. and Gotts, N. M. (2006). Is your model susceptible to floating-point
errors? Journal of Artificial Societies and Social Simulation 9 (4), 4.
http://jasss.soc.surrey.ac.uk/9/4/4.html.
Parker, D. C., Brown, D. G., Polhill, J. G., Deadman, P. J. and Manson, S. M. (in press).
Illustrating a new ‘conceptual design pattern’ for agent-based models of land use via five case
studies. In Lopez Paredes, A. and Hernandez I. Agent-Based Modelling in Natural Resource
Management. Pearson Education.
Created 2008-04-04
Modified 2008-04-18
Printed 2008-04-18
114
Parker, D. C., Polhill, J. G. and Gotts, N. M. (2006). Do land markets matter? Preliminary results
from the ELMM model. The Association of American Geographers Meeting, Perspectives on
Geographic Complexity 2: Institutions, Markets and Policy. Chicago, Illinois, 7-11 March 2006.
Pignotti, E., Edwards, P., Preece, A., Polhill, G. and Gotts, N. (2005) Semantic support for
computational land use modelling. Proceedings of the Fifth IEEE International Symposium on
Cluster Computing and Grid, Cardiff, Wales, 9-12 May 2005.
Polhill, J. G. and Gotts, N. M. (2007) Evaluating a prototype self-description feature in an agentbased model of land use change. In Amblard, F. (ed.) Interdisciplinary Approaches to the
Simulation of Social Phenomena. Fourth Conference of the European Social Simulation
Association, Toulouse, France, 10-14 September 2007. pp. 711-718.
Polhill, J. G., Gotts, N. M. and Law, A. N. R. (2001). Imitative versus nonimitative strategies in a
land use simulation. Cybernetics and Systems 32, 285-307.
Polhill, J. G., Gotts, N. M. and Law, A. N. R. (2002). Modeling land-use change using agents in
the FEARLUS project. In Parker, D. C., Berger, T., Manson, S. M. and McConnell, W. J. (eds.)
Agent-Based Models of Land-Use and Land-Cover Change. Report and Review of an
International Workshop Irvine, California, USA October 4-7, 2001. LUCC Report Series No. 6.
pp. 35-40.
Polhill, J. G., Izquierdo, L. R. and Gotts, N. M. (2005). The ghost in the model (and other effects
of floating point arithmetic). Journal of Artificial Societies and Social Simulation 8 (1), 5.
http://jasss.soc.surrey.ac.uk/8/1/5.html
Polhill, J. G., Izquierdo, L. R. and Gotts, N. M. (2006). What every agent-based modeller should
know about floating point arithmetic. Environmental Modelling and Software 21, 283-309.
Polhill, J. G., Koo, B., Izquierdo, L. R., Dunn, S., Gotts, N. M., Rothman, D. S. and Ferrier, R.
(2004). Designs for coupling an agent-based model of land use change with a spatially-explicit
hydrochemical model. LUCC/EFEIA/WOTRO Joint International Workshop. Integrated
Assessment of the Land System: The Future of Land Use. Institute for Environmental Studies,
Amsterdam, 28-30 October 2004.
Polhill, J. G., Parker, D. C., Brown, D. G. and Grimm, V. (2008). Using the ODD protocol for
describing three agent-based social simulation models of land use change. Journal of Artificial
Societies and Social Simulation 11 (2), 3. http://jasss.soc.surrey.ac.uk/11/2/3.html.
Polhill, J. G., Parker, D. C. and Gotts, N. M. (2005) Introducing land markets to an agent based
model of land use change: A design. In Troitzsch, K. G. (ed.) Representing Social Reality: PreProceedings of the Third Conference of the European Social Simulation Association, Koblenz,
September 5-9, 2005. Koblenz, Verlag Dietmar Fölbach. pp. 150-157.
Polhill, J. G., Parker, D. C. and Gotts N. M. (2008). Effects of land markets on competition
between innovators and imitators in land use: Results from FEARLUS-ELMM. In Edmonds, B.,
Hernandez Iglesias C. and Troitzsch, K. G. (eds.) Social Simulation: Technologies, Advances and
New Discoveries. IGI Global. pp. 81-97.
Polhill, J. G., Pignotti, E., Gotts, N. M., Edwards, P. and Preece, A. (2007) A semantic grid
service for experimentation with an agent-based model of land use change. Journal of Artificial
Societies and Social Simulation 10 (2), 2. http://jasss.soc.surrey.ac.uk/10/2/2.html.
Simon, H. (1955). A behavioral model of rational choice. The Quarterly Journal of Economics
LXIX, February, pp. 99-118.
Created 2008-04-04
Modified 2008-04-18
Printed 2008-04-18
115
Watson, I. (1997). Applying Case-Based Reasoning: Techniques for Enterprise Systems. Morgan
Kaufman Publishers.
Appendix 1: Troubleshooting
Error messages in FEARLUS are not always very helpful, particularly when they originate in
Swarm library method calls. Here a few common problems are given, with their corresponding
messages:
Problem
Invalid entry in a
parameter file of the
@begin … @end style.
In this case, the offending
parameter is
envXSizeTypo
(emboldened) in a model
file. See section 5.1.1.
No @end in a parameter
file of the @begin …
@end style
No @begin in a
parameter file of the
@begin … @end style
String entry for numeric
parameter in a parameter
file of the @begin …
@end style
Example message
*** event raised for error: LoadError
*** function: loadAborted(), file:
../../../../src/20060612/swarm/src/simtools/ObjectLoader.m,
line: 32
Could not initialize class loader for Parameter
[../../../../src/20060612/swarm/src/simtools/ObjectLoader.m,209]
(envXSizeTypo)
*** execution terminating due to error
../../../../src/20060612/swarm/src/defobj/Symbol.m:187 [Error(c) _raiseEvent:]
Abort
*** event raised for error: LoadError
*** function: loadAborted(), file:
../../../../src/20060612/swarm/src/simtools/ObjectLoader.m,
line: 32
Could not initialize class loader for Parameter
[../../../../src/20060612/swarm/src/simtools/ObjectLoader.m,167]
(getChar2)
*** execution terminating due to error
../../../../src/20060612/swarm/src/defobj/Symbol.m:187 [Error(c) _raiseEvent:]
Abort
*** event raised for error: LoadError
*** function: loadAborted(), file:
../../../../src/20060612/swarm/src/simtools/ObjectLoader.m,
line: 32
Could not initialize class loader for Parameter
[../../../../src/20060612/swarm/src/simtools/ObjectLoader.m,147]
(getWord)
*** execution terminating due to error
../../../../src/20060612/swarm/src/defobj/Symbol.m:187 [Error(c) _raiseEvent:]
Abort
*** event raised for warning: WarningMessage
*** function: -[VarProbe setData:ToString:](), file:
../../../../src/20060612/swarm/src/objectbase/VarProbe.m, line:
1376
Error scanning for value in string n
*** execution continuing...
*** event raised for error: LoadError
*** function: loadAborted(), file:
../../../../src/20060612/swarm/src/simtools/ObjectLoader.m,
line: 32
Could not initialize class loader for Parameter
[../../../../src/20060612/swarm/src/simtools/ObjectLoader.m,215]
(n)
*** execution terminating due to error
../../../../src/20060612/swarm/src/defobj/Symbol.m:187 [Error(c) _raiseEvent:]
Abort
Appendix 2: Swarm Installation Notes
Swarm is notoriously difficult to install, unfortunately, and the purpose of this section is to keep a
record of its installation on various machines.
Created 2008-04-04
Modified 2008-04-18
Printed 2008-04-18
116
Platform
Cygwin
Cygwin/Vista
Linux
Linux/x86_64
Installation notes
This works pretty much out of the box. You should make sure that you
install the X libraries when choosing which packages to select during
the setup process.
On Vista, it was necessary to include the rebase package when installing
Cygwin, which is not included by default in the setup process. You
should make sure this package is included. When building FEARLUS
using make, various error messages were generated concerning fork,
which were addressed by entering the rebaseall command to the bash
prompt.
Paul Johnson has RPMs for various versions of Linux, which worked
fine once all prerequisite RPMs were installed. You should make sure
when installing Linux that all the development packages are installed to
get needed header files.
Non-GUI versions of Swarm are much simpler to compile from source,
as less prerequisite software is needed (oddly the XPM libraries were
still needed). In some cases it may be necessary to build a new version
of gcc if the version supplied is old (<4.0) or does not include Obj-C.
GUI versions proved more challenging on 64 bit machines, as some of
the prerequisite software does not compile successfully on 64 bit
machines. To get round this, pass the –m32 flag to gcc.
Solaris
If you are building a version of Swarm to include javaswarm, then you
must use shared libraries.
Compiling Swarm on Solaris requires much more in the way of
prerequisite software than other platforms. Mostly this is to ensure that
GNU versions of tools are available. In addition to the prerequisite
software stated on the Swarm website, you should install binutils,
fileutils, gcc, make, gperf, sed, tar, and for CVS versions of Swarm, you
will also need autotools.
Appendix 3: Known Bugs and Issues
1. On Cygwin, closing some of the graphs causes Tcl/Tk errors (specifically, those graphs,
e.g. approving, approver, that are given per subpopulation).
2. Ontologies using FearlusThing as the top level class do not include the Environment
(which is a subclass of Discrete2d).
3. Model state ontologies include the Number class spuriously.
4. Pollution is not normalised by area in all cases.
5. The –C command-line option is ignored when creating a framework ontology in GUI
mode.
6. If a framework ontology is created in GUI mode, then subsequent requests for an
ontology will result in the framework ontology being over-written.
7. The default URI for the model ontology does not work particularly well when model state
ontologies import it.
8. The Climate and Economy toggle probability array sizes are not checked against the
number of relevant symbol groups.
Created 2008-04-04
Modified 2008-04-18
Printed 2008-04-18