1
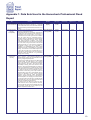
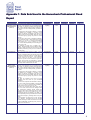
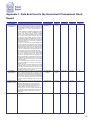
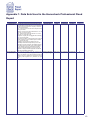
Homecheck Professional
Flood Report
User Guide
www.homecheckpro.co.uk
0844 844 9966
22/06/2009
User Guide
Table of Contents
Introduction - About this Guide
3
Why should I get a Homecheck Professional Flood Report?
3
How do I get a Homecheck Professional Flood Report?
3
What is my Homecheck Professional Flood Report telling me?
4
Appendix
Appendix 1: Data sets used in the Homecheck Professional Flood Report
10
Appendix 2: The Search Code
14
2
1.
Introduction – About this Guide
1.1
This Guide has been prepared by Landmark Information Group to assist busy conveyancing
practitioners to decide:
Whether to obtain a Homecheck Professional Flood Report on behalf of their clients.
What that search reveals.
2.
Why should I get a Homecheck Professional Flood
Report?
2.1
According to the Environment Agency, around 5 million people, in 2 million properties, live in flood
risk areas in England and Wales. As an "authorised" element of the Home Information Pack, the
Homecheck Professional Flood Report gives the practitioner and their client the vital information
they need to decide whether a property is at risk.
3.
How do I get a Homecheck Professional Flood
Report?
3.1
A Homecheck Professional Flood Report can be ordered by using one of our order forms
or alternatively via our website at www.homecheckpro.co.uk.
To obtain an order form or register for an account to order online please contact:
Landmark Information Group Limited
Legal & Financial
The Smith Centre
Fairmile
Henley-on-Thames
RG9 6AB
Telephone:
Fax:
DX:
E-mail:
Internet:
0844 844 9966
0844 844 9980
154400 Henley-on-Thames 2
[email protected]
www.homecheckpro.co.uk
3.2
A separate search should be made for each individual property having a different postal address.
3.3
Order forms should be completed by including:
The full postal address and postcode of the property.
The name and Document Exchange (DX) number (if applicable) of the practitioner.
The practitioner’s file reference and telephone number.
A plan of the property (see paragraph 3.4 below).
3
3.4
If you are using an order form it is requested that a plan showing the location of the property is
enclosed with your order. If a plan is not supplied there may be difficulties in identifying the location
of the property and this may introduce a delay.
3.5
In normal circumstances a Homecheck Professional Flood Report will be despatched to the
practitioner within 24 to 48 hours of the receipt of the order.
3.6
The Homecheck Professional Flood Report is also available electronically, normally within 24 hours.
4.
What is my Homecheck Professional Flood Report
telling me?
4.1
The report will include information from a number of statutory and non-statutory sources, and also
provides guidance on the presence of features that could create a flood risk.
4.2
Sitescope has agreements for the supply or collection of data with a number of national data
providers. Notably, Sitescope is a Licensed Partner of Ordnance Survey and a Value Added Reseller
for the Environment Agency and the British Geological Survey. The currency of the datasets
used is determined by the frequency of updates by the data providers under their respective
agreements with Sitescope.
4.3
Any person relying on a Homecheck Professional Flood Report must comply with the attached
Terms and Conditions.
4.4
The replies in the Homecheck Professional Flood Report will be given in the belief that they
accord with the data sets and update cycles listed in Appendix 1, but on the understanding that
Sitescope is not legally responsible for them except as detailed in the Terms and Conditions, which
may vary from time to time. You should also note the following:
This report incorporates flood hazard maps, data and information in relation to flood risk (“Information”) licensed by Risk
Management Solutions Inc. (RMS) to Landmark Information Group Ltd (“Landmark”). RMS is not engaged in the insurance,
real estate, finance or related industries. The Information provided is not intended to constitute professional advice or an
endorsement by RMS of any kind regarding the use and suitability of the Information. The Information is based on the
scientific data, mathematical and empirical models, and encoded experience of scientists and engineers, and is inherently
imprecise.
The Information is being provided “as is”, without any warranty of any kind. RMS disclaims all representations and
warranties, express or implied, including but not limited to implied warranties of merchantability, non-infringement and fitness
for a particular purpose, or any warranties as to the accuracy, completeness, reliability or certainty of the Information. You
rely on the information solely at your own risk.
RMS specifically disclaims any and all obligations and liability with respect to any decisions or advice made or given as a
result of the Information. In no event shall RMS (or its parent, subsidiary or other affiliated companies) be liable for any
direct, indirect, special, incidental or consequential damages (including loss of profits, loss of business and loss of
interruption of business), suffered by you, a counterparty or any third party, arising out of (1) any use of or reliance upon
this Information; (2) any decisions or advice made or given as a result of the contents of the Information or use thereof; or
(3) any errors, omissions or inaccuracies in the Information.
4.5
Sitescope is constantly working with data providers to improve the data sets and the information
available to Sitescope may change. Accordingly, there is no protection period relating to a
Homecheck Professional Flood Report and practitioners should not attempt to rely on a previous
report. Practitioners who rely on a previous report will not have the benefit of Sitescope’s
Professional Indemnity Insurance cover.
4.6
Practitioners should note that addresses may have been compared to the Royal Mail Postal Address
File standard and therefore may have been changed to comply with this standard.
4
4.7
The report is split into sections, which presents the information in an easy to understand
question and answer format.
4.8
The practitioner should normally be able to easily verify that the report has been correctly located on
the subject property using the Site Location map. In the event of any doubt as to the correct location
the practitioner should raise this immediately with our helpdesk or the agent or reseller.
4.9
The Homecheck Professional Flood Report uses the boundary of the property as the basis of the
search if this is digitised. Alternatively, the search can be ordered as a point location and our system
will construct a 25m radius circle around this point which will be used as the property boundary for
the purposes of the report.
Please note that use of the 25m circle is not an attempt to make an approximation of the property
boundary.
Guidance
4.10
The Homecheck Professional Flood report includes a guidance statement that confirms whether,
based on the data revealed in the report, there is any flood risk associated with the property. The
replies are colour coded green, amber and red.
Green indicates no flood risk has been identified.
Amber indicates that, whilst no natural flood risk has been identified, the are records of flood
insurance claims.
Red indicates that a flood risk has been identified. The issues that give rise to the risk are listed.
Enquiries and Replies
4.11
The Homecheck Professional Flood Report will be based on the information listed in Appendix 1 to
this Guide. The practitioners’ attention is drawn to the update cycles for this information.
4.12
Section A of the report will include information from Risk Management Solutions Inc. (RMS) as to
the potential flood risk up to 250 metres from the property. RMS flood is a modelled dataset, which
uses land height, predicted rainfall and a huge variety of other factors to predict both flooding from
rivers, and for the first time across Great Britain, surface water flooding, a key factor for flood
predictions in urban areas. The report reveals:
The potential worst case flood depths, taking flood defences into account, up to 50 metres
from, or within 51-250 metres of the property.
The potential worst case flood depths, assuming the absence of flood defences, up to 50
metres from, or within 51-250 metres of the property.
Any areas at potential risk of surface water flooding, up to 50 metres from, or within 51-250
metres of the property.
For the first two questions the appropriate depth band is given and the third question simply gives a
yes or no reply.
Potential flood depths are grouped into four bands of 0-200mm, 201-500mm, 501-2000mm and more
than 2001mm. Where no data is revealed the response "No Known Flood Risk" is given.
5
The data is plotted on up to three maps showing 1 in 75, 1 in 100 and 1 in 1000 year risk. These
maps show an area out to 1000 metres from the search centre. Where no data is revealed maps
are not plotted
Please refer to Appendix 1 to this guide and to the footnotes to section A in the report itself for
detailed information on the data used in this section.
4.13
For England and Wales Section B of the report will include information from the Environment Agency
as to whether the property is:
In or within 250 metres of an area affected by flooding (Zone 3) or extreme flooding
(Zone 2).
In or within 250 metres of flood defences recorded by the Environment Agency.
In or within 250 metres of an area recorded by the Environment Agency as benefitting from
flood defences.
Where data is reported this will be plotted onto a map for easy reference.
For Scotland flooding information has been provided by the Centre for Ecology and Hydrology.
Where data is reported estimated flood depths are mapped for a 1 in 100 year event and shown in
colour coded bands of 0 to 1 metre, 1 - 2 metres and over 2 metres estimated flood depth. The flood
areas have been generated using a generalised technique and should not, by themselves, be used
to infer that specific areas are or are not at risk of inundation. Flood risk at any specific location may
be influenced by local factors, not least flood defences, that have not been taken into account.
Please refer to Appendix 1 to this guide and to the footnotes to section B in the report itself for
detailed information on the data used in this section.
4.14
Section C of the report will include information from the British Geological Survey (BGS) as to
whether the property is within an area susceptible to groundwater flooding or whether there are
geological deposits that indicate the area may be vulnerable to inland or coastal flooding.
The search area for this section is 0 - 50 metres from the specified property.
Susceptibility to groundwater flooding will report the worst case within the search area and the
responses are:
None
Negligible
Low
Moderate
Moderately High
High
Where susceptibility is negligible, this means that you need take no further action in relation to
groundwater hazard in this area.
6
Where low or moderate susceptibility is indicated, this means that given the geological conditions
there may be a groundwater flooding hazard. Unless other relevant information, e.g. records of
previous flooding, suggests groundwater flooding has occurred before in this area you need take
no further action in relation to groundwater flooding hazard. If there are records of previous
incidences of groundwater flooding, then it is recommended that other information e.g. rainfall
history, property type, and land drainage information in addition to previous records of flooding be
investigated in order to establish relative, but not absolute, risk of groundwater flooding.
Where moderately high or high susceptibility is indicated, this means that given the geological
conditions in the area groundwater flooding hazard should be considered in all land-use
planning decisions. It is recommended that other relevant information e.g. records of previous
incidence of groundwater flooding, rainfall, property type, and land drainage information be
investigated in order to establish relative, but not absolute, risk of groundwater flooding.
Geological Indicators of Flooding simply gives a yes or no reply.
Please refer to Appendix 1 to this guide and to the footnotes to section C in the report itself for
detailed information on the data used in this section.
4.15
Section D of the report will include information from Norwich Union (NU) as to their assessment
of the flood risk to the property and the insurability risk assessment of the property.
The flood risk responses are:
High
Medium
Low
Negligible
May Become Isolated
No Data Availble
Where the flood risk is "High" based on Norwich Union’s assessment of flood risk, the property has a
flood risk more frequent than a 1 in 75 year flood event.
Where the flood risk is "Medium" based on Norwich Union’s assessment of flood risk, the property
has a flood risk between a 1 in 75 year, and 1 in 250 year flood event.
Where the flood risk is "Low" based on Norwich Union’s assessment of flood risk , the property has a
flood risk between a 1 in 250 year, and 1 in 1000 year flood event.
Where the flood risk is "Negligible" based on Norwich Union’s assessment of flood risk, the property
has a negligible flood risk.
Where the flood risk is "May become isolated" based on Norwich Union’s assessment of flood risk ,
the property may become isolated or surrounded by flood waters in the event of a 1 in 250 year flood
event. The property itself is unlikely to flood.
7
The insurability risk assessment responses are:
Significant
High
Moderate
Low
Very Low
Negligible
May Become Isolated
No Data Available
Where the insurability risk assessment is "Significant" the insurer’s assessment of flood risk at
this property indicates that there is a significant risk of flooding, and without evidence of appropriate
flood defences it would not be prepared to insure this property. You may be required to purchase a
Flood Risk Assessment survey in order to provide this evidence. Insurer recommends you
consider flood protection measures.
Where the insurability risk assessment is "High" the insurer’s assessment of flood risk at this
property indicates that the property is built on a flood plain and there is a high probability of
flooding. Insurer would be prepared to offer cover for flooding if it were to insure this property.
Properties with a high probability of flooding may attract higher insurance premiums and/or claims
excesses. You may wish to consider looking for suppliers of flood prevention products.
Where the insurability risk assessment is "Moderate" the insurer’s assessment of flood risk at this
property indicates that the property is built on a flood plain and there is a moderate probability of
flooding. Insurer would be prepared to offer cover for flooding if it were to insure this property.
Properties with a moderate probability of flooding may attract higher insurance premiums.
Where the insurability risk assessment is "Low" the insurer’s assessment of flood risk at this property
indicates that the property is built on a flood plain and there is a low probability of flooding. Insurer
would be prepared to offer cover for flooding if it were to insure this property. Properties with a low
probability of flooding may attract a small increase in insurance premiums to cover the risk.
Where the insurability risk assessment is "Very low" the insurer’s assessment of flood risk at this
property indicates that whilst the property is built on a flood plain there is a very low probability of
flooding. Insurer would be prepared to offer cover for flooding if it were to insure this property.
Where the insurability risk assessment is "Negligible" the insurer’s assessment of flood risk at this
property indicates that there is a negligible risk of flooding.
Where the insurability risk assessment is "May become isolated" the insurer’s assessment of flood
risk at this property indicates that in an extreme flood event this property may become isolated or
surrounded by flood waters. This property itself is unlikely to flood.
Please note that these assessments of the insurability of the property are from Norwich Union. If the
response raises concerns you should check with your own insurance company.
Where the report advises “No Data Available” for section C this means the location of your property
is not yet included in the Ordnance Survey’s Address-Point data. This could occur if your property is
newly built or is a plot in a new development. In such cases Landmark can obtain information from
Norwich Union on a case by case basis, normally within 2 working days.
8
Should you require Landmark to obtain this information please contact our Customer Service team
on 0844 844 9966.
Please refer to Appendix 1 to this guide and to the footnotes to section D in the report itself for
detailed information on the data used in this section.
4.16
Section E of the report will include information of the flood insurance claim rating for the property's
postcode sector.
An insurance claims rating for flood risk is derived from the number of flood insurance claims in the
postcode sector. Data is gathered from a large number of insurance companies and includes
validated claims notified to insurers including river and coastal flood, heavy rainfall and flooding
following blockages to sewers etc. They do not include an escape of water from a fixed appliance.
The insurance claim rating responses are:
High
Medium
Low
Very Low
No Data Available
“High” is usually (but not invariably) associated with river or coastal flood. It is usually indicative of
groups of claims with several properties suffering damage as the result of a specific event.
This would indicate a sector with more than 5 claims per 1000 households.
“Medium” is usually indicative of groups of houses, not necessarily over a wide area, that have
suffered damage as a result of heavy rainfall, over-topping of the rainwater system or their location
being on low lying ground. This would indicate a sector with between 2 and 5 claims per 1000
households.
“Low” suggests individual claims associated with failure of underground drainage systems or
possibly localised events like flooding of the roadway following heavy rainfall. This would indicate a
sector with less than 2 claims per 1000 households.
"Very Low" indicates there are no recorded claims.
"No Data Available" means there are insufficient properties in the postcode sector to make a
meaningful assessment.
Please refer to Appendix 1 to this guide and to the footnotes to section E in the report itself for
detailed information on the data used in this section.
4.17
It should be noted that the data in each section is supplied from different sources and is based on
different parameters. This may give rise to what might at first seem to be conflicting responses.
For example, data in section D is specific to the subject property whereas the data in section E
relates to the postcode sector. A report could therefore be assessed as “High” in section D for both
Flood and Insurability Risk and have a “Low” Insurance Claim Rating.
9
Appendix 1: Data Sets Used in the Homecheck Professional Flood
Report
Title
Remarks
Areas Benefiting
This data set shows those areas benefiting from
from Flood Defences demarcated flood defences whereby in a 1% fluvial
or 0.5% tidal flood event, areas that would otherwise
flood are protected, provided that the defences do not
breach.
Source
Data Type
Data Range
Update Cycle
Section
Environment
Agency
Polygon
& Text
From 2005
Quarterly
B
BGS Groundwater
Flooding
Susceptibility
This data set is the first national hazard or susceptibility British Geological
Survey (BGS)
data set of groundwater flooding.
Groundwater flooding is increasingly recognised as
a hazard and can be defined as the emergence of
groundwater at the ground surface, or the rising of
groundwater into man-made ground under conditions
where the normal range of groundwater levels is
exceeded. Based on geological and hydrogeological
information, digital data has been used to identify
areas where geological conditions could enable
groundwater flooding to occur and where groundwater
may come close to the ground surface. The data set
defines areas with one of five levels of groundwater
susceptibility, ranging from high susceptibility to
negligible or no susceptibility. Areas with no data
represent areas with no susceptibility to groundwater
flooding. The resolution of the modelled output is 50m
by 50m cells. The data set is a hazard data set, not
a risk data set, meaning that it does not provide any
information about the likelihood of a groundwater
flooding event occurring.
Polygon
& Text
Not Applicable
Annual
C
BGS Geological
Indicators of
Flooding
This data set identifies areas prone to the two main British Geological
Survey (BGS)
types of flooding - inland (fluvial floodplains) and
coastal/estuarine, based upon the observation of the
types of geological deposit present.
The data set is a digital map based on the BGS Digital
Geological Map of Great Britain at the 1:50,000
scale. It was produced by characterising Superficial
(Drift) Deposits on this map in terms of their likely
vulnerability to flooding, either from coastal or inland
water flow. These Superficial Deposits are considered
‘recent’ in geological terms, most having been formed
in the later parts of the Quaternary geological period
(i.e. within the last few tens of thousands of years).
Observations made during recent major inland and
coastal flooding events have demonstrated that the
erosion and deposition of these recent geological
sediments have produced subtle topographical
variations, resulting in landforms such as fluvial and
coastal floodplains. The mapping of these landforms,
in conjunction with the fluvial and/or coastal deposits
that underlie them, has in turn determined the extent
of previous coastal and inland flooding.
The data set does not take into account any manmade influences such as flood protection schemes,
nor does it take into account the possibility of flooding
onto low-lying ground that is not occupied by the
‘indicator’ deposits described above.
Polygon
& Text
Not Applicable
Annual
C
10
Appendix 1: Data Sets Used in the Homecheck Professional Flood
Report
Title
Remarks
Source
Data Type
Data Range
Update Cycle
Section
Extreme Flooding
from Rivers or Sea
without Defences
(Zone 2)
Flood Zones are defined by the Government’s
Planning Policy Statement 25 on ‘Development and
Flood Risk’ for England (PPS25) dated December
2006, which replaces Planning Policy Guidance 25:
Development and Flood Risk (PPG25), published in
July 2001.
The Flood Zones are defined in table D.1 of PPS25
and illustrate the probability of flooding across
England for planning consultation and have been
identified using the best available data held by the
Environment Agency ignoring the presence of flood
defences.
This data set is Flood Zone 2 (Medium Probability),
which comprises areas of land assessed as having
between a 1 in 100 and 1 in 1000 annual probability
of river flooding (1% – 0.1%) or between a 1 in 200
and 1 in 1000 annual probability of sea flooding (0.5%
– 0.1%) in any year.
This definition of Flood Zone 2 applies only in
England. Equivalent data is also provided for Wales,
although in Wales the data does not have the same
relationship to Planning Policy and is not referred to
as Flood Zones.
Environment
Agency
Polygon &
Text
From 2005
Quarterly
B
Flood Defences
This is the Environment Agency’s holding of Linear
Flood Defences. This data set contains all flood
defences constructed during the last five years with
a standard of protection equal to or better than 1%
for rivers and 0.5% from the sea. Some additional
defences, which may be older or may have been
designed to provide a lower standard of protection,
are also shown where the information is currently
available. This layer comprises linear flood defences,
for example flood embankments and walls.
Environment
Agency
Polygon
& Text
From 2005
Quarterly
B
Flooding from
Rivers or Sea
without Defences
(Zone 3)
Flood Zones are defined by the Government’s
Planning Policy Statement 25 on ‘Development and
Flood Risk’ for England (PPS25) dated December
2006, which replaces Planning Policy Guidance 25:
Development and Flood Risk (PPG25), published in
July 2001.
The Flood Zones are defined in table D.1 of PPS25
and illustrate the probability of flooding across
England for planning consultation and have been
identified using the best available data held by the
Environment Agency ignoring the presence of flood
defences.
This data set combines Flood Zone 3a (High
Probability) and Flood Zone 3b (The Functional
Floodplain).
Flood Zone 3a comprises land assessed as having a
1 in 100 or greater annual probability of river flooding
(>1%) or a 1 in 200 or greater annual probability of
flooding from the sea (>0.5%) in any year.
Flood Zone 3b comprises land where water has to
flow or be stored in times of flood. Strategic Flood
Risk Assessments (SFRAs) should identify this
Flood Zone (land which would flood with an annual
probability of 1 in 20 (5%) or greater in any year or
is designed to flood in an extreme (0.1%) flood, or at
another probability to be agreed between the LPA and
the Environment Agency, including water conveyance
routes).
These definitions of Flood Zone 3a and 3b apply
only in England. Equivalent data is also provided
for Wales, although in Wales the data does not have
the same relationship to Planning Policy and is not
referred to as Flood Zones.
Environment
Agency
Polygon
& Text
From 2005
Quarterly
B
11
Appendix 1: Data Sets Used in the Homecheck Professional Flood
Report
Title
Data Type
Data Range
Update Cycle
Section
This dataset describes the surface water and major Risk Management
river flood hazard for 75,100 and 1,000 year return
Solutions Inc.
periods for England, Scotland & Wales. A return period
is the statistical probability of the flood happening in
any given year. i.e. a 75 year return period is a 1 in
75 chance.
The Risk Management Solutions (RMS) data model
does not take into account Coastal/Storm Surge
Flooding, Dam Failure Flooding, Sewer Overflow
Flooding or risk of flooding from the sea. The source
data is created using 0.0005 decimal degree grid
cells projected using WGS84 (Lat/Long). Landmark
has translated the data into British National Grid - as
a result of the translation, the data does not appear as
a regular grid. Due to this re-projection cell sizes will
vary across the country.
Two types of major river flood hazard classification
are used: defended and undefended. The “defended”
data assumes any flood defences present withstand
the flood heights for which they were designed. The
“undefended” data assumes that no flood defences
are present, representing the possible outcome if any
defences which are present are breached entirely.
The defended dataset makes certain assumptions
about flood defences around Great Britain. RMS
state these assumptions take into account EA
defences, the government defence assumptions from
DEFRA, other literature, and discussions with the EA
especially around river flood defences in London and
the impact of tidal defences along the river including
the Thames barrier.
This data has flood depth information, grouped into
four bands: 0-200mm, 201-500mm; 501-2000mm;
2,000mm and over.
Surface water flood hazard is defined in this context
as flooding from minor rivers, water flowing across
the ground or raised groundwater levels. The surface
water hazard does not make any account for any
flood defences which may be present.
Polygon
& Text
Not Applicable
As Notified
A
Flood Water
Storage Areas
The Environment Agency’s holding of ‘Flood Storage
Areas’. A flood storage area may be referred to as a
balancing reservoir, storage basin or balancing pond.
Its purpose is to attenuate an incoming flood peak to
a flow level that can be accepted by the downstream
channel. It may also delay the timing of a flood peak
so that its volume is discharged over a longer time
interval.
Environment
Agency
Polygon
& Text
From 2005
Quarterly
B
Postcode Sector
Insurance Claim
Ratings - Flood
This data set contains postcode sector based flood
insurance claim ratings. Postcode sectors are
supplied as digital polygons, to which insurance
claim ratings are applied. The rating system has
five levels, and is derived from the number of flood
insurance claims in the postcode sector. Four
levels range from ‘Very Low’ to ‘High’, whilst the fifth
category represents postcode sectors that have too
few properties contained within them to make an
assessment.
Crawford & Co
Polygon
& Text
From 2000
Quarterly
E
Flood Hazard
75,100 and 1000
Year Return
Remarks
Source
12
Appendix 1: Data Sets Used in the Homecheck Professional Flood
Report
Title
Remarks
Source
Data Type
Data Range
Update Cycle
Section
Property-based
Flood Risk
This data set provides a property-based flood risk for
all residential properties within the UK as supplied by
Norwich Union (NU) insurance company. There are
five levels of flood risk:
High - Property has a flood risk more frequent than a
1 in 75 year event.
Medium - Property has a flood risk between a 1 in 75
year and 1 in 250 year event.
Low - Property has a flood risk between a 1 in 250
year and 1 in 1000 year event.
Negligible - Property has a negligible risk of flooding,
or is not on a flood plain.
May Become Isolated - Property itself is not at risk of
flooding however it may be isolated by flood waters
in a 1 in 250 year event.
In addition, each property is assigned one of 7
insurability assessments dependant upon the risk
of flooding. For this to happen, the Medium (Amber)
flood risk is broken down into more granular levels.
NU use Ordnance Survey’s Address-Point data to
locate each individual address, before running an
algorithm to assign individual properties a flood-risk
rating and insurability assessment.
Norwich Union
Point
& Text
Not Applicable
Annually
D
River Flood Data
(Scotland)
This raster data comprises 50m cells covering main- Centre for Ecology
land UK and was generated using a generalised techand Hydrology
nique. The display of this flood hazard therefore is
indicative only. It is divided into levels based on the
frequency and magnitude of a predicted 100 year
term.
Raster Cells
Not Applicable Not Applicable
B
13
Appendix 2: The Search Code
Search Code
Important Consumer Protection Information
This search has been produced by Landmark Information Group of The Smith Centre,
Fairmile, Henley on Thames, RG9 6AB (Tel: 0844 844 9966, Fax: 0844 844 9980, Email:
[email protected]), which is registered with the Property Codes Compliance
Board as a subscriber to the Search Code.
The Search Code provides protection for homebuyers, sellers, conveyancers and mortgage
lenders, who rely on property search reports carried out on residential property within the
United Kingdom. It sets out minimum standards which organisations compiling and/or selling
search reports have to meet. This information is designed to introduce the Search Code to
you.
By giving you this information, Landmark Information Group is confirming that they keep to
the principles of the Search Code. This provides important protection for you.
The Code’s main commitments
The Search Code’s key commitments say that search organisations will:
x
x
x
x
x
Provide search reports which include the most up-to-date available information when
compiled and an accurate report of the risks associated with the property.
Deal promptly with queries raised on search reports.
Handle complaints speedily and fairly.
At all times maintain adequate and appropriate insurance cover to protect you.
Act with integrity and ensure that all search services comply with relevant laws,
regulations and industry standards
Keeping to the Search Code
How search organisations maintain compliance with the Search Code is monitored
independently by the Property Codes Compliance Board (PCCB). If you have a query or
complaint about your search, you should raise it directly with the firm, and if appropriate ask
for your complaint to be considered under their formal internal complaints procedure. If you
remain dissatisfied with the firm’s final resolution after your complaint has been formally
considered or if the firm has exceeded the response timescales, you may refer your complaint
to the Independent Property Codes Adjudication Scheme (IPCAS). IPCAS can award
compensation of up to £5,000 to you if it finds that you have suffered loss as a result of your
search provider failing to keep to the Code.
Please note that all queries or complaints regarding your search should be directed to
your search provider in the first instance, not to IPCAS.
IPCAS Contact Details
Telephone: 020 7520 3800
Email: [email protected]
You can also get more information about the PCCB and IPCAS from Property Codes
Compliance Board website at: www.propertycodes.org.uk
Please contact our Customer Service team on 0844 844 9966 if you would like a copy of
the full search code.
14
Appendix 2: The Search Code
Complaints Procedure - Information for customers
If you wish to make a complaint, we will deal with it speedily and fairly. We will:
•
•
•
•
Respond to your complaint within 2 working days of receipt
Try and resolve your complaint fully within 2 weeks of receipt. If there are valid
reasons for consideration of the complaint taking longer, we will keep you fully
informed in writing or via telephone or email as you prefer and you will receive a
response at the very latest within 8 weeks.
Liaise with counselling organisations acting on your behalf, if you ask us to.
Send you a final decision on the complaint in writing.
If you are not satisfied with the final decision, you may refer the complaint to the Independent
Property Codes Adjudication Scheme (IPCAS) and we will give you contact details. We will
co-operate fully with the independent adjudicator during the consideration of a complaint by
the IPCAS and comply with any decision.
Complaints should be sent to:
Customer Relationship Manager
Landmark Information Group Limited
Legal & Financial
The Smith Centre
Fairmile
Henley-on-Thames
RG9 6AB
Telephone:
0844 844 9966
E-mail: [email protected]
IPCAS can be contacted at:
IDRS Ltd, 24 Angel Gate, City Road, London EC1V 2PT
Phone: 020 7520 3800
Fax: 020 7520 3829
E-mail: [email protected]
15