1
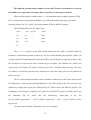
tRNAcc 1.0 User Guide
Version: 1.0 for Linux (Fedora Core 5)
Last revision Date: 20/08/2005; 26/09/2005; 07/12/2005; 24/10/2006
Author: Hong-Yu Ou 1, Kumar Rajakumar
2
1. Laboratory of Molecular Microbiology, Shanghai Jiao Tong University, Shanghai 200030,
P.R. China
2. Department of Clinical Microbiology, University Hospitals of Leicester NHS Trust,
Leicester LE1 5WW, United Kingdom.
All rights reserved by Laboratory of Molecular Microbiology, Shanghai Jiao Tong University,
1954 Huashan Road, Shanghai 200030, P.R. China, and Department of Infection, Immunity and
Inflammation, Leicester Medical School, University of Leicester, Leicester LE1 9H, United
Kingdom.
E-mail: [email protected] (H.-Y. OU)
[email protected] (K. RAJAKUMAR)
1
Table of contents
1. Disclaimer ....................................................................................................................................3
2. tRNAcc package ..........................................................................................................................3
3. Program (I): IdentifyIsland ..........................................................................................................9
4. Program (II): TabulateIsland......................................................................................................13
5. Program (III): ExtractFlank .......................................................................................................15
6. Program (IV): DNAnalyser........................................................................................................17
7. Program (V): GenomeSubstrator ...............................................................................................22
8. Program (VI): LocateHotspots...................................................................................................25
9. Application of tRNAcc to interrogate CGI-defined non-tRNA hotspots ..................................28
2
1. Disclaimer
tRNAcc 1.0 is freely available to academic users for not-for-profit purposes provided that
the original work is properly cited. However, no re-distribution is allowed without written
permission of the authors. The program for the linux platform has been tested under Fedora Core 5.
This program, however, is distributed without any warranty, without even the implied warranty of
merchantability or fitness for any purpose. The responsibility for any adverse consequences from
the use of the program or documents or any files created by use of the program lies solely with the
users of the program and not with authors of the program.
2. tRNAcc package
A software package called tRNAcc 1.0 is designed to facilitate the process of investigating
the contents and contexts analysis of tRNA sites in multiple closely related bacterial genomes. It is
described in: H.-Y. Ou, et al. (2005). A novel strategy for identification of genomic islands by
comparative analysis of the contents and contexts of tRNA sites in closely related bacteria. Nucleic
Acids Res., 34, e3.
tRNAcc 1.0 comprises a suite of individual tools listed in Table 1. The software is divided
into three sections by function: (I) Identification of the tRNA-associated GIs and their boundaries
(II) Design of primers specific to conserved UF and DF regions, and (III) Analysis of putative
islands for evidence of foreign origin. The open source codes written in C++, Perl or Bioperl
modules were tested under Fedora Core 5 at http://fedora.redhat.com/. The following directory
structure is set up by installing tRNAcc:
tRNAcc/
tRNAcc/input_data
tRNAcc/output_data
tRNAcc/temp_data
3
In this user guide, we take the primary tRNAcc analysis for the four fully sequenced E. coli
and Shigella genomes as an example (Fig. 1): E. coli K-12 MG1655 (Refseq accession number:
NC_000913.2), uropathogenic E. coli CFT073 (NC_004431), enterohaemorrhagic E. coli O157:H7
EDL933 (NC_002655) and S. flexneri 2a Sf301 (NC_004337). The MG1655 genome is served as
the reference template. Demonstrations of the inputs and outputs for the software are given in the
subdirectory tRNAcc/input_data and tRNAcc/output_data, respectively. See the lists in Table 2.
Table 1. Stand-alone tools developed and utilised for high throughput analyses of the contents and
contexts of tRNA genes in bacterial genomes
Software tool a
Description
Reference
Identify putative islands based on conserved flanking blocks
This work
Island identification
IdentifyIsland
identified using the multiple aligner Mauve 1.2.2 (Darling, et al.
2004, Genome Res., 14, 1394-1403)
TabulateIsland
Tabulate the islands identified when analysing different subsets
This work
of genomes
LocateHotspots
Locate proposed hotspots in un-annotated chromosomal
This work
sequences using BLASTN-based searches
Primer design
ExtractFlank
Generate multi-FASTA files containing the upstream or
This work
downstream flanking regions for the identified islands
Primaclade
Design conserved PCR primers for the upstream or downstream
Gadberry, et al. 2005
flanking regions across multiple bacterial genomes being
Bioinformatics, 21,
compared. This program is available at
1263-1264
http://www.umsl.edu/services/kellogg/primaclade.html
Island analysis
DNAnalyser
Calculate the GC content and dinucleotide bias of identified
This work
islands, and the negative cumulative GC profile of genomes
GenomeSubstrator
High throughput BLASTN-based comparison of CDS sequences
This work
against test genomes to identify strain-specific CDS based on
the level of nucleotide similarity
a
These programs can also be used for the generic identification and preliminary characterization of
putative genomic islands located at other user-specified hotspots and for the analysis of cognate
flanking sequences.
4
Genome sequences being compared (Reference genome: MG1655)
87
tRNA
Set 4
Set 3I
Set 3II
Set 3III
MG1655, CFT073,
EDL933, Sf301
MG1655, CFT073,
EDL933
MG1655, EDL933,
Sf301
MG1655, CFT073,
Sf301
IdentifyIsland
List of MG1655
tRNA genes
65
tRNA
Find tRNA genes conserved across all 4 genomes
Extract 4-kb UCB and 250-kb DCB for individual
tRNA gene in each genome
Find conserved regions in UCB and DCB by
using multiple sequence aligner Mauve
Identify the tRNA gene-borne GI in each genome
4
3I
Candidate islands
based on Set 4
Candidate islands
based on Set 3I
3II
3III
Candidate islands
based on Set 3II
Candidate islands
based on Set 3III
Examine candidate islands
with the aid of TabulateIsland
34
tRNA
Retain GI > 1kb
25
tRNA
Exclude tRNA sites falsely identified as bearing GI
because of closely clustered tRNA genes
19
tRNA
Examine GI using coliBASE assigned differing
sizes depending on the genome subset analysed.
Select the appropriate GI size.
Final list and selected boundaries of tRNAassociated islands
Make multi-FASTA files containing the 2-kb UF
and DF regions for each tRNA gene using
ExtractFlank
Design primer pairs for each tRNA gene based on
consensus regions using Primaclade
Screen island-occupied tRNA sites in test strains
using in vitro tRIP
5
Reject
falsely
selected GI
18
tRNA
1
tRNA
Figure 1. Flowchart depicting the high-throughput strategy developed and utilised to analyse the
contents and contexts of tRNA genes in the four sequenced Escherichia coli and Shigella genomes.
The method was termed tRNAcc. Four stand-alone tools, indicated in bold italic font in the figure,
were employed to identify islands (IdentifyIsland, TabulateIsland) and design primers (ExtractFlank,
Primaclade) corresponding to the conserved upstream downstream flanking regions of each tRNA
site to be interrogated. See Table 1 for a summary of the program features. In this study four
complete genomes were compared by the tRNAcc method: E. coli K-12 MG1655, E. coli UPEC
CFT073, E. coli O157:H7 EDL933 and Shigella flexneri 2a Sf301. Four distinct genome subsets
were analysed with the MG1655 genome being used as the reference template in each case. The
following abbreviations were used: UCB, upstream chromosomal block; DCB, downstream
chromosomal block; GI, genomic island; UF, 2-kb upstream conserved flank; DF, 2-kb downstream
conserved flank.
6
Table 2. List of the important files used in the tRNAcc analysis for the four Escherichia coli and Shigella genomes: E. coli K-12 MG1655 (NCBI Refseq
AC: NC_00913), E. coli UPEC CFT073 (NC_004431), E. coli O157:H7 EDL933 (NC_002655) and S. flexneri 2a Sf301 (NC_004337)
File type
Directory
File
Comment
Program
tRNAcc/
Predefined script file
See Table 1 for the stand-alone program in the tRNAcc
software package
Essential
input files *
tRNAcc/input_data
Run_IdentifyIsland
Run_TabulateIsland
Run_ExtractFlank
Run_DNAnalyser
Run_GenomeSubstrator
genome-being-compared_4.dat
4 genomes of Set 4 in Fig.1
the first genome is identified as the reference genome in
tRNAcc; User-generated to specified format
User-generated to specified format
User-generated to specified format
User-generated to specified format
User-generated to specified format
Downloaded from NCBI Refseq project
Download the annotation of the tRNA and tmRNA (ssrA)
genes from NCBI Refseq Project and the tmRNA website,
respectively; Then revised it into the specified format
Downloaded from NCBI
User-generated to specified format
Downloaded from NCBI
User-generated to specified format
Downloaded from NCBI
User-generated to specified format
User-generated to specified format
Default
input files *
Optional
input files *
genome-being-compared_3I.dat
genome-being-compared_3II.dat
genome-being-compared_3III.dat
tRNA-being-analysed.dat
NC_000913.fna
NC_000913_tRNA.dat
3 genomes of Set 3I in Fig.1
3 genomes of Set 3II in Fig.1
3 genomes of Set 3III in Fig.1
the tRNA sites being analysis
Genome sequence of MG1655
tRNA gene coordinations in
MG1655 genome
tRNAcc/input_data
NC_004431.fna
NC_004431_tRNA.dat
NC_002655.fna
NC_002655_tRNA.dat
NC_004337.fna
NC_004337_tRNA.dat
Hcutoff.dat
tRNAcc/input_data
NC_000913.ptt
Genome sequence of CFT073
tRNA genes of CFT073
Genome sequence of EDL933
tRNA genes of EDL933
Genome sequence of Sf301
tRNA genes of Sf301
The H value cut-off for
GenomeSubstrator
Annotated gene coordinations
in MG1655 input for
GenomeSubstrator
or DNAnalyser with ‘- o’ option.
Annotated genes of CFT073
Annotated genes of EDL933
Annotated genes of Sf301
NC_004431.ptt
NC_002655.ptt
NC_004337.ptt
7
Downloaded from NCBI Refseq project and revised to the
required format using a text editor
User-generated to specified format
User-generated to specified format
User-generated to specified format
Output files
Table 2. Continued
tRNAcc/output_data
GI-found_4.dat
GI-found_3I.dat
GI-found_3II.dat
GI-found_3III.dat
GI_table
Manual
output files *
tRNAcc/output_data
GI-found_checked.dat
Temporary
output files
Optional
output files
tRNAcc/temp_data
tRNA_out.mauve
tRNAcc/output_data
UF_tRNA_GI.fas
DF_tRNA_GI.fas
NC_000913.ptt_uniquegene
_1_H0.42_name.dat
Islands found based on Set 4
Islands found based on Set 3I
Islands found based on Set 3II
Islands found based on Set 3III
The comparison table for
analysing distinct genome
subsets to improve prediction of
island boundaries
Manually analysis result for
distinct genome subsets to
improve prediction of island
boundaries
Alignment result that can be
visualized with Mauve viewer
the DNA sequences of the
upstream conserved flanking
region (UF) of the given tRNA
site across the genomes being
compared
the DNA sequences of the
downstream conserved flanking
region (DF)
The MG1655 strain-specific
genes identified by
GenomeSubstrator
Output of IdentifyIsland
Output of IdentifyIsland
Output of IdentifyIsland
Output of IdentifyIsland
Output of TabulateIsland;
It can be opened with MS Excel
IdentifyIsland-specified format;
Manual analysis with the aid of the program TabulateIsland
Mauve-defined format
Output of ExtractFlank as as the multi-FASTA format.
Input into ClustalW to perform the multiple sequence
alignment; Then use Primaclade to design the tRNA sitespecific primers for tRIP PCR.
Output of ExtractFlank as the multi-FASTA format
Output of GenomeSubstrator
* As the C++ language used to encode tRNAcc v1.0 employs the ANSI character set by default, all user-generated input text files must be compiled using
ANSI encoding and not with Unicode, UTF-8 or an alternative character set. Please refer to the following webpage for more details on character encoding:
http://gedcom-parse.sourceforge.net/doc/encoding.html .
8
3. Program (I): IdentifyIsland
The program IdentifyIsland predicts putative islands based on conserved flanking blocks
identified using the multiple aligner mauveAligne (Darling, et al. 2004, Genome Res., 14, 13941403). To run the executable program IdentifyIsland, type its name at the command prompt:
IdentifyIsland <tRNA-being-analysed> <genome-being-compared> <output-GI-found> [options]
Running options are as follows:
-u n, Set the upstream chromosomal block (UCB) size to n bp (Default is 4000).
-d n, Set the downstream chromosomal block (DCB) size to n bp (Default is 250000).
Note that the tRNA gene being analysed file and the genome being compared file must be in
the exact formats as shown below in this document. The input files must be saved in the
subdirectory input_data. No blank cells are permitted in any of the input files. In addition, the
complete genome sequence and details of the annotated tRNA genes should be provided in the
subdirectory input_data. The file(s) genome_NC.fna contains the complete genome sequence in
FASTA format. The file(s) genome_NC_tRNA.dat contains the coordinates of the annotated tRNA
genes. These files should be in the given formats (see the files NC_000913.fna and
NC_000913_tRNA.dat in the subdirectory tRNAcc/input_data).
The example tested on Set 4, which contains all the four genomes being compared (MG1655,
CFT073, EDL933 and Sf301) (Fig. 1), is run using the default options at the command prompt as
follows.
>./IdentifyIsland tRNA-being-analysed.dat genome-being-compared_4.dat GI-found_4.dat
The input files used are listed as follows.
(i) The tRNA genes being analysed are saved in the file input_data/tRNA-being-analysed.dat, which
was derived from the known tRNA (and tmRNA) genes in the MG1655 reference genome and
compiled in the following format:
<analysed>
<tRNA>
9
t
ileV
f
alaV
etc...
Here, ‘t’ (or ‘f’) denotes the tRNA gene being analysis (or not). Empty cells are not
permitted in this file. Note that tRNA are mapped into the MG1655 tRNA gene annotation file
input_data/NC_000913_tRNA.dat, using their unique names as the matching keyword.
(ii) The file input_data/genome-being-compared_4.dat specifies the four genomes being compared
in Set 4 and is prepared in following format:
<genome accession number>
NC_000913
NC_004431
NC_002655
NC_004337
Note that IdentifyIsland identifies the reference template based on the first listed
genome in the genome being compared file. For example in the file shown above, IdentifyIsland
identifies the MG1655 genome (NC_000913) as the reference template. Empty cells are not
permitted in the file.
(iii) The files defining the genome sequence should be prepared in the following formats:
The MG1655 genome sequence file: input_data/NC_000913.fna
>gi|49175990|ref|NC_000913.2| Escherichia coli K12, complete genome
AGCTTTTCATTCTGACTGCAACGGGCAATATGTCTCTGTGTGGATTAAAAAAAGAGTGTCTGATAGCAGC
TTCTGAACTGGTTACCTGCCGTGAGTAAATTAAAATTTTATTGACTTAGGTCACTAAATACTTTAACCAA
...
GCAATGTTGCACCGTTTGCTGCATGATATTGAAAAAAATATCACCAAATAAAAAACGCCTTAGTAAGTAT
TTTTC
It is suggested that the user download NC_000913.fna or other required genome files in
single-FASTA format from the NCBI at ftp.ncbi.nih.gov/genome/bacteria or specified genome
10
sequencing centres. Note that the filename (NC_000913.fna) comprises of the Refseq NC number
(NC_000913) followed by a dot (.) and three characters (fna). The same NC number is used in the
genome being compared file.
The MG1655 tRNA gene annotation file: input_data/NC_000913_tRNA.dat
<Start>
<Stop> <strand>
<tRNA>
225381
225457
+
ileV
225500
225575 +
alaV
...
4604338 4604424 -
leuQ
Note, '+' or '-' symbols in the third column denote that the tRNA gene is encoded within the
forward or complementary strand, respectively. The user would take the details of the tRNA and
tmRNA (ssrA) genes from NCBI Refseq annotations and the tmRNA website at
http://www.indiana.edu/~tmrna/, respectively. The filename (NC_000913_tRNA.dat) comprises the
NC number (NC_000913) followed by five characters ( _tRNA), a dot (.) and three characters (dat).
The same NC number is used in the file input_data/genome-being-compared_4.dat. tRNA are
mapped into the file input_data/tRNA-being-analysed.dat, described above, using their unique
names as the matching keyword. Note that empty cells are not permitted in this file as well. The
genome and tRNA gene files for the other three genomes (CFT073, EDL933 and Sf301) are also
prepared in the given formats and stored in the subdirectory input_data.
The output file GI-found_4.dat is saved in the subdirectory output_data in the following
format.
<#> <tRNA> <genome> <tRNA start> <tRNA stop> <strand> <GI start> <GI stop> <GI size> <Description>
4 aspV NC_000913 236931
237007
+
237008 239419
2412
normal
4 aspV NC_004431 248554
248630
+
248631 348625
99995
normal
4 aspV NC_002655 240482
240558
+
240559 277488
36930
normal
4 aspV NC_004337 229833
229909
+
229910 287582
57673
normal
etc…
In addition, the alignment result for each of the tRNA sites under study is saved as
the .mauve file in the subdirectory /temp_data (Table 2). Say /temp_data/aspV_out.mauve for aspV
11
site. It can be displayed by the Mauve viewer with the input of aspV_out.mauve (see Fig. 2). Mauve
is available at http://gel.ahabs.wisc.edu/mauve.
Figure 2. Screenshot of the Mauve viewer for locally collinear blocks (LCBs) in the 4 kb upstream chromosomal block
(UCB) and 250 kb downstream chromosomal block (DCB) flanking the aspV sites identified among the 4 E. coli and
Shigella genomes. Each contiguously colored region is a locally collinear block, a region without rearrangement of
homologous backbone sequence. The 100 kb island in E. coli UPEC CFT073 can be visualized as the distance between
the tRNA-proximal LCB in UCB (colored in red) and that in DCB (colored in dark yellow) in the genome's center line
marked with ‘aspV_NC_004431.fas’.
Using MG1655 as the reference template in all cases, four different subsets of the genomes
being compared were tested (Fig. 1): Set 4 (MG1655, CFT073, EDL933 and Sf301), Set 3I
(MG1655, CFT073 and EDL933), Set 3II (MG1655, EDL933 and Sf301) and Set 3III (MG1655,
12
CFT073 and Sf301). To run the program IdentifyIsland for each subset individually, a simple batch
file Run_IdentifyIsland would be the following:
./IdentifyIsland tRNA-being-analysed.dat genome-being-compared_4.dat GI-found_4.dat
./IdentifyIsland tRNA-being-analysed.dat genome-being-compared_3I.dat GI-found_3I.dat
./IdentifyIsland tRNA-being-analysed.dat genome-being-compared_3II.dat GI-found_3II.dat
./IdentifyIsland tRNA-being-analysed.dat genome-being-compared_3III.dat GI-found_3II.dat
After running the above batch file, four candidate island reports were obtained in the
subdirectory
output_data:
GI-found_4.dat,
GI-found_3II.dat,
GI-found_3II.dat
and
GI-
found_3II.dat. Then a comparison table generated by the program TabulateIsland was helpful for
the selection of the correct islands (Fig. 1).
4. Program (II): TabulateIsland
The program TabulateIsland tabulates the islands identified when analysing different subsets
of genomes. To run the executable program TabulateIsland, type its name at the command prompt:
TabulateIsland
<tRNA-being-analysed>
<Identified-GI-based-on-SetI>
<Dataset-Number>
<Genome-being-compared-SetI>
<Genome-being-compared-SetII>
<Identified-GI-based-on-SetII>
<output-GI-table>
For this example, a batch file Run_TabulateIsland would be the following:
TabulateIsland
tRNA-being-analysed.dat
4
genome-being-compared_4.dat
GI-found_4.dat
genome-being-compared_3I.dat GI-found_3I.dat genome-being-compared_3II.dat
GI-found_3II.dat
genome-being-compared_3III.dat
GI-found_3III.dat
GI_table.txt
The input files tRNA-being-analysed.dat, genome-being-compared_4.dat genome-beingcompared_3I.dat, genome-being-compared_3II.dat and genome-being-compared_3III.dat are stored
in the subdirectory input_data with the given formats. But the others GI-found_4.dat, GI13
found_3I.dat, GI-found_3II.dat and GI-found_3III.dat had been generated by the program
IdentifyIsland and therefore stored in the subdirectory output_data.
The resulting comparison table GI_table.txt in the subdirectory output_data is helpful for
telling the correct islands from the candidates taken from different subsets. A file GIfound_checked.dat containing the manually checked islands can therefore be generated in
using a text editor and saved in the subdirectory output_data. The format of GIfound_checked.dat is same to that of GI-found_4.dat, described in the section ‘Program (I):
IdentifyIsland’.
To run the batch file Run_TabulateIsland, the user would type:
>./Run_TabulateIsland
Some results of the procedure will appear on the computer screen.
WELCOME TO TabulateIsland!
The input parameters...
tRNA being analysed file : input_data/tRNA-being-analysed.dat
# of dataset = 4
(1) input_data/genome-being-compared_4.dat; output_data/GI-found_4.dat
(2) input_data/genome-being-compared_3I.dat; output_data/GI-found_3I.dat
(3) input_data/genome-being-compared_3II.dat; output_data/GI-found_3II.dat
(4) input_data/genome-being-compared_3III.dat; output_data/GI-found_3III.dat
Output GI table file :output_data/GI_table.txt
tRNA being analysed file : input_data/tRNA-being-analysed.dat
# of tRNA genes listed = 87
# of tRNA genes being analysed = 87
GIs identified when analysing different subsets of genomes
Subset (1)
# of genome contained = 4
# of input GI = 252
Subset (2)
# of genome contained = 3
# of input GI = 3
Subset (3)
# of genome contained = 3
# of input GI = 3
Subset (4)
# of genome contained = 3
# of input GI = 3
14
Tabulate the GIs in the file : output_data/GI_table.txt
5. Program (III): ExtractFlank
The program ExtractFlank generates multi-FASTA files containing the upstream or
downstream flanking regions for the identified islands. To run the executable program ExtractFlank,
type its name at the command prompt:
ExtractFlank <tRNA-being-analysed> <genome-being-compare> <GI-found_checked> [options]
Running options are as follows:
-u n, Set the UF size to n bp (Default is 2000).
-d n, Set the DF size to n bp (Default is 2000).
-h,
Set the hotspot as non-tRNA.
For this example, a batch file Run_ExtractFlank would be the following:
./ExtractFlank tRNA-being-analysed.dat genome-being-compared_4.dat GI-found_checked.dat
The input files tRNA-being-analysed.dat and genome-being-compared_4.dat are stored in
the subdirectory input_data with the given formats. Based on the identified boundaries of the GI
contained in file output_data/GI-found_checked.dat, a 2-kb upstream flanking region (UF) and
2-kb downstream flanking region (DF) for each tRNA gene across the full set of genomes being
compared was extracted using the program ExtractFlank. The output UF and DF files are stored in
the subdirectory output_data, respectively; say UF_aspV_GI.fas and DF_aspV_GI.fas for aspVborne islands. Next, the specific primer pair for UF and DF of a given tRNA site are designed using
the online program Primaclade (http://www.umsl.edu/services/kellogg/primaclade.html) with the
inputs
comprising
the
ClustalW-derived
multiple
sequence
alignments
(http://www.ebi.ac.uk/clustalw/). Candidate primers for the UF and DF regions of each tRNA gene
15
targeted are then screened by BLASTN searching against the genomes under consideration to
minimize the likelihood of non-specific amplification.
Run the batch file Run_ExtractFlank at the command prompt as follows.
>./Run_ExtractFlank
Some results of the procedure will appear on the computer screen.
WELCOME TO ExtractFlank!
tRNA being analysed file : input_data/tRNA-being-analysed.dat
# of tRNA genes listed = 87
# of tRNA genes being analysed = 87
# of input GIs = 80
Genome being compared file : input_data/genome-being-compared_4.dat
# of genomes being compared = 4
(1) genome sequence file : input_data/NC_000913.fna
Genome size (bp) = 4639675
G+C content = 50.79 %
Annotated tRNA gene file : input_data/NC_000913_tRNA.dat
# of annotated tRNA genes = 87
(2) genome sequence file : input_data/NC_004431.fna
Genome size (bp) = 5231428
G+C content = 50.47 %
Annotated tRNA gene file : input_data/NC_004431_tRNA.dat
# of annotated tRNA genes = 90
(3) genome sequence file : input_data/NC_002655.fna
Genome size (bp) = 5528445
G+C content = 50.38 %
Annotated tRNA gene file : input_data/NC_002655_tRNA.dat
# of annotated tRNA genes = 99
(4) genome sequence file : input_data/NC_004337.fna
Genome size (bp) = 4607203
G+C content = 50.89 %
Annotated tRNA gene file : input_data/NC_004337_tRNA.dat
# of annotated tRNA genes = 98
# of GIs listed = 61
aspV # of GIs = 4
NC_000913 + 237008 239419
NC_004431 + 248631 348625
NC_002655 + 240559 277488
NC_004337 + 229910 287582
2.41
100.00
36.93
57.67
16
etc…
Output the U_F and D_F for each GI.
the 2000bp UF file: output_data/UF_tRNA_GI.fas
the 2000bp DF file: output_data/DF_tRNA_GI.fas
6. Program (IV): DNAnalyser
The program DNAanalyser calculates the GC content, the dinucleotide bias of identified
islands, and the negative cumulative GC profile of genomes. Dinucleotide bias analysis was
performed using the method proposed by Karlin (2001, Trends Microbiol, 9, 335-343). The
dinucleotide relative abundance difference δ ∗ between the island fragment and the genome were
calculated. The genome-averaged δ ∗ value was also obtained by using a 20-kb non-overlapping,
sliding window along the entire genome sequence. The negative form of the cumulative GC profile
of Zhang and colleagues (2004, Bioinformatics, 20, 612-622; Zhang, et al., 2005, Physical Review
E, 72, 041917; see the brief description in the supplementary materials) was used to visualise the
locations of the identified tRNA-borne islands within the context of complete genomes.
To run the executable program DNAanalyser, type its name at the command prompt:
DNAanalyser <GI-being-analysed> <genome-being-found> [options]
Running options are as follows:
-o, Find the annotated CDS harbouring in the islands.
-i, Output the DNA sequences of the islands.
-g, Calculate the GC content and dinucleotide bias.
-z, Calculate the negative cumulative GC profile.
-s n, Set the size (n bp) of the non-overlapping, sliding window for the coarse-grained
negative cumulative GC profile (Default is 10 bp).
For this example, a batch file Run_DNAnalyser would be the following:
DNAnalyser genome-being-compared_4.dat GI-found_checked.dat -o -g –z > DNAnalyser_result.txt
17
The input file genome-being-compared_4.dat and GI-found_checked.dat are stored in
the subdirectory input_data and output_data, respectively, with the given formats.
When run DNAnalyser with the option ‘-o’, the annotated protein-coding sequences (CDS)
file for each genome being analysed should be provided in the subdirectory input_data in the
following format. Say, NC_000913.ptt for the annotated CDS in MG1655 genome.
The CDS annotation file: NC_000913.ptt
<Start>
<Stop> <strand>
<CDS>
190
255
+
b0001
337
2799
+
b0002
2801
3733
+
b0003
etc…
Note, '+' or '-' symbols in the third column denote that the CDS is encoded within the
forward or complementary strand, respectively. The user would normally download NC_000913.ptt
or other required CDS annotation files from the NCBI or specified genome sequencing centres. This
file can then be revised into the above format using a text editor. The filename (NC_000913.ptt)
comprises the NC number (NC_000913) followed by a dot (.) and three characters (ptt). The same
NC number is used in the genome being compared file. Note that empty cells are not permitted in
this file as well.
The GC content and dinucleotide relative abundance difference for each GI are shown in the
file DNAnalyser_result.txt after running DNAnalyser. The CDS carried by the GIs are stored in the
subdirectory output_data, say the file GIBorneCDS_NC_000913.dat for the MG1655 genome. The
coordination of the negative cumulative GC profile for the MG1655 genome, the tRNA genes and
the
identified
GIs
are
Zp_NC_000913_genome.dat,
saved
into
the
subdirectory
Zp_NC_000913_hotspot.dat
output_data
and
respectively.
To run the batch file Run_DNAnalyser, the user would type:
18
as
the
file
Zp_NC_000913_GI.dat,
>./Run_DNAnalyser
Some results of the procedure will be saved the file DNAnalyser_result.txt.
WELCOME TO DNAnalyser 1.0!
Input GI file :output_data/GI-found_checked.dat
# of input GIs = 80
Genome being compared file : input_data/genome-being-compared_4.dat
# of genomes being compared = 4
(1) genome sequence file : input_data/NC_000913.fna
Genome size (bp) = 4639675
G+C content = 50.79 %
Delta Difference Mean (*1000) = 26.17
Delta Difference SD (*1000) = 11.05
Note: The delta difference is calculated using a 20 kb sliding window.
the slope of Z' curve = -0.01
Annotated CDS file : input_data/NC_000913.ptt
# of annotated CDS = 4242
Annotated tRNA gene file : input_data/NC_000913_tRNA.dat
# of annotated tRNA genes = 87
(2) genome sequence file : input_data/NC_004431.fna
Genome size (bp) = 5231428
G+C content = 50.47 %
Delta Difference Mean (*1000) = 31.20
Delta Difference SD (*1000) = 17.55
Note: The delta difference is calculated using a 20 kb sliding window.
the slope of Z' curve = -0.01
Annotated CDS file : input_data/NC_004431.ptt
# of annotated CDS = 5379
Annotated tRNA gene file : input_data/NC_004431_tRNA.dat
# of annotated tRNA genes = 90
(3) genome sequence file : input_data/NC_002655.fna
Genome size (bp) = 5528445
G+C content = 50.38 %
Delta Difference Mean (*1000) = 32.69
Delta Difference SD (*1000) = 23.03
Note: The delta difference is calculated using a 20 kb sliding window.
the slope of Z' curve = -0.01
Annotated CDS file : input_data/NC_002655.ptt
# of annotated CDS = 5324
Annotated tRNA gene file : input_data/NC_002655_tRNA.dat
# of annotated tRNA genes = 99
(4) genome sequence file : input_data/NC_004337.fna
Genome size (bp) = 4607203
G+C content = 50.89 %
19
Delta Difference Mean (*1000) = 26.72
Delta Difference SD (*1000) = 13.80
Note: The delta difference is calculated using a 20 kb sliding window.
the slope of Z' curve = -0.01
Annotated CDS file : input_data/NC_004337.ptt
# of annotated CDS = 4180
Annotated tRNA gene file : input_data/NC_004337_tRNA.dat
# of annotated tRNA genes = 98
Output analysis result...
# of GIs in total = 61
NC_000913 # of GIs = 15
Hotspot
Orient. Start
aspV
+
237008
thrW
+
262171
serW
924838
serX
1096261
tyrT
1285752
serU
2040051
asnT
+
2042649
argW
+
2464406
lysV
+
2519351
glyU
2985268
pheV
+
3108464
selC
+
3834340
leuX
+
4494513
ssrA
+
2753978
argU
+
564023
End
239419
302055
925106
1096787
1286760
2041491
2052776
2476989
2523951
2997005
3117604
3836246
4534634
2783565
585323
Size CDS
2.41 1
39.88 21
0.27 0
0.53 0
1.01 1
1.44 0
10.13 1
12.58 9
4.60 2
11.74 9
9.14 3
1.91 0
40.12 19
29.59 15
21.30 15
186.65 96
GC%
38.10
54.02
42.01
58.25
54.41
40.67
48.04
44.60
47.60
36.41
50.56
43.58
50.14
45.72
43.27
50.79
delta*1000(SD)
82.18
37.20
N/D
N/D
196.18
60.75
45.86
51.98
42.42
82.97
19.85
64.73
45.10
63.42
59.86
26.17 (11.05)
NC_004431 # of GIs = 17
Hotspot
Orient. Start
aspV
+
248631
thrW
+
370300
serW
979744
serX
1127287
tyrT
1525206
serU
2193666
asnT
+
2217998
argW
+
2746800
lysV
+
2802362
metV
+
3222388
glyU
3295279
pheV
+
3406301
selC
+
4274399
pheU
4919458
leuX
+
5115427
ssrA
+
3018542
asnW
+
2261814
End
348625
377957
980012
1241061
1532508
2216840
2255240
2761355
2806808
3255081
3295425
3534241
4343017
4971584
5131334
3067527
2317212
Size CDS
100.00 54
7.66 4
0.27 0
113.78 59
7.30 4
23.18 13
37.24 13
14.56 4
4.45 2
32.69 13
0.15 0
127.94 73
68.62 44
52.13 37
15.91 8
48.98 32
54.40 13
709.24 373
GC%
47.38
43.80
40.52
48.73
52.02
37.70
55.95
44.28
47.25
52.92
34.01
47.18
46.98
47.52
48.02
49.05
53.19
50.47
delta*1000(SD)
67.99
109.80
N/D
62.17
49.47
84.51
29.76
90.78
46.42
21.21
N/D
66.81
46.30
75.95
66.31
37.18
59.48
31.20 (17.55)
NC_002655 # of GIs = 16
Hotspot
Orient. Start
aspV
+
240559
End Size
277488
CDS GC% delta*1000(SD)
36.93 16
51.62 34.11
20
thrW
serW
serT
serX
tyrT
leuZ
serU
asnT
argW
lysV
glyU
pheV
selC
leuX
ssrA
+
+
+
+
+
+
+
+
300059
1058350
1250316
1454244
1823688
2668235
2741780
2789558
3262939
3319704
3776946
3919348
4649843
5377087
3545814
335240
1146183
1295562
1541789
1824518
2689297
2788400
2800590
3277063
3320154
3804618
3942803
4693540
5421522
3575018
35.18 22
87.83 53
45.25 31
87.55 52
0.83 0
21.06 14
46.62 27
11.03 2
14.13 7
0.45 1
27.67 18
23.46 13
43.70 26
44.44 13
29.21 16
555.33 311
46.80
47.95
52.15
47.99
52.83
50.10
52.02
48.30
45.03
43.24
35.83
46.32
40.94
47.37
41.56
50.38
44.10
66.96
53.99
66.91
N/D
26.64
50.87
43.42
41.97
N/D
79.61
63.31
73.58
29.73
68.70
32.69 (23.03)
NC_004337 # of GIs = 13
Hotspot
Orient. Start
aspV
+
229910
thrW
+
311277
serW
876928
tyrT
1282218
serU
2044147
asnT
+
2067607
argW
+
2476682
lysV
+
2522624
glyU
2947607
pheV
+
3052540
selC
+
3806495
leuX
4388608
ssrA
+
2754496
End
287582
332850
877255
1282576
2066449
2072104
2482030
2523230
2957651
3107685
3836374
4396147
2758148
Size CDS
57.67 33
21.57 13
0.33 0
0.36 1
22.30 11
4.50 3
5.35 3
0.61 1
10.05 6
55.15 25
29.88 15
7.54 5
3.65 2
218.96 118
GC%
51.21
44.57
44.82
53.48
48.35
50.07
50.38
46.13
48.75
48.38
47.99
49.22
51.11
50.89
delta*1000(SD)
29.69
60.90
N/D
N/D
56.84
56.52
59.05
N/D
125.19
81.71
58.45
57.69
65.22
26.72 (13.80)
Output the ORFs carried by the identified GIs ...
output_data/GIBorneCDS_Genome.dat
Output the negative cumulative GC profile for NC_000913
The sliding window size for the coarse-grained profile = 10 bp
output_data/Zp_NC_000913_genome.dat
output_data/Zp_NC_000913_hotspot.dat
output_data/Zp_NC_000913_GI.dat
Output the negative cumulative GC profile for NC_004431
The sliding window size for the coarse-grained profile = 10 bp
output_data/Zp_NC_004431_genome.dat
output_data/Zp_NC_004431_hotspot.dat
output_data/Zp_NC_004431_GI.dat
Output the negative cumulative GC profile for NC_002655
The sliding window size for the coarse-grained profile = 10 bp
output_data/Zp_NC_002655_genome.dat
output_data/Zp_NC_002655_hotspot.dat
21
output_data/Zp_NC_002655_GI.dat
Output the negative cumulative GC profile for NC_004337
The sliding window size for the coarse-grained profile = 10 bp
output_data/Zp_NC_004337_genome.dat
output_data/Zp_NC_004337_hotspot.dat
output_data/Zp_NC_004337_GI.dat
7. Program (V): GenomeSubstrator
The perl/Bioperl script GenomeSubstrator.pl implements a high-throughput BLASTN-based
comparison of gene sequences in a query genome against the subject genomes to identify strainspecific gene based on the level of nucleotide similarity.
(1) Required software
The local version of formatdb and blastall taken from the NCBI BLAST software
(ftp://ftp.ncbi.nih.gov) is included in the tRNAcc package. In order to run the program, Perl 5
(http://cpan.perl.org/) and Bioperl (http://www.bioperl.org/) need to be locally installed. By default,
the perl installation directory is /usr/bin/perl. Before running the GenomeSubstrator.pl script,
please check whether or not the installation directory is listed correctly in the first line of
GenomeSubstrator.pl with a text editor.
(2) Running GenomeSubstrator
To run the perl script GenomeSubstrator, type its name at the command prompt:
>perl GenomeSubstrator <H-cutoff-file> <query-gene-file> <query-genome-file> <subject-genomenumber> <subject-genomeI-file> <subject-genomeII-file>
To find the E. coli MG1655-specific genes with respect of the other genomes (E. coli CFT073,
E. coli EDL933 and Shigella flexneri Sf301), a batch file Run_GenomeSubstrator would be the
following:
22
perl GenomeSubstrator.pl Hcutoff.dat NC_000913.ptt NC_000913.fna 3 NC_004431.fna
NC_002655.fna NC_004337.fna
The H value cutoff (0.42) and the gene length cutoff (0 bp) are saved in the file input_data/
Hcutoff.dat and compiled in the following format:
<H cutoff>
0.42
<length cutoff>
0
The query genes greater than the length cutoff are performed the BLASTN search against
the three subject genomes. If all three obtained H values for a given MG1655 gene ≤ 0.42, the gene
are classified to be ‘strain-specific’ with respect to CFT073, EDL933 and Sf301. Details of the
procedure used are included in the supplementary material.
The query gene annotation file input_data/NC_000913.ptt must be in the exact format as
shown above in the section ‘Program (IV): DNAnalyser’. The query genome file NC_000913.fna
and the three subject genome files (NC_004431.fna, NC_002655.fna and NC_004337.fna) are
prepared in the single-FASTA format described in the section ‘Program (I): IdentifyIsland’. All the
input files are saved in the directory input_data.
(3) Outputs
Run the batch file Run_GenomeSubstrator at the command prompt as follows. Note that the
blast steps will take a significant amount of time.
>./Run_GenomeSubstrator
The gene name, the chromosome locations and the H values of the identified MG1655specific genes are listed in the file output_data/NC_000913.ptt_uniquegene_1_H0.42_name.dat.
Some results of the procedure will appear on the computer screen.
WELCOME TO GenomeSubstrator v1.0!
Create a new temporary subdirectory temp_seq...
23
Input parameters...
The file containing H value cutoff : input_data/Hcutoff.dat
The <1> H value cutoff = 0.42
Note: the putative strain-specific genes with the H value
less than (or equal to) the cutoff.
The query gene file: input_data/NC_000913.ptt
The query genome file: input_data/NC_000913.fna
The 3 subject genome(s) file:
(1). NC_004431.fna
(2). NC_002655.fna
(3). NC_004337.fna
Read the gene sequences from the fasta file.
Genome sequence file : input_data/NC_000913.fna
Genome size (bp) = 4639675
G+C content = 50.79 %
Annotated gene file : input_data/NC_000913.ptt
# of annotated genes = 4242
Extract 10 gene sequences into the file: temp_seq/querygeneseq.fas
Query genes are employed the BLASTN search against the subject genome(s).
(1) Versus the subject genome NC_004431.fna
(2) Versus the subject genome NC_002655.fna
(3) Versus the subject genome NC_004337.fna
Predict the strain-specific genes in the query genome using the H cutoff.
<1> the H value cutoff = 0.42
the gene length cutoff (bp) = 0
Query gene file: input_data/NC_000913.ptt
# of query genes = 4242
(1) Parse file: temp_seq/parseblastresult1.txt
# of 'parsed' genes = 4242
# of 'parsed' genes matching query genes = 4242
(2) Parse file: temp_seq/parseblastresult2.txt
# of 'parsed' genes = 4242
# of 'parsed' genes matching query genes = 4242
(3) Parse file: temp_seq/parseblastresult3.txt
# of 'parsed' genes = 4242
# of 'parsed' genes matching query genes = 4242
# of query genes being Blast vs all subject genomes = 4242
# of query genes greater than the length threshold (0 bp)= 4242
# of unique genes = 234
Extract the putative strain-specific genes.
# of the query genes = 4242
# of the strain-specific genes = 234
Output strain-specific genes into output_data/NC_000913.ptt_uniquegene_1_H0.42_name.dat
24
Output sequences of strain-specific genes into
output_data/NC_000913.ptt_uniquegene_1_H0.42_seq.fas
Output the conserved genes into output_data/NC_000913.ptt_conservedgene_1_H0.42_name.dat
Output the sequences of conserved genes into
output_data/NC_000913.ptt_conservedgene_1_H0.42_seq.fas
8. Program (VI): LocateHotspots
The perl/Bioperl script LocateHotspots.pl is designed to facilitate the process of locating
known hotspots in un-annotated chromosomal sequences using BLASTN-based searches. For a
given hotspot in the reference genome, the potential candidates in the test genome are identified
based on the nucleotide similarity of the hotspot sequence and its 2-kb upstream flanking region.
The subsequent manual examination is necessary to confirm the hotspot coordination in the
test genome.
(1) Required software
The local version of formatdb and blastall taken from the NCBI BLAST software
(ftp://ftp.ncbi.nih.gov) is included in the tRNAcc package. In order to run the program, Perl 5
(http://cpan.perl.org/) and Bioperl (http://www.bioperl.org/) need to be locally installed. By default,
the perl installation directory is /usr/bin/perl. Before running the LocateHotspots.pl script, please
check whether or not the installation directory is listed correctly in the first line of
LocateHotspots.pl with a text editor.
(2) Running LocateHotspots
To run the perl script LocateHotspots, type its name at the command prompt:
>perl LocateHotspots <hotspots-being-analysed> <hotspots-coordination-in-reference-genome>
<genome-being-compared> <maximum-number-of-best-hits-for-each-hotspot>
25
To locate the E. coli MG1655 known tRNA genes in the other genomes (E. coli CFT073, E.
coli EDL933 and Shigella flexneri Sf301), a batch file Run_LocateHotspots would be the following:
perl LocateHotspots.pl tRNA-being-analysed.dat NC_000913_tRNA.dat genome-beingcompared_4.dat 1
The
files
tRNA-being-analysed.dat,
file
genome-being-compared_4.dat
and
NC_000913_tRNA.dat must be prepared in the exact formats and saved in the subdirectory
input_data. In addition, the complete genome sequences (NC_004431.fna, NC_002655.fna and
NC_004337.fna) should be provided in the subdirectory input_data in the given format. See the
section ‘Program (I): IdentifyIsland’.
(3) Outputs
Run the batch file Run_LocateHotspots at the command prompt as follows.
>./Run_LocateHotspots
The lists of the identified coordination and the H-value of the hotspots in each genomes
being compared are saved individually in the subdirectory output_data. Note that the further
manual examination is necessary to confirm the hotspot coordination. Some results of the
procedure will appear on the computer screen.
WELCOME TO LocoateHotspots v1.0!
Input parameters...
The hotspot file: input_data/tRNA-being-analysed.dat
The genome being analysed file: input_data/genome-being-compared_4.dat
Max number of the best hits for each hotspot = 1
1. Read the hotpots.
# of hotspots = 87
# of hotspots being analysed = 87
2. Read the hotpot locations in the reference genome.
The hotspot file: input_data/NC_000913_tRNA.dat
# of hotspots in the reference genome = 87
3. Read the genomes being compared.
26
# of the genomes being compared = 4
(1). NC_000913.fna
(2). NC_004431.fna
(3). NC_002655.fna
(4). NC_004337.fna
4. Extract the upstream flanking regions and hotspot in the reference genome.
hotspots being analysed file : input_data/tRNA-being-analysed.dat
# of hotspots listed = 87
# of hotspots being analysed = 87
The reference genome: NC_000913
Genome sequence file : input_data/NC_000913.fna
Genome size (bp) = 4639675
G+C content = 50.79 %
Annotated tRNA gene file : input_data/NC_000913_tRNA.dat
# of annotated tRNA genes = 87
Sequence output file :temp_data/hotspotqueryseq.fas
5. All the hotspots are BLASTN against the genomes being compared.
(1) Versus the subject genome NC_000913.fna.
(2) Versus the subject genome NC_004431.fna.
(3) Versus the subject genome NC_002655.fna.
(4) Versus the subject genome NC_004337.fna.
6. Predict the hotspot locations in the other genomes being compared.
(1)# of found hotspots in NC_000913 = 87
output file: output_data/NC_000913_hotspots.dat
(2)# of found hotspots in NC_004431 = 87
output file: output_data/NC_004431_hotspots.dat
(3)# of found hotspots in NC_002655 = 87
output file: output_data/NC_002655_hotspots.dat
(4)# of found hotspots in NC_004337 = 87
output file: output_data/NC_004337_hotspots.dat
27
9. Application of tRNAcc to interrogate CGI-defined non-tRNA hotspots
A new approach, termed microarray-assisted mobilome prospecting (MAmP) (Ou, et al,
2005, Nucleic Acids Res., 33,e3), has recently been proposed to screen large numbers of bacterial
isolates to identify strains rich in novel genetic material for further detailed analyses. The MAmP
approach combines physical chromosome sizing and virtual sizing using microarray-derived
comparative genomic indexing (CGI) data to estimate the novel DNA content of a test strain.
Strains that posses large complements of accessory genomic material can then be chosen for
subsequent island prospecting studies.
Furthermore as has been proposed by several investigators, CGI data could also be used to
identify possible non-tRNA-associated integration hotspots. These loci could then be investigated
using approaches equivalent to tRNAcc and tRIP. We tested this strategy by exploring putative
hotspots identified using previously published MG1655 array-derived data for 27 clinical and field
E. coli isolates from diseased and healthy animals. Anjum et al. (2003, Infect. Immun., 71, 46744683) had identified 49 highly variable segments of the MG1655 chromosomal backbone with more
than 10 consecutive CDS absent from at least two strains. Fourteen of these variable regions lie
within MG1655 GIs at 6 tRNA genes (thrW, argU, argW, ssrA, pheV and leuX), confirming that
tRNA genes frequently serve as integration sites for acquired DNA. Following coliBASE-facilitated
examination of the remaining 35 MG1655 variable segments and the corresponding regions in
CFT073, EDL933 and Sf301, 6 putative hotspots (icdA, ydbL, galF, rfaC, yjiA and yjiY) were
identified (Table 3). These six genes were termed ‘CDS-hotspots’. Unlike tRNA sites, GIs could lie
adjacent to either the 3’-end or the 5’-end of the implicated CDS. When tRNAcc was used to
investigate these 6 CDS-hotspots, 20 GI-like regions were identified within the core set of four
genomes (Table 3). Further characterization of other putative GIs linked to CDS-hotspots supports a
foreign origin for most of these elements and suggests that PCR-based screening can also be used to
efficiently scan non-tRNA-associted hotspots in closely related strains.
28
Table 3. Sizes of genomic islands identified by the tRNAcc method that map to non-tRNA sites in
four sequenced E. coli and Shigella genomes a
No tRNA
gene
E. coli
K-12
MG1655
E. coli
1
icdA
2
UPEC
CFT073
E. coli
O157:H7
EDL933
S. flexneri
2a Sf301
Identity of
2.0 kb UF b
Identity of
2.0 kb DF b
21.6
59.8
44.4
1.5
97%
88% (1.7kb, 96%)
ydbL
27.9
6.5
6.3
3.1
88% (1.7kb, 92%)
70% (1.1kb, 94%)
3
galF
12.1
11.3
14.2
11.4
64% (0.9kb, 93%)
92%
4
rfaC
11.5
9.5
8.5
9.3
93%
98%
5
yjiA
17.9
10.8
12.5
10.6
92%
69% (0.9kb, 92%)
6
yjiY
0.3
0.3
1.0
12.4
98%
88% (1.7kb, 96%)
a
g
These non-tRNA hotspots were identified based on previously reported comparative genomic
indexing data derived following analysis of 27 E. coli strains against the MG1655 array (Anjum et
al., 2003, Infect. Immun., 71, 4674-4683). The authors had identified 49 highly variable segments of
the MG1655 chromosomal backbone with 10 or more consecutive CDS absent from at least two
strains. Following manual review six non-tRNA putative hotspots were chosen for inclusion in this
study. The island sizes are shown to the nearest kilobase (kb). Predicted insertions of at these loci of
greater than 1 kb in size are highlighted in bold type to indicate putative genomic islands.
b
The identities of the 2 kb upstream flanking regions (UF) and the 2 kb downstream flanking
regions (DF) across all the four genomes are calculated by the multiple alignment program
ClustalW 1.82 (Chenna, et al., 2003, Nucleic Acids Res., 31, 3497-3500). Note that genomes
exhibiting deletions of particular flanking regions were excluded from the corresponding multiple
sequence alignments. If the identity of the complete 2 kb flanking sequences was less than 90%, a
highly conserved region within the UF or DF region was further investigated. The sizes and
identities of these shorter highly conserved regions present within the 2 kb segments themselves are
shown in parentheses. Unlike the UF regions for the tRNA sites, the 2 kb UF regions selected for
these non-tRNA hotspots contained the corresponding CDS itself.
g
The secondary conserved downstream flanking region was inverted with respect to MG1655.
29
Here the two hotspots, icdA and yjiY genes, are taken as the examples to do tRNAcc analysis
for the non-tRNA sites as the following steps. Please note that there are two slight differences in the
tRNA analysis process for the typical tRNA site and the non-tRNA site, which are highlighted with
red underlines.
(1) Add the two non-tRNA sites into the tRNA being analysed file as follows with a text editor.
Input file: tRNAcc/input_data/tRNA-being-analysed.dat
<analysed>
f
f
…
f
f
t
t
<tRNA>
ileV
alaV
leuQ
ssrA
icdA
yjiY
tmRNA
non-tRNA
non-tRNA
Here, ‘t’ (or ‘f’) denotes the tRNA gene or non-tRNA genes being analysis (or not).
(2) Add the chromosome locations into the tRNA gene files for all the genomes being compared.
Input file: tRNAcc/input_data/NC_000913_tRNA.dat
<Start>
225381
225500
…
4604338
2753615
1194346
4587152
<Stop>
225457
225575
<strand>
+
+
4604424
2753977
1195596
4589317
+
+
+
<tRNA>
ileV
alaV
leuQ
ssrA
icdA
yjiY
tmRNA
non-tRNA
non-tRNA
Note, '+' or '-' symbols for the tRNA sites in the third column denote that the tRNA gene is encoded
within the forward or complementary strand, respectively. However, unlike tRNA sites, these
symbols for the non-tRNA sites denote the relative locations of the non-tRNA genes with the
corresponding variable segments identified by CGI in the forward strand of E. coli MG1655 since
islands could lie adjacent to either the 3’-end or the 5’-end of the non-tRNA sites. For example, a
variable segment is located downstream in the icdA gene in the forward strand of E. coli MG1655
(click here to link in coliBASE). So the symbol is ‘+’. For the yjiY site, a CGI-detected variable
segment is also located downstream in the yjiY gene. (With the subsequent tRNAcc analysis, the
30
12.4 kb large insertion is found to be located downstream in the yjiY gene of S. flexneri 2a Sf301
[click here to link in coliBASE]).
Seminary operations are performed to the other three tRNA gene
tRNAcc/input_data/NC_004431_tRNA.dat,
tRNAcc/input_data/NC_002655_tRNA.dat
tRNAcc/input_data/NC_004337_tRNA.dat.
files:
and
(3) Run the program Run_IdentifyIsland to find the islands associated the non-tRNA sites.
(4) Manually analyse the resulting islands for distinct genome subsets to improve prediction of
island boundaries with the aid of the program TabulateIsland. Consequently, the file GIfound_checked.dat is generated with a text editor.
(5) Make multi-FASTA files containing the 2-kb UF and DF regions for each non-tRNA site using
ExtractFlank with the ‘-h’ option. Unlike the UF regions for the tRNA sites, the 2-kb UF regions
selected for these non-tRNA hotspots contained the corresponding gene itself. The batch file
Run_ExtractFlank should be changed as the following:
ExtractFlank -h tRNA-being-analysed.dat genome-being-compared_4.dat GI-found_checked.dat
(6) Design specific primer pairs for each non-tRNA site based on consensus regions of UF and DF
by using Primaclade with the input of ClustalW-derived multiple sequence alignment files.
31