1
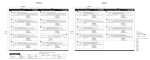
China Geo-Explorer User’s Guide China Data Center University of Michigan Ann Arbor, MI 48104-1690 Tel: (734)647-9610 Fax: (734)763-0335 Email: [email protected] Web: http://www.chinadatacenter.org / http://chinadataonline.org October 7, 2011 TABLE OF CONTENTS Introduction ..........................................................................................................................................................3 1. System Interface .............................................................................................................................................5 2. Administrative Units.....................................................................................................................................6 2.1 Region Selection......................................................................................................................................6 2.1.1 Administrative Units Selection by Toolbar .........................................................................6 2.1.2 Administrative Units Selection by Menu bar ......................................................................8 2.2 Report generation ............................................................................................................................... 12 3. 2.2.1 Statistical Reports ................................................................................................................ 13 2.2.2 GIS Map Generation ............................................................................................................ 25 X&Y Location............................................................................................................................................ 27 3.1Region Selection .................................................................................................................................... 27 3.1.1 Region Selection by Menu Bar ............................................................................................... 28 3.1.2 3.2 4. 5. Region Selection By Toolbar ........................................................................................... 30 Reports .............................................................................................................................................. 30 Time series................................................................................................................................................ 31 4.1 Chart ................................................................................................................................................... 31 4.2 Report ................................................................................................................................................ 35 Establishments ........................................................................................................................................ 38 5.1 Location Selection by Menu ............................................................................................................ 38 5.1.1 Simple Search ........................................................................................................................ 38 5.1.2 Advanced Search .................................................................................................................. 41 5.2 Location Selection By Toolbar ....................................................................................................... 42 6. Theme Maps .................................................................................................................................................. 43 2 INTRODUCTION China Geo-Explorer, an intelligence spatial data service, is offered by the University of Michigan China Data Center, in collaboration with the All China Market Research Co., Ltd and the State Key Laboratory for Information Engineering in Surveying, Mapping and Remote Sensing (LIESMARS) of Wuhan University. It offers China demographic and economic data, maps, charts and reports in the web-based delivery system. With this spatial intelligence, users are able to make rapid, accurate spatial decisions with greater confidence for regional planning, business investment, population, housing, environmental assessment, public health and many other spatial applications. Data sources in this database includes demographic and business information for all PRC geographies, including 31 Provinces, 345 Prefecture Cities, 2,873 Counties, and over 50,000 Townships. The features of this online service include: Efficient data integration for spatial, non-spatial data and text data Flexible data selection by administrative units, locations, and spatial ranges Intelligent location analysis and spatial assessment Quick identification of spatial patterns and space-time trends Time-saving, easy-to-use, and customized reports Dynamic charts, tables and maps Multiple options of data export to PDF, Excel, Word, or GIS Shape files The primary China data sources for this online data service include: China 2000 Province Population Census Data with GIS Maps China 2000 County Population Census Data with GIS Maps China 2000 Township Population Census Data with GIS Maps 3 China Population GRID Data with Township Boundary Maps China Historical County Population Census Data with GIS Maps China 1995 Industrial Census Data with GIS Maps (province, city, county, ZIP code) China 2001 Basic Unit Census Data with GIS Maps (province, city, county, ZIP code) China 2004 Economic Census Data with ZIP Maps (province, city, county, ZIP code) China Province, City and County Statistical Indicators with Maps Various geographic and environmental GIS maps The basic GIS maps included: Province boundary maps Prefecture city boundary GIS maps County/District boundary GIS maps Approximate township boundary GIS maps One sq km GRID GIS maps Various point GIS maps 4 1. SYSTEM INTERFACE The interface of China Geo-Explorer (CGE) is primarily composed of two frames: Menu bar on the left side and Map bar on the right side. Figure 1. The Main Interface on China Geo-Explorer The right side is a map window (Part A) which shows the selected areas of the current map layer. Users can use the navigation and sliders in the Part A to pan, zoom in or zoom out the map. The top toolbar (Part B) allows several options for map display and spatial data selection. The left side is a menu window. The top toolbar (Part D) allows users to switch the interface language between Chinese and English. The Menu bar (Part C) offers various functions for data selection, report selection, and data export. In Part B, the Map Operation provides a toolbar with several buttons: From the left to right, the function of each icon shows below: 5 Hide the Menu bar Pan Button Zoom In button Zoom Out button Query by Point Query by Rectangle Query by Circle Query by Polygon Clear Query Shapes. The left Menu bar (Part C) provides several options for data selection and map display, which include Administrative Unit, X&Y Location, Time Series, Establishment, and Theme Map. 2. ADMINISTRATIVE UNITS In Administrative Units menu, users can generate variety of reports and GIS maps based on the selection of Administrative units. 2.1 REGION SELECTION 2.1.1 ADMINISTRATIVE UNITS SELECTION BY TOOLBAR The first step is to fix the regional level by selecting from the pull down list in Part A (Figure 2). CGE provides 4 classes of administrative level: Province, premature City, County and Township. After setting the region level, the selection can be made by using the query buttons in toolbar (Part B). In Figure 2, using the 6 Circle Query button in Part B and drawing a circle in the map layer, we could observe that the selected regions will turn to pink in the map and the name of the regions will show in the Selection frame in Menu window (Figure 3). Figure 2. The Administrative Units selection using the polygon icon with province level in toolbar. 7 Figure 3. The Result of Selection Made by Circle Query in Toolbar. It should be noticed that by using the Query by Point icon, selection could be made by single clicking on certain administrative unit. De-selection could be made by clicking the selected units for second time. 2.1.2 ADMINISTRATIVE UNITS SELECTION BY MENU BAR Users also can select the administrative units in Menu bar. The Menu bar can be divided into four parts as follows: 8 Figure 4. The Menu bar in Administrative Unit. Part A is Selection Mode which includes Single group mode(default) and Multi-groups mode. Part B is the Regional Level menu where users can switch regional level selection by using the pull-down list. Part C lists all the units corresponding to the regional level in Part B. Each selection could be made by either double clicking the name in the list or single click and then click the Add button.What’s more, users can make multi-selection by pressing Shift or Ctrl when selecting. When clicking Add All button, all the items in Part C will be added to the selection result. The selection result will be displayed in the Selection Frame ( Part D). Single click some items in the list, the corresponding locations will be poited out on the map. Items in Part D could be removed by clicking the Remove button. The list will be cleared by clicking the Clear button. 9 In the single group mode, all the selection methods have been covered above. However, if switched to the multi-group, there will be some changes in the Menu bar (Figure5 Part A). Users could either use menu or the toolbar to make selection included in the first group. After fixed the first group, click the Add group button to add a second group where next region slections will be added to. One group could be removed by clicking the Group title and clicking the Delete group button. Figure 5. Menu bar in Multi-group mode under Administrative Unit selection. The Group By Index button will help the users to divide the groups by certain index. After selecting the regional units and clicking the Group By Index button,a new dialog shows below: 10 Figure 6. The Group by Index function dialogue in Multi group Mode. In Part A(Figure 6), it shows all the indexes subscribed in four categories: 2000 Census, Economic Census 2004. Industrial Census 1995, and Landuse data, where included more than thansounds specific indexes users can make selection from. In Part B, first row called Number of Classification, which means how many groups you desired to divide your selected area into.Classification Method provides three different methods for divition : Equal Interval, Quantile and Standard Deviation.Color Ramp could be used to change color for your layout map. After selection, all the information will show on Part C. In Part C, the lightest color shows the area in the lowest rank which are assigned to group 1.The Classification column gives a range of each group based on selected index. Districts on the right shows the name of group members with the data laying within the range. In Part D, it provides a select box to decide whether or not to exclude the group without any unit laying in. After everthing is settled, click Confirm in Part E, the groups are automatically divided based on the specific index. The group setting options are editable by using the Part B in Figure5. The current layer map could be exported by using the Map Export (Figure 5 part C). When click the Map Export button, a new dialogue will show as following: 11 Figure 7. The Map Export Dialogue in Administrative Unit. With clicking all the boxes in the dialogue, here will be a map shown in PDF format (also could be exported in JPG format by choosing from Export Type pull down menu) as the following: Figure 8. The Map Export with Multi-groups selection mode. 2.2 REPORT GENERATION After selecting the regions, next steps are selecting desired variables and generating the reports or the maps. Reports and maps could be finally exported 12 in the ideal format. By clicking Report button at the top of the Menu bar, we can enter the main interface of report generation. 2.2.1 STATISTICAL REPORTS Statistical Report provides two broad categories of reports: Pre-defined Report and Customized Report, which users could generate report with designed methodology or with specific indexes. Pre-defined Reports Report list provides three methods to generate the report: Summary Report, Compare Report and Original Report. Hundreds of reports could be generated with each methodology. Figure 9. The Menu bar for Statistical In Figure 9, users can select report type and the specific index by clicking the Report. triangle in the front in Part A. In Part B, by clicking the box in the front, users can choose whether to include the map in the report or not. Part C will show the details about user’s selection. 13 After choosing the indexes, click the Repot button on the top, the required report could be generated. Click Back to Selection button, menu page could be returned back to administrative units selection. Single group mode Summary Report When the selection mode is single group, all the selections made will be summarized into a single group and calculated the gross and subtotal for each range. For example, if Henan and Hebei are selected in a single group mode under the province as the administrative level, and then hit the Report button, select the “Age Summary Report” as the report in interested, click the Report button on the top again, then a new dialogue will show as below: Figure 10. The Summary Report in Single Group Selection Mode (Henan and Hebei in province level). In figure 10 Part A, from left to right, the function of each button is shown: Turn to next/previous page. 14 Export the report to a new HTML web page Export the current report in the PDF/Excel/ RTF or ODT format and save in the local disk. Part B is the title part which indicates the contents about your selections. In Part C, the total population in the two provinces was summed up and shown with total number in each gender as well. In Part C, by the characteristic of data in census, age was divided into groups with range=4, and the subtotal of two provincial population in each age group shown in the list. Compare report In compare report, instead of sum-up the data in all selections, it will provide the data comparison among all the selections. We still use the Henan and Hebei as example. When regions are selected, click the Report button and choose the index from the list in compare report (Age detail comparison for example), then the new dialogue will show in Figure 11. Part A owns the same function as in the summary report (Figure 10.Part A). Part B also shows the basic content about your selection. However, in Part C, you can observe that instead of giving the summary data in two provinces, it provides the counts and the percentage of each age group, which is convenient to compare the weight of each age group between the two provinces. 15 Figure 11. The Comparison Report from Single Group Selection Mode. Original Report The basic function of original report is to provide the original data statistics in each selection region and display them in descending order with marked rank number. We still use Henan and Hebei as example. After clicking the report button and then choosing Age report in Original Report list, a new report will be generated and shown as below: Figure 12. The Rank Report from Single Group Selection Mode. 16 The function in Part A is also the same as introduced in Summary report. However, in Part B, the raw data are listed in each age group and the ranks are ordered by the total population. Multi-groups Mode: When selections are divided into groups, the report is extended by including the All Groups Report, Sub-group Report, which each of them can generate the summary report, comparison report and original report respectively. Here we use two groups, with Shandong and Shanxi in group1 and Henan and Hebei in group 2, to illustrate the function and content in each type of report. All Groups Reports When select the report listed in the summary report, and then click the All Groups Reports button at the top of the Menu bar, the report is generated is the same as the one generated in summary report from single group. Because the Summary report in All Groups Reports will add up the counts regardless of the groups. When the comparison report is selected and then click the All Groups Reports button at the top of the Menu bar, the report is generated by comparison the total counts between the two groups. In our example, if the Age Detail Comparison report is chosen and then click the All Groups Report button, the content of report will be shown in Figure 13. As the table showing, the comparison is processed between the two groups, which each group contains two provinces. 17 Figure 13. The Comparison Report of All Group with Multigroup Selection Mode When select the original report and then click All Groups Report, the report will give the original group sum-up data and the rank the group by the group’s total counts. In our example, when choose the Age report and click the All Groups Report, the content of the report will be shown as below: Figure 14. The Rank Report of All Groups with Multi-group Selection Mode The total value of the group is used as the unit for ranking in descending order. 18 Sub-group Report Sub-group report intends to generate the report reflecting the relationship within each group. The same selection in regional level and report type is employed here as the example. When select the “Age Detail Summary Report” in summary report list, then click the Sub-group Report button, the report dialogue will be shown as below: Figure 15. The Summary Report from Sub-group Report with Multi-group Mode. In the sub group summary report, the total value of each group will be separated summed up and reported in distinct pages. Here, the circles in Part A show the differences from the All Groups Report. Use the pull down list in the right circle to switch the page for another group’s report. Use the Export button (right circle), the current page (report of group 1) will be exported, or use the Export All Groups button to export the report containing the individual reports of all groups. Part B shows the summary report generated from the members in group1. Group2 summary report will be shown as the page switched. In comparison sub-group report, the comparison will be progressed among the members within each group, and different groups’ comparison report will be 19 separately shown on different pages. Using the ‘Age Detail Comparison’ report in Sub-group Report, the report can be generated as following: Figure 16. The Comparison Report from Sub-group Report with Multi-group Mode. The current table shows the comparison within the members in group 1(comparison of the age in different age groups between Shandong and Shanxi). The detail operation is the same as summary Sub-group report (last paragraph in page 17 as reference). The original Sub-group report is also to rank the members by index within each group, and different group’s original report will show on separate pages. The operation is the same as Summary Sub Group report. In our example, “Age Report” under the original sub-group report could be generated and shown as following: 20 Figure 17. The Rank Report from Sub-group Report with Multi-group Mode. Customized Report Report from more specific index could also be generated using the customized report. Single Group Mode: After selected the regional levels in a single group mode and then click the Report button. Click the Customize button (right circle in the Figure18), shown as Figure 19: Figure 18 Customized Report Button in the Menu bar 21 Figure 19. The Dialogue to Select Indexes in the Customized Report with Single Group Selection Mode. In Part A, users could select the report type which defined as the same in pre-defined report. In Part B, a Report Name should be entered in the blank. In Part C, users could select the index of the report by using different genre of the Census. There are more than hundreds of indexes under each genre which could be used as variables for each type of report. Multiple indexes on the same report is allowed with30 indexes as the maximum number. After all the variables are selected, click the Report button in Part D, a customized report will be generated. In our example, instead of learning the general information about the population level in each age group in Henan and Hebei, the more specific indexes as the population of age15-64 and the percentage of the age range. Now the procedure of the operation should follow as: Click Summary Report Input Report Name Select the “Population from Age 15 to age 64” and “Percentage of Population from Age 15 to age 64” two indexes under “Age Composition Information of 2000 Population Census data” in 2000CensusClick Report: 22 Figure 20. Two Indexes Selected for Generating Customized Report. The customized report will show as following: Figure 21. The Customized Report from the Two Selected Indexes. The report could also be displayed in HTML and exported in official format. 23 Multi-group Mode When the selections are divided into multiple groups, the customized report could also be generated with the type of All Group report and Sub-group report, which are the same as definition in the pre-defined report. In the example, Shandong and Shanxi are in group 1 and Henan and Hebei are in group two, with the same indexes set as single group customized report. The dialogue of variable selection should be as following: Figure 22. The Dialogue to Select Indexes in the Customized Report with Multi-group selection mode. Use All-groups Report button or Sub-group Report button at the bottom to switch the method to generate the reports. The result will show as: 24 Figure 23. The Customized Summary Report from All group Report Figure 24. The Customized Summary Report from Sub-group Report. 2.2.2 GIS MAP GENERATION The GIS map export function could help to generate the file include the shp file, projection file, the excel table, shx file and other necessary files that could be used as the base map in ArcGIS software for further procession. After selecting all the administrative units, click the GIS Map Export button (Figure25): 25 Figure25.The GIS Map Export Button in Menu bar. A new dialogue for index selection will be shown as following: Figure 26. The Dialogue in GIS Map Index Selection. Select the same indexes as before, and then click the GIS Map Export button at the bottom, the GIS map could be saved in the local disk as: 26 Figure 27. The Local Disk Saving Dialogue for GIS Map Export. Save the file and extract from the zip file to a new folder, the content in the GIS file could be imported into ArcGIS for further simulation. Figure 28. The Content in the GIS Map File. 3. X&Y LOCATION Region could also be specified using the X&Y Location. When you access to the interface of X&Y Location, the region could be added by inputting the latitude and longitude, selecting from the map or menu, or uploading the file with the scale. The preferred report will be derived by using the Report button.GIS map could be generated by GIS Map Export button. 3.1REGION SELECTION 27 3.1.1 REGION SELECTION BY MENU BAR Figure 29. The Menu bar in X&Y Location In Part A, the left boxes are provided to edit the position by entering its name, latitude and longitude and click the Add button. After this, the position information will be displayed in the right list. For those positions already added to the right list, when users select one and then click the Edit button, the selected position will be moved to the information after editing will show left boxes for editing. Then press Add button, the on the right list again. The selected position will be removed from the list by clicking the Delete button. When click the Clear button, all the information will be removed from the list. In Part B, users who are not familiar with the longitude and latitude can select the position from the list of administrative units provided. The layers include Province, Prefecture city, County and Zip point. When the Zip point layer 28 is selected, the search box beside the layer selection slide provides a keyword search function .After double clicking or using Add button, the position will be selected and showed in the right box in Part B with corresponding attributes. On the other hand, when the layer is selected in Part B, the current layer map will automatically show on the right hand, with each point standing for each unit. By clicking the point on the map, the position will be added and shown in the list (Part A). Location selection can be implemented by uploading position files. Click the Upload button (Part C), then users can upload local files whose form must be txt, and content is position information. Each line describes a position which contains name, latitude and longitude. One example is as follows: coordinate1, 116.90, 28.24 coordinate2, 114.60, 28.96 coordinate3, 115.22, 26.09 After selecting the points, the range in Part D provides the function to acquire the circumstances of surroundings. Units option in Part A has two items: Miles and Kilometer. Range can be set by yourself, and its default value are 1, 3, 5, which means the corresponding data ,which are summarized within the range of the three concentric circles with all the selection points as the center and radius of 1mile, 3 miles and 5 miles respectively, will be included in the report as a variable. When all the options are fixed, the map with all selected points and their surrounding circles will show as below: Figure 30. The Three Concentric Circles of Each Selection Point. 29 3.1.2 REGION SELECTION BY TOOLBAR The location can also be selected via Toolbar. However, only the Query by Point icon is eligible in X-Y location interface. After single clicking on the desired location, the responding name, longitude and latitude information will automatically show on the right side box of Part A in Menu bar ( Figure31) : Figure 31. Region Selection by Toolbar on the Map. All the information of the selected point on the map will be automatically shown in Part A and the radius of three concentric circles could be edited in Part B. 3.2 REPORTS The methods of report generation keep consistent with the section 2.2. However, there are some changes should be noticed. There is no multi-group selection mode in X-Y location report. All the selections will be treated as a single group for report generation. In summary report, all the data including the counts within the three concentric circles around each selection will also be summed up to the total. In comparison report, the new variables called 1mile, 3 mile, 5 mile (by default) ,which are the data for the three concentric circles, will be included in the report ( as the Figure 36): 30 Figure32. The Comparison Report Generated in X-Y location. In the original report, the ranks are given to all the regions include the three circles around each selection. Figure 33. The Rank Report Generated in X-Y Location. 4. TIME SERIES TIME SERIES PROVIDES THE VARIETY OF REPORTS AND CHARTS THAT MAINLY FOCUSED ON THE DEVELOPMENT TRENDS OVER A DEFINED TIME PERIOD IN A CERTAIN INDUSTRY. WHEN ACCESS TO THE TIMES SERIES PAGE, USERS COULD CHOOSE CHARTS OR REPORTS ON THE TOP OF MENU BAR. 4.1 CHART The Charts are generated by observation database which contains Province Statistics, City Statistics, County Statistics and Hydrological Observations. 31 Figure 34. The Menu bar in Charts Function in Time Series. After selected from the certain regional level statistics, the regional selection is restricted to the corresponding level of administrative unit. Taking the statistics of Gross Domestics Product in Province Statistics as the example, the interface will show as below, In Part A, when you pull down the variable list of each category of statistics, you can select indexes you are interested in the Index list or de-select the index with clicking the countermark in the box in front of the index label. In Part B, users can select the interested position in the observation list. The points could also be selected via Query by Point icon on the Map layer. When select one item in the Observation list or by clicking the map layer, then statistical charts about the index will be generated and the geographic information will display in the right map at the same time. In Part C, Click the Hide Layer button, the observation data in the map will disappear. 32 Figure 35. The Index Selection in Menu bar of Charts. The result shows in Figure 36. Figure 36. The Chart Generated from Selected Indexes. 33 Figure 37 gives a close illustration about the Chart generated by using the “Gross Domestic Products” as the index in Zhejiang province. Figure 37. The Chart of Gross Domestic Products in Zhejiang Province from 1999 to 2008. The icons from Part A have the function (from left to right): : Switch the unit of displaying from Year to Month. : Narrow down the time range to recent years. : Narrow down the time range by selecting the Start Year and Month and End Year and Month. : Export the current chart to a new HTML page. 34 4.2 REPORT CGE has the function of generating reports with time series data. Clicking Report button, the Menu bar will display as follows (Figure 38): Figure 38. The Menu bar in Report Function of Time Series For Region selection in Part A, the selection method is similar to 2.2, where could give further reference. All the selections will be shown in the Selection frame in Part B .For Spatial lagged variables (Part C), the default value is 1000miles. This variable means to include the summary data within the circle whose radius equal to 1000miles as a new variable with the name X_w in the report table Next step is index selection. After switch to Index tab, users could select the variables index in the list. All the selected variables will show in the box below. The selected variable could be removed by Remove button, or use Clear button to clear the whole list. The interface shows as below. 35 The third step is to select desired time period. When switch to the Years tab, users could select the year by double clicking on the number or by using the Add button. In the same way, use Remove button to remove unwanted selections and use Clear button to clear the whole list. The Figure43 shows the year selection as below: Figure 39. Indexes Selection In Time Series Report After settingFunction. the indexes of district, ratio and time, click Data Export, then there will be a statistic report displaying as below: Figure 40. Years Selection In Time Series Report Function. 36 Figure 41. The Report Generated in Time Series. In Part A, users can use the search pull down list to select the certain category and input the keyword in the right box for quick searching certain variale. After typing, the relevant information will show in the table in Part D. In Part B, the Display In HTML button can display the table in a new web page with better resolution. The report can export in format of PDF, Excel, ODT and RTF by choosing from the pull down list in Part C. By choosing any file type, a new dialog will give the message of saving the file to local disk. The exported PDF format report is shown as follows: Figure 42.The PDF File Exported in the Time Series Report Function. 37 5. ESTABLISHMENTS The Establishments page will give a detailed list of the industries in a customized location and time period. It can also generate the charts with either the counts of the new establishment for each year or the cumulative counts for a period. 5.1 LOCATION SELECTION BY MENU When you access to the Establishment interface, choose the Selection option on the top of the menu, then you have two choices for selection: Simple Search (default) and Advanced Search. For customers with the zip code information, Simple Search is a convenient method. If not, using the Advanced Search, customer can provide broader information and CGE could help to narrow down. 5.1.1 SIMPLE SEARCH Figure 43. Simple Search In Estibalishment. In the Simple Search option, users could type in the zip code in the search box and click search button, then the Menu bar should show as below: 38 Figure 44. The Establishment Simple Search result for Zip code 250014. In Part A, users can use the pull down list to narrow down the industries they focused on, and the Number of Establishment will automatically adjust to the total counts in your selected industries located in the zip code. Users could also return to search menu by clicking the Back To Search button. InPart B, it lists all the names of establishment in your selected industries. Further information about each enterprise could be acquired by clicking the name in the list. Finished selection of the industries, users could use the Plot from Starting Year button in Part C to obtain the time series chart. The zip code typed in will show in Part D. The list could also be exported in an Excel format by clicking the button in Part E and then save it to local disk. When click the name of each establishment in the list, a new dialog will show as below: 39 Figure 45. The Dialogue with Detailed Information of Establishment. Figure 45. provides a basic information about the establishment. Users could also use the three search engine: Google, Baidu and Wanfang Data which are located at the buttom of the dialog, to process a more detailed search. When click the Plot of Starting Year in Part C(Figure 44), a new dialog will show as below: Figure 46. Plot of Number of Establishemt within Selected Region. In Figure46, users can switch the plot from the counts of the new establishment in each year to the counts of cumulative establishment until the time point by click the dot in Part A. In Part B, users could select Start year and 40 End year to restrict the range of the plot by choosing from the pull down list. The Export button can be used to export the chart to a new HTML page in PDF format and users could download or print the plot from the exported page. 5.1.2 ADVANCED SEARCH In Advanced Search, the location can be searched out by providing more general information. When invoked the Advanced Search tab, the Menu bar shows as below: Figure 47. The Advanced Search Menu in Establishment. From province on the top to township at the bottom, all the rows provide the pull down lists to select. Avoiding of too fuzzy range, at least the information above the township should be provided .You could also directly input the Zip code or the name of establishment into the boxes below. When fixed the entire input and clicking Search, the whole list of establishments will show in the Menu bar. In Figure51, the list is generated by choosing Shandong in Province, Jinan in City, and Shizhong in County in the Advanced Search page (Figure 48). 41 Figure 48. The Establishment Search Result within Shandong Province, Jinan City, Shizhong County. If the selection is approximate to the simple selection, the search result in the Menu bar should be approximately the same 5.2 LOCATION SELECTION BY TOOLBAR Selection from the map is also accessible by using the toolbar. As the default of location should be more specific, the Regional Level selection pull-down list and the Polygon selection icon are grey out (Figure 49). By single clicking some points or drawing some shape on the map, the establishments contain in the selected area will automatically shows in the list on the Menu bar. It should be noticed that no more than 20 zip code points should be selected at once. After selection, the list of establishment is the same with the menu selection (Figure 48). 42 Figure49. The Location Selection in Establishment via Query by Point Icon in Toolbar on Map. 6. THEME MAPS CGE is geared to generate the spatial distribution map with certain index. In the Theme Map, the thematic layer map could be generated to represent distinctive classifications which attribute to your selected index. After accessed to Theme Map page, the Menu bar show in Figure 50. In Part A, the pull down list is provided to select the regional level as the unit for classification. Users could choose the index from all the Census lists in the lower box in Part A. Part B provides the options to modify the Theme Map with desired method of classification. After selecting certain index in the list in Part A, the Theme name in Part B will automatically be filled. However, users could edit the name by re-typing it in. Users could also change the number of classes from the pull down list in “Number of Classification”. Classification Method provides three methods used to calculate the range of each class: Equal interval, Quantile, Standard Deviation. Color Ramp offers candidate colors for the Theme map layers. Transparency slides could be used to adjust the transparency. When all the index and methods are fixed, the bottom table in Part C will give detail information about the range of each class showing in Figure 51. 43 Figure 50. The Menu Bar in the Theme Map Figure 51. The Detailed Information of Each Class with the Index” Totalunits95_Total Industrial Units” 44 Single clicking each color icon in the color column in Part C could change the color from the default. As the operations changed, the map on the right hand side is continuously updated. Figure 52. The Theme Map Generated by Selected Index. The right rectangle on Figure52 shows the options of the layers on the map. By clicking the box under Theme Layer List, the map will return to the original one with no layer created based on the chosen indexes. By de-selecting the Open Street Map under Basic Layer List, the bottom street map will be hided. By de-selecting anyone under the Reference Layer List, the corresponding layer will be concealed. After all the index and methods fixed, click Map Export button in Part D (Figure50), the Theme Map will be exported into a new PDF or JPG file and could be saved in the local disk. The Theme map could be used as a basic layer for further operation. For example, after creating the theme map, and then switching to the Administrative Unit for location selection and report generation, the map window will still save the theme layer as current map where all selection methods are also available , which is convenient to be set as a selection reference. 45