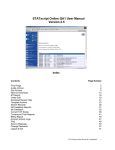
1
LiveSTATS.XSP User Guide for ISP Clients
LiveSTATS.XSP delivers your web site statistics through a full suite of rich and interactive
reports. This guide was created specifically for users who access their LiveSTATS.XSP
reports through their Internet Service Provider (ISP) or Web Host. This user guide shows
you how to get started with locating popular statistics and looks at many of the features in
LiveSTATS.XSP that help you get the most out of your web site reports.
Welcome to LiveSTATS.XSP! .................................................................
page 2
Logging in to your Reports ..............................................................
page 2
Key Areas of LiveSTATS.XSP ............................................................ page 3
List of Reports and Report Groups ................................................... page 4
Selecting a Report ................................................................................
page 6
Selecting a Report Period ................................................................
page 6
Comparing Report Periods ............................................................... page 8
Refreshing Statistics ........................................................................ page 9
Report Help .....................................................................................
page 9
Getting Started with your Statistics ...................................................... page 10
How many visits have people made to your site? ............................
page 10
Which web pages are most popular? ...............................................
page 11
Where in the world are your visitors located? ................................
page 12
What’s the Bounce Rate of your home page? ..................................
page 13
Report Options ...................................................................................... page 15
Options Icon .................................................................................... page 15
Display Name ..................................................................................
page 16
More Icon ........................................................................................
page 16
Keyword Filter ................................................................................. page 16
List Size ........................................................................................... page 17
Columns/Graphs .............................................................................
page 17
Downloading a Report ..........................................................................
page 18
Printing a Report .............................................................................
page 18
Emailing a Report ............................................................................
page 19
Exporting a Report ..........................................................................
page 20
Logging Out ..........................................................................................
page 21
Welcome to LiveSTATS.XSP!
LiveSTATS.XSP delivers your web site statistics through a full suite of rich and interactive
reports. With LiveSTATS.XSP, you’ll have access to key statistics on the visits made to your
web site.
This guide was created specifically for users who access their LiveSTATS.XSP reports
through their Internet Service Provider (ISP) or Web Host. The guide looks at many of the
features in the reports that help you get the most out of your web site statistics. We’ve
also included a section to help you get started with locating some popular stats. Welcome
to LiveSTATS.XSP!
Logging in to your Reports
1. Open a web browser on your computer.
Your reports can be viewed from any computer running a frames-enabled web
browser and with a connection to the Internet. The web browser should be
Microsoft® Internet Explorer 6 or later, Safari 2.0 on Mac OS X, or FireFox 1.04
or later.
2. In the Address box (Figure 1), type the web address of LiveSTATS.XSP that your ISP
sent to you and press Enter.
Figure 1: Launching the LiveSTATS.XSP Login dialog.
3. The LiveSTATS.XSP login dialog (Figure 2) will open. Enter the login fields sent to you
by your ISP. The fields are explained in the table below.
Figure 2: The LiveSTATS.XSP Login dialog.
www.deepmetrix.com
2
The LiveSTATS.XSP Login Dialog Fields (Figure 2)
Type the domain of your web site.
Server Domain
User Name
e.g. www.crazyslippers.com
Type the name of your User Account sent to you by your
ISP.
Please note that the User Name is case-sensitive.
Type the Password sent to you by your ISP.
Password
Please note that the Password is case-sensitive.
3. Click the Login button.
Key Areas of LiveSTATS.XSP
When launched, LiveSTATS.XSP will open to the Page Views report. Key areas of the
LiveSTATS.XSP interface (Figure 3) are described in the table below.
Figure 3: Key Areas of LiveSTATS.XSP.
www.deepmetrix.com
3
Feature
Description
Reports Tab
• Displays the list of reports and report groups.
Please see the Reports and Report Groups section for
more information.
• Displays a report description, suggested benefits,
options, and notes.
Help Tab
Please see the Report Help section for more information.
• Lets you select the report period by day, week, or month
of historical data.
• Allows you to compare two different report periods.
• Displays a historical breakdown of statistics.
Calendar
Please see the Selecting a Report Period section.
• Depending on the report selected, settings in this area
allow you to customize the report.
Report Settings
Please see the information in the Report Options section.
Menu Bar
• Provides options to Refresh, Print, Email, and Export
reports and Logout of the interface.
Report
• Displays the selected report.
Stock Ticker
•
Shows the number of active visitors, total visits, page
views, and most viewed page for the current day, week,
and month.
List of Reports and Report Groups
LiveSTATS.XSP includes over 30 web site statistics reports in six report groups:
Group
Description
Live Statistics
The Who’s On report shows the IP, Company/ISP name,
time spent, and location of current visitors to your site.
Traffic and Activity
This report group shows traffic units for visits, hits, page views,
downloads, etc. Averages, Forecasts and comparisons with
the last like report period are also reported.
•
•
•
•
•
•
•
•
•
www.deepmetrix.com
Traffic and Activity Summary
Visits
Visits by Cookie
Hits
Page Views
Bandwidth
Downloads
Page Views per Visit
Time Spent per Visit
4
Pages and Content
This group shows statistics for pages such as which pages were
requested most often, which pages were the most common
entry and exit points, which pages were most commonly the
only page viewed for a visit, etc.
•
•
•
•
•
•
•
•
•
•
Visitor Info
This report group reveals which browsers, operating systems,
and languages were used by people when visiting your site.
Also included is a report on visits from automated web site
crawlers.
•
•
•
•
•
Referrals
Visitor Info Summary
Browser Types
Browser Operating Systems
Visitor Languages
Web Site Crawlers
This group shows which sites, search engines, key words and
key word phrases referred visitors to your web site.
•
•
•
•
•
•
Geographic Info
Pages and Content Summary
Pages
Entry Pages
Exit Pages
Page Viewed Once
Time Spent per Page
Bad Requests
Content Groups
Media & Downloads
File Extensions
Referrals Summary
Referring Domains
Referring URLs
Search Engines
Search Phrases
Search Phrases by Search Engine
The reports in this group show where your visitors come from
and also reports visits by the visitor’s company or ISP name.
•
•
•
•
•
•
•
•
•
Geographic Info Summary
Continent Breakdown
North American Countries
South American Countries
European Countries
Oceanic Countries
Asian Countries
African Countries
Company or ISP
Depending on your ISP, some of the reports listed above may not be available for your web
site.
www.deepmetrix.com
5
Selecting a Report
The Reports tab on the left of the interface lists all the reports by Report Group.
To display a report:
1. Click the Reports tab (
in Figure 4).
2. Expand the group (click the
Figure 4).
icon) that contains the report you want to see (
3. Select the report/report view from the list (
in
in Figure 4).
Figure 4: The Reports tab.
Selecting a Report Period
The Calendar Graph (Figure 5) at the top of the reports provides both a historical
breakdown of the report to help you spot trends in your site traffic as well as a quick means
to select a report period.
Depending on how much historical data is available for your web site, the calendar will
display an activity breakdown for up to 1 year (12 months) of historical data. The calendar
is separated into months ( in Figure 5), weeks ( in Figure 5), and days ( in Figure 5).
www.deepmetrix.com
6
LiveSTATS.XSP can generate reports for any day, week, or month displayed.
If you want to minimize the calendar so that more space is available for the report, click the
Hide Calendar icon ( ) in the upper right corner of the calendar ( in Figure 5).
When LiveSTATS.XSP is launched, the default report period is the current week. You can
select a different report period by using the calendar. LiveSTATS.XSP will use the selected
report period for every report until you select a new date.
Figure 5: The Calendar Graph.
Mousing over a day, week, or month will display statistics for that time. Click the forward
(>) and back (<) arrows to move through the calendar. For example, clicking the back
arrow once beside the weeks ( in Figure 5) will move the calendar one previous week.
Double-clicking the arrow will move the calendar to the beginning of historical data. Clicking
the back arrow and holding down the mouse will move the calendar until released.
Double-clicking the back arrow (<) will move the calendar to the first day of data in the
calendar. Double-clicking the forward arrow (>) will move the calendar to the most recent
day of data.
To select a report period, click on the day, week, or month. The selected report period is
displayed in a lighter blue color ( in Figure 5).
To Select a Day, Week, or Month on the Calendar Graph
Click the day from the
calendar.
Day
Days are numbered below
the graph. A mouse over will
show the day of the week as
well as statistics for that day.
Click the < arrow to display
previous days or click the >
arrow to display later days.
www.deepmetrix.com
7
Click the week on the
calendar.
Week
A mouse over will show the
date for the week as well as
statistics for that week.
Click the < arrow to display
previous weeks or click the >
arrow to display later weeks.
Click the month on the
calendar.
Month
Months are labeled above
the graph. A mouse over
will show statistics for that
month.
Click the < arrow to display
previous months or click
the > arrow to display later
months.
Comparing Report Periods
LiveSTATS.XSP also enables you to compare two different report periods of the same report.
For example, you can compare Page Views for the Week of March 20, 2005 with the Week
of March 27th, 2005.
1. Simply click
Select Comparison Date (
in Figure 5) at the top of the calendar.
Figure 6: Selecting a date comparison in the Calendar Graph.
2. Select the date to compare (
www.deepmetrix.com
in Figure 6).
8
Figure 7: A date comparison in the Calendar Graph.
3. The selected report period will be displayed in a lighter blue color ( in Figure 7) and
the comparison report period will be displayed in orange ( in Figure 7). To remove a
comparison, click Cancel Date Comparison at the top of the calendar ( in Figure
7).
Refreshing Statistics
When viewing a report for a current report period (e.g. current day, current week, or
current month), click the Refresh button on the Menu Bar ( in Figure 8) to regenerate
statistics for the report.
Figure 8: Refreshing a Report.
Report Help
To see information on the statistics provided by a particular report, click the Help tab (
in Figure 9). This tab displays a brief report description, suggested benefits, options, and
notes for the selected report.
Click a Help Topic link (
in Figure 9) to quickly move to a specific help section.
The Report Columns section provides a description of statistics displayed in each column
of the report.
www.deepmetrix.com
9
Figure 9: The Help tab.
Getting Started with your Statistics
How many visits have people made to your site?
At the core of web analysis is tracking how many visits your site receives. This is probably
the first web site statistic you will want to see and one you will want to track daily.
In LiveSTATS.XSP, a Visit is recorded each time someone lands on your web site. One Visit
can contain one or more Page Views.
This key metric can be determined by looking at the Visits report (Figure 10).
Viewing the Statistics
To determine the total number of distinct visits to your web site:
1. Select the Reports tab.
2. Expand the Traffic and Activity group (click the
www.deepmetrix.com
icon).
10
3. Select the Visits report.
4. The Total Visits column will display the number of distinct visits to your web site
during each time period ( in Figure 10). The number at the bottom of the column
will display the total number of visits for the selected report period ( in Figure 10).
For example, people made 967 distinct visits to the Crazy Slippers web site on
Tuesday. There was a total of 4,732 visits to the site during the week.
Figure 10: Tabular statistics in the Visits report.
Which web pages are most popular?
The Page Views report in the Traffic and Activity report group displays the overall
number of times that web pages on your site were viewed during a selected report period.
For example, the web site received 20,000 page views on Wednesday.
When you want to see how much traffic specific web pages received, view the Pages report
in the Pages and Content report group. This report can help you measure the level of
interest that people have in particular pages on your web site. This report may also help
you gauge the effectiveness of your site navigation. For example, it may indicate a broken
link to the page or that people are not responding to the content meant to direct them to
the page.
Viewing the Statistics
1. Select the Reports tab.
2. Expand the Pages and Content report group (click the
www.deepmetrix.com
icon).
11
3. Select the Pages report.
4. The Total Page Views column ( in Figure 11) will display the amount of times
each web page ( in Figure 11) was requested during the selected report period.
For example, the /tour/index.aspx page was viewed 3,377 times this week.
Figure 11: Tabular statistics in the Pages report.
Other reports on your web pages in the Pages and Content report group include:
•
•
•
•
Entry Pages: see which web pages were the first page viewed by people visiting your
web site.
Exit Pages: see which web pages were the last page viewed by people before leaving
your web site.
Pages Viewed Once: discover which web pages were the only page viewed during a
visit to your web site.
Time Spent per Visit: displays the average amount of time that people spent
viewing your web site pages during the selected report period.
Where in the world are your visitors located?
One of the things you want to know about your web site visitors is where they come
from—where are they located in the world? Discovering the origins of people visiting your
web site can reveal opportunities you may want to take advantage of by geographically
targeting marketing campaigns, opening regional offices, or launching alternate language
versions of your site.
You can determine the origin of people visiting your web site by looking at the reports in
the Geographic Info report group, which includes the Continent Breakdown report
(Figure 12).
www.deepmetrix.com
12
Figure 12: Tabular statistics in the Continent Breakdown report.
Viewing the Statistics
1. Select the Reports tab.
2. Expand the Geographic Info group (click the
icon).
3. Select the Continent Breakdown report.
4. The Total Visits column ( in Figure 12) will display the amount of distinct visits to
the web site from people in each location during the selected report period. Generate
a report on a particular continent by clicking on the continent image ( in Figure 12).
This report will display the number of visits from people located in each country.
For example, people in Europe made 5,063 visits to the web site this week.
What’s the Bounce Rate of your web site’s home page?
The home page is a crucial first impression of your web site for most new visitors. How
well does your home page perform in encouraging people to journey through the site and
complete a call-to-action? The Rejection or “Bounce” Rate of your home page is a key
metric in web site analysis for demonstrating the effectiveness of your web site’s entry
page. A bounce is considered to be a visitor viewing the home page then leaving the web
site without clicking a link and continuing on to view more of the site.
You can determine your Bounce Rate by performing a short calculation with numbers
obtained from the Entry Pages and Pages Viewed Once reports.
www.deepmetrix.com
13
Viewing the Statistics
1. Select the Reports tab.
2. Expand the Pages and Content group (click the
icon).
3. Select the Entry Pages report.
4. Get the number of page views for your home page ( in Figure 13). This represents
the number of times that people used the page to enter your site and view more web
pages.
For example, the Crazy Slippers home page “/index.aspx” was used by people to enter
the site 11,708 times during the month of January 2005.
Figure 13: Tabular statistics in the Entry Pages report.
5. Next, select the Pages Viewed Once report also in the Pages and Content group
on the Reports tab.
Figure 14: Tabular statistics in the Pages Viewed Once report.
6. Get the number of page views for your home page ( in Figure 14) from the Pages
Viewed Once report. This represents the number of times people viewed the page
without clicking a link on the page to view another page on the site.
For example, the Crazy Slippers home page “/index.aspx” was the only page viewed in
7,767 visits during the month of January 2005.
www.deepmetrix.com
14
Make sure to get the Viewed Once number for the same home page as the
Entry Page number. Also, make sure that the numbers are for the same report
period.
7. Finally, perform the following calculation:
Bounce Rate = (Page Viewed Once/(Page Viewed Once + Entry Page)) x 100
For example, if the Page Viewed Once views is 7,767 and the Entry Page views is
11,708, then the Crazy Slippers site’s Bounce Rate would be 40%.
(7,767 / (7,767 + 11,708)) x 100 = 40%
Since LiveSTATS.XSP does not consider a Viewed Once visit as an entrance to the site,
Viewed Once visits are not included in the Entry Page visits.
Report Options
Many features throughout the LiveSTATS.XSP interface enable you to customize your web
site reports. Examples of some of these options are provided below.
Options Icon
Click the Options icon ( ) beside an item in the tabular statistics area of a report to
display options for additional report information (Figure 15).
Figure 15: The Options drop-down menu.
Options in the drop-down menu will depend on the selected report.
Click the More Information icon ( ) in the Options drop-down menu (Figure 15) to
display more detailed information for the selected list item.
Click the Follow Link icon ( ) in the Options drop-down menu (Figure 15) if you wish to
launch the selected page in a new web browser.
www.deepmetrix.com
15
Display Name
You can create a user-friendly alias that LiveSTATS.XSP will display for a web page in the
Page reports instead of the page’s URL. In the example below (Figure 16), “Crazy Slippers
Home Page” will be displayed rather than “/index.aspx.”
Click the Options ( ) icon beside a web page (Figure 15) and then select the Change
Display Name icon ( ) from the drop-down menu.
Type the user-friendly name for the page in the Title text box and click the Save button.
Figure 16: Creating a Page Display Name.
More Icon
Click the More icon ( ) beside an item (Figure 17) to display the complete name of the
item (e.g. the full URL for a web page).
Figure 17: Viewing a complete URL through the More icon.
Keyword Filter
You can filter many LiveSTATS.XSP reports by keyword. For example, you can filter reports
to display only certain items such as pages within a specific directory. As an example, if
you filter the Pages report by the word “support,” only pages with “support” in the URL will
be displayed.
www.deepmetrix.com
16
Figure 18: Filtering a report by keyword.
To filter a report, type the word(s) to filter by in the Find text box on the Menu Bar (
in Figure 18) and click the magnifying glass icon ( ). The filter will only be applied to the
selected report.
The Find text box will only be displayed for a report period in the current month and is not
available for a historical report period.
List Size
You can change how many items are listed in the reports through the List Size setting on
the Menu Bar ( in Figure 19). The setting is applied to all reports.
Figure 19: Selecting a list size option.
To change the number of items listed in tables, click the Show # drop-down menu and
select the list size. Options are: 10, 25, 75 and 100 items.
For example, when you view the Pages report with a list size of 10 selected, only statistics for
the top 10 most popular web pages during the selected report period will be displayed.
The “total” amount displayed in a report will not be affected by the list size—this statistic
represents the total number for the report, regardless of how many items you choose
to display. For example, if the total number of views in the Pages report for a week is
100,000 for 80 distinct pages, 100,000 will be displayed for the total in the last row of
tabular statistics even if you select to view only the top 10 of 80 pages.
Columns/Graphs
You can change how statistics are displayed in the reports through the Style option:
Columns or Graph ( in Figure 20). The setting is applied to all reports.
www.deepmetrix.com
17
Figure 20: Selecting the report style for tabular statistics.
When the Columns option is selected (the default), the Current Total, Average, Forecasted/
Change, and Percentage statistics will be displayed in side by side columns (Figure 21).
Figure 21: A report in Columns mode.
When the Graph option is selected, statistics for Current, Average, Last, and Forecasted/
Change statistics will be represented by an interactive Comparison graph (Figure 22).
Figure 22: A report in Graph mode.
Downloading a Report
Along with the Refresh and Report Settings options, the Menu Bar at the top of a report
(Figure 23) provides options to Print, Email, and Export a report as well as Logout of
the interface.
Figure 23: The LiveSTATS.XSP Menu Bar.
Printing a Report
To print a report, click the Print button on the Menu Bar ( in Figure 23). LiveSTATS.XSP
will create a “print friendly” version of the report in a new browser window. You can print
this version from your web browser using the browser’s Print command.
www.deepmetrix.com
18
Emailing a Report
You can email any of your reports in HTML (the LiveSTATS.XSP format) or PDF (Portable
Document Format) through the Email function. You can also use this function to email an
Executive Summary report for any selected report period to any email address.
To email a report:
1. Click the Email button on the Menu Bar (
in Figure 23).
2. From the Report drop-down list at the top of the Email Report dialog ( in Figure 24),
select the report you want to email: the current report (for example, “Pages Report”)
or an Executive Summary Report for the selected report period. The Subject text box
will display the report that has been selected to be emailed ( in Figure 24).
3. Select the Format of the report: HTML or PDF (
in Figure 24).
4. Type the email address of the person you would like to receive the report in the To text
box ( in Figure 24). You can also type an email address of a person you would like to
receive a copy of the emailed report in the optional CC text box ( in Figure 24).
Figure 24: Emailing a LiveSTATS.XSP report.
www.deepmetrix.com
19
5. The From text box ( in Figure 24) will display the default “From” address for your
emailed reports. This address will be displayed in the email’s “From” field. If you want
to modify the address, clear the default address from the text box and type the new
address. Modifying the “From” address in this dialog will only affect this email and will
not reset your default LiveSTATS.XSP “From” address.
6. Click the Send button to email the selected report.
Exporting a Report
You can export any of your LiveSTATS.XSP reports to PDF (Portable Document Format),
CSV (Comma-Separated Values), and XML (Extensible Markup Language) files.
To export a report:
1. Click the Export button on the Menu Bar (
in Figure 23).
2. Click the icon for the file format in which you want the report data saved to your hard
disk: PDF File, CSV File, or XML File (Figure 25).
Figure 25: Choosing a file format to export a LiveSTATS.XSP report.
3. Right click the icon for the selected file format and select Save Target As (Figure
26).
www.deepmetrix.com
20
Figure 26: Exporting a LiveSTATS.XSP report.
4. Select the location and save the file.
When you download a report in PDF, all items displayed in the HTML report will be included
in the downloaded PDF file. For example, if you have set the list size to display the top
25 items for the Pages report, only the top 25 pages will be included in the PDF. When
you download a report to CSV or XML, all items within the selected report period will be
included in the downloaded file to a maximum of the top 2000 items.
Logging Out
To log out of your LiveSTATS.XSP reports, click the Logout button on the Menu Bar (
Figure 27).
in
Figure 27: Logging out of LiveSTATS.XSP.
www.deepmetrix.com
21
About DeepMetrix
DeepMetrix Corporation has developed real-time applications for businesses since 1992.
Our applications and services are used by enterprises to make business, IT, marketing and
merchandising decisions based on timely factual information.
DeepMetrix pioneered real-time web statistics in 1996 and has remained an industry leader
since that time, now with more than seven hundred and thirty-four thousand web-sites
actively using LiveSTATS.
For more information contact DeepMetrix at:
DeepMetrix Corporation
15 Gamelin Blvd., Suite 510
Gatineau, Quebec, Canada J8Y 1V4
Phone: 819.776.0707
Fax: 819.776.5560
Toll-Free Sales Phone: 1.800.903.8287
Email: [email protected]
Web Site: www.deepmetrix.com
©2005 DEEPMETRIX CORPORATION All rights reserved. DeepMetrix, StatScript, InstantMining, Click-andMine, Visitor Intelligence and LiveSTATS are trademarks or registered trademarks of DeepMetrix Corporation
in Canada, the United States of America and other countries. The names of actual companies, products and
all other trademarks mentioned herein, registered or otherwise, are the property of their respective owners.
DISCLAIMERS: The information in this user guide is subject to change without notice. DeepMetrix Corporation
assumes no responsibility or liability for any errors or inaccuracies that may appear in this guide.
Example companies, domain names, products, email addresses, people and events depicted within this guide,
such as screen captures and product examples, are fictitious or those of DeepMetrix Corporation.
VERSION: LiveSTATS.XSP v8 User Guide for ISP Clients v1: Release Date: November 29, 2005.
www.deepmetrix.com
22