1
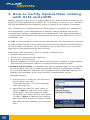
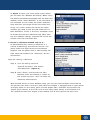
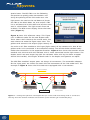
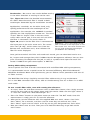
NETWORKSUPERVISION
Test and Troubleshooting Guide for
Optical Fiber Cabling and DataCommunications.
Table of Contents
1. Introduction. . . . . . . . . . . . . . . . . . . . . . . . . . . . . . . . . . . . . . . . . . . . . . . . . . . . . . . . . . . . . . . . 5
2. Fiber Verification Testing. . . . . . . . . . . . . . . . . . . . . . . . . . . . . . . . . . . . . . . . . . . . . . . . . . . . 6
3. How to Certify Optical Fiber Cabling with OLTS and LSPM.. . . . . . . . . . . . . . . . . . . . 7
4.
How to Certify Optical Fiber Cabling with an OTDR. . . . . . . . . . . . . . . . . . . . . . . . . .
• OTDR built specifically for the enterprise.. . . . . . . . . . . . . . . . . . . . . . . . . . . . . . . . .
• OTDR certification set-up.. . . . . . . . . . . . . . . . . . . . . . . . . . . . . . . . . . . . . . . . . . . . . . . .
• Summary of extended certification.. . . . . . . . . . . . . . . . . . . . . . . . . . . . . . . . . . . . . . .
• Cable certification test strategy.. . . . . . . . . . . . . . . . . . . . . . . . . . . . . . . . . . . . . . . . . .
13
14
17
18
19
5.
Finding and Analyzing Fiber Cabling Faults. . . . . . . . . . . . . . . . . . . . . . . . . . . . . . . . .
• Common faults.. . . . . . . . . . . . . . . . . . . . . . . . . . . . . . . . . . . . . . . . . . . . . . . . . . . . . . . . . .
• Simple fault finding. . . . . . . . . . . . . . . . . . . . . . . . . . . . . . . . . . . . . . . . . . . . . . . . . . . . . .
• Advanced troubleshooting. . . . . . . . . . . . . . . . . . . . . . . . . . . . . . . . . . . . . . . . . . . . . . . .
• Troubleshooting basics. . . . . . . . . . . . . . . . . . . . . . . . . . . . . . . . . . . . . . . . . . . . . . . . . . .
20
20
21
22
23
6. End-face Inspection and Cleaning. . . . . . . . . . . . . . . . . . . . . . . . . . . . . . . . . . . . . . . . . . . 24
• Inspection.. . . . . . . . . . . . . . . . . . . . . . . . . . . . . . . . . . . . . . . . . . . . . . . . . . . . . . . . . . . . . . 24
• Cleaning. . . . . . . . . . . . . . . . . . . . . . . . . . . . . . . . . . . . . . . . . . . . . . . . . . . . . . . . . . . . . . . . 25
7. Conclusion. . . . . . . . . . . . . . . . . . . . . . . . . . . . . . . . . . . . . . . . . . . . . . . . . . . . . . . . . . . . . . . . . 26
8. Glossary.. . . . . . . . . . . . . . . . . . . . . . . . . . . . . . . . . . . . . . . . . . . . . . . . . . . . . . . . . . . . . . . . . . . 27
9. Appendix
• Fluke Networks Fiber Test and Troubleshooting Instruments.. . . . . . . . . . 28
3
1. Introduction
As fiber links support higher-speed network bandwidths with increasingly stringent
requirements, it’s becoming more important to ensure your backbone links meet tightening
loss standards. The need for higher data transmission capacity continues to increase as network applications grow and expand. These higher transmission speeds demand cabling that
delivers increased bandwidth support. This test and troubleshooting guide outlines cabling
performance requirements, field testing, certification and troubleshooting techniques and
instruments to ensure the installed optical fiber cabling supports high data rate applications
such as 1 and 10 Gigabit per second (Gbps) Ethernet, Fibre Channel and 40 and 100 Gbps
Ethernet applications.
A local area network (LAN) or an enterprise (“premises”) network typically connects users up
to a distance of 5 km. It encompasses intra-building connectivity, as well as inter-building
or campus cabling. Optical fiber cabling is primarily used for longer distance, higher bandwidth connectivity, while twisted-pair copper cabling typically provides the connection to the
end-user or edge devices. This copper cabling can support network connectivity to a distance
of 100 meters (328 feet). Optical fiber cabling is the preferred medium for distances beyond
100 meters—such as riser cables in a building.
This guide reviews best practices for test and troubleshooting methods, as well as recommended test tools to ensure installed optical fiber cabling provides the transmission
capability to reliably support LAN or enterprise network applications. “Certification,” or the
process of testing the transmission performance of an installed cabling system to a specified
standard, ensures a quality installation. It also provides official documentation and proof
that the requirements set by various standards committees are fully satisfied.
Optical fiber is a reliable and cost-effective transmission medium. But, because precise alignment of very small fibers is crucial, problems ranging from end-face contamination to excess
modal dispersion can cause failures. Regardless, narrowing down the source(s) of failure is
often a time-consuming and resource-intensive task.
That’s why Fluke Networks created this enterprise-focused fiber troubleshooting guide—to
help you better assess the quality of a cable installation. And, to help you troubleshoot more
effectively so you can fix a problem faster, rather than spending time trying to identify it.
Note: this guide doesn’t address issues especially germane to the long-haul telecommunications application of the fiber optic technology.
4
2. Fiber Verification Testing
Fiber verification testing (including end-face inspection and cleaning) should be a part
of technician’s standard operating procedures. Throughout the cable installation process
and before certification, you should measure the loss of cabling segments to ensure the
quality of the installation workmanship. This test is normally done with a Light Source
and Power Meter (LSPM) test set. Fiber verification test tools are typically less expensive
tools; they’re also effective in troubleshooting links. A quick inspection of the end-to-end
link loss may indicate whether or not the optical fiber cable is suspect or whether other
network functions are the cause of the malfunction.
An LSPM determines the total light loss along a fiber link by using a known light source
at one end and a power meter at the other. But, before the test can be done, measure and
record a reference power level from the source to set a baseline for the power loss calculation. After this reference is established, plug the meter and source into the opposite sides
of the fiber link to be tested. The source emits a continuous wave at the selected wavelength. On the distant end, the power meter measures the level of optical power it receives
and compares it to the reference power level to calculate the total amount of light loss
(Figure 1). If this total loss is within the specified parameters for the link-under-test, the
test passes.
A loss budget should be well established and used as a benchmark during cabling
installation. If this verification testing is performed during installation, you can expect
that yield will increase and certification testing will go more smoothly.
Historically, LSPM test sets require manual calculations and subjective interpretation by
experienced technicians. However, newer instruments automatically compare power
measurements to set references, eliminating the time-consuming loss calculations.
Using an LSPM set to verify end-to-end loss is convenient. But, it doesn’t indicate where
trouble areas are. Failures can be difficult to locate and analyze. Even when the loss is
within a specified threshold, the LSPM set doesn’t provide any warning or indication of
where a defect or problem may be. In other words, although an entire link may pass, it’s
possible individual splices or connections within it may fail industry specifications. This
creates a potential problem in the future during adds, moves or changes where multiple
dirty connectors might be grouped together and result in a failure. An Optical Time
Domain Reflectometer (OTDR) can pinpoint locations (connections) displaying a high loss
or reflectance.
Fiber under test
*Mandrel used only for
850/1300 nm testing
Figure 1 – Conducting an LSPM test
5
3.How to Certify Optical Fiber Cabling
with OLTS and LSPM
Industry standards require using an LSPM or Optical Loss Test Set (OLTS) to certify the loss
of each link meets performance standards. This is referred to as “basic” or Tier 1 Certification and considered the most important testing in regards to new cabling installations.
Tier 1 Certification is a double-ended test which produces an absolute loss measurement.
That measurement is then compared with installation cabling standards and/or channel application standards. Fluke Networks’ DTX CableAnalyzer™ can support multimode or
singlemode fiber test modules that automate most of the test and make “basic” or Tier 1
certification easy.
An OTDR can also provide loss results for the total link. But, this measurement is based on
the reflected light energy. The standards demand the basic certification be executed with
an OLTS or LSPM. The link loss results provided by using a light source on one end and a
light meter at the opposite end are more accurate.
Follow these steps to perform a basic loss length certification test:
• Establish Pass/Fail test limits
• Choose a test method and set a reference
• Run the test and save results
• Export to LinkWare to manage and archive the test results. LinkWare is Fluke Networks’
free cable test management software to create printed or electronic reports
1.Establish Pass/Fail limits in accordance with your certification goals. In this example,
we will establish limits for the total allowable loss based on an application standard
using the Fluke Networks’ DTX Series tester equipped with the DTX-MFM2 fiber loss test
modules (for multimode). If you need to certify singlemode fiber, use the
DTX-SFM2 modules.
a. Once the tester is turned on, turn the rotary
dial to “Setup” and select
“Instrument Settings” to input the operator
name, job name, etc.
b. Select Fiber Loss from the Setup screen as
shown in figure 2. Under this setup screen,
choose from a menu of standards to select
the correct limits. Select the Test Limit option
as shown in figure 3. Note that the selected
fiber type limits the test limit choices. Popular
fiber types are also included in the instrument
menu.
Figure 2
6
As figure 3 shows, the same setup screen allows
you to select the “Remote End Setup”. When using
the DTX Smart Remote equipped with the fiber test
module, select “Smart Remote” as we have done in
this example. In this mode, the tester automatically measures the length of the link-under-test.
Lastly, this screen allows you to tell the tester
whether you need to test the link-under-test in
both directions. If this is the case, remember never
to disconnect the test reference cord (TRC) from
the test modules. Always swap the TRC at the connection with the link-under-test.
2.Choose a reference method and set it –
As described earlier, setting a reference is a
critical to obtaining accurate test results. The
power meter and light source are connected
together and the power level is measured by the
light meter to establish the “reference” for loss
calculations.
Figure 3
Steps for setting a reference:
Step A. Turn the rotary switch to
“Special Functions” and choose
“Set Reference” (Figure 4).
Step B. Press “Enter” and connect the TRCs
between main and remote as shown on
the screen and press “Test” to make the
reference measurement.
Figure 4
With the DTX Series in Smart Remote setup, you can test the two fibers that make up
the transmission link in one test. Each fiber test module is equipped with a light source
and light meter. In the setup, you’ll use two duplex TRCs. One fiber will connect the
output (light source) at the main unit to the input (light meter) at the remote unit.
The second connects the output at the remote unit to the input at the main unit.
7
Special note: The DTX TRCs use the following
convention to quickly make connections and
verify the polarity of the link-under-test: the
light enters the cord at the red boot and leaves
the TRC at the black boot. So, one end of a TRC
has a red boot and at the other end of that same
cord is a black boot. The light travels from red
to black. The DTX screen display shows the boot
color (Figure 5).
Figure 6 shows this reference setup. This figure
uses a different color for the two duplex cords.
These colors don’t relate to the actual cords, but
were chosen to make the figure more clear. The
Figure 5
yellow cord connects the output (light source) of
the main unit’s fiber module to the input (light meter) of the remote unit. One of the
yellow cords isn’t connected in the reference setting. One of the darker colored cords
makes the connection in the opposite direction. Figure 6 also shows the location of the
mandrel near the end with the red boot that is to be connected to the light source. The
duplex cords have one longer leg with the red boot. After this leg has been wrapped
around the mandrel, the lengths of both cords in the duplex arrangement are equal.
The DTX fiber modules’ output ports are always SC connectors. The removable adapters
for the input ports are chosen to match the end connectors of the link-under-test. The
example in figure 6 shows the link-under-test equipped with LC connectors.
Main to Remote
LC
LC
LC
LC
Remote to Main
LC
SC
SC
Out
Main Unit
In
Out
LC Adapters
In
Remote Unit
Figure 6 – Setting the reference with duplex TRCs for a link-under-test ending with LC connectors.
The ring near the red boot indicates the location of the mandrel (for multimode fiber).
8
Step C. After the tester measures the reference
power level, it displays these values as
shown in figure 7. If your reference
values are acceptable, press the F2
softkey to store these values and to
proceed with link certification.
Acceptable Reference Values*
Model
62.5 μm
Multimode
50 μm
Multimode
9 μm
Singlemode
MFM, MFM2
-20 dBm
-24.5 dBm
N/A
SFM, SFM2,
GFM, GFM2
-8 dBm
-8 dBm
-20 8m
Figure 7
*nominal level
Step D. Now disconnect your TRCs at the Input
ports only and create the connection
shown on the screen (Figure 8).
Disconnect the black boots from the input
ports and connect the unused ends with
the black boots in the duplex cord set to
the adapter on the input port of the unit
to which the duplex mate has been connected. You have separated the main and
remote units so you can connect a unit
at each end of the optical fiber link to be
tested.
Figure 8
Guidelines for setting a reference
• Use high-quality TRCs
• Clean TRC ends before you set the reference
• Let the tester warm up to a steady-state internal temperature
(about 10 minutes with ambient temp and storage temp difference of <20°F)
• Use preferred one-jumper reference method
• Plug the SC adapter with red boot plugs into the transmitter (OUT connection)
• Do not unplug red boot (on source) after setting the reference
• After the reference is set, do NOT disconnect TRC from light source
• For a multimode optical link, use the proper mandrel
• Reference must be reset after the units are powered down
• Maintain precise launch conditions of the reference
9
3.Run an autotest
Select “Autotest”. The test standard you select for an Autotest determines the test
parameters and the Pass/Fail criteria for each test.
Polarity – A successful Autotest using the DTX Fiber Modules, ensures polarity.
•Connect the black boot of the TRC to the fiber in the link-under-test transmitting the
light. This end of the link needs to be connected to the transmitter of the network
device. (Light leaves the TRC at the black boot. The red boot end of that cord is connected to the output on the tester).
•Connect the red boot of the TRC to the fiber in the link-under-test receiving the light
from the other end of the link.
•When the connections to the link-under-test are established, the instrument will
chirp a “happy tone” to indicate connectivity has been established and the polarity
of the link is good.
Length – The tester measures the length, as well as the link loss. When you select an
application standard during the setup, it includes the maximum length for the
application depending on the bandwidth rating of fiber used in the link-under-test.
Make sure the connector on your fiber test adapter matches the fiber patch cord or
the patch panel. Connect TRCs to the link or channel to be tested: repeat the process
displayed in figure 8.
Special mode controllers are available to use in place of traditional test reference cords
for test specifications that require encircled flux launch conditions.
(see Figure 9)
Figure 9 – Encircled Flux Mode Controller
Bidirectional testing – If you want to test each fiber in both directions, don’t forget to
select that option in the setup screen (see Figure 3). When the tester prompts you to
make the connection to test in the second direction, remember to switch the TRC at the
link end. DO NOT remove the TRCs from the tester connections.
10
Test Results – Be sure to save results before testing
in the other direction or moving on to the next
fiber. Figure 10 shows the detailed measurements
of a fiber. Note that each fiber is tested at both
wavelengths demanded by the installation standard.
Applications standards, on the other hand, only
specify performance for the wavelength of the
applications. For example, the 10GBASE-S standard
specifies the link requirements at 850 nm. The name
“input” fiber or “ouput” fiber in the test result
screen refers to the port in the main unit to which
the fiber is connected. The result shown in
figure 10 pertains to the fiber that is connected to
the input port at the main tester unit. The screen
title “Loss (RgM)”, which means Loss from the
Remote unit to the Main unit, also indicates the
fiber for result displayed.
Figure 10 – “Loss” test results for the
fiber connected to the input port on the
main tester unit. The result includes the
loss for both multimode wavelengths
(installation test standard).
Once you’ve tested all the links and saved each record, you can download results to a
PC, inspect and manage them with LinkWare Results Management software. You can also
print a Summary Test Report for the job, as well as a professional report for each link
tested. LinkWare lets you create reports as PDF files.
Testing MPO cabling components
To test optical links and channels constructed with multifiber MPO cabling components,
it is recommended to use a special tester for increased efficiency. With Fluke Networks’
MultiFiber Pro Power Meter and Light Source, you can follow similar procedures and test all
12 fibers at once.
The MultiFiber Pro brings simplicity to multi-fiber cable testing in any environment.
It is a true MPO connector fiber tester, able to simultaneously test all 12 fibers in an MPO
trunk cable.
To test a multi-fiber cable, start with setting the reference –
• As usual, clean the end-face connectors with an MPO fiber cleaner, then simply connect
one of the test cords to the power meter and light source. Make sure the light source is
in “Scan All” mode with “Auto Wavelength” on.
• Press the “Menu” button on the power meter to enter the “Set Ref” mode. Once the
measurement is ready, press F1 to save the reference.
• After you’ve set the reference with the supplied MPO test cords, select a loss limit.
Press “Menu” for 3 seconds, and then use the arrow keys to move to Loss Limit.
Press “Menu” again and use the F1 or F2 key to set your designated loss limit value.
• Now press Menu once to save. Then press and hold the Menu key to go back to the
main screen
11
• Now simply connect your test cords to the MPO trunk cable and, in less than 6 seconds,
you’ll have the loss and polarity measurements for all 12 fibers. The simple user interface allows you to easily determine if the cable passes the loss criteria you’ve set. Any
fiber that has excessive loss will be easy to spot in the simple bar graph.
Documenting the Results
To simplify test results management, MultiFiber Pro test results can be easily
uploaded to the popular LinkWare 7 cable test management software.
Connect the meter to your laptop with LinkWare 7 running. In LinkWare, use the
“Import” function to extract all the tests results from the MultiFiber Pro power meter
and professional test reports can be created.
For the most recent version of LinkWare software, please visit:
www.flukenetworks.com\linkware
4. How to Certify Optical Fiber Cabling with an OTDR
There are different types of OTDRs available. TIA 568C.0 and ISO 14763-3 recommend OTDR
testing as a complementary test to ensure the quality of fiber installations meets component specifications. The standards don’t designate Pass/Fail limits for this test. You should
consider generic cabling requirements for components and design criteria for the specific
job. You can use an OTDR as a single ended tester, bidirectionally (if desired) and optionally with a receive fiber for certification testing.
What you need to know about OTDRs. OTDRs used to be hard-to-operate laboratory
equipment – impractical for field use. They were big, heavy and complicated for inexperienced technicians to set up and operate. Test results were difficult to understand. This
created fear and confusion. Today, however, many new OTDRs are small, light and easy to
use. An ordinary technician can troubleshoot like an expert – but a basic understanding of
how an OTDR works is still helpful.
• Basic operation – An OTDR infers loss, reflectance and location of events. It sends
pulses of light into a fiber and uses a sensitive photo detector to see the reflections
and plot them graphically over time. In order to accurately test, the optical characteristics of the fiber must be determined and set prior to testing.
• OTDR trace – The OTDR plots the reflectance and loss over time in a graphical “trace”
of the fiber. Experienced technicians can “read a trace” and explain it. For example, in
figure 11, an experienced eye can spot that one side of a cross connect shows
excessive loss.
• Event analysis software – The latest OTDRs run sophisticated software that automates
trace analysis and set up of test parameters. Fluke Networks’ OTDRs can automatically
choose setup parameters, not only telling you where events (instances of reflectance
and loss) are on the trace, but also indicating what the events are and qualifying each
of them.
12
130 m
7m
80 m
Figure 11 – Sample OTDR trace with high loss connector at 137m
• Dead zone – The length after a connector, splice, break or macro-bend along the fiber
cabling where the OTDR can make an attenuation measurement or differentiate between
closely spaced events such as connectors. Event dead zone is the minimum distance
between two consecutive reflective events that the OTDR can make a measurement. Attenuation dead zone is the minimum distance after a reflective event that the OTDR can
make a loss measurement.
• Dynamic range – Determines the length of fiber that can be tested. The higher the
dynamic range, the longer the fiber-under-test can be. However, as the dynamic range
increases, the wider the OTDR pulse becomes and as a result, the dead zone increases.
• Ghosts – Not as scary as they might seem, ghosting is caused by an echo due to highly
reflective events in the link under test. Fluke Networks’ OTDRs identify ghosts on the
trace and tell you where the source of the ghost is so you can eliminate it.
• Gainers – Another misunderstood phenomenon on an OTDR trace is a gainer.
Simply put, a gainer is an apparent negative loss at an event where there is a change
in the optical performance. This is usually due to a mismatch between the index of
refraction of two spliced fibers or connection of a 50 µm multimode fiber into a
62.5 µm fiber. This type of event will often exhibit excessive loss in the other direction.
OTDR built specifically for the enterprise.
The OptiFiber Pro OTDR is an Optical Time Domain Reflectometer that locates, identifies and
measures reflective and loss events in multimode and singlemode fibers. Typical maximum
test ranges are less than 35 km at 850nm and/or 1300 nm wavelengths for multimode fiber
and well below the instrument’s range of 130 km for singlemode fiber which should be typically tested at 1310 and/or 1550 nm for singlemode fiber.
13
The tester can show the OTDR results in three
formats (Figure 12):
• Table shows a table of the events on the fiber.
Use this screen to quickly see measurements
for all events and see the types of events on
the fiber. The table includes the distance to
the event, the loss of the event, the size of the
reflection from the event and the type of the
event. To see details for an event, tap the event
in the table.
• EventMap™ shows a diagram of the events on
the fiber, the fiber length and the overall loss of
the fiber. Use this screen to quickly locate connectors and faults on the fiber. To see details for
an event, tap the event in the map, then tap the
information window for the event.
Figure 12 - OptiFiber Pro TABLE example
• Trace shows the OTDR trace. Use this screen to
see the dead zones of reflective events and examine the characteristics of unexpected
events such as ghosts and gainers.
–– The characteristics of the link will show in the EventMap
–– Note: Test result (Pass/Fail) and events shown depend on the characteristics of the
test link
–– Tap “Summary Bubble” to look at the details
EventMap™ View – In figure 13 is an example of a PASSING test using launch and tail fiber
• Different icons distinguish events such as:
–– Passing reflective event
–– Failing reflective event
–– Hidden reflective event
–– Passing loss event
–– Failing loss event
–– Hidden event’s loss is added to previous event’s loss
• Details are provided for the event’s loss, reflectance and segment attenuation.
Figure 13 - OptiFiber Pro EventMap™ example, by tapping on bubble to drill in for more information
14
Trace View – When testing a fiber link or channel, change the wavelength easily to view
the trace. Zoom in to see detail loss info and event characteristics.
• Jump to next/previous event
• Pinch to zoom out
• Reverse pinch to zoom in
• Drag to move the trace
• Slide to adjust x or y zoom
• Double tap to zoom to 100%
Figure 14 - OptiFiber Pro TRACE example
As mentioned at the beginning of this section, there are different types of OTDRs available. The OptiFiber Pro OTDR, with its advanced feature set and capabilities, would be an
excellent choice for certifying enterprise fiber cabling. But, since many contractors and
network owners use the DTX Compact OTDR for “closet to closet” certification, we will
demonstrate how to perform this type of testing with the DTX CableAnalyzer view.
Figure 15 – Connecting OTDRs to installed fiber using launch fiber compensation
15
OTDR certification set-up
Setting up for OTDR Certification Testing
Setup: Turn the rotary switch to “Setup” and choose
“Settings” from menus in five setup screens.
1. First, select which port you want to test from
(multimode or singlemode), which test limit you
want to use, the fiber type and desired wavelength.
• It is possible to create multiple sets of OTDR
test limits and select one for a particular job.
Each OTDR test passes (Figure 16) or fails
(Figure 17) based on a comparison against the
selected set of test limits.
2. On the second setup screen, you can set launch
fiber compensation, designate which end you are
testing from and note what you want to call each
end of the fiber. Figure 16 – “Pass” screen on the
DTX Compact OTDR
Using launch fiber compensation (LFC)
Launch fiber compensation is used to simplify testing
and remove the launch and receive fibers’ losses and
lengths from measurements (See figure 15).
• It shows where your launch (and/or receive)
fiber is on the trace, and eliminates it from the
certification test results. If you are a contractor,
your customers want to know where an event is
in their fiber plant, not where it is on your test
setup. When you enable “LFC”, a connector 50m
from the patch panel will show up at 50m, not
150m on the trace. Just turn the rotary switch
Figure 17 – “Fail” screen on the
to “Setup”, go to the second tab and enable
DTX Compact OTDR
“Launch Fiber Compensation”. Then turn it again
to “Special Functions”, and choose “Set Launch
Fiber Compensation”. Choose “Launch” only if you
are just using a launch fiber, or “Other Options”
if you are also using a receive fiber.
3.Third, designate the fiber characteristics, allow
default to the selected fiber in the first step or choose “User Defined” and select
“Numerical Aperture” and “Back-scatter coefficient” for the fiber-under-test.
4.Now choose from the menu to set “Distance Range”, “Averaging Time”.
16
N “Pulse
E T WWidths”
ORK
U P Threshold”.
E RVI S I O N
5.Finally, choose from the menu to set
andS“Loss
With the DTX Compact OTDR, many settings such as “Distance Range”, “Averaging Time”,
“Loss
can be automatically set. Just turn the rotary
4. Now “Pulse
chooseWidths”
from theand
menu
to Threshold”
set ‘Distance
switch to “Autotest” and when you push the “Test” button, the OTDR will choose the
Range’, ‘Averaging Time’.
most appropriate setting for the fiber you are testing.
5. Finally, choose from the menu to set ‘Pulse Widths’
Running an autotest. Now that you’re all set up for testing, turn the dial to “Autotest”,
and ‘Loss Threshold’.
plug in your launch fiber and press “Test”. If it passes, press “Save”, name the test and
test the next fiber. If you want to see a trace, just press the f1 softkey. The event table
With
DTX are
Compact
OTDR, many
andthe
limits
also accessible
via settings
softkeyssuch
on the main screen.
as ‘Distance Range’, ‘Averaging Time’, ‘Pulse
Widths’,
and ‘Lossof
Threshold’
can becertification
automatically
Summary
extended
set. Just turn the rotary switch to ‘Autotest’, and
• OTDR traces characterize the individual components of a fiber link: connectors, splices
when and
you other
push the
button,
the OTDR
will
loss test
events.
Extended
certification
compares the data to specifications for
these
events
to
determine
if
they
are
choose the most appropriate setting for theacceptable
fiber
• you
Critical
because it identifies faults that may be invisible to basic certification
that
are testing.
Figure 8 – Trace Screenshot on the DTX
• Evidence that every component in a fiber optic cabling
Compact system
OTDR was properly installed.
result Now
at 1550nm
in are
figure
18 up
and at 850nm in figure 19
RunningSee
anPass
autotest.
that you
all set
for testing, turn the dial to ‘Autotest’, plug in your
launchfiberandpress‘Test’.Ifitpasses,press’Save’,
namethetest,andtestthenextfiber.Ifyouwantto
see a trace just press the f1 softkey. The event table
and limits are also accessible via softkeys on the
main screen.
Summary of extended certification
• OTDR traces characterize the individual components of a fiber link: connectors, splices and other
loss events. Extended certification compares the
data to specifications for these events to determine if they are acceptable
• Critical because it identifies faults that may be
Figureto18
– Trace
screenshot on the
invisible
basic
certification
DTX Compact OTDR
• Evidence that every component in a fiber optic
cabling system was properly installed
Figure
Figure 9
19– –“Pass”
“Pass”Trace
traceScreenshot
screenshoton
on
the
the DTX
DTX Compact
Compact OTDR
OTDR
17
As with the first tier of testing, you
can download test results to a PC and
manage them with LinkWare Results
Management Software. It is easy to
merge OTDR test results with the other
records if the same naming sequence
is used. These can be easily created,
printed or emailed as PDF files.
Cable certification
test strategy
There are several ways to perform a
complete certification test of fiber
optic cabling. The standards are clear
about defining required and optional
tests, test limits and acceptable test
equipment. But, they don’t suggest
how the testing should be performed
for optimum efficiency in the field.
Based on decades of work with contractors, installers and technicians,
Fluke Networks developed proven,
best-practice procedures to perform
a complete fiber certification in the
most efficient way.
Figure 20 – Sample LinkWare Results
Management Software report
• Make sure design criteria and test limits are established before installation
• Confirm proper fiber strand polarity, end-face conditions and verify loss with simple
verification tools during installation
• Perform extended tests using the tier 2 certification tests (OTDR analysis) as the first
certification step. Doing so:
–– Ensures connector performanc meets generic cabling standards or system designer’s
requirements.
–– Qualifies workmanship for cabling installation.
–– Identifies problems for immediate troubleshooting with OTDR.
• Secondly, perform basic tier 1 test for the channel against the application standard.
This certifies channel length and loss and calculates margin based on the standard
• If bidirectional testing isn’t required, measure channel loss at the wavelength of the
application
18
5. Finding and Analyzing Fiber
Cabling Faults
Common Faults
Insufficient power or signal disturbances from
common faults cause failures in optical transmission.
Fiber optic connections involve the transmission of light from one fiber core into another. Fiber cores are smaller than the diameter of a
human hair. To minimize loss of signal power,
this requires good mating of two fiber endfaces.
Figure 21 – Example of a common cause of a
fiber failure
• Contaminated fiber connections – The leading cause of fiber failures is poor connector hygiene. Dust, fingerprints and other oily contamination cause excessive loss and
permanent damage to connector end-faces
• Too many connections in a channel – Simple, but it is important to consider the total
allowable loss (per intended application standard) and typical loss for connector type
during the design process. Even if the connectors are properly terminated, if there are
too many in a channel, the loss may exceed specifications
• Misalignment – The best way to achieve good fiber alignment is to fuse the two fibers
together with a precision splicing machine. But for several practical reasons, connection
of fibers is often done mechanically. There are many commercially available connector
types and all have their advantages and disadvantages. Typical loss specifications are a
good proxy for how well they can to align fibers. Specifications used for data communications should be compliant with Fiber Optic Connector Intermatibility Standard (FOCIS)
standards
–– Poor quality connectors or faulty termination – Good quality connectors have very
tight tolerances in order to maintain precise alignment
–– End-face geometry – Performance of fiber optic connectors is largely a function
of the geometry of the end-face. This geometry can be measured in a laboratory
with precision interferometry equipment. In the field, the following parameters are
inferred in loss and reflectance measurements
• Roughness – Scratches, pits and chips produce excess loss and reflectance
• Radius of curvature – The convex surface of the connector should nicely mate up with
another connector
• Apex offset – The core of the fiber should be centered near the highest point of the
connector
• Fiber height – A protruding (underpolished) fiber doesn’t mate well and an undercut
(overpolished) connector will perform poorly due to an air gap
–– Unseated connectors – A connector may be plugged into an adapter bulkhead,
but may not be seated and connected with its mate. Worn or damaged latching
mechanisms on connectors or adapters are sometimes the culprit
–– Poor cable management – Strain on a connector may cause misalignment due to
becoming partially retracted, broken or unplugged
19
• Polarity – Perhaps the simplest fiber cabling fault is a reversal of transmit and receive
fibers. This is usually easy to detect and repair. But, sometimes, connectors are duplexed together and must be broken apart to be reversed. Standards designate polarity
with a labeling convention that is seldom used, resulting in confusion
–– Polarity should be designated with A and B labels or colored boots
–– A is for transmit and B is for receive. OR, red is for transmit and black is for receive
Poor cable management, system design or damaged cable also causes faults in fiber cabling
systems. Fiber has a high tensile strength, but is susceptible to crushing and breaking if
abused.
• Bends – Macro and microbending caused by tight cable ties or bend radius violations
result in excessive and unexpected loss
• Breaks – Light will no longer propagate past a location where the glass is crushed or
cracked in an optical fiber
• Intersymbol interference (ISI) – Disturbed Signal is usually the result of poor system
design. A system that isn’t certified with the application standard in mind is susceptible to ISI
–– Modal dispersion from violation of distance limitations on multimode fibers
–– Reflections from too many highly reflective connectors cause increased bit errors due
to excessive return loss
Simple fault finding
Continuity and polarity problems from breaks or unlatched connectors are common and
sometimes difficult to locate and identify with loss testers. Visual fault locators and
optical fault finders, like FlukeNetworks’ Fiber
QuickMap and Fiber OneShot PRO are recommended to find breaks or unplugged connectors
in a fiber link.
A fiber troubleshooter quickly and efficiently
locates connections and breaks in either multimode or singlemode fiber. As single ended
testers, launch cables are recommended. Simply
plug the Fiber QuickMap (shown at right) into
one end of a fiber channel and press Test button to reveal locations of incidents of interest,
confirm channel connectivity and distance to
failures. Lasers, such as the VisiFault, provide the
simplest troubleshooting. Just shine it down a
fiber link and check the far end or visual signs
of high loss.
20
Advanced troubleshooting
OptiFiber Pro offers advanced troubleshooting features:
When a test is completed, the window shows the event with the worst measurement. If the
border is green, the measurements for the event don’t exceed limits. If the border is red,
a measurement exceeds the limits. If the border is blue, the tester doesn’t assign a pass
or fail result because it can’t do a full analysis. This occurs for OTDR Port, Hidden and End
events. When you use a test limit with a reflectance limit, Hidden events show a fail status
if their reflectance exceeds the limit. To see details for the event, tap the window. To see
information for another event, tap another icon on the map. Note: Events before the launch
cord connector and after the tail cord connector don’t have a pass or fail status.
Figure 22 – EventMap diagnostics
The optional video probe connects to the USBA port
on the OptiFiber Pro tester to let you inspect the end
faces in fiber optic connectors. The probe lets you
see dirt, scratches and other defects that can cause
unsatisfactory performance or failures in fiber optic
networks.
a. Turn ON the OptiFiber Pro. You will see the
Home screen, select Tools (see figure 23)
b. Connect the Inspector Probe to the USB port
to OptiFiber Pro
c. Tap “Tools”
Figure 23 – Main Menu - Tools Option
21
The FaultMap test (shown in Figure 24) helps you
record the connections in a fiber link and identify
bad connections. It can show short patch cords and
find connections that have high reflectance. The
FaultMap test gives you these results:
• Shows a map of the connectors in the link
might not show on the OTDR EventMap. The map
includes connectors that are hidden in the dead
zones made by previous events. The FaultMap test
shows patch cords as short as 0.5 m for lengths <
2 km.
• Highlights connections that are poor due to
high reflectance (> -35 dB). Reflective events
that are apparently not connectors don’t show on
the FaultMap diagram. Loss events are also not
shown. The FaultMap test finds events that have
a reflectance larger than approximately -50 dB on
multimode fiber and -60 dB on singlemode fiber.
(More negative values mean less reflectance and
a better connection. For example, a connector
with a reflectance of -40 dB is better than one
with -35 dB.)
Figure 24 - FaultMap results view
Troubleshooting basics
There are simple ways to avoid complex troubleshooting exercises. If you follow these best practices, you won’t spend as much time fault finding
and performing OTDR analysis.
• Keep it clean – Dirty connections are the biggest
cause of failing connections and testing challenges. Clean fibers each time they are connected.
You can verify fibers are clean by using an instrument such as a FiberInspector
microscope to examine fiber end faces.
Figure 25 - FiberInspector set up from
Tools menu
–– Dust blocks light transmission
–– Finger oil reduces light transmission
–– Dirt on fiber connectors spreads to other connections
–– Contaminated end-faces make testing difficult
–– Remember to inspect equipment ports like
routers, switches and NICs. They get dirty too
• Use the right test setup – Test standard per
specifications will ensure you get the most accurate, consistent, understandable and repeatable
results
• Use recommended fiber mandrels – to improve
loss measurement accuracy and repeatability
22
Figure 26 - FiberInspector results view
• Always use high-quality TRCs and launch fibers – Avoid random, questionable quality
test cords
–– All TRCs for loss testing should be delivered with good test result data
–– Test cords should make polarity easy for you. Fluke Networks’ cords feature red boots
on the end where light enters and black boots on the end where light exits
–– Keep cords clean and replace them when they show signs of wear
• Choose test limits appropriate to both generic cabling standards and
application standards
6. End-Face Inspection and Cleaning
Inspection
Proper inspection helps detect two of the most common (yet easiest to prevent) causes of
failure: damaged and dirty fiber end-faces.
Damage occurs in the form of chips, scratches, cracks and pits to the core or cladding and
can result from mating contaminated end-faces. Tiny foreign debris left on the core can
also damage end-faces as they are connected together during the mating process.
As alluded to earlier, sources of contamination are everywhere, whether from the touch of
a finger or the brush of clothing, much less the omnipresent dust or static-charged particles in the air. Ports are also subject to the same contamination, but are often overlooked.
Mating a clean connector, to a dirty port not only contaminates the previously clean connector but can also cause fiber damage or failure. Even the protective coverings or “dust
caps” on straight-from-the-package connectors and assemblies can cause contamination
due to the nature of the production process and materials.
Many people assume a quick visual check of the end-faces is sufficient to verify cleanliness. As mentioned previously, the cores of these fibers are extremely small – ranging from
roughly 9 to 62.5 µm. Put into perspective, with a diameter of 90 µm, the average human
hair is anywhere from 1.5 to 9 times larger! With such a tiny core size, it’s impossible for
end-face defects to be spotted without the aid of a microscope. (See figure 25 and 26 for
set up and end face examples)
23
There are two types of fiber inspection microscopes:
• Optical (Figure 27) – tube-shaped and compact, they
enable you to inspect the end-faces directly. Popular
because they are inexpensive. However, they aren’t
able to view end-faces inside equipment or through
bulkheads.
• Video (Figure 28) – small optical probe is connected
to a handheld display. The probe size makes them
excellent for examining ports in hard-to-reach places;
large displays enable easy identification of end-face
defects. They are also safer as they show an image
Figure 27 – Optical microscope
and not the actual end-face being observed,
reducing the risk of exposing one’s eye to harmful
lasers.
When it comes to showing the user what the naked
eye can’t see, the best microscope is the one that can
detect the smallest object.
Cleaning
Properly cleaned end-faces can actually “add” up to
1.39 dB onto your loss allowance (Figure 29).
In other words, if you have a fiber plant with an
overall loss of 5.0 dB against a specified budget of
4.5 dB, cleaning dirty end-faces may drop the link
loss down to just above 3.6 dB, providing a “Pass”
and plenty of head-room. Consequently, it’s important
to choose your cleaning tools and methods wisely
while avoiding common bad habits. Perhaps the most
Figure 28 – Video microscope
typical mistake is using canned air to blast fiber connectors or ports. While helpful for displacing large dust particles, it is ineffective on oils,
residues or tiny static-charged particles equally detrimental in causing failures.
Clean fiber
end-face
Contaminated
fiber end-face
Figure 29 – Comparison between a clean and dirty fiber end-face
The same problem occurs when using shirt sleeves or “clean” cloths to wipe connectors.
In fact, the trace amounts of lint and dust-attracting static from these materials will likely
add contamination, rather than reduce it. Even isopropyl alcohol (IPA), which has historically been an acceptable solvent, is proving to be inferior to specially formulated solutions. IPA’s inability to dissolve non-ionic compounds such as pulling lube and buffer gel,
24
and the residue it leaves after evaporation make engineered solvents the superior choice.
When using these solvents, the proper cleaning order is “wet to dry” using clean, lint-free
wipes (Figure 30).
Figure 30 – “Wet to dry”
cleaning methodology. Apply a small spot of solvent
to the starting edge of a
wipe. Holding the end-face
connector perpendicularly,
swipe the end-face from the
wet spot to the dry zone.
Cleaning resources vary in complexity and price, ranging from simple wipes to devices
that incorporate ultrasound with water. Which tool you use depends on need and budget.
But for the majority of the cabling jobs and projects, lint-free wipes and swabs with engineered solvents now found in fiber inspection, certification, and cleaning kits will
be sufficient.
7. Conclusion
Cabling installation is a multi-step process. It is prudent to certify the cabling system
after installation to ensure all installed links meet the expected level of performance. Certification will likely identify some failing or marginally passing results. In order to deliver
a high-quality cabling system, defects that cause failures and marginal passes must be
uncovered and corrected.
Fluke Networks’ full suite of fiber certification instruments (Appendix 2) has an unparalleled history of providing unique and powerful diagnostics assistance to installation
technicians. By knowing the nature of typical faults and how the tester’s diagnostics report
them, you can significantly reduce the time to correct an anomaly, an installation error or
a defective component. Personnel responsible for network operation also benefit from the
diagnostic capabilities of a certification test tool by reducing network downtime.
We recommend you familiarize yourself with the capabilities of your test tool. It truly
is modest investment that pays for itself many times over. In addition to your precision
instrument, Fluke Networks also provides a wide variety of expert and timely support options. Whether you are an installer, network owner or contractor, the following resources
are available:
• White papers and Knowledge Base articles – insightful studies and helpful advice on
relevant structured cabling topics
• Unsurpassed technical assistance from the highly trained Fluke Networks Technical
Assistance Center (TAC)
• Certified Test Technician Training (CCTT) classes available around the world
• Gold Support program – comprehensive maintenance and support including priority
repair with loaner, annual calibration and priority TAC support with after hours and
weekend coverage
25
8. Glossary
Certification testing – the process of testing the transmission performance of an installed
cabling system to a specified standard; requires an OLTS for “Tier 1” certification and an
OTDR for “Tier 2” certification
Channel – end-to-end transmission medium between a transmitter and receiver
dB – function of a ratio of two power levels, typically used to express the relation of the
output power to the input power such as the gain in an amplifier or the loss in a
transmission line
dBm – power level expressed as the logarithm of the ratio relative to one milliwatt
FiberInspector – Fluke Networks’ popular line of handheld fiber end-face and bulkhead
port inspection instruments, ranging from tube to video microscopes
Gbps – gigabits per second
Launch cord fiber – length of fiber placed between the link-under-test and the OTDR to
improve the OTDR’s ability to grade the near-end connector and any abnormalities in the
first connection
LED – Light Emitting Diode, a relatively low-intensity light source
Link – the physical cabling for a transmission
Mbps – megabits per second
OLTS – Optical Loss Test Set, a baseline “Tier 1” certification instrument that measures the
loss of a link over its length
LSPM – Light Source Power Meter, basic fiber verification instrument composed of a power
meter and a source to measure loss over a link
TRC – Test Reference Cord, a high-quality fiber cord, 1 to 3 meters long, with
high-performance connectors, ideally with end-faces with special scratch resistant hardened surfaces that enable numerous insertions without degradation in loss performance
VCSEL – Vertical Cavity Surface Emitting Laser, commonly used in multimode light sources
Verification testing – the process of testing the transmission performance of an installed
cabling system to ensure it meets a minimum threshold
VFL – Visual Fault Locator, optical source that transmits a low-powered laser to identify
breaks in fiber links
26
27
LED
LED, FP Laser
LED, FP Laser
LED
LED, FP
Laser, and VCSEL
LED, FP
Laser, and VCSEL
LED, FP Laser
3
3
3
3
3
3
3
3
3
Document test results
Source type
3
3
3
3
3
3
3
3
3
OptiFiber Pro
OTDR
3
3
3
3
3
3
3
3
DTX
Cable-Analyzer
with Compact
OTDR Module
3
3
3
FiberQuickMap
(Tier 2 Certification)
Plant Characterization & Troubleshooting
3
3
3
3
3
Laser
3
3
3
3
3
DTX
CableAnalyzer
with Fiber
Modules
3
3
3
DTX-CLT
CertiFiber Optical
Loss Test Set
Pass/fail results
Tier 2 certification
Reflectance measurements
Measure event loss
Locate multiple connections and
loss events
Locate faults
Tier 1 certification
Dual-fiber loss testing
3
3
3
3
Verify loss over entire link to ensure
loss budget not exceeded
3
3
SimpliFiber Pro
Power Meter and
Fiber Test Kits
Check polarity
MultiFiber Pro
MPO
3
Fiber Optic
Cleaning Kits
3
3
FiberInspector
Pro/Mini Video
Microscopes
(Tier 1 Certification)
Loss Length Testing
Check connectivity
Clean contamination
Check for fiber end-face
contamination or damage
VisiFault Visual
Fault Locator
Inspection and Cleaning
Appendix – Fluke Networks Fiber Test and Troubleshooting Instruments
For more information, please visit www.flukenetworks.com
Your authorized Fluke Networks distributor
Fluke Networks
P.O. Box 777, Everett, WA USA 98206-0777
Fluke Networks operates in more than 50 countries worldwide. To find your local office contact
details, go to www.flukenetworks.com/contact.
©2012 Fluke Corporation. All rights reserved.
Printed in U.S.A. 9/2012 3481323C