1
Evaluation of the European Technology Platforms
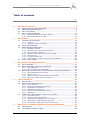
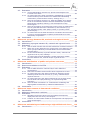
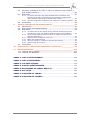
ANNEX 8: OVERVIEW OF FIGURES
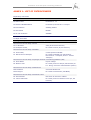
Figure 1: Interrelation of key elements ......................................................... 17
Figure 2: Hierarchy of objectives .................................................................. 19
Figure 3: Relationship between the hierarchy of objectives and the hierarchy
of effects ................................................................................... 20
Figure 4: The ‘Life-cycle’ of ETPs .................................................................. 32
Figure 5: Type of stakeholder (N=947) ......................................................... 45
Figure 6: Type of stakeholder at aggregate level (N=947) ............................... 45
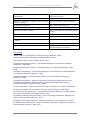
Figure 7: Breakdown of respondents by ETP (N=947) ..................................... 46
Figure 8: Involvement of respondents in ETP activities (N=947)....................... 47
Figure 9: General level of involvement per type of stakeholder (N=947) ........... 48
Figure 10: Members of mirror group in the sample (N=947) ............................ 48
Figure 11: Average score of the Participation of stakeholders in specific ETP
activities (on a scale of 1=never to 5= regularly) (N=947) .............. 49
Figure 12: Opinions on certain activities of the ETPs (N=947) .......................... 50
Figure 13: Openness and transparency: (average score on the basis of a scale
from 1=completely disagree to 4= completely agree) (N=947) ........ 50
Figure 14: Appreciation of the Strategic work of the ETPs (Mean score on a
scale of 1= completely disagree to 4= completely agree) (N=947) ... 51
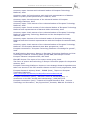
Figure 15: Appreciation of Coordination Effects (averages based on responses
on a scale from 1 to 4) (N=947)................................................... 53
Figure 16: Appreciation of Coordination effects per type of stakeholder
(averages based on responses on a scale from 1 to 4) (N=947) ....... 53
Figure 17: Appreciation on synergy effects (averages based on responses on a
scale from 1 to 4) (N=947).......................................................... 54
Figure 18: Appreciation of synergy effects by type of stakeholder (averages
based on responses on a scale from 1 to 4) (N=947) ...................... 55
Figure 19: Appreciation of resources mobilisation effects (averages based on
responses on a scale from 1 to 4) (N=947).................................... 56
Figure 20: Appreciation of resources mobilisation effects by type of
stakeholder (averages based on responses on a scale from 1 to 4)
(N=947).................................................................................... 56
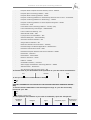
Figure 21: Appreciation of effects on the improvement of framework
conditions for Innovation per type of stakeholder (averages based
on responses on a scale from 1 to 4) (N=947) ............................... 57
Figure 22: Maintenance and enhancement of a high-skilled workforce by type
of stakeholder (averages based on responses on a scale from 1 to
4) (N=947)................................................................................ 58
Figure 23: Comparison of the different effects (averages based on responses
on a scale from 1 to 4) (N=947)................................................... 59
Figure 24: Comparison of possible future challenges (averages based on
responses on a scale from 1 to 4) (N=947).................................... 60
September 2008
146