1
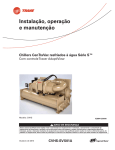
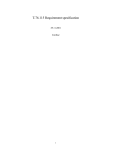
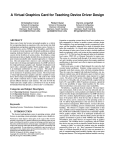
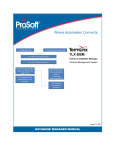
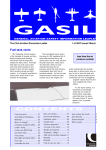
TIMElux 1.0 User Manual
[email protected]
ENTPE-CNRS, Vaulx-en-Velin, France
March 7, 1997
I. What is TIMElux ?
You have files with days and days, years and years, of variables with minute variations.
How to have a look at all this data quickly and easily ? It is impossible with Microsoft
Excel ! TIMElux makes it possible. In only one A4 page, this program generates the day
by day variations of your data for one month, using the familiar interface of a calendar
(see Figure 1 below).
,,
,,
,,
,,
,,
,,
,,
,,
,,
110
80
60
60
50
20
10
10
0
12
14
110
80
12
14
80
4
6
8
12
14
16
12
14
16
18
20
100
4
6
8
80
16
12
14
16
18
20
22
4
6
8
80
16
14
16
18
20
22
4
6
8
16
18
20
10
12
14
16
6
14
20
4
6
8
10
18
20
12
14
16
6
8
14
16
22
4
10
12
14
16
18
20
8
10
0
14
March, 1996
22
6
8
10
22
4
6
8
10
12
100
70
60
50
40
30
20
10
0
12
14
16
18
20
22
4
6
8
10
18
20
22
14
16
18
20
22
14
16
18
20
22
28
90
80
0
4
20
27
90
22
18
110
10
20
16
16
21
10
12
20
18
12
20
30
16
10
30
40
14
8
40
50
12
6
90
50
60
10
4
100
60
70
0
22
70
100
Evg, Evd
vs Winter Clock Time (hr)
8
6
20
80
80
10
8
20
18
20
90
26
20
6
100
110
30
4
18
16
110
0
12
90
0
14
14
14
10
12
10
10
12
20
20
90
22
10
10
30
30
40
20
8
8
40
40
50
18
6
6
50
50
60
16
4
4
100
60
60
70
14
22
22
70
70
80
12
20
20
80
80
100
25
90
19
90
4
18
18
13
110
100
22
100
0
10
16
110
10
110
90
22
16
14
20
0
12
0
12
30
10
100
31
90
4
18
8
10
40
20
0
8
6
8
50
30
10
100
22
10
4
6
60
40
20
0
14
8
22
4
70
50
30
10
12
6
20
22
80
60
40
20
10
4
90
70
50
30
0
12
6
22
18
20
12
80
60
40
10
0
4
20
100
18
90
70
50
20
10
22
18
16
18
110
110
80
60
30
20
20
14
100
24
90
70
40
30
18
12
110
80
50
40
16
100
30
90
60
50
14
110
70
60
12
16
0
0
10
14
10
10
8
12
20
20
0
14
10
10
0
10
30
30
10
12
8
8
40
40
20
10
6
6
50
50
30
80
70
6
4
4
60
60
40
100
29
90
4
22
22
70
70
50
110
100
22
20
20
80
80
60
0
110
20
18
17
90
70
10
0
18
90
110
80
20
10
16
100
23
90
30
20
14
110
40
30
12
0
50
40
10
18
11
0
10
14
100
10
8
16
110
20
20
12
14
20
10
0
12
30
30
10
10
40
40
60
50
6
8
50
50
70
60
4
6
60
60
80
70
22
4
70
70
100
22
90
20
22
80
80
110
100
90
16
90
22
18
20
10
110
0
110
100
0
10
18
110
10
10
0
16
20
20
10
14
30
30
20
12
40
40
30
10
30
20
10
0
8
50
50
40
6
60
60
50
10
22
4
70
70
60
8
20
22
80
80
70
6
18
20
9
90
15
90
4
100
110
100
10
16
18
110
0
110
8
16
10
0
6
14
20
10
4
12
40
30
20
10
0
10
30
20
10
8
40
30
8
6
50
40
6
4
60
50
4
22
70
60
10
20
80
70
8
18
8
90
6
16
110
100
4
10
50
40
30
20
60
50
40
30
20
10
0
8
30
70
60
50
40
,,
,,
,,
,,
,,
,,
,,
7
90
80
70
60
50
40
30
20
60
50
40
30
6
60
50
40
100
6
90
80
70
,,
,,
,,
,,
,,
,,
,,
,,
,,
,,
,,
,,
,,
,,
110
100
5
90
80
70
,,,
,,,
,,,
,,,,
,,
,,
,,
110
100
4
90
80
70
,,,
,,,
,,,
,,,
,,,
,,,
,,,
110
100
3
90
80
70
,,
,,
,,
,,
,,
,,
,,
,,
,,
,,
,,
,,
,,
,,
,,
,,
110
100
2
90
80
70
,,
,,
,,
,,
,,
,,
,,
,,
,,
110
100
1
90
4
,,,,
,,,,
,,,,
,,,,
,,,,
,,,,
,,,,
,,,,
,,,,
110
100
12
14
16
18
20
22
Vaulx-en-Velin, France
IDMP: FRA2
Lat: 45.78 N
Long: 4.93 E
Alt: 170 m
Clock Time: (GMT+1)
Processed by TIMElux 1.0, March 07, 97
Figure 1: Output of the TIMElux program.
A square corresponds to one day in the month. For each day, TIMElux plots the variations
of one or more variables with respect to the time (as in Figure 1) or to any other variable
(as can be seen in Figure 7). Within each square, to the right, a number specifies the day in
the month. The whole page allows you to see how your variables change from one day to
the other, while still allowing you to grasp the details of hourly variations. Various options are available to display the average sky type during the day, or the daylength, or a
reference level (these options are presented in section VII).
TIMElux 1.0 manual
1
Two reserved areas are used to display information on the data. The first on the extreme
right, indicates the name of the site where the data was taken from, its coordinates in
terms of latitude, longitude and altitude, as well as its time zone. The location of the site in
its country is illustrated graphically. The second reserved area indicates the month and
the year to which the data correspond, as well as the name of the variables used in the
representation.
II. Use of TIMElux
TIMElux has been initially designed to represent the data measured by ENTPE daylight
measuring station. This station is part of an international network of over 50 stations
called the IDMP, for International Daylight Measurement Programme (see http://
idmp.entpe.fr). The ENTPE station measures every minute, 13 variables and thus produces 780 values per hour, hence a total of 23,400 values in a month. TIMElux generates
the monthly display seen above in a minute on a PC equipped with an Intel Pentium. The
program has been extended to use the data produced by all the other stations of the
IDMP network.
TIMElux is flexible enough to be used on any time dependent data provided that your
files follow the format described in this user guide.
Here are some suggestions on what to use this program for:
•
Showing and explaining your data to your partners.
•
Controlling visually the quality of your data.
•
Compiling the outputs of TIMElux for later reference.
•
Selecting days with typical variations from the entire database.
•
Performing data exploratory analysis: look at the data first,
cross compare the variations of your variables,
then perform statistical analysis.
•
Validating models by watching their day to day performance
TIMElux works in a DOS shell under Windows 3.1 or Windows 95. It also works under
the Macintosh operating system. The output file that it generates is in the Adobe Portable
Document Format. It can be read using the Adobe Acrobat Reader available for free, at
www.adobe.com. The reader allows you to visualize the whole page shown in Figure 1,
zoom in any area of the page, and obtain an excellent printout (in color or in black and
white) on a Laser Printer. A tryout version of TIMElux is available, it is not limited in
functionality, however the word «unregistered» appears on every graph. To get the “real”
program, you will have to register and pay a little fee, which will give me some motivation to keep working on the program. See the last section of this document to learn more
about registration.
TIMElux 1.0 manual
2
III. Program environment
The program needs a few extra files to run properly. The files «vars.dat» and «cities.dat»
are absolute requirements. TIMElux is not able to look for a file located in the directory
other than the one where it is running, so place all the files in the same directory as TIMElux.
The program will generate the output file in the exact same directory.
You may also use special files which contain a graphical description of a country, these
have the extension «.psi». If found, they are used by TIMElux to represent graphically the
country and the site in its country (more on that in the «cities.dat» section). These files are
available only to registered users.
IV. The input data file format
The program understands two file formats: the first one is called the Joule format (see
example in Figure 2), the second one is called the CIE format (see example in Figure 3).
The Joule format has been proposed and used in a European Joule Research Programme
dealing with the IDMP. It is the easiest one to use. It first has a header. Then, the data is
presented in columns separated by spaces or tabs as you wish. Only one line is used for a
given date and time. The data is preceded by two lines indicating the name of the variables and the units used for these variables.
The header contains useful information on the data. The first two lines are essential and
you should stick to the format presented in Figure 2 as closely as possible. TIMElux
uses most of the information presented in these two lines. If the program does not work
properly, it may well be because the format of these two lines has not been strictly followed.
The first line provides information on the SITE to which the data corresponds. Commas
«,» are used to separate the various fields of information in that line, so do not omit
them. The name of the city and the name of the country are first mentioned. If you want
the program to be able to represent the country on the page, these names should be the
same as in the file «cities.dat». This is followed by the IDMP code of your station, if the
data does not correspond to the measurements of an IDMP station, you can simply omit
this field, then erase: «IDMP: xxx,» in the header. Then the latitude, the longitude and the
altitude of the site are indicated.
Follow strictly the format used in Figure 2: use decimal values of degrees, indicate
North by N, South by S, East by E and West by W, put spaces between the numbers and
the labels.
The second line indicates what «TIME» reference is used throughout the file. Again follow the format presented in Figure 2 closely. The data can be presented using «Winter
Clock Time» as in Figure 2, or «Summer Clock Time», or «Clock Time», or «Solar Time».
Between the parentheses indicate your legal time zone in the same way as in Figure 2:
(GMT±?).
TIMElux 1.0 manual
3
SITE: Vaulx-en-Velin, France, IDMP: FRA2, Lat: 45.78 N, Long: 4.93 E, Alt: 170 m
TIME: Winter Clock Time (GMT+1). Summer Clock Time from 04/28/96 to 10/26/96
TYPE: 5mn Averaged Measurements.
SOURCE:
ENTPE, Rue Maurice Audin, 69518 Vaulx-en-Velin, FRANCE.
Fax:(33) 72047041, Phone:(33) 72047087.
Person to contact: Dominique Dumortier.
COMMENTS: Values for diffuse illuminance and irradiance are corrected.
Shadowring correction factors calculated by Littlefair methodology.
Cells were last calibrated in Garston at BRE, on September 7, 1992.
These values have gone through LASH quality control procedure.
Evg
Evd
Evgn
Evge
Evgs
Evgw
Eeg
Eed
Lvz
Date
mm/dd/yy
03/02/96
03/02/96
03/02/96
03/02/96
03/02/96
03/02/96
03/02/96
03/02/96
Time
hh:mm
06:55
07:00
07:05
07:10
07:15
07:20
07:25
07:30
:
:
:
:
:
:
:
:
:
global horizontal illuminance
diffuse horizontal illuminance
global vertical north illuminance
global vertical east illuminance
global vertical south illuminance
global vertical west illuminance
global horizontal irradiance
diffuse horizontal irradiance
zenith luminance (11 degree aperture)
Evg
Lux
67
153
284
498
798
1184
1622
2095
Evd
Lux
67
150
284
498
798
1184
1622
2095
Evgn
Lux
35
82
157
291
485
730
1016
1320
Evge
Lux
90
177
320
532
835
1247
1852
2607
Evgs
Lux
60
116
198
352
562
832
1165
1592
Evgw Eeg Eed
Lvz
Lux W/m2 W/m2 Cd/m2
35
2
2
128
77
2
2
128
140
1
1
212
272
1
0
212
460
4
3
286
702
7
5
314
977
11
8
397
1265
14
11
452
Figure 2: Joule input file format.
Indicate also when summer clock time starts and finishes using the same date format as in
the data file (see paragraph below). The remaining lines of the header are useful to understand what the data is about («TYPE:» and «COMMENTS:») and where it comes from
(«SOURCE:»).
The data begins with two lines: one with column labels, the other one with column units.
TIMElux considers that the header ends, when it finds a line where the first word is «Date».
Therefore TIMElux expects the data to begin with «Date» as the first column and «Time»
as the second column.
The date and time have a format rather strict. Time is presented in a 24 hour format
«hh:mm» (20:50). Date can be presented in two formats: the month followed by the day,
followed by the year: «mm/dd/yy», or the day followed by the month, followed by the
year: «dd/mm/yy». Make sure that the unit is coherent with what is used in the remaining of the file.
Since the date is indicated by only two numbers, TIMElux assumes that above 50, it is the
20th century (1951 to 1999) and below 50, it is the 21st century (2000 to 2050).
TIMElux 1.0 manual
4
The other variables are found in the remaining columns. TIMElux looks for the label of
the column in the file «vars.dat» to find information on how to represent the variable (see
section IV on the content of the file «vars.dat»). When the value of a variable is not known,
it should be written as -99. TIMElux will not plot values equal to -99.
Automatic Quality Control carried out on 04-01-1996, B. Molineaux, GAP Geneva
Validation Limits : 1) 100 W/m2, 2) 100 W/m2, 3) 100 W/m2, 4) 10.0 klux
5) 10.0 klux, 6) 10.0 klux, 7) 10.0 klux, 8) 10.0 klux, 9) 10.0 klux
FRA2 2 45.78 4.93 170 15 5 1 12
110 1 1 122 1 1 130 1 1 132 1 1 134 1 1 136 1 1 10 1 1 22 1 1 199 1 1 453 1 1
450 1 1 502 1 1
FRA2 96 62 7.33 0 0
1184 1 1184 1 730 1 1247 1 832 1 702 1 7 1 5 1 314 0 91 0 1.7 0 .3 0
FRA2 96 62 7.42 0 0
1622 1 1622 1 1016 1 1852 1 1165 1 977 1 11 1 8 1 397 0 91 0 1.7 0 1 0
FRA2 96 62 7.5 0 0
2095 2 2095 2 1320 2 2607 2 1592 2 1265 2 14 2 11 2 452 0 91 0 1.8 0 1.8 0
FRA2 96 62 7.58 0 0
2702 2 2694 2 1651 2 4662 2 2372 2 1590 2 23 2 16 2 499 0 91 0 1.7 0 2.5 0
FRA2 96 62 7.67 0 0
3470 1 3316 1 1997 1 9160 1 3804 1 1920 1 35 1 20 1 582 0 91 0 1.8 0 3.3 0
FRA2 96 62 7.75 0 0
4250 1 3903 1 2330 1 13300 1 5273 1 2222 1 45 1 24 1 638 0 91 0 1.9 0 4.2 0
FRA2 96 62 7.83 0 0
5337 1 4613 1 2666 1 18670 1 7248 1 2532 1 58 1 29 1 684 0 91 0 2 0 5 0
FRA2 96 62 7.92 0 0
6458 1 5328 1 2966 1 23190 1 9070 1 2807 1 71 1 33 1 767 0 91 0 2 0 5.8 0
Figure 3: CIE file format (output by the AQCCIE program from P. Ineichen).
The second file format is called the CIE format. It has been designed specifically for the
IDMP network by the technical committee 3.07 of the CIE. It is far from being as explicit as
the Joule format, as can be seen in Figure␣ 3. It is fully described in a document called
«Guide to recommended practice of daylight measurement» and published for the IDMP,
by the Commission Internationale de l’Eclairage (see the web page at: http://
www.cie.co.at/cie/home.html). The basic ideas behind the format are the following.
Each record begins with the IDMP code of the station (FRA2 in Figure 3). A record may
hold more than one line but it has a fixed number of variables in it. A few lines of text can
be added to the beginning of the file to give some explanations on what the file contains
(TIMElux does not use this information, since this text has no defined structure). The first
record beginning with the IDMP code describes the content of the file with a set of numeric codes. In this format, date and time are presented using the year followed by the
julian day, then by the time expressed in fraction of hours. The interesting feature of this
format is that, each variable in the record is given with a quality control flag which is
introduced manually, or automatically by the AQCCIE program developed by P. Ineichen
from the Group of Applied Physics in Geneva (contact [email protected]).
One great feature of TIMElux is to allow to represent graphically the output of the
quality control using different colors (see section VI). In this format, unknown values
should always be followed by a quality control flag equal to 9.
The file «vars.dat» contains the link between the column labels used in the Joule format and the numeric codes used in the CIE format.
TIMElux 1.0 manual
5
V. Description of «vars.dat»
The file «vars.dat» (see Figure 4 below) contains information required by TIMElux to decide how to represent a variable. You can of course modify the file, but follow the format
strictly, all character strings are enclosed in quotes. The file contains 10 columns.
"Name" "IDMP" "Full Name"
"Alt"
502 "Sun Altitude (Deg)"
"Azi"
505 "Sun Azimuth (Deg)"
"Cef"
600 "Irradiance Correction Factor (%)"
"Cre"
604 "Irradiance Cloud Ratio (%)"
"Crv"
605 "Illuminance Cloud Ratio (%)"
"Cvf"
601 "Illuminance Correction Factor (%)"
"Dbt"
450 "Dry Bulb Temperature (Deg.C)"
"Det"
452 "Dew Point Temperature (Deg.C)"
"Eed"
022 "Diffuse Horizontal Irradiance (W/m2)"
"Eeg"
010 "Global Horizontal Irradiance (W/m2)"
"Ees"
000 "Direct Normal Irradiance (W/m2)"
"Eesz"
001 "Direct Horizontal Irradiance (W/m2)"
"Effd"
603 "Diffuse Luminous Efficacy (Lm/W)"
"Effg"
602 "Global Luminous Efficacy (Lm/W)"
"Evd"
122 "Diffuse Horizontal Illuminance (Klux)"
"Evde"
140 "East Vertical Diffuse Illuminance (Klux)"
"Evdn"
138 "North Vertical Diffuse Illuminance (Klux)"
"Evds"
142 "South Vertical Diffuse Illuminance (Klux)"
"Evdw"
144 "West Vertical Diffuse Illuminance (Klux)"
"Evg"
110 "Global Horizontal Illuminance (Klux)"
"Evge"
132 "East Vertical Global Illuminance (Klux)"
"Evgn"
130 "North Vertical Global Illuminance (Klux)"
"Evgs"
134 "South Vertical Global Illuminance (Klux)"
"Evgw"
136 "West Vertical Global Illuminance (Klux)"
"Evs"
100 "Direct Normal Illuminance (Klux)"
"Evsz"
101 "Direct Horizontal Illuminance (Klux)"
"Kvd"
607 "Diffuse illuminance fraction (n/a)"
"Kvs"
608 "Direct illuminance fraction (n/a)"
"Lvz"
199 "Zenith Luminance (KCd/m2)"
"Rh"
453 "Relative Humidity (%)"
"Rog"
457 "Ground Albedo (n/a)"
"S"
410 "Sunshine Duration (mn)"
"Sni"
458 "Snow Cover Indicator (n/a)"
"Time"
999 "Winter Local Time (hr)"
"Wd"
455 "Wind Direction (DgN->E)"
"Ws"
454 "Wind Speed (m/s)"
"Min" "Max" "Scale" "Delt" "C" "M" "Y"
0.0
70.0
1.0
10.0
0 33 100
0.0 360.0
1.0
45.0
0 33 100
0.0 100.0
1.0
10.0 20 90 70
0.0
1.0
1.0
0.1 20 90 70
0.0
1.0
1.0
0.1 80 80
0
0.0 100.0
1.0
10.0 80 80
0
-8.0
36.0
1.0
4.0 70 10 30
-8.0
36.0
1.0
4.0 70 10 30
0.0 800.0
1.0 100.0
0 40 30
0.0 1100.0
1.0 100.0 20 90 70
0.0 800.0
1.0 100.0 20 90 70
0.0 800.0
1.0 100.0 20 90 70
90.0 160.0
1.0
10.0 40 30
0
90.0 160.0
1.0
10.0 80 80
0
0.0
70.0 1000.0
10.0 40 30
0
0.0
70.0 1000.0
10.0 80 80
0
0.0
70.0 1000.0
10.0 80 80
0
0.0
70.0 1000.0
10.0 40 30
0
0.0
70.0 1000.0
10.0 40 30
0
0.0 110.0 1000.0
10.0 80 80
0
0.0 110.0 1000.0
10.0 80 80
0
0.0 110.0 1000.0
10.0 40 30
0
0.0 110.0 1000.0
10.0 80 80
0
0.0 110.0 1000.0
10.0 40 30
0
0.0 140.0 1000.0
10.0 80 80
0
0.0 110.0 1000.0
10.0 80 80
0
1.0
0.0
1.0
0.1 80 80
0
0.0
1.0
1.0
0.1 80 80
0
0.0
22.0 1000.0
2.0 80 80
0
10.0 100.0
1.0
10.0 70 10 30
0.0
1.0
1.0
0.1 70 10 30
0.0 840.0
1.0
60.0
0 33 100
0.0
3.0
1.0
1.0 70 10 30
4.0
22.0
1.0
2.0
0 33 100
0.0 360.0
1.0
45.0 70 10 30
0.0
20.0
1.0
2.0 100 45 45
Figure 4: The file «vars.dat».
Column 1 contains a short name for the variable (the label of the column in the Joule data
file). Column 2 contains a numeric code (used for the IDMP in the CIE format). Column 3
indicates the full name of the variable. This is the name used in the graphical representation. It should always be followed by the unit enclosed between parentheses. This unit
may be different from the unit used in the data file, because of the scale factor defined in
column 6.
The remaining columns give indications on how to plot the variable. Columns 4 and 5
indicate the minimum and maximum values used for the plot. The maximum value can
be lower than the minimum value, in that case the axis is reversed (for Kvd in the example shown in Figure 4, the maximum value of 1 will be on the left, and the minimum value
of 0 will be on the right). Column 6 indicates the scale used to plot the data (if you indicate
1000, the data read in the file is divided by 1000). Each graph has a grid, Column 7 «Delt»
indicates the value separating each line of the grid. Let’s say, that you want to represent
the illuminance in klux, it is read in the file in lux but you use a scale factor of 1000, the
grid is plotted every 10 klux if column 7 is equal to 10.
The last three columns allow you to decide which color you want to use to represent the
variable, a color is defined by the percentage of Cyan (column «C»), Magenta (column
«Y») and Yellow (column «Y»).
TIMElux 1.0 manual
6
You are allowed to define as many as 100 variables. You are pretty much free to decide
about the short names defined in column 1 of «vars.dat». However, a set of short names is
used by the program to perform some tasks automatically, these short names should not
be changed. They are the following:
«Name»
Alt
Azi
Cre
Crv
Date
Eed
Eeg
Eesz
Effd
Effg
Evd
Evg
Evsz
Time
Wd
Ws
«Usage»
for sun altitude
for sun azimuth
for the energetic cloud ratio (diffuse/global)
for the luminous cloud ratio (diffuse/global)
for the date of the day
for the diffuse horizontal irradiance
for the global horizontal irradiance
for the beam horizontal irradiance
for the diffuse luminous efficacy
for the global luminous efficacy
for the diffuse horizontal illuminance
for the global horizontal illuminance
for the beam horizontal illuminance
for the time of the day
for wind direction
for wind speed
Table 1: Variables with reserved short names.
TIMElux knows more about these variables than any other. For instance if you ask to
represent Alt, Azi, Cre, Crv, Effd, Effg and they do not exist in the file, it will compute
their values automatically provided that the data required to compute them can be found
in the file.
If you are using a file which contains a variable not defined in «vars.dat», TIMElux will
ask you to define its characteristics within the session.
VI. Description of «cities.dat»
The file «cities.dat» (see Figure 5, next page) contains information required by TIMElux to
locate graphically a city within its country. First, the program uses this file to find the city
according to its name (column 1), or its IDMP code (column 4). Then it uses column 3 to
open a graphical description of the outline of the country (for UK, it opens «UK.psi»).
Then, it locates the city in its country by drawing a red point at the coordinates given in
the last two columns «Xref» and «Yref». These coordinates are given in cm. They are relative to the lower left corner of the rectangle in which the country information is drawn.
You can have up to 100 sites defined in this file.
TIMElux 1.0 manual
7
"City"
"Aberporth"
"Albany"
"Ann Arbor"
"Ashikaga"
"Athens"
"Auckland"
"Augsburg"
"Beijing"
"Bet Dagan"
"Bolzano"
"Bratislava"
"Cagliari"
"Calgary"
"Carpentras"
"Country"
"UK"
"USA"
"USA"
"Japan"
"Greece"
"New Zealand"
"Germany"
"China"
"Israel"
"Italy"
"Slovakia"
"Italy"
"Canada"
"France"
"MAP"
"uk"
"usa-e"
"usa-e"
"japan"
"greece"
"newzeal"
"germany"
"china"
"israel"
"italy"
"slovakia"
"italy"
"canada"
"france"
"IDMP"
"TRY"
"USA2"
"USA1"
"JPN9"
"GRC1"
"NZL3"
"TRY"
"CHN2"
"ISR1"
"TRY"
"SVK1"
"TRY"
"CDN1"
"TRY"
Xref
4.70
4.75
4.05
4.65
4.60
4.75
4.60
4.65
4.50
4.15
3.65
3.90
3.80
4.90
Yref
0.60
1.95
1.80
1.15
1.10
1.90
0.70
0.85
1.65
2.15
1.40
0.55
0.90
0.75
Figure 5: The file «cities.dat».
VII. How to run the program
First make sure, that all the files you need are in the same directory. You definitely need
«vars.dat», «cities.dat» and your data file (Joule format or CIE format). Figure-6 below
shows an example of a session. It is exactly the same whether you work with Windows or
with Mac OS.
What is the name of the data file that you want to plot ?
vaulx96.qc
What variable should be used on the x axis ?
Time
What variable should be used on the y axis (& to stop the loop) ?
Evg
What variable should be used on the y axis (& to stop the loop) ?
Evd
What variable should be used on the y axis (& to stop the loop) ?
&
Which year do you want to plot (0 to 99) ?
96
What is the month to start with (1 to 12) ?
3
What is the month to end with (1 to 12) ?
3
Do you want to visualize the sky type (yes:1, no:0) ?
1
Do you want to visualize the daylength (yes:1, no:0) ?
1
Do you want to visualize a specific time period (yes:1, no:0) ?
1
Indicate at what time the period starts (8.5 for 8:30) ?
9
Indicate at what time the period ends (17.5 for 17:30) ?
17
Do you want to visualize a reference level (yes:1, no:0) ?
1
Which level do you want to use as a reference ?
10
Do you want to visualize the quality control flags (yes:1, no:0) ?
1
Data is being plotted...
Day 31 has been plotted.
The output file is called: vaulx96MarEvg.pdf
Figure 6: Example of a session with TIMElux.
TIMElux 1.0 manual
8
You are first requested to enter the name of the data file used as input to the program.
Based on the analysis of the header, TIMElux automatically detects the format of the file:
Joule or CIE. The file produced by the program will have the same name as the input
file followed by three letters for the month and by the short name of the first y variable
selected for the plot. This can make for file names longer than 8 characters which is OK ,
if you moved to Windows 95. The «.pdf» extension replaces any extension that the input
file had.
Then, you have to enter the name of the variable to be used on the x axis. There is only
one variable on the x axis. This variable can be «Time», or any other variable. In this last
case, TIMElux generates a cloud of points showing the trend between the y variable(s)
and the x variable (see Figure 7.d and Figure 7.e, next page). As an option, TIMElux can
write down the time corresponding to some of the points directly on the graph. Morning
hours are written above the points, afternoon hours are written below the points (see
Figure 7.e). Hours are written using a size small enough not to hide the points. They are
easy to read on the screen using the Acrobat Reader zoom function, even though they
are hard to read once printed on paper.
The next step is to enter the name of the y variable(s). You can plot as many variables as
you wish. However make sure that their colors as defined in «vars.dat» are different.
Because of the size of each individual graph, it is better to plot less than five variables. The
settings on the y axis are taken from the first y variable selected. To indicate that you do
not want to plot any other variable, type “&” instead of a variable name.
If you have chosen to plot Wd (wind direction) as the x variable and Ws (wind speed) as
the only y variable, TIMElux will generate automatically a wind rose (see Figure 7.f).
This wind rose provides statistical information on wind speed and wind direction during
the day. The number in the center indicates the percentage of time during which the wind
was blowing (Ws > 0.0). The wind rose indicates the percentage of time during which a
given level of wind speed is exceeded in a given direction. Four different wind speed
levels are used: 5, 10, 20 and 30 km/h with different colors. Wind direction information is
plotted every 20° of azimuth. Percentages use one grid circle every 10%.
The next step is to enter the year for which you are interested in the data, then the first
month for which you want to plot the data, and the last month. It is possible to plot more
than one month from the same data file, in that case TIMElux generates one PDF file per
month.
Finally, you are requested to choose among various options. A first option is to represent
the average sky type for each day (see Figure 7.a). The sky type representation is only
possible when your data file contains information upon which TIMElux can establish
the sky type. That is Eeg and Eed, the global and diffuse horizontal irradiances. There are
five sky types represented on the graph with different icons, showing the change from a
cloudless blue sky to a dark overcast sky. This sky classification has been developed by M.
Perraudeau («One year’s measurements of luminous climate in Nantes», Daylighting International Conference, Long Beach, CA, 1986).
TIMElux 1.0 manual
9
,
,
110
110
100
100
31
90
80
80
70
70
60
60
50
50
40
40
30
30
20
20
10
10
0
4
6
8
10
12
14
16
18
20
,
,
31
90
22
a. Evg,Evd vs Time
with sky type
110
0
4
6
8
10
12
14
16
18
20
22
b. Evg, Evd vs Time
with daylength
110
100
31
90
80
70
60
50
40
30
20
10
0
4
6
8
10
12
14
16
18
20
22
c. Evg, Evd vs Time
with period 9 to 17, and
reference level at 10 klux
110
100
100
31
90
80
11
70
10 15
14
60
14
50
%
1015
60
10
70
N
12
11
13
80
13
31
31
90
12
W
50
9 16
40
30
8 17
20
8 17
10
30
15 111412
9 16 10
13
19
0
10
10
30
40
50
60
d. Evg, Evd vs Alt
(Sun Altitude)
70
E
7
18
0
20
100%
8 17
20
7
18
0
9 16
40
19
0
10
20
30
40
50
60
70
e. Evg vs Evd with time
of measurements
f. Wind speed vs Wind
direction with sky type
Figure 7: Output produced with various options of TIMElux
(Evg, Evd and Alt are defined in the file «vars.dat»).
A second option is to represent graphically the daylength. It is computed using the latitude, longitude and time zone information found in the headers of the file. Two rectangles
are drawn to highlight the night period (see Figure 7.b).
A third option is to represent graphically a specific period of time during the day (working hours for instance). You specify this period by indicating the first hour (in decimals)
and the last hour (in decimals). TIMElux draws a brown rectangle which helps to focus on
the variations of the variable(s) during this period (see Figure 7.c).
The second and third options are time dependent information, therefore they cannot be
selected if you do not use «Time» as the x variable. When this is the case, these two options are replaced by the option of writing down the time of the measurements next to
some of the points.
Another option offered by the program is to highlight a given level on the y axis with a red
line (see Figure 7.c). After selecting this option, you are requested to enter the reference
level, this level must take into account the scale chosen for the variable. So if you plot a
variable which is in lux in the data file and in klux on the plot (according to the file
«vars.dat»), then the reference level is 10 klux if you enter 10.
Finally, an interesting option is available when the CIE format is used. TIMElux allows to
represent the quality control flag of a variable by changing the color of the line depending
on its value (see Figure 8, next page).
TIMElux 1.0 manual
10
110
110
100
110
100
1
90
110
100
2
90
110
100
3
90
110
100
4
90
110
100
5
90
100
6
90
80
80
80
80
80
80
70
70
70
70
70
70
70
60
60
60
60
60
60
60
50
50
50
50
50
50
50
40
40
40
40
40
40
40
30
30
30
30
30
30
30
20
20
20
20
20
20
10
10
10
10
10
10
0
0
4
6
8
10
12
14
16
18
20
22
0
4
6
8
10
12
14
16
18
20
22
0
4
6
8
10
12
14
16
18
20
22
0
4
6
8
10
12
14
16
18
20
22
20
10
0
4
6
8
10
12
14
16
18
20
22
0
4
6
8
10
12
14
16
18
20
22
4
110
110
110
110
110
110
110
100
100
100
100
100
100
100
8
90
9
90
10
90
11
90
12
90
13
90
80
80
80
80
80
80
70
70
70
70
70
70
70
60
60
60
60
60
60
60
50
50
50
50
50
50
50
40
40
40
40
40
40
40
30
30
30
30
30
30
30
20
20
20
20
20
20
10
10
10
10
10
10
0
4
6
8
10
12
14
16
18
20
22
0
4
6
8
10
12
14
16
18
20
22
0
4
6
8
10
12
14
16
18
20
22
0
4
6
8
10
12
14
16
18
20
22
6
8
10
12
14
16
18
20
22
8
10
12
14
16
18
20
22
110
110
110
110
100
100
100
100
100
100
100
90
90
90
18
90
19
90
20
90
80
80
80
80
80
80
70
70
70
70
70
70
70
60
60
60
60
60
60
60
50
50
50
50
50
50
50
40
40
40
40
40
40
40
30
30
30
30
30
30
30
20
20
20
20
20
20
10
10
10
10
10
10
0
4
6
8
10
12
14
16
18
20
22
0
4
6
8
10
12
14
16
18
20
22
0
4
6
8
10
12
14
16
18
20
22
0
4
6
8
10
12
14
16
18
20
22
6
8
10
12
14
16
18
20
22
8
10
12
14
16
18
20
22
110
110
110
110
100
100
100
100
100
100
100
90
90
90
25
90
26
90
27
90
80
80
80
80
80
80
70
70
70
70
70
70
70
60
60
60
60
60
60
60
50
50
50
50
50
50
50
40
40
40
40
40
40
40
30
30
30
30
30
30
30
20
20
20
20
20
20
20
10
10
10
10
10
10
0
0
0
0
0
0
4
6
8
10
12
14
16
18
20
22
4
6
8
10
12
14
16
18
20
22
4
110
110
100
100
100
29
90
30
90
80
80
70
70
70
60
60
60
50
50
50
40
40
40
30
30
30
20
20
20
10
10
0
0
6
8
10
12
14
16
18
20
22
8
10
12
14
16
18
20
22
31
90
80
4
6
4
6
8
10
12
14
16
18
20
4
6
8
10
12
14
16
18
20
22
10
12
14
16
18
20
6
8
10
12
14
16
18
20
22
10
0
4
6
8
10
12
14
16
18
20
22
4
6
8
10
12
14
16
18
20
Vaulx-en-Velin, France
Global Horizontal Illuminance (klux)
vs Winter Clock Time (hr)
IDMP: FRA2
Lat: 45.78 N
Long: 4.93 E
Alt: 170 m
Clock Time: (GMT+1)
Validated
22
28
March, 1996
Inconclusive
10
22
8
90
80
110
6
21
4
110
24
22
0
6
110
23
20
10
4
110
22
18
20
0
4
16
90
80
0
14
14
4
110
17
12
0
6
110
16
10
10
4
110
15
8
20
0
4
6
90
80
0
7
90
80
Questionable
22
0
4
6
8
10
12
14
16
18
20
22
4
6
8
10
12
14
16
18
20
22
Processed by TIMElux 1.0, March 12, 97
Figure 8: Output produced by TIMElux for the CIE file format
with quality control visualization.
Green is used when the quality control flag is set to 2 (data validated). Orange is used
when the flag is set to 1 (data inconclusive). Finally red is used when the flag is set to 3.
The color defined for the variable in «vars.dat» is used only when the flag is set to 0
(variable not tested).
VIII. About registration
If TIMElux is of interest to you, contact me via electronic mail or by fax: (33) 04 72 04 70 41.
To become a registered user of the program, You will have to sign a letter of agreement
and to pay for the program. Then you will be able to download TIMElux 1.0 from the
ENTPE ftp site. The registered version of TIMElux comes with a set of country outlines
(files .psi) for all the IDMP sites.
TIMElux 1.0 manual
11