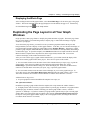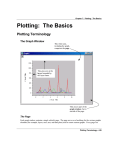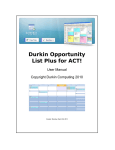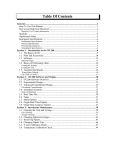
1
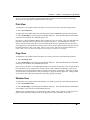
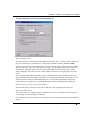
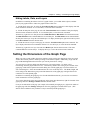
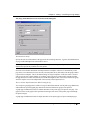
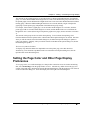
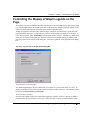
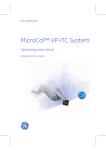
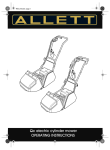
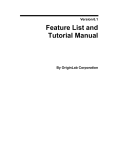
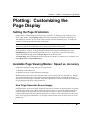
Chapter 12: Plotting: Customizing the Page Display
Plotting: Customizing the
Page Display
Setting the Page Orientation
Graphs can be viewed in landscape or portrait page orientation. To change the page orientation of the
active graph window, select File:Page Setup. This menu command opens the Page Setup dialog box.
This dialog box provides a preview of the current selection from the Orientation group. To change the
orientation, select the desired radio button in this group.
Note: When you change the page orientation from the Page Setup dialog box, Origin updates the page
dimension settings on the Print/Dimensions tab of the page's Plot Details dialog box.
Origin provides a “shortcut” to change the page orientation between portrait and landscape. Select
Edit:Rotate Page when the desired graph window is active. Alternatively, right-click in the graph
window but outside the page and select Rotate Page from the shortcut menu.
The Rotate Page menu command has no affect when the view mode is set to Draft View or Window View
(View:Draft View or View:Window View).
Available Page Viewing Modes: Speed vs. Accuracy
Origin offers different viewing modes for two major reasons:
1) Minimize screen redraw time.
2) Maximize accuracy of object placement on the page.
Minimizing the screen redraw time is desirable when you are working with very large data sets. Though
speed is also desirable when creating graphs which include multiple objects, verifying the accuracy of
object placement on the page is essential. Origin offers different view modes to facilitate the overall desire
for speed and the final check of object placement.
How Origin Generates Screen Images
Depending on the selected view mode, Origin uses either the screen driver or the printer driver to generate
a graphic image on the screen. When Origin uses the screen driver to generate the graphic image on the
screen, the page layout information is received from the screen driver. The screen driver has a fixed
resolution which is generally lower than the printer driver resolution. Thus, when Origin uses the printer
driver for the page layout information, it is at a higher resolution and is closer to what you will see in the
printed copy.
Setting the Page Orientation • 389
Chapter 12: Plotting: Customizing the Page Display
The view mode is set individually for each graph window and does not affect printing. Printed output
always shows the high quality, WYSIWYG Print View image.
Print View
To display the active graph window in the Print View mode, perform one of the following operations:
1) Select View:Print View.
2) Right-click in the graph window but outside the page and select Print View from the shortcut menu.
3) Select Format:Page to open the page's Plot Details dialog box. Select the Miscellaneous tab and then
select Print View from the View Mode drop-down list.
Print View is a true WYSIWYG (What You See is What You Get) view mode. This view mode displays a
page that corresponds exactly to the page from your hard copy device. Font information is received
directly from the current printer driver. Exact font placement and size is guaranteed, at some sacrifice to
screen appearance, as the printer driver fonts must be scaled to fit their positions on the page (this will not
harm the appearance of true vector fonts). This is a slow process, and screen refresh speed suffers as a
result. Thus, reserve the Print View mode for previewing your work prior to printing.
Page View
To display the active graph window in the Page View mode, perform one of the following operations:
1) Select View:Page View.
2) Select Format:Page to open the page's Plot Details dialog box. Select the Miscellaneous tab and then
select Page View from the View Mode drop-down list.
Page View provides faster screen updating than Print View, but does not guarantee exact text placement on
the screen unless you are using typeface scaling software (such as Adobe Type Manager). Page layout
information is received from the screen driver, which provides faster screen redraw. Therefore, use Page
View mode until your application is ready for printing or copying to another application. Change to Print
View mode to check object placement before exporting, copying, or printing.
Window View
To display the active graph window in the Window View mode, perform one of the following operations:
1) Select View:Window View.
2) Select Format:Page to open the page's Plot Details dialog box. Select the Miscellaneous tab and then
select Window View from the View Mode drop-down list.
Window View expands the page to fill up the entire graph window. Labels, buttons, or other objects in a
graph window that reside in the gray area off the page are not visible in Window View mode.
Available Page Viewing Modes: Speed vs. Accuracy • 390
Chapter 12: Plotting: Customizing the Page Display
Draft View
To display the active graph window in the Draft View mode, perform one of the following operations:
1) Select View:Draft View.
2) Select Format:Page to open the page's Plot Details dialog box. Select the Miscellaneous tab and then
select Draft View from the View Mode drop-down list.
Draft View has the fastest screen update of the four view modes. In Draft View, the page automatically
sizes to fill the graph window. This is a convenient mode to use when you are primarily interested in
looking at on-screen data.
Page rotation is disabled in Draft View. Additionally, text rotation and text formatting (for example,
superscript, subscript, Greek symbols, and text styles and fonts) are not visible in Draft View. All text
displays in the system font only. Text rotation and formatting reappear when you switch to Page View or
Print View.
Full Screen
Select View:Full Screen to change the active window to Full Screen view mode. To exit Full Screen view
mode, double-click the mouse.
Full screen view mode expands the page in the active graph window to fill the entire screen. This is a
display-only view mode. You cannot edit a graph in Full Screen mode. Additionally, buttons are not
visible in Full Screen view mode.
The Miscellaneous Tab of the Page's Plot Details Dialog Box
The graph page view mode is set on the Miscellaneous tab of the page's Plot Details dialog box.
Additionally, this tab provides options for controlling the redraw criteria of a graph window (when it is
non-active), applying speed mode to a graphic export file or a graph that is copied, and controlling the
active layer by the layer icon only.
Available Page Viewing Modes: Speed vs. Accuracy • 391
Chapter 12: Plotting: Customizing the Page Display
The (Page) Miscellaneous Tab on the Plot Details Dialog Box
The Performance Group
Select the desired view mode from the View Mode drop-down list. The view options include: Print View,
Page View, Window View, and Draft View. This option is identical to selecting View:View Mode.
The Percent of Page Uncovered to Redraw Page text box controls the redraw criteria of the graph window
when it is non-active. The text box is in units of % of page. Type a redraw threshold value n, so that if
more than n% of the graph page is uncovered, the graph window will redraw when the active graph
window displaying on top of it is moved, or when a dialog box that was covering the graph is moved or
closed.
The "If Speed Mode is Enabled for Display, Apply to Graphic Export as Well" check box allows you to
apply speed mode when your graph is exported to a file or copied to the clipboard. Speed mode is set on
the Size/Speed tab of the layer's Plot Details dialog box. You can enable speed mode to increase the
redraw speed of your graph layer by controlling the number of data points displayed in a graph layer.
The Set Active Layer by Layer Icon Only Check Box
Select this check box to ensure that a layer can be made active only by clicking on the layer icon.
The Drawing Order Group
If the “Draw all layers as a single composite” radio button is selected , the data plot of the parent layer in
an inset graph will “show through” the child layer.
If the “Draw layer by layer” radio button is selected, the effect is to make the background of the child layer
opaque.
Available Page Viewing Modes: Speed vs. Accuracy • 392
Chapter 12: Plotting: Customizing the Page Display
Other Ways to Increase Redraw Speed
Origin provides tools to increase the redraw speed of the graph window that you are currently customizing,
as well as the redraw criteria of the non-active graph windows in your current workspace. These tools are
most helpful if you are customizing a graph window that displays a large amount of data or includes a large
number of annotations, if your graph window contains a large number of layers, or if your workspace
contains a large number of graph windows.
One way you can improve the redraw speed is to control the conditions which cause the non-active graph
windows in your workspace to redraw. For example, when you are customizing a graph window, you may
Other Ways to Increase Redraw Speed • 393
Chapter 12: Plotting: Customizing the Page Display
want to make a number of changes to the graph window - without redrawing the other graph windows in
your workspace.
Another way to improve the redraw speed of the graph window you are editing is to hide graphic elements
in your graph window. For example, if your graph window contains multiple layers - but you are only
editing one layer - you could hide the other layers to increase the graph window redraw speed.
Origin also provides controls for increasing the redraw speed at the graph layer level:
1) Speed mode lets you specify the maximum number of data points that can display for each data plot in a
layer.
2) Graphic image caching lets you use vector or raster buffering to display data plots in a layer, instead of
having Origin redraw the data plots each time the graph window is made active, or when a dialog box is
closed that was covering the data plots.
Speed mode and graphic image caching are controlled on the Size/Speed tab of the layer's Plot Details
dialog box.
Controlling the Graph Window Redraw Conditions
When you are making changes to a graph window, and your workspace includes additional graph
windows, you can prevent the non-active graph windows from redrawing as you make changes to the
active graph window. For example, if you are editing the Plot Details dialog box for a graph window, and
this dialog box obscures part or all of a non-active graph window, you may not want the non-active graph
window to redraw after you close the Plot Details dialog box - even though the non-active graph window is
not refreshed after the dialog box closes. Preventing the non-active graph window from redrawing saves
you time as you customize your active graph window. Similarly, if your workspace includes a number of
graph windows, and the active graph window is covering part or all of a non-active graph window, you
may not want the non-active graph window to redraw when you move your active graph window in the
workspace.
To control the redraw criteria of a graph window (when it is non-active), select Format:Page when the
graph window is active. Alternatively, double-click in the gray area outside of the graph page. Both
actions open the Plot Details dialog box with the graph page icon selected on the left side of the dialog box.
Select the Miscellaneous tab on the right side of this dialog box. The Percent of Page Uncovered to
Redraw Page text box controls the redraw criteria of this graph window when it is non-active. The text box
is in units of % of page. Type a redraw threshold value n, so that if more than n% of the graph page is
uncovered, the graph window will redraw when:
1) The active graph window that is displaying on top of this graph window is moved.
2) A dialog box that was covering this non-active graph window is moved or closed.
The lower the number in the Percent of Page Uncovered to Redraw Page text box, the more often the graph
window is redrawn.
Other Ways to Increase Redraw Speed • 394
Chapter 12: Plotting: Customizing the Page Display
Hiding Labels, Data, and Layers
In addition to controlling the redraw criteria of a graph window, you can hide labels (objects) and data
plots in your graph window to reduce the graph window redraw time.
1) To hide labels on the page, de-select the View:Show:Labels menu command. Labels display when this
menu command is checked. To view the labels, re-select the menu command.
2) To hide all data plots on the page, de-select the View:Show:Data menu command. Data plots display
when this menu command is checked. To view the data plots, re-select the menu command.
Alternatively, right-click on a data plot and select Hide Data Plot or Hide Others from the shortcut menu.
The Hide Data Plot menu command hides the selected data plot. The Hide Others menu command hides
all data plots in the layer except the selected data plot. To display the data plots, right-click in the layer and
select Show All Data from the shortcut menu.
3) To hide the non-active layers on the page, de-select the View:Show:All Layers menu command. The
layers display when this menu command is checked. To view the layers, re-select the menu command.
Alternatively, right-click on a layer icon and select Hide Layer from the shortcut menu. This menu
command hides the associated layer. To display the layer, re-select the shortcut menu command.
Setting the Dimensions of the Graph Page
When you create a graph window based on a template, Origin sets the page dimensions of the new graph
window based on the portrait or landscape setting saved with the template. Additionally, Origin sets the
page width and height dimensions based on your current printer driver settings.
You can, however, alter the default page dimensions in your graph window. To do this, select
Format:Page when the graph window is active. Alternatively, double-click in the gray area outside of the
graph page. Both actions open the Plot Details dialog box with the graph page icon selected on the left
side of the dialog box. Select the Print/Dimensions tab if it is not already active. The Width, Height, and
Units settings in the Dimensions group control the dimensions of the graph page in Origin and can also
control the size of the printed graph.
In addition to controlling the graph page size from the Print/Dimensions tab, you can select two shortcut
menu commands to resize the graph page:
To re-set the dimensions of the current graph page to the printer page dimensions, right-click outside of the
graph page and select Fit Page to Printer from the shortcut menu.
If a layer extends outside of the page (for example, after manually arranging layers), right-click outside of
the graph page and select Fit Page to Layers to resize the graph page to include all the layers. (This
shortcut menu command is only available if a layer extends beyond the graph page.)
Setting the Dimensions of the Graph Page • 395
Chapter 12: Plotting: Customizing the Page Display
The (Page) Print/Dimensions Tab on the Plot Details Dialog Box
The Dimensions Group
Specify the units for measurement of the page from the Units drop-down list. Type the desired dimensions
for page width and height in the associated text boxes.
Note: By default, the width and height are determined by the currently selected printer driver. These
dimensions represent the printable area of the printer.
Select the "Set to Printer Dimension when Opened from a Template" check box to automatically set the
page to the correct dimensions for the currently selected printer driver (File:Print) when the graph window
is opened from a template. This is the default setting for Origin's templates. If this check box is cleared
and you save the active graph window as a template, when you open a graph window from this template
the page dimensions will be determined by the Width and Height text box values in the Dimensions group
when the template was saved (independent of the currently selected printer driver).
The Use Printer Default Dimensions When Printing Group
You can print a graph page that is smaller or larger in dimensions than the current printer page dimensions,
and maintain the specified graph page dimensions (from the Dimensions group) in the printout.
A graph page with dimensions that are smaller than those of the printer page will print on one page. The
upper-left corner of the graph will be positioned in the upper-left corner of the printer page (maintaining
the printer margin).
A graph page with dimensions that are larger than those of the printer page will print on multiple pages.
Setting the Dimensions of the Graph Page • 396
Chapter 12: Plotting: Customizing the Page Display
The controls for the printed graph size are provided in the Use Printer Default Dimensions when Printing
group. To ensure that the Width and/or Height text box values in the Dimensions group control the size of
the printed graph, clear the Width and/or Height check boxes in the Use Printer Default Dimensions When
Printing group. When the Width and Height check boxes are selected (default), Origin will adjust the
graph page to fit the printer page, independent of the Dimensions group settings.
For example, if the width of a graph page is set to 20 inches and the height is set to 8 inches, while the
printer page width is 10 inches and the height is 8.5 inches, and the Width check box is cleared but the
Height check box is selected, then Origin will print the graph on two pages (because 20 inches /10 inches =
2).
The controls in this group are also accessible when printing. To access them when printing, select
File:Print and then click the Options button. Edit the More Print Options dialog box as desired. Note that
when you edit the controls in the Plot Details dialog box, the More Print Options dialog box updates to
reflect your changes. Similarly, when you edit the controls in the More Print Options dialog box, the Plot
Details dialog box updates.
The Print Crop Marks Check Box
To display crop marks that denote the unprintable area on the printer page, select this check box.
Alternatively, select the Print Crop Marks check box on the More Print Options dialog box (click the
Options button on the Print dialog box).
Setting the Page Color and Other Page Display
Preferences
To set a page color, or to enable the display of a data plot line connection across axis breaks and missing
data, select Format:Page when the graph window is active. Alternatively, double-click in the gray area
outside of the graph page. Both actions open the Plot Details dialog box with the graph page icon selected
on the left side of the dialog box. Select the Display tab on the right side of this dialog box.
Setting the Page Color and Other Page Display Preferences • 397
Chapter 12: Plotting: Customizing the Page Display
The (Page) Display Tab on the Plot Details Dialog Box
The Background Group
To display no page color, select None from the Base Color drop-down list. When None is selected and the
page is exported or copied to the Clipboard, the page is transparent and displays the background color of
the host application.
To display a single color on the page, select the desired color from the Base Color drop-down list.
To display a gradient of colors on the page, select a start color from the Base Color drop-down list and a
gradient color from the Gradient Color drop-down list. After selecting the colors, select a location for
gradually blending the base color into the gradient color from the Gradient Control drop-down list. The
blending begins at the specified location.
The Connect Line Across Axis Break Check Box
Select this check box to display a line across the clipped ends of a line or a line+symbol data plot.
For information on adding an axis break, see Plotting: The Axes.
The Connect Line Across Missing Data Check Box
Select this check box to display a line across discontinuous data points in a line or a line+symbol data plot.
The Use Master Items Check Box
Select this check box to include Master Items in your printed, copied or exported images For more
information, see the section entitled Duplicating the Page Layout in all Your Graph Windows.
Setting the Page Color and Other Page Display Preferences • 398
Chapter 12: Plotting: Customizing the Page Display
Controlling the Display of Graph Legends on the
Page
The legend is a special text label that identifies each data plot in the associated layer by name and by graph
type. The data plot name is determined by the name of the worksheet column in which the data set resides.
If the worksheet column includes a label, the label is used to create the legend.
Though each legend is associated with a particular layer, controls are provided on the Legends tab of the
page's Plot Details dialog box to control specific properties of the legends in all the layers on the page. To
access these properties, select Format:Page when the graph window is active. Alternatively, double-click
in the gray area outside of the graph page. Both actions open the Plot Details dialog box with the graph
page icon selected on the left side of the dialog box. Select the Legends tab on the right side of this dialog
box.
The (Page) Legends Tab on the Plot Details Dialog Box
The Full Dataset Name Check Box
The default legend displays only the column name for each data set (or the column label, if it exists). To
display the full data set name in the legend, select the Full Dataset Name check box. The full data set name
has the syntax WorksheetName_ColumnName.
The Auto Update Check Box
Select the Auto Update check box to automatically update the legend(s) whenever a data plot is added to,
or deleted from, the associated layer on the page. If this check box is cleared, you must manually update
Controlling the Display of Graph Legends on the Page • 399
Chapter 12: Plotting: Customizing the Page Display
the legend for each layer by selecting Graph:New Legend when the desired layer is active. Alternatively,
right-click in the layer and select New Legend from the shortcut menu.
The Indicate Active Dataset Check Box
Select the Indicate Active Dataset check box to denote the active data set in the legend. When this check
box is selected, a black square surrounds the legend's data plot type icon for the active data plot in the
layer. Additionally, when this check box is selected, the active data plot can be selected by clicking on the
data plot type icon associated with the desired data plot in the legend.
Note: You can also select the active data plot from the Data menu or from shortcut menus. If you change
the active data plot by selecting a data plot from the data list or from a shortcut menu, you must refresh the
graph window to reflect the change in the legend.
The Symbol Width (% of Font) Text Box
The value in the Symbol Width text box determines the width of the data plot type icon(s) in the legend in
% of the legend font size.
Changing the View of the Page
Origin provides the following features to change the view of the graph page:
1) The View:Zoom In and View:Zoom Out menu commands.
2) The Zoom In and Zoom Out buttons on the Graph toolbar.
Note: For information on rotating or changing the perspective of 3D graphs, see Plotting: Graph Layers.
Zooming In and Out
Select View:Zoom In or click the Zoom In button
on the Graph toolbar to display an enlarged, closeup view of the page in the active graph window. After selecting the menu command or clicking the button,
you must click on the desired zoom location in the graph window. Origin zooms the page, centering the
zoom view at this location in the window (the axes are not rescaled). To zoom in closer, re-select the menu
command or re-click the button.
After zooming in on the page, Origin provides scroll bars along the bottom and right side of the graph
window. Drag on the scroll bar slide control to scroll up/down or right/left across the page.
To zoom out of the page, select View:Zoom Out. This menu command is opposite in operation to the
View:Zoom In menu command. Alternatively, click the Zoom Out button
on the Graph toolbar.
Note: These page zooming features should not be confused with the Axis Zoom In and Axis Zoom Out
shortcut menu commands available by right-clicking in the axis region. The page zooming features change
the view of the page. This affect is different from Origin’s scaling features (including Axis Zoom In and
Axis Zoom Out) that change the display of the graph by rescaling the axis.
Changing the View of the Page • 400
Chapter 12: Plotting: Customizing the Page Display
Displaying the Whole Page
After zooming in and out of the graph window, select View:Whole Page to fit the entire page to the graph
window. This menu command returns the page display back to the default, full page view. Alternatively,
click the Whole Page button
on the Graph toolbar.
Duplicating the Page Layout in all Your Graph
Windows
Origin provides a master page feature to simplify the global annotation of graphs. The master page feature
lets you easily display a consistent background, a company logo, or other labels and images on graph
windows in your project.
To use the master page feature, you must first create your master graph that contains the objects and
background that you want to display on other graph windows. To do this, you can customize the display of
any graph window and then rename the graph window master (Window:Rename). Alternatively, Origin
provides a graph template (MASTER.OTP) in which the axes and labels are already hidden, thus making it
an ideal master page. To open this template, select File:New and then select Graph from the list box and
Master from the Template Name drop-down list (in the Origin folder) and click OK. You can now
customize the display of this window and rename it master.
After you create a master page (a graph window named master), you can then control the display of the
master items in other graph windows in the project. There are two aspects to this control:
1) You can control whether or not the master items will be included when you export, copy, or print the
graph window. This control is available on each graph page's Plot Details dialog box. Select
Format:Page to open the Plot Details dialog box. Select the Display tab. Select the Use Master Items
check box to include master items when you export, copy, or print this graph window.
2) You can control whether or not the master items will display as you view the graph in Origin. To
access this control, select View:Show:Master Items on Screen when the graph window is active. Note:
This menu command is not available if the Plot Details Use Master Items check box is cleared.
Additional Master Page Notes:
1) To open a graph based on the MASTER.OTP template from script, use:
win -t plot master Master;
In addition to opening a graph window from the template, this script renames the window "Master."
2) To display master items exclusively in graph windows in portrait page orientation or in graph windows
in landscape page orientation, instead of renaming your master graph window "master," rename it
"portrait" or "landscape." If you have renamed your graph window portrait and you open a second graph
window that is also in the portrait page orientation, after selecting View:Show:Master Items on Screen,
the objects in the portrait graph window display in the second graph window (assuming the Plot Details
Use Master Items check box is selected).
Duplicating the Page Layout in all Your Graph Windows • 401
Chapter 12: Plotting: Customizing the Page Display
3) You can also include master items in layout page windows. However, by default, the Use Master Items
check box on the layout page's Plot Details dialog box is cleared. Therefore, you must select this check
box to include master items when exporting, copying, or printing. Furthermore, you must select the
View:Show:Master Items on Screen menu command to display the master items as you view the layout
page in Origin.
Note: To learn more about the master page option, review the MASTER PAGE.OPJ project located in
your Origin \SAMPLES\MISCELLANEOUS folder.
Duplicating the Page Layout in all Your Graph Windows • 402