1
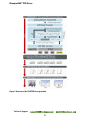
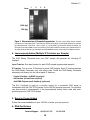
BIOMOL GmbH
Waidmannstr. 35
22769 Hamburg
[email protected]
www.biomol.de
Phone:+49-40-8532600 or 0800-2466651 (D)
Fax: +49-40-85326022 or 0800-2466652 (D)
User Manual
ChampionChIP™ PCR Array
Real-Time PCR-Based Pathway or Disease-Focused
Profiling of Chromatin Immunoprecipitation (ChIP) Samples
See Purchaser Notification for limited use license and warranty information (page 3).
Part #1051A
Version 1.1
10/20/2009
ChampionChIP™ PCR Array
Real-Time PCR-Based Pathway or Disease-Focused ChIP DNA
Profiling
User Manual
(For Catalog Numbers Prefixed by: GAH-###, GAM-###)
Ordering and Technical Service Contact Information:
x
x
x
x
BIOMOL GmbH
Waidmannstr. 35
22769 Hamburg
[email protected]
www.biomol.de
Phone:+49-40-8532600 or 0800-2466651 (D)
Fax: +49-40-85326022 or 0800-2466652 (D)
You may place orders by fax, e-mail or from our website. Each order should include the
following information:
x
x
x
x
x
Your contact information (name, phone, email address)
Product name, catalog number and quantity
Purchase order number or credit card information (MasterCard)
Shipping address
Billing address
For more information, visit us at w w w . b i o m o l . d e
SABiosciences Corporation
6951 Executive Way, Suite 100
Frederick, MD 21703
USA
2
Version 1.1
CONTENTS
I.
Background and Introduction
4
II.
Materials Provided
7
III.
Additional Materials Required
8
IV.
Protocol
9
A.
ChIP DNA Sample Preparation
12
B.
Performing Real-Time PCR
17
C.
ChIP PCR Array Data Acquisition Real-Time
21
D.
ChIP PCR Array Data Analysis
23
VI.
Troubleshooting and Frequently Asked Questions
Appendix: ''Ct Data Analysis Method & Bibliography
27
28
LIMITED PRODUCT WARRANTY
This product is intended for research purposes only and is not intended for drug or diagnostic purposes or for human use.
This warranty limits our liability to replace this product in the event the product fails to perform due to any manufacturing
defect. SABioscience Corporation makes no other warranties of any kind, expressed or implied, including without
limitation, warranties of merchantability or fitness for a particular purpose. SABioscience Corporation shall not be liable for
any direct, indirect, consequential or incidental damages arising out of the use, the results of use or the inability to use this
product.
NOTICE TO PURCHASER
The purchase of ChampionChIP™ PCR Array includes a limited, nonexclusive license to use the kit components for
research use only. This license does not grant rights to use the kit components for reproduction of any primer pair mix, to
modify kit components for resale or to use ChampionChIP™ PCR Array to manufacture commercial products without
written approval of SABioscience Corporation. No other license, expressed, implied or by estoppels, is granted. U.S.
patents may cover certain isolated DNA sequences included in the ChampionChIP™PCR Array.
Technical Support:
888.503.3187 (US)
3
301.682.9200
™
ChampionChIP PCR Arrays
I. Background and Introduction
In eukaryotic cells, chromatin is a dynamic complex of DNA, RNA, and proteins that makes
up chromosomes. The basic unit of chromatin is the nucleosome, which is composed of
~147 base pairs of DNA wrapped around an octamer of four core histones (H2A, H2B, H3,
and H4). Chromatin in a non-dividing cell can be divided into two functional states:
eurochromatin or heterochromatin. Eurochromatin is often (but not always) enriched with
genes in active transcriptional states and plays a central role in the regulation of gene
expression. Conversely, heterochromatin primarily consists of repetitive sequences, and
repressed genes associated with morphogenesis or differentiation, imprinting and X
chromosome inactivation. Heterochromatin is also a prevalent chromatin state among
eukaryotes, which has crucial functions in controlling chromosomal stability and the
prevention of DNA mutations and translocations.
Histones are subjected to several types of modifications, including acetylation, methylation
and phosphorylation. These modifications change dynamically and co-ordinately on
multiple genomic sites to regulate gene expression. For example, in activated gene
regions there is an enrichment of modified histones such as H3ac, H4ac, H3K4me2 or
H3K4me3, whereas the enrichment of modified histones H3K9me3, H3K20me3 or
H4K27me3 are implicated in gene inactivation or silencing.
Chromatin Immunoprecipitation (ChIP) is a unique technology for the analysis of the in vivo
association of a protein of interest with specific genomic regions in native chromatin
microenvironments. Current approaches for the analysis of ChIP-enriched DNA samples
rely mainly on site-by-site detection of limited genomic regions using PCR, or screening
large scale genomic regions by array hybridization (ChIP-on-Chip) or direct sequencing
(ChIP-Seq).
Our ChampionChIP™ PCR Array (ChIP PCR Array) is a 96-well or 384-well PCR plate
containing SYBR Green-optimized primers specially designed for application-focused
panels of genomic sites allowing for a specific and quantitative analysis of ChIP DNA
samples. The ChIP PCR Array combines the advantage of Real-Time PCR dynamic
performance with the ability to detect ChIP-enriched genomic DNA on multiple sites
simultaneously. The global profiling feature of the ChIP PCR Array eliminates the low
throughput of single site-by-site detection. The product greatly facilitates the profiling of
ChIP DNA enriched for function- or disease-relevant genomic loci. The results will aid in
the understanding of the coordinated and dynamic regulation of multiple genes during cell
development, differentiation, tumor-genesis and possible other human diseases.
To complete the ChIP PCR Array procedure (Figure 1), all you need to do is prepare your
experimental samples (about one million cells per ChIP assay), and perform the chromatin
immuno-precipitation using our ChampionChIP One-day Kit and Antibody Kits for optimal
results. Or you can follow another methodology of your choice. Subsequently, mix your
purified ChIP DNA with SABiosciences' instrument-specific and ready-to-use RT2 PCR
Master Mixes and aliquot the mixture into a ChIP-Array plate of your choice. Finally,
perform PCR and determine the level enrichment of your ChIP DNA samples by analyzing
Technical Support:
[email protected]
4
www.SABiosciences.com
Version 1.1
your Real-Time PCR raw data with our Excel-based ChIP PCR Array Data analysis
template. The whole procedure can be easily completed in one or two days.
The streamlined ChampionChIP™ PCR Array quickly delivers a simple and robust
approach for the profiling of a number of ChIP DNA samples with Real-Time qPCR
precision. The reliability and simplicity of the ChIP PCR Array makes this technology
feasible for routine use in any research laboratory.
Benefits of the ChampionChIP™ PCR Arrays:
Function or Disease Focused: arrays represent a panel of genomic sites relevant to a
biological function or disease state.
Reliable, Sensitive, & Specific: simple and streamlined procedure for simultaneous
analysis of multiple genomic sites with Real-Time qPCR precision and sensitivity.
Feasible to Routine Use: brings ChIP profiling on a large set of samples to almost
any lab with a Real-Time PCR instrument.
High-throughput profiling capabilities with Real-Time PCR performance!
Technical Support:
888.503.3187 (US)
5
301.682.9200
™
ChampionChIP PCR Arrays
Figure 1: Overview of the ChIP PCR Array procedure.
Technical Support:
[email protected]
6
www.SABiosciences.com
Version 1.1
A.
B.
Figure 2: Layout of the Cataloged ChIP PCR Arrays
(A) Catalog 96-well ChIP PCR Arrays
x Wells A1 through G12 contain a Real-Time ChIP PCR assay for genomic sites from
the same biological pathway, disease state or genes that are functionally-related.
x Wells H1 through H10 contain control Real-Time ChIP PCR assays (C1-C10) to
ensure the specificity and efficiency of the enrichment.
x Well H11 and well H12 contain replicate Positive PCR Controls (PPC). The replicate
PPC control wells also indicate inter-well and inter-plate consistency.
(B) Catalog 384-Well ChIP PCR Array
x The 384-well format of the PCR Arrays includes four replicates of the same 96-well
format, in which each set of wells contains the same primer set represented by the
96-well designations ( For example, a set of wells A1, A2, B1, B2 the same primer
set labeled with G1).
x Wells A1 through N24 contain a Real-Time ChIP PCR assay for genomic sites from
the same biological pathway, disease state or genes that are functionally-related.
x Wells O1 to O10 through P1 to P10 contain control Real-Time ChIP PCR assays
(C1-C10) to ensure the specificity and efficiency of the enrichment.
x Wells O11, O12 and P11, P12 contain replicate Positive PCR Controls (PPC). The
replicate PPC control wells also indicate inter-well and inter-plate consistency.
Customized ChIP PCR Arrays will have a customer specified layout. The product
specification sheet enclosed with the arrays will reiterate the layout and will list the genes
included on the array.
Technical Support:
888.503.3187 (US)
7
301.682.9200
™
ChampionChIP PCR Arrays
II. Materials Provided:
All components included in this kit are shipped at ambient temperature but must be stored
at -20 °C upon receipt. Quality is guaranteed up to 6 months of receipt if stored properly at 20 °C.
The ChIP PCR Arrays are available in six different plate formats, each tailored to a specific
subset of Real-Time PCR instruments and block format. Formats A, C, D, and F are for 96well plates, while Formats E and G are for 384-well plates.
Format
For Real-Time Instruments
Plate
A
ABI “standard” blocks: 5700, 7000, 7300, 7500, 7700, 7900HT
(96-block)
Bio-Rad: iCycler®, iQ5, MyiQ, Chromo4 (MJ Research)
Eppendorf: MasterCycler® ep RealPlex®
Stratagene: Mx3005p®, Mx3000p®
Takara: TP-800
96-well
C
ABI: 7500 FAST block, 7900HT FAST block, StepOnePlus™
96-well
D
Bio-Rad: CFX96™, Opticon® and Opticon 2 (MJ Research)
Stratagene: Mx4000®
96-well
E
ABI: 7900HT (384-well block)
Bio-Rad: CFX384™
384-well
F
Roche: LightCycler 480 96-well block
96-well
G
Roche: LightCycler 480 384-well block
384-well
NOTE:
1.
The format of the ChIP PCR Array is indicated by the last digit of the catalog
number. Confirm that you have the correct ChIP PCR Array format for your instrument
before starting the experiment.
2.
The 96-well ChIP PCR Arrays (Formats A, C, D, and F) are shipped in sets of four
(4), twelve (12), or twenty-four (24), while the 384-well ChIP PCR Arrays (Formats E and
G) are shipped in sets of Two (2), Four (4) or twelve (12).
3.
Each ChIP PCR Arrays shipment includes the arrays and either twelve (12) optical
thin-wall 8-cap strips (Formats A and D) or one (1) optical adhesive film (Formats C, E, F,
and G) per array.
4.
Each 96x4 Format 384-Well ChIP PCR Array (Formats E and G) includes one set of
four 384EZLoad™ Covers (Catalog #PA-384) for each ChIP PCR Array provided in the
package. Each 384EZLoad™ Cover is for Single Use ONLY.
Technical Support:
[email protected]
8
www.SABiosciences.com
Version 1.1
III. Additional Materials Required:
A. ChampionChIP™ One-Day Kit
Catalog Number GA-101
The One-Day Kit contains sufficient reagents to perform 12 Chromatin
Immunoprecipitations and DNA Purifications. The Kit yields high quality ChIP DNA
suitable as template for Real-Time PCR analysis (See Figure 4 on page 17 and Figure
5 on page 18)
B. Champion Antibody Kit
Catalog Number GAH-XXXX
More information regarding the ChampionChIP Antibody Kit can be found at
(http://www.sabiosciences.com/chipgradeantibody.php).
OR other ChIP-Grade antibody of choice can be used (See Page 12).
C. SABiosciences RT2 SYBR® Green qPCR Master Mixes:
MANDATORY for a Complete and Successful Experiment
Be sure to select the correct master mix appropriate for the Real-Time PCR
instrument available at your laboratory and the correct master mix volume for your
chosen PCR Array format.
1. 96-Well PCR Arrays
RT2 SYBR® Green / ROX qPCR Master Mix: PA-012
Designed for:
All ABI and Stratagene Instrumentation
Eppendorf mastercycler® ep realplex Instruments with ROX filter set
Catalog Number
Size
PA-012-4
For 4 ChIP PCR Array plates
PA-012-12
For 12 ChIP PCR Array plates
PA-012-24
For 24 ChIP PCR Array plates
RT2SYBR® Green / Fluorescein qPCR Master Mix: PA-011
Designed for:
BioRad iCylcer®, MyiQ™, and iQ™5 Instrumentation
Catalog Number
Size
PA-011-4
For 4 ChIP PCR Array plates
PA-011-12
For 12 ChIP PCR Array plates
PA-011-24
For 24 ChIP PCR Array plates
RT2SYBR® Green qPCR Master Mix: PA-010
Specifically designed for instrumentation that does not require a reference dye:
BioRad CFX96, BioRad Opticon™, Opticon™ 2 & Chromo™ 4 (MJ Research)
Roche LightCycler® 480 System
Eppendorf mastercycler® ep realplex Instruments without ROX filter set
Catalog Number
Size
PA-010-4
For 4 ChIP PCR Array plates
PA-010-12
For 12 ChIP PCR Array plates
PA-010-24
For 24 ChIP PCR Array plates
Technical Support:
888.503.3187 (US)
9
301.682.9200
™
ChampionChIP PCR Arrays
2. 384-Well PCR Arrays: 96 x 4 Format
RT2SYBR® Green / ROX qPCR Master Mix: PA-012
Specifically designed for All ABI and Stratagene Instrumentation
Catalog Number
Size
PA-012-8
For 4 384-well ChIP PCR Array plates
RT2SYBR® Green / Fluorescein qPCR Master Mix: PA-011
Specifically designed for:
Instrumentation that requires the Fluorescein Reference Dye
Catalog Number
Size
PA-011-8
For 4 384-well ChIP PCR Array plates
RT2 SYBR® Green qPCR Master Mix: PA-010
Specifically designed for instrumentation that does not require a reference dye:
BioRad CFX384
Roche LightCycler® 480 System
Catalog Number
Size
PA-010-8
For 4 384-well ChIP PCR Array plates
D. Real-Time PCR instrumentation and other equipment:
1. For recommendations on specific Real-Time PCR instruments (thermal cyclers with
Fluorescent detection), see the list of master mixes and plate formats above.
2. Calibrated Multi-Channel Pipette.
3. DNase-free / PCR Grade water (H2O), pipette tips and tubes.
NOTE: The ChIP PCR Arrays can only be used in 96-well and 384-well Real-Time PCR
Instruments, PCR Arrays cannot be used in the Cepheid SmartCycler®, the Roche
LightCycler® 2.0 or the Corbett Research Rotorgene.
Technical Support:
[email protected]
10
www.SABiosciences.com
Version 1.1
IV. Protocol:
Preparing a DNase-free Workspace and avoiding DNA Contamination
For first time users it is recommended to read through the entire protocol before starting an
experiment. For experienced users a quick guide is included. ChIP-enriched genomic DNA
samples are usually limited in quantities and susceptible to degradations by DNases.
Maintaining a DNase-free environment is essential for successful and reproducible results.
For accurate and reproducible PCR results, it is very important to avoid contamination of
the assay with foreign DNA. Any DNA contamination will artificially inflate the SYBR Green
signal, yielding skewed profiles and/or false positive signals. The most common sources of
DNA contamination are the products of previous experiments spread into the air of your
working environment. Please follow the recommendations below on how to set up and
maintain a working environment free of DNA contamination.
1. Wear gloves throughout the procedure. Use only fresh PCR-grade reagents (H20) and
lab ware (tips and tubes).
2. Physically separate the workspaces used for PCR setup and post-PCR processing or
non-PCR operations. Decontaminate your PCR workspace and lab ware (pipette
barrels, tube racks, etc.) before each new experiment with UV light or 10% bleach to
render any contaminating DNA ineffective in PCR. Ultraviolet light will induce the
formation of thymidine dimers and bleach will chemically inactivate and degrade any
DNA.
3. Close all tubes containing PCR products once you are finished adding or removing
volumes. Before discarding any lab ware (tips or tubes) containing PCR products or
other DNA, treat these items with 10% bleach.
4. Do not leave lab ware (tubes and tip boxes) exposed to the air for long periods of time.
5. Do not open any post-PCR tubes/plates in the PCR setup working area. Opening
tubes/plates after the run can release PCR products into the air which will contaminate
and confound the results of future Real-Time PCR experiments.
Master Mix and Other ChIP-related Reagents Considerations
The performance of our ChIP PCR Arrays is only guaranteed with SABiosciences RT²
qPCR Master Mixes, ChampionChIP™ One-Day Kit and the ChampionChIP™ Antibody
Kit. Therefore, the use of the complete ChampionChIP™ system is absolutely essential
for obtaining optimal Real-Time PCR profiling results.
PCR Reagents
The chemically-modified and tightly controlled HotStart enzyme and other proprietary
chemical components in our RT2 qPCR Master Mixes ensure accurate SYBR Green based
PCR results by preventing the formation of primer dimers and other nonspecific PCR
products. They are also helpful in ensuring the high amplification efficiencies even for
Technical Support:
888.503.3187 (US)
11
301.682.9200
™
ChampionChIP PCR Arrays
genomic regions that are difficult to amplify. When we test other sources of enzymes with
our PCR Arrays, we frequently saw primer dimers and other non-specific products that
confound SYBR Green-based Real-Time PCR detection. Because each instrument uses a
different reference dye to normalize their optics, make sure that you select the correct
Master Mix for the Real-Time PCR instrumentation at your laboratory.
Chromatin Immunoprecipitation (ChIP)
The results from the ChIP PCR Array system are based on the efficient enrichment of
specific genomic loci using ChIP Assay. The ChampionChIP™ One-Day Kit is a simple
and robust ChIP preparation kit. It works with an optimized Immunoprecipitation buffer
system to improve efficiency and specificity of antibody binding to chromatin. More
importantly, the kit is specially developed to perform the reverse cross-linking and DNA
purification highly efficiently. Therefore the user will obtain high yields and high-quality ChIP
DNA free of inhibitors, greatly facilitating Real-Time PCR profiling.
ChIP-Grade Antibodies are a critical component of the system in order to ensure a
reliable ChIP PCR Array profiling. The ChampionChIP™ Antibody Kits provide ChIP-Grade
Antibodies that have been rigorously validated for specificity and efficiency of genomic DNA
enrichment associated with specific transcription factors, modified or unmodified histones,
or other nuclear factors. The positive and negative control PCR primer set, included in each
antibody kit, guarantee a successful enrichment of specific genomic loci. The positive
control PCR primer set detects enrichment of well-characterized binding site for the
relevant nuclear factor.
An optimization of the Immunoprecipitation conditions will be required if you follow your
own protocol and/or use a specific antibody of interest. In addition, a quantitative analysis
of ChIP-enriched DNA used for ChIP PCR Array will have to be performed. Further details
can be found in the ChIP Preparation and Quality Control section (page.13).
Technical Support:
[email protected]
12
www.SABiosciences.com
Version 1.1
A. ChIP Preparation and Quality Control:
For ChIP Preparations and Quality control follow instructions specify in the user manual
included in the ChampionChIP™ One-Day Kit and ChampionChIP™ Antibody Kits using
the primer set provided in the Antibody kit. If you follow your own protocol and/or use
another antibody of interest, you might find the following considerations useful.
ChIP Preparation
Definitions used in ChampionChIP System (See Figure 1 on Page 6)
ChIP Sample: Starting material for ChIP assay (tissue or cells).
NOTE: ChIP can be performed with a single ChIP sample (detection of protein/DNA
association in one condition), or multiple samples dependent on experimental
design, such as knockout vs. wild type; treated vs. untreated; or a time course.
ChIP Ready Chromatin:
Prepared chromatin after fragmentation step ready for
immunoprecipitation process.
IP Fraction: ChIP Ready Chromatin from each ChIP sample must be diluted, pre-cleared,
and divided into equal aliquots which are called IP fractions. Therefore an IP Fraction
represents the fraction of diluted and pre-cleared ChIP Ready Chromatin used for the
actual immunoprecipitation step with antibody of interest, control antibody normal (IgG) or
non-immune serum (NIS).
NOTE: One ChIP sample is sufficient for two or more IP fractions.
Input Fraction or Input: As an input control ~ 1% of IP Fraction from each ChIP Sample
is set aside before the Chromatin Immunoprecipitation step.
NOTE: One ChIP sample needs only one Input control.
Input DNA: Genomic DNA directly purified from Input fraction.
It provides a
measurement of the total number of interested genomic site(s) included into the IP fraction
and serves as reference control for Real Time PCR performance and data normalization.
IP DNA: Genomic DNA purified from IP fraction after immunoprecipitation with an antibody
of interest, or NIS/IgG.
Control Fraction (IgG/NIS/Mock Fraction): The fraction of chromatin mixed with normal
IgG or NIS that serves as negative control for ChIP-grade antibodies. Normal IgG or NIS
pulls down non-specific DNA, providing a measurement of the background or noise for the
ChIP system.
Antibody Fraction: The fraction of chromatin mixed with the antibody of interest to pull
down its associated genomic DNA sites. This provides an estimation of the number of
specific genomic sites bound or associated with the nuclear factor of interest in vivo.
Technical Support:
888.503.3187 (US)
13
301.682.9200
™
ChampionChIP PCR Arrays
ChIP DNA or ChIP DNA Sample: Input DNA or IP DNA used for PCR or other
downstream analysis.
1. Starting Material for Biological Experiment
The ChIP PCR Array yields reliable results with as little as one million cells per array
plate. However, the optimal amount of starting material depends on the relative
abundance of the protein-associated DNA and the enrichment efficiency of the ChIP
assay with the antibody of choice. Low amounts of starting material will affect the
efficiency of the ChIP enrichment. The high abundance of the protein-associated DNA
immunoprecipitated with highly efficient antibodies, such as anti-H3K4me3, H3K4me2
or H3ac, requires fewer cells, but no less than 0.5 million cells. Lower amounts of
starting material will yield a smaller number of positive calls and will increase false
negative calls.
On the contrary, lower abundance of the protein-associated DNA or lower efficient
antibodies will require more cells. A high amount of starting material will yield a greater
number of positive calls though it will also increase background levels and possibly
generate more false positive calls.
In general it is recommended that at least one million mammalian cells are required for
each IP fraction (as defined above). For example, a 10-cm culture dish of HeLa cells at
70-85% confluence contains approximately 4 to 6 million cells. This amount of cells is
sufficient for three up to five ChIP fractions after carefully harvesting the cell lysate
following cross-linking step.
NOTE: The actual amounts of cell or tissue samples required to produce high quality,
quantitative results may need to be determined empirically for each experiment. Once
determined, this amount should be applied uniformly for all samples within an experiment
for a consistent performance.
2. Cross-linking and Chromatin Preparation
Follow the recommendation in your ChIP kit or follow your own protocol.
For Native ChIP (without cross-linking) using antibodies of interest, or preparation of
enzyme digested chromatin, follow the instructions in the related protocols.
3. Chromatin DNA Fragmentation by Sonication
For the best balance between resolution, sensitivity and IP efficiency, it is
recommended to fragment the chromatin DNA to an average size between 500 and
1500 base pairs as judged by agarose gel electrophoresis. As shown in Figure 3, the
reverse cross-linking and genomic DNA isolation are required for validation of the ChIP
fragments. Follow the recommendations specified in your ChIP kit or follow your own
protocol. The size of chromatin fragments sheared by an enzyme should be controlled
as well to ensure good results during the PCR amplification step.
Technical Support:
[email protected]
14
www.SABiosciences.com
Version 1.1
Lane: 1
2
3
4
1,000 (bp)
500 (bp)
Figure 3. Characterization of Chromatin Fragmentation. The fast cross-linking reverse method
provided in the ChampionChIP™ One-Day Kit permits the analysis of sonicated samples by agarose
gel electrophoresis in less than 1 hour. Lanes: (1) 1.0 kb ladder; (2) Chromatin before sonication; (3)
Sonicated chromatin after reverse cross-linking and DNA extraction following the ChampionChIP™
One-Day Kit User Manual; (4) Sonicated chromatin before reverse cross-linking and DNA extraction.
4. Immunoprecipitation (Multiple IP Fractions per Sample)
The ChIP Ready Chromatin from one ChIP sample will generate the following IP
fractions:
Input Fraction: One Input fraction for each ChIP sample (experimental sample)
IP fraction: Two or more IP fractions for each ChIP sample. Each IP fraction requires
the ChIP-Ready Chromatin from one million cells. Divide the ChIP-Ready Chromatin
accurately and evenly into the follow equal IP fractions:
Control Fraction = IgG/NIS (required)
Ab Fraction (at least one required)
Anti-RNA Polymerase II Antibody (optional)
The Pol II Antibody is used as a positive control for a successful ChIP assay in
combination with the ChIP PCR primers for the GAPDH proximal promoter. This fraction
can also provide a measurement of the transcriptional activity when used with other
proximal promoter ChIP PCR Assays.
5. Reverse Cross-Linking
Follow the recommendations in your ChIP kit or follow your own protocol.
6. DNA Purification
Technical Support:
888.503.3187 (US)
15
301.682.9200
™
ChampionChIP PCR Arrays
Follow your previously used methodology or the recommendations in your ChIP kit. Adjust
the final volume of each ChIP DNA sample to 200-ȝL using the elution buffer provided or
DNase free H20. The quality of the genomic DNA from ChIP DNA sample can be
determined in the following section.
ChIP DNA Quality Control
1. Specificity and Efficiency of ChIP Enriched DNA
The results of ChIP Array are dependent on the DNA quantity enriched by ChIP Assay, and
most importantly, on the specific localization of these enriched DNA bound to transcription
factors, or associated with modified histones. For example, it is well defined that many
modified histone marks have distinct distribution patterns associated with either
transcriptionally active euchromatin, or transcriptionally inactive euchromatin, or
heterochromatin. SAbiosciences provides a panel of Real-Time PCR primers for a
complete and reliable analysis of the histone modifications that regulate chromatin structure
and influence gene activity (Figure 4).
The results of the ChIP Array are dependent on the quantity of DNA enriched by the ChIP
Assay. In particular, the amount of enriched DNA at specific genomic loci is directly related
to the specificity and efficiency of the antibody used. It is well known that many modified
histone markers have distinct distribution patterns associated with transcriptional active
euchromatin, transcriptional inactive euchromatin, or heterochromatin. For a reliable
analysis of the histone modifications distribution a control panel of Real-Time PCR
primers was developed targeting different genomic loci associated with transcriptional
active, inactive and silenced genomic regions. With these controls, the specificity and
efficiency of ChIP DNA enrichment can be reliably analyzed (Figure 4). For details, please
check our website: http://www.sabiosciences.com/chipgradeantibody.php.
Technical Support:
[email protected]
16
www.SABiosciences.com
Version 1.1
25
Active Gene
Percent Input
20
Inactive Gene
GAPDH
RP30
ALDOA
15
Heterochrom atic Region
SAT2
Sata
IGX1A
MYOD1
SERPINA
10
5
0
H3K4me3
H3K27me3
H3K9me3
Control IgG
Figure 4. Histone Modifications and Gene Activity. Antibodies from ChampionChIP Antibody Kits against
modified histones (H3K4me3, H3K27me3, and H3K9me3) or control IgG were used for chromatin
immunoprecipitation from HeLa cells following the instructions specified in the User Manual. Each ChIP DNA
sample was analyzed by Real-Time PCR using primers specific for the transcriptional active genes (GAPDH,
RPL30 and ALDOA), transcriptional inactive genes (MYOD1, SERPINA1), silenced repeats (SAT2, SatD) and
an open reading frame (ORF) free region (IGX1A). The results are shown as the percentage of coprecipitated DNA relative to the input DNA. The antibodies against H3K4me3, H3K27me3, and H3K9me3
specifically enrich genomic DNA at actively transcribed euchromatin, transcriptional inactive euchromatin, or
silent heterochromatic region respectively. In contract, the control IgG showed minimum background among
all the regions analyzed, demonstrating the efficiency and specificity of the ChIP Assay on genomic DNA
enrichment.
2. Primer Sets for ChIP DNA enrichment QC
The primers sets listed below are designed for ChIP DNA associated with modified Histone
antibodies, such as H3ac, H3acK9, H4ac, H3K4me2,3, H3K9me1,2,3, H3K27me3,
H4K20me2,3, H2K79me3. Additional control primer sets are available for the Human and
Mouse genome at http://www.sabiosciences.com/chipgradeantibody.php.
HUMAN
MOUSE
Gene
Tile
Active Gene
GAPDH
+1
GPH10001C(+)01A
GPM050651(+)01A
Inactive Gene
MYOD1
+1
GPH10002C(+)01A
GPM038008(+)01A
Heterochromatin
SAT2
+1
Heterochromatin
IAP
+1
GPH10003C(+)01A
GPM00002C(+)01A
3. ChIP DNA Quantity Needed for Real-Time PCR QC Analysis.
A typical ChIP Assay yields 100 to 200 µL of IP DNA. The fold enrichment is independent
of the volume of ChIP DNA used as a template in the Real-Time PCR assay, provided that
the ChIP DNA samples are of high quality and free of PCR inhibitors (Figure 5). For QC
Technical Support:
888.503.3187 (US)
17
301.682.9200
™
ChampionChIP PCR Arrays
analysis, we recommend starting with 1/100th ( 2 µL) of purified ChIP DNA from either IP or
Input faction a 25 µL Real-Time PCR Assay ( 96-Well format), or 1/200th( 1 µL) for a 10 µL
Real-Time PCR Assay (384-Well format).
Figure 5. ChampionChIP One-Day Kit ChIP DNA Free of Inhibitors of Real-Time PCR. ChIP Assay was
performed with either RNA Polymerase II, or Control IgG using ChampionChIP One-Day Kit and RNA
Polymerase II antibody Kit. Different volume (0.5, 1.0, 2.0, and 4.0 µL) of Input DNA (diamonds), and IP DNA
from either Pol II IP (circles) or IgG IP (triangles) were added to a Real-Time PCR assay using primers for
the proximal promoter region of GAPDH. The calibration curve is generated based on the threshold cycle
values. The data was fitted according to a linear regression model resulting in an R2 of 0.9898 indicating a
straight line. This implies that no inhibitors are present in the ChIP DNA preparations. Since the fold
enrichment reflected by the Ct difference is no significant variation among the samples from different
volumes, the results also demonstrate the reliability of the ChampionChIP System.
B. Performing Real-Time PCR:
Important considerations before starting PCR reaction
x For consistent results, use the same Real-Time PCR instrument to generate all the
data within a single experiment.
x
The use of SABiosciences’ RT2 Real-Time™ SYBR Green PCR Master Mixes is
absolutely critical for obtaining accurate results from the ChIP PCR Array. Be sure to
use the correct master mix for your instrument before continuing with this protocol
(See Pages 9 and 10).
x
The use of the correct ChIP PCR Array plate format is also critical to the success of
this experiment. Be sure that you have the correct PCR Array format for your
instrument before continuing with this protocol (See Page 8).
x
The accuracy and precision of your pipetting will determine the consistency of your
results. Be sure that all of your micro-pipettors are calibrated before beginning this
procedure. Also, make sure not to introduce any bubbles into the wells of the PCR
Array. Spin plate down before starting PCR.
x
Do not use DEPC treated H2O. Use high-quality, nuclease-free H2O. If you are not
sure whether you’re RNase, DNase-free water has been DEPC treated, please
check with the supplier.
Technical Support:
[email protected]
18
www.SABiosciences.com
Version 1.1
Step 1: Sample Preparation
Mix the following components in a 5-ml tube or a multi-channel reservoir:
Plate Format:
2X SABiosciences RT2 qPCR Master Mix
ChIP DNA Sample
96-well
A, C, D, & F
384-well
E&G
1275 Pl
550 Pl
180 Pl
DNase free ddH2O
1095 Pl
100 Pl
450 Pl
Total Volume
2550 Pl
1100 Pl
NOTES:
1. This recipe provides an excess volume of ONLY ~ 150 ȝL(96-well format), or 140
ȝL (384-well format) per ChIP DNA sample. Very carefully add the cocktail to the
PCR Array precisely as described below to insure that each well receives the
required volume.
2. Save the remainder of the ChIP DNA at -20°C for troubleshooting purposes.
Step 2: Loading for the 96-Well PCR Arrays (Formats A, B, C, and D)
Please select your PCR Array Format for loading instructions.
Loading the 96-Well PCR Array Formats A, C, D, or F:
a. CAREFULLY remove the PCR Array from its sealed bag.
b. Add 25 ȝL of the Experimental Cocktail to each well of the PCR Array, preferably
from a reservoir with an eight-channel pipettor (or a twelve-channel pipettor but only
using eight tips). Change pipet tips following each addition to avoid any crosscontamination between the wells or reactions.
c. Proceed to the next section (STEP 3) on “Performing Real-Time PCR Detection”.
Loading for the 384-Well PCR Array (Format E):
Each 384-well plate characterizes four samples in separate sets of 96-wells staggered from
one another by only one well. The spacing between the tips of standard multi-channel
pipettors will allow you to properly skip rows or columns when adding each sample. Be sure
to load each sample into the correct set of wells. Use Figure 6 as a guide.
a. CAREFULLY remove the PCR Array from its sealed bag.
b. Load sample cocktails to appropriate wells of the PCR Array, preferably from a
reservoir with an eight- channel pipettor (or a twelve-channel pipettor but only using
eight tips), using the provided 384EZLoad™ Covers (Catalog #PA-384) and the
figure below as a guide.
Technical Support:
888.503.3187 (US)
19
301.682.9200
™
ChampionChIP PCR Arrays
x
Place Cover #1 (white) on the plate. Add 10 ȝL of Sample 1 cocktail to the open
wells. (Odd number wells of rows A, C, E, G, I, K, M & O). Remove & discard the
cover.
x Place Cover #2 (yellow) on the plate. Add 10 ȝL of Sample 2 cocktail to the open
wells. (Even number wells of rows A, C, E, G, I, K, M & O). Remove & discard the
cover.
x Place Cover #3 (black) on the plate. Add 10 ȝL of Sample 3 cocktail to the open
wells. (Odd number wells of rows B, D, F, H, J, L, N & P). Remove & discard the
cover.
Place Cover #4 (red) on the plate. Add 10 ȝL of Sample 4 cocktail to the open wells. (Even
number wells of rows B, D, F, H, J, L, N & P). Remove & discard the cover.
c. Proceed to the next section (STEP 3) on “Performing Real-Time PCR Detection”.
Sample #1
Sample #2
Sample #3
Sample #4
Figure 6: Loading Cocktail into a 384-well PCR Array. To load a 384-well format PCR Array, add 10 ȝL
of the Experimental Cocktail from each numbered sample into the staggered wells with the same number as
indicated in the figure.
Technical Support:
[email protected]
20
www.SABiosciences.com
Version 1.1
Step 3: Performing Real-Time PCR Detection
Be sure to follow the manufacturer’s instructions for the proper operation and maintenance
of your Real-Time instrument.
a. CAREFULLY but tightly seal the PCR Array with the optical thin-wall 8-cap strips
(Formats A and D) or with the optical adhesive film (Formats C, E, F, and G).
b. Centrifuge the plate for 1 full minute at room temperature at 1000 g to remove air
bubbles. Visually inspect the plate from underneath of the plate to ensure no
bubbles are present in each well.
Bubbles remaining in the bottom of the wells of a PCR Array will interfere with
results.
c. Place the plate on ice while setting up the PCR cycling program below.
d. Place one plate in your Real-Time thermal cycler. If recommended by your
instrument’s user manual, use a compression pad with the optical film-sealed plate
formats.
NOTE: ChIP PCR Arrays containing experimental cocktail may be stored at -20°C wrapped
in aluminum foil for up to one week until ready to run.
e. Enter and run the appropriate program for your Real-Time instrument (below). If
prompted by your instrument software, select “Absolute Quantitation” to begin.
NOTE: For additional help with instrument setup, see our Instrument-Specific Setup
Instructions and Protocol Files at: www.SABiosciences.com/pcrarrayprotocolfiles.php
Use a two-step cycling program for the following instrumentation:
ABI: 5700, 7000, 7300, 7500, 7700, 7900HT Cycles
BioRad: iCycler, iQ5, MyiQ
1
Stratagene: Mx3000p, Mx3005p, Mx4000p
Eppendorf: Mastercycler ep realplex
40
Duration
Temperature
1
10 minutes
15 seconds
95 °C
95 °C
1 minute2
60 °C
Use an extended two-step cycling program for the following instrumentation:
Roche*: LightCycler 480
Cycles
Duration
Temperature
1
1
10 minutes
15 seconds
95 °C
95 °C
45
1 minute2
60 °C
*Attention Roche LightCycler 480 Users: Adjust the ramp rate to 1°C/sec. Please refer
to the Instrument Setup Guide at http://sabiosciences.com/pcrarrayprotocolfiles.php
for more information on other REQUIRED changes to settings for Melt Curve Acquisition.
Technical Support:
888.503.3187 (US)
21
301.682.9200
™
ChampionChIP PCR Arrays
Use a three-step cycling program for the following instrumentation:
ABI: StepOnePlus
BioRad: CFX96, CFX384, Opticon,
Opticon 2, Chromo 4 (MJ Research)
Takara: TP-800
All other instruments
Cycles
1
40
Duration
Temperature
1
10 minutes
15 seconds
30 to 40
seconds2,3
30 seconds
95 °C
95 °C
55°C
72°C
1
The 10-minute step at 95°C is required to activate the HotStart DNA polymerase.
Detect and record SYBR Green fluorescence from every well during the annealing step of
each cycle.
3
Different instruments need different lengths of time to detect the fluorescent signal.
Choose the appropriate time for the annealing step (55°C) for your instrument.
2
C. PCR Data Acquisition & Quality Assessment
Calculate the threshold cycle (Ct) for each well using the instrument’s software. Please
consult the instrument user manual or contact the manufacturer’s technical support
department for further directions.
1. Baseline Cycle Range Selection
To define the Baseline, choose the Automated Baseline option if your instrument has
the Adaptive Baseline Function (check with instrument manual or manufacturer, if
unsure). If it does not have the adaptive baseline function, you will need to set the
baseline manually. Use the Linear View of the amplification plots to determine the
earliest visible amplification. Set the instrument to use the readings from cycle number
two (2) through two (2) cycles before the earliest visible amplification, but no more than
cycle 15. The earliest amplifications usually will be visible between cycles 14 and 18.
2. Threshold Fluorescence Value Selection
Manually define the Threshold Value by using the Log View of the amplification plots
and place it above the background signal but within the lower one-third to lower one-half
of the linear phase of the amplification plot.
*IMPORTANT: Ensure that the thresholds are the same across all ChIP PCR Array
runs in the same analysis. The absolute position of the threshold is less critical than its
consistent position across arrays. If the ChIP DNA sample quality has been adequately
controlled, the cycling program has been executed properly, and the thresholds have
been defined correctly, then the Ct value of the Positive PCR PPC should be 20 ± 2
across all of your arrays or samples. If not, see the Troubleshooting and FAQ section.
3. Real-Time PCR Data Read out
Technical Support:
[email protected]
22
www.SABiosciences.com
Version 1.1
Export the resulting Ct values for all wells from your instrument to a blank Excel
spreadsheet and save for use with the SABiosciences ChampionChIP PCR Array Data
Analysis Template Excel or Web-based Utilities (See Section D. Data analysis).
NOTE: Save the PCR settings as an instrument file for next time performance (when
possible).
4. Recommended Real-Time PCR Quality Assessment:
a. Amplification Curve Shape. The Baseline Cycle Range for all reactions
should have a constant (flat) low level of fluorescence in the Linear View of
the amplification curve. In the log-scale view, the slopes, and therefore the
amplification efficiencies, of all assays should also be parallel to each other to
be comparable.
b. Dissociation (Melting) Curve. Confirm that each reaction produces a single
specific product as indicated by a single Dissociation Curve peak at a melting
temperature (Tm) greater than 75 °C. Also confirm that the peak Tm values
are within 1.0 °C of each other for all reactions with the same ChIP PCR
primer. For instrument-specific melt curve analysis settings, please refer to
the corresponding Instrument Setup Guide for your instrument at:
http://sabiosciences.com/pcrarrayprotocolfiles.php
General Protocol for a melting curve:
Run a melting curve program immediately after the above cycling program, and generate a
first derivative dissociation curve for each well in the entire plate using your instrument’s
software. No more than one peak should appear in each reaction at temperatures greater
than 80°C. If your instrument does not have a default melting curve program, run the
following program instead:
95°C, 1 min; 65°C, 2 min (OPTICS OFF); 65°C to 95°C at 2°C / min (OPTICS ON).
NOTES:
1. If you decide not to obtain the dissociation curve immediately, save the plates
wrapped in aluminum foil at -20°C as is, in case you need to perform this operation
at a later point in time for troubleshooting purposes. When ready, simply warm the
plate to room temperature, place it into your Real-Time instrument, and run the
melting program described above.
2. Be sure to visually inspect the plate after the run for any signs of evaporation from
any of the wells. If evaporation is observed, make a note of which wells so that you
may qualify your data analysis appropriately.
DO NOT open any previously run and stored PCR Array plate. Removing the thin-wall 8cap strips or the adhesive film from PCR Arrays releases PCR product DNA into the air
where it will contaminate and confound the results of future Real-Time PCR experiments.
See also the Note on “Preparing a Workspace Free of DNA Contamination”.
Technical Support:
888.503.3187 (US)
23
301.682.9200
™
ChampionChIP PCR Arrays
D. ChIP PCR Array Data Analysis:
ChampionChIP PCR Array Data Analysis
The Excel-based ChIP PCR Array Data Analysis template provides a guideline and
template for automatically performing the calculations and interpretation of the control wells
upon including threshold cycle data from a Real-Time PCR instrument. The ChIP PCR
Array Data Analysis tool presents the results in a tabular format, a scatter plot, a threedimensional profile, and a volcano plot (when replicates are included). Download our free
Excel–based ChIP PCR Array Data Analysis template available for 96-well and 384-well
format at: http://sabiosciences.com/chipqpcrdataanalysis.php
Excel-Based ChIP PCR Array Data Analysis
1. Download the Excel-based ChIP PCR Array Data Analysis Templates by Clicking
on the above URL.
2. Save and rename the Excel file to your local computer. Paste in your Ct values and
the results will be generated automatically.
3. View and analyze the results by simply following the guidelines specified in the
“Instruction” worksheet of the Excel template.
NOTE: The ChIP PCR Array Data Analysis Template automatically changes all Ct values
reported as greater than 35 or as N/A (not detected) to 35. At this point, any Ct value
equal to 35 is considered a negative call.
How to Calculate the Percentage Enrichment?
ChIP results are reported for three levels of genomic site occupancy depending on the
experimental question(s) asked: % Input Enrichment, Fold Enrichment and Fold
Difference (Differential Occupancy). The first two are specific characteristics of a single
sample while the “Fold Difference (Differential Occupancy)” is a comparison across
multiple samples from different experimental conditions.
When using Real-Time PCR for the analysis of ChIP DNA samples, all results can be
calculated using the ¨¨Ct method. This is valid because all Ct values for one genomic site
are determined from the same PCR primer assay (unlike mRNA measurements which are
normalized with various PCR primer assays). To account for chromatin preparation
differences between samples, input normalized values for every IP fraction should be
used for the calculation of genomic site occupancy.
When the Ct values of the Control reactions (Control, NIS or Mock IP) are > 35 cycles the
reproducibility by qPCR is low due to the high level of variation introduced by stochastic
effects on the inverse exponential function of PCR in this low template concentration
range. Thus the Fold Enrichment values from ChIP PCR do not provide a reliable
Technical Support:
[email protected]
24
www.SABiosciences.com
Version 1.1
measure for cross sample comparison. Therefore, SABiosciences recommends using
input normalized values (% Input Enrichment) for all calculations.
Step by step analysis
1. To account for chromatin sample preparation differences normalize each IP DNA
Ct value to its Input DNA Ct value for the same PCR Assay in every ChIP sample.
¨Ct [Normalized IP] = (Ct [IP] - (Ct [Input] - Log2 (Input dilution factor))
The default Input dilution Factor is 1%, which corresponds with dilution factor of
100 or 6.644 cycles (i.e. log2 of 100).
2. Calculate the % Input (Before Normalized Enrichment) for each IP DNA (linear
conversion of the Normalized IP ¨Ct).
% Input = (2 (-¨Ct [Normalized IP])) x 100%
3. Calculate the % Input Enrichment (Specific Enrichment) by subtracting the %
Input of the control IP (% Input [con]) from the % Input of Antibody IP (% Input
[Ab]).
% Input Enrichment = % Input [Ab] - % Input [con]
4. Background adjust the Ab IP DNA Ct values by subtracting the input normalized
Control IP DNA Ct values from input normalized IP Ct values (first ¨¨Ct).
¨¨Ct [IP] = ¨Ct [normalized IP] - ¨Ct [normalized Con]
5. The Fold Enrichment of a sample is calculated by the linear conversion of the
background adjusted first ¨¨Ct).
Fold Enrichment = 2 (-¨¨Ct [IP])
6. The difference in fold enrichment for each gene across two ChIP PCR Arrays (or
groups) can be determined by dividing the fold difference of group 1 by the fold
difference of group 2.
Fold Difference = Fold Enrichment G2 / Fold Enrichment G1
= 2 (¨¨Ct [IP] S2 - ¨¨Ct [IP] S1)
Where group 1 (G1) is the control and group 2 (G2) is the experimental group
OPTIONAL: If the fold-change is greater than 1, then the result may be reported as a fold
up-regulation. If the fold-change is less than 1, then the negative inverse of the result may
be reported as a fold down-regulation. The fold-change ratios may also be reported as it is.
Technical Support:
888.503.3187 (US)
25
301.682.9200
™
ChampionChIP PCR Arrays
Reproducibility of ChIP PCR Array & Positive PCR Control (PPC)
Examine the Ct values of the PPC reaction. Any impurities in your ChIP DNA samples
which affect the PCR amplification of the positive control will also affect the PCR
amplification for the ChIP DNA samples.
1. The average Ct value of PPC should be 20 ± 2 on each PCR Array and should not
vary by more than two cycles between PCR Arrays.
2. The differences in average Ct PPC values between samples indicate the presence of
different amounts of PCR amplification inhibitors in each ChIP DNA sample.
3. An average PPC Ct value consistently greater than 22 for all of your samples may
indicate a problem with the cycling conditions or may simply be indicative of the
relative sensitivity of your instrument. See the Troubleshooting and FAQ section.
Reliability of ChIP PCR Array
1. Genomic DNA Input Control (IGX1A):
Within the right PPC Ct range, the IGX1A Ct value of the Input fraction from each
experimental sample should be 27.5 ± 1 assuming that the experiment was set up with
one million cells.
a. If the IGXA Ct value is > 30, it usually indicates that the amount of starting
chromatin for the ChIP Assay was too low and/or that the recovery efficiency of
ChIP DNA from the reverse cross linking and DNA purification is too low. This may
result in a decreased number of positive calls and increased false negative calls.
(See page 13 “ChIP Preparation”).
b. If the IGXA Ct value is < 24, it usually indicates that too much starting material for
the ChIP Assay was used, which may cause an increased background and false
positive calls (See page 13 “ChIP Preparation”)
c. No action is needed when the IGXA Ct value of the Input fraction is within the
range of 24 to 30.
2. Ct and "% Input" values of the ChIP Fractions:
Input Fraction:
a. Individual Input Ct value (Ct [Input]) is generally < 30. Numbers are listed within the
"calculations" worksheet.
b. The Average Ct Input (Ct [Input] Ave.) must be < 30. Numbers are listed within the
"QC Report" worksheet.
c. The difference of Ct [Input] Ave. among each group at the "QC Report" worksheet
should be within a reasonable range, generally the difference of Ct [Input] Ave. <
1.585 (equal to 3 fold difference of the Input Fraction).
Technical Support:
[email protected]
26
www.SABiosciences.com
Version 1.1
Control IP Fraction (IgG/NIS/Mock):
a. Individual Control Ct value (Ct [Con]) in the "calculations" worksheet should be Ct
[Con] < 32, or > Ct [Input] t +2.
b. The average Ct [Con] or (Ct [Con] Ave.) in the "QC Report" worksheet should be
within a reasonable range; generally Ct [Con] < 32, or Ct [Input] +2.
c. Most importantly, the individual “% Input [Con]” (IgG/NIS/mock background level)
in "calculations" worksheet should be in general < 0.1%l.
Specific IP Fractions (Antibodies of choice):
The specific IP Ct value (Ct [Ab]) for each genomic site is variable and depends on the
experimental samples and antibody quality. Nevertheless the Ct [Ab] value indicates
the enrichment of the genomic DNA by ChIP.
a. The closer the Ct [Ab] values equal Ct [Con], the less enrichment is achieved.
b. The Ct [Ab] average may be used to evaluate the enrichment over the panel of
genomic sites on the Array.
c. Most importantly if % Input [Ab] > 0.1%, and /or % Input [Ab] - % Input [Con] >
0.01%, it indicates possible enrichment. If % Input [Ab] < 0.1%, and /or % Input
[Ab] - % Input [Con] < 0.01%, it indicates no enrichment with that specific
antibody.
NOTE: The ChIP PCR Array Data Analysis Template automatically replaces all subtraction
values (% Input [Ab] - % Input [Con]) reported as less than 0.01% or as N/A (not detected)
to 0.01%. At this point, the value of any “% Input [Ab]” that equals to 0.01% is considered
as a negative call, in other words no enrichment.
Technical Support:
888.503.3187 (US)
27
301.682.9200
™
ChampionChIP PCR Arrays
VI. Troubleshooting and FAQs
Please check the "QC Report" worksheet of ChampionChIP PCR Data Analysis Template
for the details.
If you have additional questions, please check our website (www.sabiosciences.com) for
a more complete listing of Frequently Asked Questions (FAQs), or call our Technical
Support Representatives at 1-888-503-3187 or 301-682-9200.
Technical Support:
[email protected]
28
www.SABiosciences.com
Version 1.1
Appendix: ''Ct Data Analysis Method &
Bibliography
Detailed Mathematical Explanation of ¨¨Ct Data Analysis Method
Due to the inverse proportional relationship between the threshold cycle (Ct) and the
original amount of template DNA, as well as the doubling of the amount of product with
every cycle, the original amount of template DNA (L) in each ChIP fraction is expressed as:
To control for variation from ChIP fraction to ChIP fraction, the amount of each promoter
region of interest in the initial chromatin fraction (Input) provides a convenient normalization
factor by establishing the number of genome equivalents present in each initial chromatin
fraction. Because the Input DNA fraction only represented one percent of the total material,
the Input Ct value is adjusted for this dilution factor by subtracting 6.6 cycles. The ratio of
specific IP over Input provides the fraction of the nuclear factor sites pulled down by the IP
target factor. Divide the amount of DNA template in the IP fraction by the amount of DNA in
the Input fraction to determine the fraction of sites recovered in the IP fraction.
To determine fold-change in fraction enrichment caused by the experimental conditions and
nuclear factor activation, the normalized amount of the nuclear factor(s) of interest at the
promoter region(s) of interest in the experimental sample is divided by the corresponding
normalized amount in the control sample.
Technical Support:
888.503.3187 (US)
29
301.682.9200
™
ChampionChIP PCR Arrays
NOTES
Technical Support:
[email protected]
30
www.SABiosciences.com
Version 1.1
NOTES
Technical Support:
888.503.3187 (US)
31
301.682.9200
ChampionChIP™ PCR Array User Manual
Part #1051A
Version 1.1
10/20/2009
BIOMOL GmbH
Waidmannstr. 35
22769 Hamburg
[email protected]
www.biomol.de
Phone:+49-40-8532600 or 0800-2466651 (D)
Fax: +49-40-85326022 or 0800-2466652 (D)