1
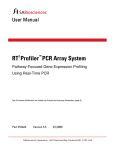
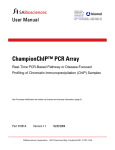
BIOMOL GmbH Waidmannstr. 35 22769 Hamburg [email protected] www.biomol.de Phone:+49-40-8532600 or 0800-2466651 (D) Fax: +49-40-85326022 or 0800-2466652 (D) User Manual ChampionChIP™ qPCR Primers Quantitative Real-Time PCR Analysis of Chromatin Immunoprecipitation See Purchaser Notification for limited use license and warranty information (page 3). Part #1028A Version 1.2 9/12/2008 ChampionChIP qPCR Primers Quantitative Real-Time PCR Analysis of Chromatin Immunoprecipitation User Manual (For Catalog Numbers Prefixed by: GPH, GPM, GPR) Ordering and Technical Service Contact Information: • • • • BIOMOL GmbH Waidmannstr. 35 22769 Hamburg [email protected] www.biomol.de Phone:+49-40-8532600 or 0800-2466651 (D) Fax: +49-40-85326022 or 0800-2466652 (D) Tel: 1-888-503-3187 (US) 301-682-9200 (outside US) Fax: 1-888-465-9859 (US) 301-682-7300 (outside US) On-line Order: www.SABiosciences.com E-MAIL: order@ SABiosciences.net To place an order support@ SABiosciences.net For technical support) You may place orders by fax, e-mail or from our website. Each order should include the following information: • • • • • Your contact information (name, phone, email address) Product name, catalog number and quantity Purchase order number or credit card information (Visa or MasterCard) Shipping address Billing address For more information, visit us at www. SABiosciences.com SABiosciences Corporation 6951 Executive Way Frederick, MD 21703 USA CONTENTS I. Background and Introduction 4 II. Materials Provided 6 III. Additional Materials Required 6 IV. Complementary Products 7 V. Protocol 8 A. ChIP DNA Sample Preparation Considerations 9 B. Performing the ChIP-qPCR Assays 11 C. Data Analysis 14 VI. Troubleshooting 17 Appendix: ∆∆Ct Data Analysis Method & Bibliography 19 LIMITED PRODUCT WARRANTY This product is intended for research purposes only and is not intended for drug or diagnostic purposes or for human use. This warranty limits our liability to replace this product in the event the product fails to perform due to any manufacturing defect. SABiosciences Corporation makes no other warranties of any kind, expressed or implied, including without limitation, warranties of merchantability or fitness for a particular purpose. SABiosciences Corporation shall not be liable for any direct, indirect, consequential or incidental damages arising out of the use, the results of use or the inability to use this product. NOTICE TO PURCHASER The purchase of ChampionChIP qPCR Primers includes a limited, nonexclusive license to use the kit components for research use only. This license does not grant rights to use the kit components for reproduction of any primer pair mix, to modify kit components for resale or to use ChampionChIP qPCR Primers to manufacture commercial products without written approval of SABiosciences Corporation. No other license, expressed, implied or by estoppels, is granted. U.S. patents may cover certain isolated DNA sequences included in the ChampionChIP qPCR Primers. Presently, it is not clear under U.S. laws whether commercial users must obtain licenses from the owners of the rights to these U.S. patents before using ChampionChIP qPCR Primers. 3 ChampionChIP qPCR Primers I. Background and Introduction The end-point polymerase chain reaction (PCR) has been the cornerstone for detecting chromatin immunoprecipitation (ChIP) DNA. However, this method requires post-PCR gel electrophoresis, photography, and manual image quantification while acquiring only semiquantitative binding enrichment results. Real-time PCR (qPCR) is easier to use and provides greater sensitivity, a wider dynamic range, and more quantitative results than end-point PCR. Unfortunately, genomic DNA sequence complexity confounds the design of specific and reliable qPCR assays for ChIP analysis. We have developed specific and efficient ChIP-qPCR Assays for promoter activation analyses and other ChIP applications. Pre-designed ChampionChIP qPCR Primers are available to tile all human, mouse and rat promoters in the NCBI RefSeq database from -20 kb to +10 kb relative to their transcriptional start site (TSS). Our average one kb tile interval strikes a balance between resolution and sensitivity for screening individual nuclear or transcription factor binding sites within the tiled promoter region. These tiling assays are especially useful for ChIP-onchip microarray validation by permitting rapid qPCR measurements for a large number of binding regions. The use of qPCR in these assays also provides a more accurate determination of the non-immune IP background, the input genomic DNA material, and the differential occupancy of the promoter region of interest – all at the same time. See Figure 1 for an overview of the recommended ChampionChIP qPCR Primers procedure. The ChampionChIP qPCR Primers are specifically optimized for SYBR® Green real-time PCR detection. We use an advanced primer design algorithm and experimentally validate each assay to insure amplicon specificity and greater than 90 percent amplification efficiency. To guarantee optimal real-time PCR assay performance, the use of our RT2 qPCR Master Mixes is required. We have formulated and tested these master mixes together with our ChIP-qPCR Assays to provide uniform assay performance under standardized cycling conditions. Each instrument-specific master mix contains SYBR Green and the appropriate reference dye to match the instrumentation available in your laboratory. RT2 qPCR Master Mixes are available for ABI, Bio-Rad, Stratagene, Eppendorf, Roche and other major real-time PCR instruments. Benefits of the ChampionChIP qPCR Primers: Speed and Ease: Standardized, quantitative, and higher-throughput SYBR Green real-time PCR to measure enrichment at multiple sites simultaneously. Profile more promoter regions at one time in the same ChIP sample preparation. Save Time and Money: Optimized and ready-to-use assays eliminate assay design trial-anderror allowing more target binding sites to be tested. Guaranteed qPCR Performance: High amplification efficiency and specificity guaranteed. More accurately quantify all ChIP DNA fractions simultaneously. Comprehensive Coverage: Tiled assays are available for every human, mouse or rat gene promoter. Facilitates rapid validation of promoter tiling ChIP-on-chip results. Technical Support: [email protected] 4 www.SABiosciences.com Version 1.2 Figure 1: Overview of the ChampionChIP qPCR Primers procedure. Technical Support: 888.503.3187 (US) 5 301.682.9200 ChampionChIP qPCR Primers II. Materials Provided: ChampionChIP qPCR Primers, forward and reverse primers in one tube, enough for 200 25-μL reactions (10 µM each primer) Storage Conditions: The ChIP-qPCR Assays are shipped at ambient temperature but must be stored at - 20 °C upon receipt, where they are guaranteed for 6 months. III. Additional Materials Required: A. ChampionChIP One-Day Kit Catalog Number GA-101 B. ChampionChIP Antibody Kit OR other ChIP-Grade antibody of choice C. SABiosciences’ RT2 qPCR Master Mix MANDATORY for a Complete and Successful Experiment Be sure to pick the correct one for the instrumentation in your laboratory. RT2 SYBR Green / ROX qPCR Master Mix: Specifically designed for: All ABI and Stratagene Instrumentation Eppendorf Mastercycler® ep realplex Instruments with ROX filter set Catalog Number Size PA-012 For 200 25-µl reactions (2.5 ml) PA-112 For 2000 25-µl reactions (25 ml) RT2 SYBR Green / Fluorescein qPCR Master Mix: Specifically designed for BioRad iCycler®, MyiQ®, and iQ5 Instrumentation Catalog Number Size PA-011 For 200 25-µl reactions (2.5 ml) PA-111 For 2000 25-µl reactions (25 ml) 2 RT SYBR Green qPCR Master Mix: Specifically designed for instrumentation that does not require a reference dye: BioRad (MJ Research) MiniOpticon, Opticon 2, and Chromo 4 Roche LightCycler® 480 System Eppendorf Mastercycler® ep realplex Instruments without ROX filter set Catalog Number Size PA-010 For 200 25-µl reactions (2.5 ml) PA-110 For 2000 25-µl reactions (25 ml) D. Equipment: 1. For recommendations on specific real-time instrumentation (thermal cyclers with fluorescent detection), see the list of master mixes above. 2. Calibrated Micro Pipettor 3. DNase-free / PCR Grade water (H2O), pipette tips and tubes Technical Support: [email protected] 6 www.SABiosciences.com Version 1.2 IV. Complementary Products: A. ChIP-qPCR Control Assays 1. ChIP-qPCR Negative Control Assays Detects genomic DNA in an ORF-free intergenic region to insure that anti-TF antibody does not pull down high levels of non-specific genomic DNA compared to the non-immune serum ChIP 2. ChIP-qPCR Positive Control Proximal HKG Promoter Assays Detects RNA Polymerase II binding proximal to the constitutive promoter of a highly expressed housekeeping gene to insure that the ChIP proceeded successfully B. Custom ChIP-qPCR Assay Design Service Let us design assays for your genomic DNA regions of interest with the same rigorous bioinformatic and quality control process used for our cataloged products. C. Custom ChIP-qPCR Array Plates Combine multiple cataloged, control, and/or custom assays in a 96- or 384-well format. Use to screen and validate multiple promoter regions, or to follow-up on ChIPon-chip results. D. SABiosciences’ RT2 PCR Products for target gene mRNA analysis Validate promoter activation by monitoring increases in target gene expression. 1. RT2 qPCR Primer Assays Analyze individual genes. 2. RT2 Profiler PCR Array Analyze the expression of a panel of genes in the transcription-factor activated pathway. 3. RT2 First Strand Kit & RT2 qPCR-Grade RNA Isolation Kit Genomic DNA free RNA isolation and reverse transcription for reliable realtime PCR gene expression analysis E. SABiosciences’SureSilencing™ shRNA Plasmids Designed to suppress the expression of any gene in the human, mouse, or rat genome using plasmid-based RNA Interference. Knock down the expression of another factor to test for its presence in an active transcription co-complex with the nuclear or transcription factor of interest. Technical Support: 888.503.3187 (US) 7 301.682.9200 ChampionChIP qPCR Primers V. ChIP-qPCR Assay Protocol: Please read through this entire protocol before beginning your experiment. NOTE: Preparing a Workspace Free of DNA Contamination For accurate and reproducible PCR results, it is very important to avoid contamination of the assay with foreign DNA. Any DNA contamination will artificially inflate the SYBR Green signal yielding skewed gene expression profiles and false positive signals. The most common sources of DNA contamination are the products of previous experiments spread into the air of your working environment. Please follow the recommendations below on how to set up and maintain a working environment free of DNA contamination. 1. Wear gloves throughout the procedure. Use only fresh PCR-grade reagents (H2O) and lab ware (tips and tubes). 2. Physically separate the workspaces used for PCR setup and post-PCR processing or non-PCR operations. Decontaminate your PCR workspace and lab ware (pipettor barrels, tube racks, etc.) before each new use with UV light or with 10% bleach. 3. Close all tubes containing PCR products once you are finished adding or removing volumes. Before discarding any lab ware (tips or tubes) containing PCR products or other DNA, treat with 10% bleach. 4. Do not leave lab ware (tubes and tip boxes) exposed to the air for long periods of time. 5. Do not open any previously run PCR tubes. Opening tubes after the run can release PCR product DNA into the air where it will contaminate and confound the results of future real-time PCR experiments. Technical Support: [email protected] 8 www.SABiosciences.com Version 1.2 A. ChIP DNA Sample Preparation Considerations NOTE: This section does NOT contain a chromatin immunoprecipitation protocol. It is a protocol overview highlighting preparation considerations that affect ChIP-qPCR Assay performance. 1. Biological Experiment Use at least one or two million mammalian cells per biological experimental condition or replicate for each IP fraction. Use the same amount of material for all IP fractions. NOTE: The amount and volume recommendations made here are suggestions. The actual amounts of ChIP DNA required to produce high quality, quantitative results must be determined empirically for each experiment. Once determined, this amount should be applied uniformly for all samples in an experiment. 2. Cross-Linking and Chromatin Preparation: Follow your previously used methodology or the recommendations in your ChIP kit. 3. Chromatin DNA Fragmentation by Sonication: For the best possible balance among resolution, sensitivity and IP efficiency, fragment the chromatin DNA to an average apparent size of 800 to 1000 bp as judged by agarose gel electrophoresis (Figure 2) or Agilent Bioanalyzer DNA NanoChip® based on the characterization of a purified input DNA aliquot with its cross-linking has been reversed. Figure 2: Chromatin Fragmentation Characterization. A) Ethidium bromide stained agarose gel of DNA fragmented by sonication. Lane 1 shows a good fragmentation size range (~800 bp average) for ChIP-qPCR Assays, while lane 2 shows a fragmentation size range (~250 bp average) that reduces the measurable signal intensity for ChIP-qPCR tiling assays. Lanes 3 and 4 are 100- and 1000-bp DNA ladder size markers. B) Intensity tracing of the gel lanes showing the range of a DNA fragment sizes superimposed on the size ladders. Lane 1 is the solid line, lane 2 is the dashed line, lane 3 (100 bp ladder) and lane 4 (1.0 kb ladder) are easily identified by comparison to the gel image. Technical Support: 888.503.3187 (US) 9 301.682.9200 ChampionChIP qPCR Primers NOTE: Chromatin fragmentation protocols recommended for ChIP-on-chip tiling microarray analyses yield DNA shorter (~400 to 600 bp average) than the optimal size for ChIP-qPCR Assays (~ 800 to 1000 bp average). DNA fragments need to accommodate the longer amplicon size for qPCR (50 to 200 bp) rather than the shorter “probe” size of ChIP-on-chip microarrays (25 to 70 bp). Longer fragment sizes also improve signal intensity but should not exceed 10 kb. 4. Immunoprecipitation (multiple fractions per sample): a. Input Genomic DNA – Positive control fraction for data normalization The Input DNA fraction provides a measurement of the total number of target binding sites before immunoprecipitation. We recommend that one percent of the chromatin sample should be used from each biological experimental condition or replicate. The Input DNA fraction is NOT immunoprecipitated but reserved for processing with the IP fractions in step 5. b. Divide the chromatin preparation accurately and evenly into at least three equal parts or fractions for the following immunoprecipitations (See Figure 1). Additional fractions may be added to accommodate additional nuclear or transcription factor targets. Fraction #1 = Non-Immune Serum or IgG (NIS/mock ChIP): This fraction is the negative control for the non-specific pull-down of DNA during immunoprecipitation, and provides a measurement of the background or noise for the ChIP system. Fraction #2 = Anti-RNA Polymerase II Antibody (RNA Pol II ChIP): This fraction is a positive control for successful ChIP when used with a Positive Control Proximal HKG Promoter Assay. This fraction can also provide a measurement of transcriptional activity at a promoter of interest when used with other proximal promoter ChIP-qPCR Assays. Fraction #3 = Anti-Nuclear or Transcription Factor of Interest Antibody (Target TF ChIP): This fraction is the experimental inquiry that measures the number of specific target sites bound or associated with the nuclear or transcription factor in vivo. Follow your previously used methodology or the recommendations in your ChIP kit for the optimization of immunoprecipitation for each antibody separately. 5. Reverse Cross-Linking: Follow your previously used methodology or the recommendations in your ChIP kit. 6. DNA Purification: Follow your previously used methodology or the recommendations in your ChIP kit. Re-suspend each ChIP DNA fraction in 100 µL of 1 mM Tris, pH 7 to 8 without EDTA. (EDTA inhibits PCR.) This volume recommendation is based on the use of 1 to 2 million mammalian genome equivalents in each IP fraction. Technical Support: [email protected] 10 www.SABiosciences.com Version 1.2 B. Performing the ChIP-qPCR Assays: NOTE: The use of SABiosciences’ RT2 qPCR Master Mixes is critical for obtaining the most accurate results from the ChIP-qPCR Assays. Be sure to use the correct master mix for your instrument before continuing with this protocol (See Page 6). NOTE: The accuracy and precision of your pipetting determines the consistency of your results. Be sure that all of your micro-pipettors are calibrated before beginning this procedure. NOTE: Be sure that your ChIP DNA meets the quality standards mentioned previously. 1. Setup qPCR Assays for Analysis: The following is a suggested minimal qPCR Assay setup for quantitative analysis of the experiment and all of the recommended ChIP DNA fractions. There are three (3) levels of variables that must be managed in a ChIP experiment: sample (e.g., treatment or time course), target (IP antibody target), and binding site (specific sequence locations in the genomic DNA). For each sample (experimental condition or replicate), perform each of the following ChIPqPCR Assays defined by their ChIP DNA Fraction (input template) and their qPCR Assay (primer pair): Table 1: Recommended ChIP-qPCR Assays for a Complete Experiment. qPCR Assay Per sample: ChIP DNA Fraction Input DNA Target TF RNA Pol II Non-Immune Queried Site #1 √ √ X* √ Negative Control (IGX) √ √ √ √ Positive Control (Proximal HKG) √ X √ √ * This qPCR Assay and Fraction combination only provides useful data if RNA Pol II binding to the Queried Site is relevant to the specific experiment. Therefore, for this experimental example: (3 Queried Site #1 Assays + 4 Negative Control Assays + 3 Positive Control Assays) = 10 ChIP-qPCR Assays per sample And, for a minimum of two biological conditions and three replicates each: (10 qPCR Assays) x (3 biological replicates) x (2 experimental conditions) = 60 qPCR ChIP-qPCR Assays for the complete experiment. Technical Support: 888.503.3187 (US) 11 301.682.9200 ChampionChIP qPCR Primers 2. Reaction Preparation For each 25-μL PCR, mix the following components in a PCR tube: 12.5 µL RT2 qPCR Master Mix, matched with your instrument 6.5 µL ddH2O 5.0 µL of either undiluted or diluted ChIP DNA template 1.0 µL ChIP-qPCR Assay Primers (10 µM each) 25.0 µL final volume (Final primer concentration is 0.4 µM.) NOTE: If improved sensitivity is required, the volume of ChIP DNA template can be increased up to 11.5 µL per reaction IF the DNA solution does not contain EDTA. Concentration of the ChIP DNA by any means is NOT recommended, but rather the ChIP preparation should be scaled up or optimized. Alternatively: For improved ease and consistency, ChIP-qPCR Assay-specific pre-mixes for each of the three or more DNA regions detected may be prepared. Scale up the following recipe for the number of reactions to be performed within the single experiment and to allow for pipetting error. Assay-Specific Pre-Mix: 12.5 µL RT2 qPCR master mix, matched with your instrument 6.5 µL ddH2O 1.0 µL ChIP-qPCR Assay Primers (10 µM each) 20.0 µL final volume Then, for each 25-μL PCR, mix the following components in a PCR tube: 20.0 µL Assay-Specific Pre-Mix 5.0 µL of either undiluted or diluted ChIP DNA template 25.0 µL final volume After all wells have been dispensed, seal the reaction tubes and centrifuge briefly before placing into your real-time PCR instrument. If more than one PCR plate is required to run all the experimental reactions, dispensed plates may be stored at 4 °C for up to 36 hours or -20°C for 1 week. Technical Support: [email protected] 12 www.SABiosciences.com Version 1.2 3. Performing Real-Time PCR Detection: NOTE: The details of programming a thermal cycling profile are instrument-specific, and therefore questions about specific programming functions should be addressed with the instrument manufacturer. Be sure to follow the manufacturer’s instructions for the proper operation and maintenance of your real-time instrument. For additional help with instrument setup, see our Instrument-Specific Setup Instructions and Protocol Files at: www.sabiosciences.com/pcrarrayprotocolfiles.php. Place your plate, strips, or tubes into the real-time thermal cycler. Enter and run the following two-step cycling program on your real-time instrument saving the data file with a unique name. Cycles Duration Temperature 1 10 minutes1 95 °C 15 seconds 95 °C 1 minute2 60 °C 40 1 2 The 10-minute step at 95 °C is required to activate the HotStart DNA polymerase. Detect and record SYBR® Green fluorescence from every well at the end of the 60 °C annealing / extension step of each cycle. 4. Recommended Quality Control: Dissociation (Melting) Curve Run your instrument’s default melting curve program immediately after the above PCR program, and generate a first derivative dissociation curve. No more than one peak should appear in each reaction at temperatures greater than 75 °C. Record the Tm for each reaction. If your instrument does not have a default melting curve program, run the following program instead: 95 °C, 1 min; 65 °C, 2 min (OPTICS OFF); 65 °C to 95 °C at 2 °C / min (OPTICS ON). NOTE: Be sure to visually inspect the plate after the run for any signs of evaporation from any of the wells. If evaporation is observed, make a note of which wells so that you may qualify your data analysis appropriately. Technical Support: 888.503.3187 (US) 13 301.682.9200 ChampionChIP qPCR Primers C. Data Analysis: 1. Real-Time Data Acquisition and Quality Assessment NOTE: The specific application of the recommendations below depends on your real-time PCR instrument software. Please consult the instrument user manual or contact the manufacturer’s technical support department for further directions. For consistent results, use the same real-time instrument to generate all results within a single experiment. a. Baseline Cycle Range Selection Allow your real-time PCR instrument’s software to automatically define the Baseline Cycles for each individual well. Confirmation of a good range can be performed by viewing the baseline region of the linear-scale amplification curves under high magnification. b. Threshold Fluorescence Value Selection Manually position the Threshold level near the mid-point of linear amplification range when inspected in the log-scale view of the amplification curve. The threshold value should be the same for all reactions in the same experiment whether within the same or across separate PCR runs. c. Real-Time PCR Quality Assessment i.) Amplification Curve Shape After cycle number 3 or 4, the Baseline Cycle Range for all reactions should have a constant (flat) level of fluorescence in the Linear View of the amplification curve. In the logscale view, the slopes, and therefore the efficiencies, of the amplification curves for all the assays should also be parallel to each other to be comparable. ii.) Dissociation Curve Analysis Confirm that each reaction produces a single specific product as indicated by a single Dissociation Curve peak at a melting temperature (Tm) greater than 75 °C. d. Save the qPCR settings as an instrument file (when possible) and export all Ct value data and labels to an Excel spreadsheet. Technical Support: [email protected] 14 www.SABiosciences.com Version 1.2 2. ChIP-qPCR Data Analysis (ΔΔCt method) NOTE: ChIP-qPCR results can be calculated validly using the ∆∆Ct method1, because all Ct values for a binding site are determined from the same qPCR assay. NOTE: Excel-based ChIP-qPCR Data Analysis Template Download our Excel-based ChIP-qPCR Data Analysis template from the SABiosciences web site at the following address: http://www.sabiosciences.com/manuals/chipqpcranalysis.xls • Click on the “ChIP-qPCR Data Analysis Template” link. • Save the Excel file to your local computer. Open the file in Excel. • Follow the instructions for using the template provided in the “Instructions” worksheet. Our Excel-based ChIP-qPCR Data Analysis template provides a guideline and template for performing the following calculations and interpretation of the control reactions. a. ChIP-qPCR Analysis Calculations Report ChIP-qPCR results either as a “% Input” or “Assay Site IP Fold Enrichment” for characterizing individual experimental samples, or as a “Differential Occupancy Fold Change” when comparing multiple experimental samples. i. Normalize each ChIP DNA fractions’ Ct value to the Input DNA fraction Ct value for the same qPCR Assay (∆Ct) to account for chromatin sample preparation differences. ∆Ct [normalized ChIP] = (Ct [ChIP] - (Ct [Input] - Log2 (Input Dilution Factor))) Where, Input Dilution Factor = (fraction of the input chromatin saved)-1 Average normalized ChIP Ct values for replicate samples. ii. Calculate the % Input for each ChIP fraction (linear conversion of the normalized ChIP ∆Ct). % Input = 2 (-∆Ct [normalized ChIP]) iii. Adjust the normalized ChIP fraction Ct value for the normalized background (NIS/mock IP) fraction Ct value (first ∆∆Ct). ∆∆Ct [ChIP/NIS] = ∆Ct [normalized ChIP] - ∆Ct [normalized NIS/mock] iv. Calculate Assay Site IP Fold Enrichment above the sample specific background (linear conversion of the first ∆∆Ct). Fold Enrichment = 2 (-∆∆Ct [ChIP/NIS]) Technical Support: 888.503.3187 (US) 15 301.682.9200 ChampionChIP qPCR Primers NOTE: Real-time PCR threshold cycle (Ct) values greater than 36 may not be reproducibly measured and introduce greater degrees of variability into the calculated results. Because the (Ct) values for the background (NIS/mock) ChIP-qPCR measurements tend to be in this range, we recommend using % Input values and not Fold Enrichment values to compare experimental samples. v. Determine the difference between the normalized experimental sample (S2) and the control sample (S1) ChIP fraction Ct values (second ∆∆Ct). ∆∆Ct [S2-S1] = ∆Ct [S2:normalized ChIP] - ∆Ct [S1:normalized ChIP] vi. Calculate Differential Occupancy Fold Change (linear conversion of the second ∆∆Ct to yield a fold change in site occupancy). Fold Change in Occupancy = 2 (-∆∆Ct [S2-S1]) b. ChIP-qPCR Analysis Quality Assessment i. ChIP sample Quality Control For each ChIP-qPCR Assay: a) The Input DNA Fraction Ct value should be less than 30. b) The % Input for the NIS/mock IP DNA fraction should be less than 0.01%. c) The Target TF ChIP DNA fraction Ct value should be at least one cycle less than the NIS/mock IP DNA fraction Ct value (Ct [NIS/mock] – Ct [ChIP] > 1.0) to be considered quantitatively above the background signal (noise) for the sample. ii. ChIP Experiment Quality Control a) The % Input results from the Positive Control Proximal HKG Promoter Assay for the RNA Pol II DNA fraction should be greater than 0.1%. b) The % Input of the Negative Control Assays for the Target TF and NIS/mock ChIP DNA fractions should be very similar. Technical Support: [email protected] 16 www.SABiosciences.com Version 1.2 VI. Troubleshooting A. No Amplification or Very Late Ct Values (> 30) for Input DNA Fractions: 1. Examine each individual amplification curve for evidence of poorly applied or defined baseline and threshold settings. 2. Repeat the qPCR on a limited scale but include a Positive Control qPCR Assay. Positive Control qPCR Assay: An assay that uses a genomic DNA preparation from your cell line of interest without cross-linking or sonication at a final concentration of 0.2 ng/μL and that yields a Ct value less than 33 3. If the Positive Control qPCR Assay does not amplify with a Ct value < 33: a. Did the instrument perform correctly during the run? b. Were all reaction components added to the qPCR pre-mix and properly dispensed into the plate or tubes? c. Double check that the qPCR master mix is the correct formulation meant for your real-time instrument, and that it is still in good condition. Also see your instrument’s troubleshooting guide for additional assistance. 4. If ONLY the Positive Control qPCR Assay amplifies with a Ct value < 33: a. The ChIP DNA Fractions are too dilute or too damaged to amplify. i. Too little starting material was used for the ChIP preparation. Scale up the initial amount of chromatin. ii. The chromatin was cross-linked and/or sonicated too much. Reduce the cross-linking time and/or the sonication intensity and/or time. iii. The DNA isolation procedure has a poor yield or recovery. Also see the troubleshooting guide of your ChIP preparation protocol or kit to address these issues in more detail. b. Confirm that all reaction components were added to all of the wells. 5. If only one ChIP-qPCR Assay primer pair fails to amplify with Ct values < 33 while other assay primer pairs yield more reasonable Ct values: a. The ChIP-qPCR Assay genomic DNA region may not be intact in the genome used for the experiment. Re-evaluate and re-validate the Positive Control qPCR Assay using un-cross-linked and unfragmented genomic DNA from the same cell line used in the experiment. Technical Support: 888.503.3187 (US) 17 301.682.9200 ChampionChIP qPCR Primers NOTE: Your cell line may contain different sequence relative to the NCBI Genome Build due to unreported chromosomal abnormalities (insertion or deletions) and single nucleotide polymorphisms (SNPs) that affect the ChIP-qPCR Assays. First, try selecting the ChIP-qPCR Assay in an adjacent tile and repeating the analysis. However, this situation may yet require sequencing of the genome region in your cell line of interest and custom assay development. b. The ChIP-qPCR Assay primers are not performing to specifications. Contact Technical Support. B. The Target TF IP DNA Fraction Ct Value is Greater than the NIS/mock DNA Fraction Ct Value: 1. The amount of nuclear or transcription factor binding to the region of interest is at or below the limit of detection (non-specific background) for the ChIP-qPCR Assay. a. If this phenomenon occurs for some but not all ChIP-qPCR Assays, then the result is most likely real and reflects the actual biology of your experimental model system. b. If this phenomenon occurs for ALL ChIP-qPCR Assays, then the IP of the target nuclear or transcription factor may not be performing efficiently. Reassess and repeat the IP protocol, and re-optimize if necessary. 2. The distance between the ChIP-qPCR Assay tile and the target nuclear or transcription factor binding site may be too great for the chromatin fragmentation size range. Insure that your sonication conditions yield an average DNA size of 0.8 to 1.0 kb. Otherwise, look for a more appropriate ChIP-qPCR Assay tile or consult or Custom ChIP-qPCR Assay design service. Contact Technical Support. C. No Amplification or Very Late Ct Values for the NIS/mock IP DNA Fractions: This result is ideal, because it means that the level of non-specific background for this ChIP-qPCR Assay is below the limit of qPCR detection. Change the unreported Ct value to 40 and proceed with the recommended calculations of fold enrichment. D. Low (< 30) Ct Values from the NIS/mock IP DNA Fractions and/or the Negative Control IGX Assays: The immunoprecipitation is pulling down too much non-specific genomic DNA. Reassess and repeat the IP protocol, and re-optimize if necessary. E. Positive Control Proximal HKG Promoter Assay and the RNA Pol II DNA Fraction % Input Is Less than 0.1%: 1. The ChIP-qPCR Assay genomic DNA region may not be intact in the genome used for the experiment. Re-evaluate and re-validate the Positive Control qPCR Assay as described above. 2. The RNA Pol II IP may not be performing efficiently. Reassess and repeat the IP protocol, and re-optimize if necessary. Technical Support: [email protected] 18 www.SABiosciences.com Version 1.2 Appendix: 1. Detailed Mathematical Explanation of ∆∆Ct Data Analysis Method Due to the inverse proportional relationship between the threshold cycle (Ct) and the original amount of template DNA, as well as the doubling of the amount of product with every cycle, the original amount of template DNA (L) in each ChIP fraction is expressed as: To control for variation between ChIP fractions, the amount of each promoter region of interest in the initial chromatin (Input DNA) fraction provides a convenient normalization factor for the number of genome equivalents used in the analysis. Because the Input DNA fraction only represents one percent of the total material, the Input Ct value is adjusted for this dilution factor by subtracting 6.644 cycles. The ratio of target TF ChIP DNA fraction over the Input DNA fraction determines the fraction of the nuclear or transcription factor sites pulled down in the target TF ChIP DNA fraction. To determine fold-changes in fractional enrichment caused by the experimental conditions and nuclear or transcription factor activation, the normalized amount of the nuclear or transcription factor(s) of interest at the promoter region(s) of interest in the experimental sample is divided by the corresponding normalized amount in the control sample. 2. Bibliography ∆∆Ct Calculations KJ Livak & TD Schmittgen, Methods, 2001, 25(4):402-8 JS Yuan, A Reed, F Chen & CN Stewart, Jr. BMC Bioinformatics, 2006, 7:85 1 ChIP-qPCR 2 SK Chakrabarti, JC James & RG Mirmira, J. Biol. Chem. 2002; 277: 13286 – 13293. N Rybtsova, E Leimgruber, Q Seguin-Estevez, I Dunand-Sauthier, M Krawczyk & W Reith, Nuc. Acids Res. 2007, 35: 3431 – 3441. iCycler® and MyiQ® are registered trademarks of BioRad Laboratories, Inc. NanoChip® is a registered trademark of Caliper Life Sciences. LightCycler® is a registered trademark of Roche Applied Sciences. SYBR® is a registered trademark of Molecular Probes. Mastercycler® is a registered trademark of Eppendorf. Technical Support: 888.503.3187 (US) 19 301.682.9200 ChampionChIP™ qPCR Primers User Manual Part #1028A Version 1.2 BIOMOL GmbH Waidmannstr. 35 22769 Hamburg [email protected] www.biomol.de Phone:+49-40-8532600 or 0800-2466651 (D) Fax: +49-40-85326022 or 0800-2466652 (D) 9/12/2008