1
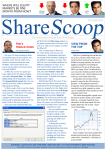
User Guide
© Ionic Information Ltd. 1997-2006 All rights reserved. This guide and the program
are copyright works of Ionic Information Limited, London, England and are licensed
in terms of our standard contract. The data referred to herein is the copyright
of the London Stock Exchange, Hemscott PLC, FTSE, AFX News and others.
Reproduction in whole or in part without the express written permission of Ionic
Information Limited is prohibited. Reverse engineering is also prohibited.
ShareScope is the trademark of Ionic Information Limited.
Ionic Information Ltd
3rd Floor
140 Goswell Road
London
EC1V 7DY
Tel:
020 7549 1100
Fax:
020 7549 1101
Disclaimer
Whilst every effort is made to keep this guide up to date, the number and rapidity
of enhancements to ShareScope means that there may sometimes be omissions
and inaccuracies. We apologise for any confusion this may cause, and refer you to
the ‘What’s New?’ section of the on-screen Help within the program itself, which is
updated with every new version.
The calculations and rankings given in this guide, and in ShareScope, should be
used for guidance only. Ionic Information does not make any recommendations
or endorsements on whether an investment is a suitable or wise investment or
investment strategy. Please check all figures independently before taking action.
Support
Every effort has been made to make ShareScope easy and intuitive to use, but
computers and the stock market can be complicated. Use the on screen help for
any technical questions. Our free lifetime support is there to help you:
ShareScope Plus users
Email:
Telephone:
[email protected]
0845 045 0111
ShareScope Pro users
Email:
Telephone:
[email protected]
0845 456 0545
Contents
1. How to Use This Guide
3
2. Financial Background and Terminology
5
3. Intraday Information
7
4. Windows
11
5. Intraday Graph Window
13
6. List Window
21
7. Ticker
27
8. Intraday Alarms
31
9. Trades and Quotes List
37
10. Messaging
39
11. Dynamic Data Exchange (DDE)
43
Index
47
Eighth Edition, April 2006
Page 2
1. How to Use This Guide
This guide explains how to use the extra features available in ShareScope Plus
and Pro. It is intended to be used in addition to the ShareScope User Guide,
which details the features that are common to all ShareScope programs. The
features described in this guide are generally common to both Plus and Pro,
but in some instances, a feature may be exclusive to ShareScope Pro. The text
will always clearly identify any such instances.
Since this guide was published, new features may have been added. Please
refer to the ‘What’s New?’ section of the on-screen Help.
Less experienced computer users should refer to Sections 2 and 3 of the
ShareScope User Guide for step by step tuition before reading the more detailed
information given in this guide.
This ShareScope Plus and Pro User Guide does not cover definitions of technical
analysis indicators, fundamentals and stock market terms. For more detailed
explanations of some of the features available please refer to the on-screen
Help.
If after reading this guide and the on-screen Help you need more
information, you can email us at [email protected] or contact
our support help desk 9am to 6pm Monday to Friday on 0845 045 0111.
ShareScope Pro users should email [email protected] or call 0845
456 0545.
User Guide Terminology
In this guide, buttons (on-screen and keys on your keyboard) and menu items
to select are written in bold. If a menu item is followed by a colon, this means
you click on each item in turn. For instance, View : Calendar means you should
click View on the menu bar (at the top of the screen) and then click on Calendar
to bring up the Calendar.
Click always means a single click on the left mouse button.
Right click always means a single click on the right mouse button. This brings
up a context menu relevant to the ShareScope window you are using and to
the position of the mouse pointer.
Double click always means a quick double click with the left mouse button.
If you have problems double clicking you can alter the mouse response speed
through your computer’s Start Menu : Settings : Control Panel : Mouse.
Click and drag always means click and then hold down the left mouse button
while moving the mouse pointer.
Page 3
Page 4
2. Financial Background and Terminology
Intraday Data
London Stock Exchange (LSE) and FTSE supply real time prices for UK listed
shares and FTSE indices in ShareScope Pro. The data is delayed by 15 minutes
in ShareScope Plus.
All of ShareScope’s US data (NASDAQ, NYSE, AMEX) and many international
indices (CAC, DAX, S&P 500 and Dow Jones) are supplied by Comstock, a
division of Interactive Data Corporation (NYSE: IDC). Comstock is a leading
provider of market data solutions to the global financial community.
Ionic processes the data and within about a tenth of a second passes the data
on to you. Depending on your internet connection this data will be available on
your computer within another two or three tenths of a second.
The data is input at numerous stockbrokers and market makers around
the country and is not checked, either by the LSE or by Ionic Information,
before it goes out. On rare occasions data is input incorrectly. This may be
corrected with a counter trade but it will always produce either a temporary or
a permanent spike. (See Page 14 for a de-spiking option to detect any one-off
price spikes.)
Terminology
Offer
The best (lowest) quoted price available if you want to buy shares.
Bid
The best (highest) quoted price available if you want to sell shares.
The Bid is usually higher than the Offer, unless there is an auction
taking place, in which case they are temporarily reversed.
Mid
The average of the bid and the offer.
Spread
The difference between the bid price and the offer price.
Tick
A change in the trade price.
Trade
A transaction. The LSE doesn’t indicate if it is a buy or a
sell; this is inferred by how close the price is to the bid or
offer.
Trade price
The price of the last trade.
OHLCV Data
There are a variety of different ways of calculating Open, High, Low, Close
and Volume. For the LSE market we use: “London Market Information Link Recommended Display and Derived Information Guidelines”. This is currently
available at www.londonstockexchange.com/cmsattach/940.pdf. For all other
markets we use the local rules and guidelines. See the LSE document for full
details.
Page 5
Terminology
SETS
Most liquid LSE stocks.
SEAQ
Less liquid LSE stocks.
Mid
Average of the bid and offer.
Open
The first ‘reliable’ price for the day.
LSE SETS: The first uncrossing price or, failing
that, first automatic trade.
LSE SEAQ: Mid price when the market opens.
Other markets: First Trade
FTSE 100, 250, 350 & SmallCap indices: Value three
minutes after the open.
Other Indices: First quote.
High
LSE SETS: Highest trade during market hours.
LSE SEAQ: Highest mid price during market
hours.
Other markets: Highest trade during market hours.
S&P Indices: Index calculated on the highest
values of constituents.
Other Indices: Highest Value.
Low
The opposite of the High calculations.
Close
Last price of the day.
LSE calculate and distribute this value. Their
calculation method is complex.
Other markets: Last trade before the market
closes.
Indices: Last value.
Volume
Number of shares traded that day. Because
of delayed trades this figure can change for
several subsequent days.
Delayed
trades
Trades are normally reported within 60 seconds but big
trades and some other trades can be delayed for hours
or days.
OHLCV
Open, high, low, close & volume over a fixed time
period.
Candlesticks
A Japanese method of representing OHLC information.
VWAP
Volume weighted average price.
Page 6
3. Intraday Information
Intraday Data
ShareScope Pro will give you up-to-the-second information on:
Prices and volume for all UK equities and investment trusts listed on the
London Stock Exchange (LSE), the Alternative Investment Market (AIM),
US equities listed on NASDAQ, the New York Stock Exchange (NYSE), the
American Stock Exchange (AMEX), international indices (S&P 500, Dow
Jones, CAC, DAX and most FTSE indices), Foreign Exchange (FOREX) and
AFX News.
ShareScope Plus data is 15-minute delayed and does not show NYSE, AMEX
or FOREX prices at all.
The following items are not updated intraday:
Some overseas indices (e.g. Hang Seng, Nikkei), some other indices, imported
data, Unit Trusts, Directors’ Dealings & Major Holdings, gilts, exchange rates,
commodities, portfolios, transactions and fundamental data.
Data Delivery Levels and Licence Agreements
When installing ShareScope Plus or Pro you will need to select a delivery level
for the data received from each exchange. You will be asked to choose a
delivery level for NASDAQ, NYSE/AMEX, FOREX and Indices. Use the radio
buttons to select your level of delivery (Max, Normal, Minimal or None) for each
option. With ShareScope Plus you can only select Minimal level for NASDAQ
and Indices.
Page 7
Max receives all available data (including prices, trades and volume) for the
selected feed in real time.
Normal will display snapshots of fifteen seconds including mid price movements
and cumulative volume.
Minimal will display snapshots of one minute including mid price movements
and cumulative volume.
None will switch off data supply for the selected feed.
If you wish to receive any level of data from NASDAQ, NYSE/AMEX or Indices,
you will need to fill in a licence agreement (there are two separate agreements,
one for NASDAQ and Indices and one for NYSE/AMEX). The agreements will
appear when you connect to the intraday feed.
The level of delivery selected will affect the amount of bandwidth required.
If using a 56k Modem, we strongly recommend using the normal or minimal
settings.
Please note all LSE and FTSE data is supplied at the full level, regardless of
settings that you make in this screen.
You can change the delivery levels at any time by selecting Update : Select
intraday feed levels… or by double clicking on the small bar graph at the
bottom right of your screen.
Connecting to the Intraday Data Feed
To connect to the Intraday data feed, click on the Connect toolbar button
(lightning symbol) or go to Update : Connect to intraday feed. The following
dialog box will appear on your screen:
Page 8
Once a connection is made, the dialog box will automatically close and you will
be connected. To connect automatically every time the program is opened,
you need to select Tools : Options... : Intraday Feed and then select Auto
connect to the feed. Connection status is shown in the bottom right-hand
corner of the screen.
A standard internet connection is required when connecting to our intraday
feed. You will need to establish your internet connection before connecting to
our intraday servers. You cannot connect to intraday data via direct dial.
N.B. ShareScope Plus and Pro users still need to update the daily data regularly
(by pressing F9 or selecting Update : Update historic prices & fundamental
data) to download fundamental information and historical share prices.
AOL Customers
Users who have AOL as their Internet Service Provider will need to make a
small change to the ShareScope connection settings.
Select Tools : Options : Intraday Feed. Towards the bottom of the dialog box,
make sure that the ‘Use Winsock 2 if available’ tick box is not selected. AOL is
not compatible with Winsock 2 and will prevent connection if this is active.
Intraday News
With ShareScope Pro, the AFX News service can be updated in real time along
with the prices. ShareScope Pro delivers the AFX UK ProFeed, a premium
news service. ShareScope Plus delivers news updates from the AFX UK Focus
service. This is the same news service used in ShareScope Gold but you receive
the stories as soon as they are released by AFX.
If you wish to be alerted to news stories for a specific share, please see Intraday
Alarms on page 31 for further details. Once you have set alerts on news you
can see all news alarms by right clicking over the news window and selecting
News for triggered alarms. To open a news window press Shift and \ (or
select Window : New window : News) .
However, if you do not wish to receive intraday news you can switch this option
off. To do this select Tools : Options… : Intraday Feed. From the dialog box
that appears, select the Disable intraday AFX news feed option. To enable
the news again, deselect the tick box.
All the features and functions that are available in the news window are detailed
in the ShareScope User Guide Section 11.
Page 9
Intraday Price History
Should you wish to recover data from previous days you can backfill the intraday
history, this will enable you to see intraday graphs for previous days. You can
download, or backfill, up to four weeks (20 trading days) of data.
To do this, select Update : Backfill intraday history... When the dialog box
appears, choose the exchanges required from the tick boxes and select the
dates you wish to backfill, then press Request. Backfill progress is shown in
the bottom right-hand corner of the screen. Double clicking on this area also
brings up the Backfill intraday history dialog box.
Saving Your Data and Settings
Your settings will be saved automatically provided you exit the program
correctly. The program will open on the last screen layout displayed before
closing.
If you wish to manually save all your data and configuration settings while the
program is in use select File : Save. This will save portfolios, cash accounts,
imported data, configuration settings and intraday data.
Add or Share Intraday Data
Each day’s intraday price history is stored in a unique file. You can archive
these files and retrieve them when required to save on disk space. Files are
stored in ShareScope’s /Data/RT directory and use the naming convention:
histyymmdd.dat (e.g. hist060308.dat will include the intraday history for 8th
March 2006).
Simply drag and drop these files into your archive media. Note that intraday files
will only include data for the periods when you were connected to the intraday
feed. For whole days that you have backfilled, the file will be complete including
the open and close values.
Page 10
4. Windows
ShareScope Plus and Pro allow users to view multiple windows at one time.
With multiple window viewing, there is no limit to how many windows you
can to add to your screen. The diagram below illustrates multiple windows in
ShareScope Pro.
Linking Windows
All graph and list windows can be linked, giving you multiple information displays
for one share. To link a window (provided more than one window is open), right
click on the title bar of the window you want to link, and from the context menu
that appears select Link window....
A dialog box will appear listing all the windows you can link to (windows already
linked to are not shown in this list). Click on the window you want to link to. If
this is the only linked window, the link will take immediate effect. With additional
linked windows, a dialog box will appear offering the choice of maintaining
only one link or creating multiple linked windows. Once windows are linked,
changing a share in a linked window will change the selected share in all linked
windows.
Page 11
To unlink a window, right click on the title bar and from the context menu that
appears select Unlink window.
Adding and Re-sizing Windows
To create a new window, select Window : New window. Select the type of
new window you require from the sub-menu that appears. Alternatively, you
can right click on the screen and select New window from the context menu
that appears.
All windows displayed in ShareScope Plus and Pro can be re-sized to your exact
requirements. To do this, simply place your mouse over the window border,
then click and drag. To move a window around the screen, click and drag on
the title bar.
ShareScope can automatically arrange windows for you. Click on the toolbar
button with the picture of a multi-window screen on it, or select Window : Arrange
windows. The windows will move and re-size to fill as much blank space as
possible. To restore the default layouts, select Window : Window layouts :
Default layouts.
With multiple windows displayed, you can maximise any one of the windows to
fill the whole screen. For example, if the shares list window and intraday graph
window are displayed on screen but you would like a closer look at the intraday
graph, double click on the intraday graph title bar and the window will fill the
entire screen. To return to multiple windows, double click on the window title
bar again.
When adding new windows in a blank area of the screen, they will automatically
be re-sized to fit the space you have right clicked in, taking into account the
arrangement of the other windows.
Windows Layout
As with graphs and tables, you can save up to twelve different windows layouts.
Layouts are automatically saved when you exit ShareScope.
So, for example, if you wanted one layout showing simply the list and intraday
graph of a particular share, you could save this and call it ‘List/graph’. To rename
the current window layout, select Window : Window layouts : Rename window
layout... and enter the new layout name.
You can access this layout at any time by selecting Window : Window layouts :
List/Graph. You can then save and use up to eleven other layouts, so you don’t
have to rearrange the windows each time you want to change the layout. You can
add window layout toolbar buttons to any one of your toolbars for easy access
to any of your saved layouts.
To find out more about customising your toolbars see Section 18 of the
ShareScope User Guide.
Page 12
5. Intraday Graph Window
To view the intraday graph window if it is not already showing on your screen,
select Window : New Window : Intraday graph.
The intraday graph window will initially display the current day’s trades along
with the bid and offer price. The shaded area of the window below the trades
line represents the bid price. The shaded area of the window above the trades
line represents the offer price. Trades are represented as coloured dots. You
can change their colour and size by right clicking and selecting Graph Design...
then choose the Trades tab.
As with the historical graph window, the share name is displayed at the top of
the graph and the share type at the top right. The top left of the graph shows
the currency in which the share is traded, and just below this is the current date.
The bottom of the graph shows the time scale in a twenty-four hour format. The
share’s EPIC is shown as a watermark. You can add the bid/offer prices as
a watermark or remove the watermarks by right clicking and selecting Graph
Design... then choose the Style tab.
ShareScope Intraday graph window
The left and right arrow keys can be used to scroll horizontally across
the days displayed on your intraday graph. Each key press will move
backwards or forwards one day at a time. Shift and the left or right arrow
key adds or removes a day from your intraday graph. Clearly you will need
to have a number of days’ intraday data stored for this to be effective.
Page 13
Context Menu
Right click over the intraday graph window to reveal the graph window context
menu, which offers you the following options.
Graph Design
By selecting Graph Design… from the context menu, a dialog box will appear,
as shown on the opposite page.
At the top of the graph design dialog box is the De-spike slider. From time to
time rogue trades will appear in the form of an unusually high or low price. This
is often an error from a broker mis-entering a trade on their screen. The de-spike
facility prevents this giving a false impression of the day’s trading. If you set the
slider to “-” (by moving the slider to the far left) then ShareScope will not despike the graph at all and all trades will be shown. If you set the slider between
“-” and “+”, ShareScope will remove from some to most of the rogue trades for
you, although you will not get a ‘warts and all’ picture of the day’s trading.
The Dark default and Light default buttons allow you to display your intraday
graph window with a white or black background and associated line colours.
The Preview button will let you view any changes that you have made to the
graph before exiting the graph design dialog box.
Page 14
The Library facility allows you to save and restore individual graph settings
which can be easily exchanged with other ShareScope users. To save a graph
setting, click on the Library button and select Add current settings to library.
You can then name and save this setting in your Library folder or save to another
location. To restore a graph setting at a later date, click on the Library tab and
select from the list or choose Open library folder....
(The Library facility can also be used to save and restore List screen settings.
To access the Library in a List screen, select List design... from the context
menu).
Price Tab
This allows you to choose what data to display. You can add or remove the
Offer and Bid prices by ticking/unticking the relevant boxes. To the right of
these choices you have the option to change the line colour and style. You can
also turn the background shading option on or off and choose the colours.
You have the option to chart the current share by Mid line (the average of the
bid and offer), Close line, or OHLC (open, high, low, close) bar chart, or in
Candlestick format. If you do not wish to see any of the above, select None.
You can choose to use mid prices or trade prices as your data source.
The Mid line and Close line can be displayed in two formats. If the Stepped
line option is ticked, the mid and close price levels remain constant until a new
price is received. Once the new price is received, the graph will step up or
down to reflect this. If this option is not ticked then the line will move directly
between each price.
Show latest will display the latest mid price on the right-hand vertical axis of
the graph.
Page 15
Show opening price will display the day’s opening price on the left-hand vertical
axis of the graph.
Previous day’s high/low/close will overlay the previous day’s high, low or
closing price as a horizontal line on each day of the intraday chart. ShareScope
will get prices from the historical price database. If this is not available (e.g.
the historical data has not been updated or is not available for that share), then
your intraday data will be used as a source instead. If the necessary data is
not available from either source, the line will not be shown.
Trades Tab
Trades can be displayed as either a Line or Dots. If you do not want to display
trades select None. If the Buy/Sell option has been selected then there are two
lines, one for imputed buys and one for imputed sells; unknowns are reported
as dots.
Use the dot options to vary the dot size and colour. You can also tick the Show
size option so that the size of each trade dot will correspond to the volume of
that specific trade.
The Volume Histogram can be displayed in two ways:
Trade based, which will add a volume figure for each individual trade as it
happens.
Period based, where the volume will be broken down into the Fixed period
lengths selected on the Time tab (see below). If you do not wish to see volume
select None.
If you have selected Period based volume, a signal line can be added to the
volume display. This will add a moving average to the volume histogram based
on the number of periods you enter in the periods box. You can choose which
type of moving average is used and you can change the colour and style of the
line. By default, the volume bars are coloured black whether they are greater
or lower than the previous traded volume, but you can change these colours
to suit your preference. You can also tick the box to Colour volume bars by
price up/down movement.
Time Tab
This gives you control over the time scale displayed in the graph window. The
Days viewed drop-down menu allows you to view up to ten days’ intraday prices
at any one time. Please note that you will only be able to view the requested
days if you have downloaded sufficient history (see Intraday Price History on
page 10).
There are two date display options; Today is last day and Display from. You
can choose a specific date by selecting the Display from radio button and
entering a date in the date box beside it.
Page 16
The following three time scale options are available:
Show all data will display all trades over a twenty four hour period, including
trades outside of trading hours.
Market hours will display trading hours only (this will vary depending on the
exchange that the share is listed on).
User defined hours lets you choose the period that you want to see (this can be
useful to eliminate trading spikes caused by opening and closing auctions).
To customise the required time period for each exchange, use the Define button
to the right of the User defined hours radio button. Remember that you can
quickly zoom into a selected time period by clicking the left mouse button,
dragging across the graph and releasing (double click to return to full view).
The Fixed period length drop-down menu can be used to set the time periods for
the period based volume, for OHLC bars, candlesticks, analytics and indicators
such as moving averages and RSI. For example, if you select 5 minutes from
the drop-down menu and have already selected period based volume from
the Trades tab (see page 16), the volume histogram will show the cumulative
volume figures for each five minute period rather than for each and every trade
that comes in.
The Start with full period and Start with half period options change the starting
point of each period bar. In the case of sixty minute periods, using Start with
full period would begin each bar at the start of the hour. Using Start with half
period would begin each bar at half past each hour.
Lines & Text Tab
Allows you to edit all the colours, text and lines in the graph window.
As different stock exchanges operate on different time zones the Time Zone
Label can be used to identify the time zone for a specific share. The label will
display a code for the time zone and then the time difference in relation to
Greenwich Mean Time (GMT).
The Day Separator option allows you to choose how data is displayed for
multiple days. Gap will add a space between days, Frame will draw a line
between days and None will display continuous prices between days viewed.
Style Tab
You can edit the background colour and add, remove and style the
watermark.
Watermarks that can be added include Epic Code, Last mid price, Mid price
change, Bid/Offer prices, Volume title, Average trade volume, Analytic title,
Last analytic value.
Page 17
Analytics Tab
The calculation of analytics can be edited on an intraday graph when two or
more day’s history is displayed.
If you select the Use all data radio button, this will use all available data for
each day. This includes price movements outside of normal market hours. If the
Use Graph time radio button has been selected the Analytics will be calculated
using trading hours only. To define your own set period, select the User defined
radio button and specify the required times from the adjacent boxes.
In the lower half of the Analytics tab you can choose to have the analytic
indicators flow between days, if more than one day is displayed. For example,
if you have two days of intraday prices displayed with a moving average, you
may wish to see the moving average calculated continuously across day 1 and
day 2, so that at the start of day 2 the moving average will still be using prices
from the end of day 1. This will affect all the intraday indicators available in
ShareScope Plus and Pro including moving averages, Bollinger bands, RSI
and MACD indicators.
Other options include: Draw a timescale below analytic graphs, No gap
between analytic graphs and Show title on analytic graphs. These options
are also available for historical graphs and are detailed in Section 4 of the
ShareScope User Guide.
The OHLC Data Summary shows the data source and the period length details
that you are using for your indicators. You can edit the source (mid prices or
trade prices) in the Price tab. You can edit the period length in the Time tab.
Intraday Analytics
To add analytics to the intraday graph window, right click over the graph and
select Add Indicator or Add Market Graph from the context menu (as shown
on page 14).
Among the many analytics available are ATR (Average True Range), RSI (Welles
Wilder’s Relative Strength Indicator), MACD (Moving Average Convergence
Divergence), ADX (Average Directional Movement) and Stochastic Oscillator
indicators, as well as Advance/Decline Line and STIX market graphs. You
can display up to four indicator windows at a time, with up to four indicators in
each window. They can be maximised and re-sized independently and all are
updated intraday.
The analytics and moving averages are based upon the Fixed period length
set in the Time tab of the graph design dialog box (see page 17). So if you set
a fixed period length of 5 minutes, a 20-period moving average will be based
on the last prices in each of the twenty prior 5-minute periods. The data source
for your indicators can be viewed in the OHLC Data Summary (see above).
For a full list and definition of all the indicators and market graphs available in
ShareScope Plus and Pro please see the on-screen Help menu.
Page 18
Lines
You can add lines to the intraday graph window by selecting Lines & Text from
the context menu, or using Shift and dragging with the left mouse button
just as you can on your historical graph. Using right shift and left click adds
a horizontal line starting from the cursor.
Under the Lines & Text sub menu there is also a choice of line studies available.
These include Fibonacci Arc, Fibonacci Fan, Fibonacci Retracement, Gann
Angles and Speed Resistance Lines.
You can also draw lines on the analytics windows and the volume histogram in
the intraday and historical graph windows.
Line studies and manually added lines can be drawn across more than one
day.
For information on the historical graph window that is not mentioned here, please
see the ShareScope User Guide, Section 4.
Shapes
You can add Shapes to intraday graphs to mark or highlight areas of interest.
To add a shape, right click on the graph screen, select Lines and Text and
then Draw a Shape.
Your cursor will then turn into a crosshair. Click on the graph where you want
the shape to start and drag the mouse to position and size your shape.
To edit the shape or its settings right click inside the body of the shape and
select Colour and Style....
To display a shape on more than one graph setting, right click on the shape
and go to Select Display.... You can choose to apply a shape to All Settings,
Current setting only or Selected settings.
Page 19
Page 20
6. List Window
ShareScope Plus and Pro list windows have several important extra features
and functions.
When you are connected to the intraday feed, incoming prices flash in the
window as data is received. As the default setting, intraday prices will flash
green when a price has risen, yellow if the price stays the same, and red if the
price drops.
Prices can be displayed in pounds or pence with up to three decimal places: right
click over any price column heading (mid, bid or trade etc.) and select Numeric
display from the context menu. Of course, currencies other than pounds can
apply if the share is listed on an overseas exchange.
In this window you can also view micrographs. These visually enhance your
display and provide a variety of information, including the share mid price, the
ratio of buy and sell trades and the bid-offer spread. More details on micrographs
are available on pages 25 and 26.
Page 21
Context Menu
Right click in the list window to view the context menu:
List Design
By selecting List design… from this menu, you can design the layout of your
ShareScope Plus or Pro list window (see the dialog box on opposite page).
On the left of the list design dialog box is the Wrap Columns (if possible) option.
If you were looking at a list of FTSE 100 shares, showing the name and mid
price columns only, you would see a large gap to the right of the columns. If
you tick the Wrap columns box, the columns will repeat themselves until either
the entire FTSE 100 is shown, or the window is full. This feature allows you to
see far more shares in one window.
Page 22
The Text tab lets you change the colour of the text and background within the
list window. Click on the colour box next to any of the options listed and select
the colour you want to use.
The Colours tab offers options to edit the appearance of the list window.
You can alter the colour of the Vertical and Horizontal lines as they appear in
the list screen. The Arrows options allow you to change the colour of the Up,
Down and Same directional arrows. The Flash Colours settings can be used
to edit the colours of the incoming prices as they flash in the window. For each
price movement there are two options. One is for the colours of the selected (or
highlighted) share (Price up selected, Price same selected and Price down
selected), the other is for the rest of the shares in the list (Price up, Price
same and Price down).
The Pop-up Graphs tab allows you to change the size, font, colour and layout
of Pop-up Graphs in the list screen. Final, forecast and announced results can
be coloured differently and actual results may be marked with a symbol. You
can set graphs to use daily data where available or just results day data.
The Micrographs tab gives you the option to change the colours of the various
micrographs that can be added to the list window (see pages 25 and 26 for
further information on micrographs).
The Buy, Sell and Unknown options relate to the Buy/sell bar micrograph and
you can change the colours of this graph to suit your personal preferences. Tick
up, Tick down and Tick same allow you to change the colours for the Tick
changes micrograph. Graph will change the colour of both the Spread graph
and Graph micrographs. Thermograph up and Thermograph down change
the Thermograph micrograph colours.
Page 23
Adding Intraday Columns
ShareScope Plus and Pro allow you to display many columns that are designed
specifically for intraday data. To select these columns place the mouse pointer
over the grey column heading area and right click. You will see the following
menu:
On selecting Add Intraday Column… from this list, you will be given the
following options:
All the headings that you see in the dialog box can be added as columns in the
list screen and updated intraday.
Click the Advanced >> button at the bottom right-hand corner of the dialog box
for a greater choice of intraday columns.
Page 24
The choices on the Prices tab allow you to create custom columns based upon
the bid and offer prices.
For example, if you select Mid bid/offer as the Price, Price as the Price Type,
and Latest Value as the Value, you will see today’s latest mid price value. Time
shows the time when the bid and offer were last updated.
The various options are dynamic and will change depending upon your selection.
For instance, if you choose High as the Price Type, the third options box will
change from Value to High/Low options, which are relevant to the price high,
and a new fourth option Time will appear. If you select VWAP (Volume Weighted
Average Price), you will see the second and third options disappear but the
fourth option Time will appear.
When the Time option is showing, you can show trades or prices from several
days ago by selecting Previous days and entering a number of days in the
box.
The second tab in the Advanced dialog box is Trades. This allows you to add a
column based on trades. The choices available are Trade price, Volume, Value,
Count, and Time. Value is the number of shares traded times the price. Count
is the number of trades and again, Time displays the time of the last trade.
The third tab in the Advanced dialog box is the Graphs tab, which allows you
to pick one of five micrographs. These graphs are intended to give you a visual
impression of the day’s trading.
Page 25
These include:
Graph
The mid price graph for the current day.
Spread graph
Graph of the spread value between the bid price
and offer price.
Tick changes
Shows trade ticks by either increase or decrease.
Thermograph
Bar chart showing the changes to the mid price
over time.
Buy sell bar
Bar chart displaying the day’s trades as buys,
sells or unknowns. This information is inferred
from the price of the trade and the bid/offer price
at the time of the trade.
The fourth tab is Open / Close. This allows you to add a column showing the
current day’s open or close prices.
You can choose to show Open / Close prices from several days ago by selecting
Previous days from the Time options and typing in the number of days required
in the box.
For further details about micrographs please see the on-screen Help.
Fit Width
The Fit Width option on the context menu will automatically set the column
width required to fit the information displayed. You can also do this by moving
the mouse cursor between two column headings and double clicking.
Sorting Columns
All list columns within ShareScope can be sorted by double clicking on the
column heading. The heading of the sorted column will be in bold text.
If you are sorting by intraday columns, you can set these to be resorted
automatically as data comes in. Select Tools : Options… : Lists. In the dialog
box below the Intraday option, tick Auto resort every five minutes and intraday
columns will be refreshed at five minute intervals.
Many of the features available in the ShareScope Plus and Pro list windows
are not described in this guide. For further information, please refer to Section
6 of the ShareScope User Guide.
Page 26
7. Ticker
The ticker is a rolling window that displays trades and index values. If it is
not showing on your screen, you can activate it by selecting Window : New
window : Ticker.
The information can be displayed in a variety of styles. Above you can see an
example of a vertical scrolling ticker.
Each line shows the price, volume, price change since open and the percentage
change since open for the given share.
Positioning the ticker gives you the flexibility to have it displayed anywhere on
your screen. To do this, place your mouse pointer over the ticker window and
click and drag to a position that suits you.
The size of the ticker can also be increased or decreased to suit your preference.
To do this, place your mouse pointer over the window border and then click
and drag to the required size.
Page 27
Price Ticker Display
You can adjust the information and display of the price ticker window by right
clicking over the ticker and selecting Ticker design…. You can also select
Ticker : Ticker design… when the ticker window is selected.
In the ticker design dialog box that appears, you have a number of options
from which to choose, enabling you to set the price ticker to display exactly the
information you want to see.
At the top are the Speed settings, the first being Variable speed. With
this option selected, the ticker speed will vary according to the amount
of data flowing through. Next is Constant speed; with this selected,
you can adjust the speed irrespective of the amount of data coming
in. Adjust the constant speed by using the range slider to the right.
If you tick the Discard data older than 15 seconds box, ShareScope will ignore
any data not yet visible on the ticker that is older than 15 seconds.
Below this are two colour buttons, No data background and Excess data
background. The first allows you to select a background colour for where there
is no data coming through. The second allows you to select a background colour
for data older than 15 seconds, unless you have already chosen to discard data
older than 15 seconds (see above).
Page 28
The Display details options allow you to add or remove display details such
as Time, EPIC, Name, Price, and Volume by ticking or un-ticking in the box
next to each item. You can also choose Price change since open (absolute
change in value from open), Price % change since open (percentage change
in value from open), Price change since close (absolute change in value
from previous close), and Price % change since close (percentage change in
value since previous close). If the last two are selected, they will be displayed
in brackets in the ticker.
The Format options offer you four alternatives for the format of the price ticker.
You can choose from:
1 line
One line of data is displayed, scrolling horizontally from right to left.
2 line
Two lines of data are displayed, scrolling horizontally from right to left.
4 line
Four lines of data are displayed, scrolling horizontally from right to left.
Vertical
One or two lines of data are displayed (depending on how many details
you have chosen to display - see above), scrolling vertically from bottom
to top.
Below the Format options are the Prices colour options. Different colours can
be chosen to indicate share price movements. For example, if you select Up
as blue and Down as red, then any prices that have risen will be displayed in
blue and prices which have fallen will be displayed in red.
To the lower right of the dialog box, the Share filters options allow you to select
which groups of shares and indices are included in the ticker. You can add or
remove the FTSE 100, FTSE 250 and Indices among others.
A very powerful feature is that you can select to display only shares from specific
portfolios. To do this tick the Portfolio 1 and Portfolio 2 options (only available
after you have created your own portfolios). Then use the drop-down menus
to the right of these to select which of your portfolios you wish to view. If you
only want to see the shares in your portfolios in the ticker window, make sure
that all the other Share filters options are not ticked.
Page 29
To the right of the options are the colour and font selection buttons. This gives
you the opportunity to highlight companies from specific groups of shares. For
example, to make FTSE 100 shares stand out from any other shares, simply
click on the Abc button next to FTSE 100, change the colour choice for the
background to yellow and click OK. ShareScope will then display all shares
from the FTSE 100 with a yellow background. As the trade prices come in, you
can immediately tell FTSE 100 shares from the others.
Closing the Price Ticker
To close the Price Ticker, right click over the ticker and select Close ticker
window from the context menu that appears.
Page 30
8. Intraday Alarms
Setting and Adjusting Individual Share Alarms
Alarms can be added to individual shares and monitored intraday. Highlight a
share and select Edit : Intraday alarms. This will bring up a sub-menu with
four options, the first being Edit alarms for [share name]. Select this and you
will see the following dialog box.
Page 31
ShareScope will always show you the share name and its current price at the
top left of the dialog box. This will be the current intraday mid price.
Just beneath the current price, you can select a Fixed price increase or
decrease. Tick the relevant box and then type in the increase/decrease figure
to the right. If the mid price moves above or below your fixed price options, an
alarm will be triggered.
Beneath this, you can set Percentage increase in price or Percentage
decrease in price alarms. By default, all alarms will be set to start from the
opening mid price of the current day. So if you tick a Percentage increase in
price box and type in 5, an alert will automatically trigger when the share price
rises more than 5% above the opening price.
If you wish to change the starting point for the alarm click on the since open
button. A dialog box will appear allowing you to select a new start point. You
can select between the Open Price (current day’s opening price), Close Price
(previous day’s close price) as well as Minutes ago, Hours ago and Trading
days ago by typing in the number of minutes/hours/days you want in the box.
When you have made your selection, the since open button will change to show
the choice you have made. You can select up to three price increase and three
price decrease options per share.
Further down in the dialog box you have the option to set an alarm to trigger
on a specified date and time: tick the Timer option and choose the date and
time for the alarm.
To the right of this is the Stop-loss alarm. You can set an alarm to trigger if your
share falls a certain percentage by ticking the percent from high box. Whatever
number you type in will be the percentage by which the price needs to drop below
the high before the alarm is triggered. The price used for the stop-loss alarm
will be the highest price after the date and time set in the boxes below.
Tick the News alarm on incoming stories box if you wish to be informed when a
news story comes in for the selected share. For each news story on your chosen
share, the triggered alarms dialog box will show the company name as well as the
date and time the news story was received. For more information on displaying
triggered alarms, please see Viewing Triggered Alarms on page 34.
At the bottom of the dialog box is the Alarm note: section. If you wish to make
any notes about the alarm for future reference, type them in here.
You can also set alarms on lines you have drawn yourself. To draw a line, hold
down the Shift key and click and drag the mouse. Once the line is in place,
highlight the line and right click. Select Alarm on line from the context menu.
Once the current mid price crosses either above or below the line, an Alarm
will be triggered.
For information on setting Closing Price alarms, please refer to Section 9 of
the ShareScope User Guide.
Page 32
Adding Global Alarms
As well as setting alarms for individual shares, alerts can also be set for groups
of shares. These are known as global alarms.
Global alarms can be added by selecting Edit : Intraday alarms : Edit global
alarms. A dialog box (below) will appear that allows you to set intraday global
alarms.
At the top of this menu, there is a Source option to choose the required data
source. You can choose between Shares (equities only), FTSE 100 (FTSE 100
only), or Other. Next to Other is a drop-down menu with a selection of other
groups (such as NASDAQ, FTSE 30 and Foreign Exchange). Another group
available is User portfolio (which can be found above All). This allows you to
set up global alarms on your own watch list of shares. Once you have selected
the source, you will need to set the alarm limits.
You can limit global alarms to those triggered within a certain time period by
ticking the Limit alarms to the last X minutes option and typing in the number
of minutes you require ShareScope Plus or Pro to check back.
There are five tabs in the Global Alarms dialog box that allow you to select
different types of alarms.
The five options for intraday alarms are: Percentages (mid price movements
over a specified period), Moving Average (dead/golden crosses over set
periods), MACD (checking for crosses), RSI (rise/drop over set levels) and
Stochastic (check for crosses and rise/drops over set levels). Underneath
each tab are the available options.
Page 33
By ticking Check for golden crosses under the Moving Average tab for
example, you will activate the moving average alarm. Once activated, type in
the number of intervals required (one for the Short MA interval count and one
for the Long MA interval count). ShareScope will now search your selected
source for any shares which cross in the two moving average periods selected.
Or by selecting Check for crosses in the RSI tab, you can search for shares
whose Relative Strength Indicator has crossed either above or below a certain
value. You can set these values in the three text boxes, RSI interval count, RSI
high percent, and RSI low percent. You can also choose between Simple,
Exponential, and Wilder.
Each interval length for alarms is 5 minutes.
For more details of each alarm tab please see the on-screen Help.
Viewing Triggered Alarms
To view intraday alarms which have been triggered, select Edit : Intraday
alarms : Triggered alarms. This will bring up a dialog box with a list of all
activated alarms.
To view options, click Alarm Options at the bottom of the dialog box.
To display the triggered alarms dialog box every time an alarm is activated, tick
Display triggered alerts dialog under the When an alarm goes off options.
To set an audible alarm, tick the Audio alarm box. Underneath this are two
options, the first being System beep. By selecting this your computer will beep
every time an alert is triggered.
The .wav file option allows you to create your own sound for the audible alarm.
Please note that you must have the right PC and software setup to be able to
do this. If you can record sounds to a .wav file, you can search for that file and
set it as the audible alarm.
The Flash window tick box informs you of any activated alarms that are
triggered even when you are using other programs. As long as ShareScope
is running, you will see the ShareScope icon on your taskbar flash the minute
your alerts are set off.
Finally, by selecting Write alarms to log file, you can set up a log file outside
of ShareScope that will keep a record of all alerts that have been triggered.
This file will keep details of all historical alarms and you can also view them
independently of ShareScope.
Two further options under Alarm options are Start alarms at Market Open
and Start alarms at Market Open + 15 min. Choose when you want your
alarms to start checking from: due to the volatile nature of the markets in the
first 15 minutes, alarms from the market open can sometimes be misleading,
although data in the first 15 minutes is still valid trading information that you
may want to include.
Page 34
Limit alarms to last X minutes allows you to limit the period of time ShareScope
will check back for triggered alarms. Once ticked, enter the required time period
to be checked.
Triggered Alarms
At the bottom of the Triggered Alarms dialog box there are four different
buttons.
Alarm Options
This allows you to review and edit your alarm settings in the same way as you
can set alarm functions by selecting Tools : Options : Intraday alarms.
Edit Settings
Select the Edit settings button to review and edit the highlighted alarm (for
instance to turn off date alarms). If no alarm is highlighted then the global
alarms dialog will appear.
Reset Alarm
Select the Reset alarm button to reset the highlighted alarm (allowing the
alarm to trigger again).
Reset All
This allows you to reset all the alarms that you have set. It deletes all alerts
and allows them to be triggered again.
Note that triggered alarms are forgotten by ShareScope when the program is
closed. Therefore, if ShareScope is left open overnight, triggered alarms will
remain in the memory and include those from the previous day.
Page 35
Page 36
9. Trades and Quotes List
The Trades and quotes list allows you to view all the trade and price movements
for a share during the current trading day. Select Window : New Window :
Trades and quotes. To view a list of Trades and quotes for a particular share,
you can either use the Find A Share function (type the first few letters of the
share you are looking for) or you can link the Trades and quotes window to
another window (see Linking Windows on page 11). The trades and/or quotes
for the selected share in the linked window will be shown.
Trades or Quotes
ShareScope Plus and Pro can display the movements of both the price of each
trade and the mid, bid and offer prices.
Right clicking over the window displays a context menu that allows you to
select the information you want displayed. If you want to see trades select
Trades from the context menu. If you wish to see changes to the mid, bid, and
offer prices select Quotes. If you want to see both in the same window select
Trades and quotes.
Trade information is not applicable to indices (such as the FTSE 100, S&P 500
or FTSE AIM) and will not be displayed.
Page 37
You have the option to view trades and quotes for previous days by selecting
either Previous trading day, Choose date... or Next trading day from the
context menu. Using Ctrl and the left (or right) arrow key on your keyboard
will also change the day you are viewing.
The Trades Summary dialog box can be accessed by double clicking in the
window or from the context menu. It presents an up-to-the-minute breakdown
of trade count, value, and volume for a share in terms of buys, sells and
unknowns. The Trade Summary can also be accessed from the following
screens: List, Portfolio, News, Directors’ Dealings and Data Mining by
pressing the ? key on your keyboard.
Adding Columns
To add columns, right click over the column heading area. Select Add
Column from the context menu that appears. The following menu will then
be displayed.
A tick to the left of the column indicates that the item is already being
displayed.
You can add columns to display Time (the time the trade was executed or the
time of a price movement), the Bid, Mid, Offer and Trade prices, Volume
(the total volume per trade), Trade value (trade price multiplied by volume),
Trade type (as defined by the relevant stock exchange), and Bought or sold
(whether the trade was a buy, sell or unknown), or Market Centre (the market
where the trade took place).
Further information on the Trade type column can be found in the on-screen
Help by pressing F1 in the Trades and quotes window.
Page 38
10. Messaging
If you would like to keep in touch with other ShareScope Plus and Pro users, have
a technical query or would like to send us your ShareScope wishlist requests,
then the real time messaging facility is a convenient way for you to do this.
To view the real time messaging facility available in ShareScope, simply
select View : Real time messages…. The real time message inbox window
will appear.
Please note that you have to be connected to the intraday feed for messages
to be sent or received.
Setting your Profile
Before sending or receiving any messages, you will need to set your user profile.
This is how you will be seen by other messaging users.
Click on Profile at the bottom right of the message inbox window to set your
profile.
Page 39
After agreeing to the messaging policy, you will need to enter a Nick name in the
top text box of the profile dialog box. This is how your name will be displayed in
the Contacts list and when you send messages to other users. This is the only
obligatory entry, so you can remain totally discreet. The rest of the information
is optional and you may enter as much or as little as you choose.
At the bottom of the dialog box are your Privacy options. If you wish to be
seen by other users, make sure that the Allow others to contact me box is
ticked. If you do not wish to be seen make sure that there is no tick in the box.
If you do tick it, you will then be able to enter details under Optional details.
You can add the following:
Actual name, Email address, Age, Investment approach (type of trader you are),
Investment Horizon (long or short term), Years with ShareScope, Years Investing,
and Other (any additional information you may wish to enter).
Under the Privacy options, there is a second option Allow others to know
if I am connected. If this is ticked, ShareScope will let other on-line users
know that you are connected to the intraday feed and are therefore available
for messaging.
The final option is Alert me to incoming messages. Once selected this will
alert you to any incoming messages the moment you receive them by displaying
a dialog box. The dialog box will tell you who the message is from, what the
subject is and gives you the option to read the message or ignore it.
Adding Contacts
Before sending messages, you will need to update your contacts list. To do
this, click on the Contacts button at the bottom right of the message inbox
dialog box.
In this dialog box, you should see a list of nicknames on the left hand side.
These are all the ShareScope users who are currently connected and ready to
use messaging. If you highlight any of the users listed, you will see the user
profile appear on the right-hand side.
If you would like to send a message to any of these users, first highlight the
name of the relevant user. Then using the radio buttons at the bottom right of
the contact list dialog box select Include on my send list. Repeat this for as
many users as required. Once you have added all the users you want, close
down the contacts list.
Sending Messages
Click on Compose at the bottom left of the message inbox dialog box to open
a new message. From the compose message window, use the To: drop-down
menu to select the user you wish to contact. Please note that ShareScope
support, ShareScope administration and ShareScope wishlist are
automatically included on this list so you can contact us easily. Underneath
the default ShareScope addresses are the users you have added from your
contacts list.
Page 40
To send a message, select the name of the person you wish to send the message
to. Type the title of the message in the Subject box and the message in the
space provided. Click on the Post button in the bottom right-hand corner of
the window. The message will be sent and it should reach the recipient within
about five seconds, depending on the quality of the internet connection you
are using.
Reading Messages
Incoming
In the message inbox dialog box, you will see a list of all the messages you
have received. The title bar will tell you how many messages you currently
have in your inbox.
For each message, there will be the time and date of receipt, the name of the
sender and the subject heading.
To read a specific message, highlight the relevant message in the list of
messages. You will then see the text of that message in the bottom half of the
message inbox.
If you wish to reply to a message that you have received, select the message
you want to reply to, and click on Reply at the bottom left of the message inbox
window.
Alternatively, you can right click over the message in the message list, and select
Reply message… from the context menu that appears.
Outgoing
To read outgoing messages that you have sent, click on the View outbox
button at the bottom of the message inbox window. You will then see a list of
all messages you have sent. To read a specific message, highlight the subject
heading in the message list and the text will appear in the bottom half of the
dialog box.
Closing Messaging
To close the real time messaging facility, click on the X at the top right-hand
corner of the messaging window, or the Close button in the bottom right-hand
corner.
Page 41
Page 42
11. Dynamic Data Exchange (DDE)
A Dynamic Data Exchange (or DDE) link allows you to export intraday data
into a spreadsheet (such as Microsoft Excel or Lotus 1-2-3) and watch the data
update continuously.
ShareScope aims to provide all the information that you need for trading in the
program. However, should you wish to make your own calculations based on
our data, you can do so by using a spreadsheet with the DDE function. This is
designed to add extra flexibility to ShareScope Plus and Pro.
Below is an example of a working Dynamic Data Exchange.
Creating a DDE Link
With ShareScope Plus or Pro running, open your spreadsheet software and a
new worksheet (this will normally happen as soon as you open the program).
Once this worksheet is open, you can begin to write in a formula to collect the
data from ShareScope.
Page 43
Examples
If you want to see a fully working Dynamic Data Exchange spreadsheet, an
example is provided with the program. It is called ShareScopeDDE.xls and
the file can be found in the ShareScope Plus or ShareScope Pro folder on the
hard drive of your computer, e.g. C:\Program Files\ShareScopePro. It is the
spreadsheet shown on the previous page.
Before opening the spreadsheet make sure that ShareScope Plus or Pro is open
and connected to the intraday feed. A dialog box will appear asking if you want
to update all linked information - click on the Yes button. You will now see
the spreadsheet figures changing as the prices change. The sheet contains
the combined total of several indices, an example portfolio, and all available
details for one sample share (HSBC plc).
Using the example spreadsheet will help you to understand the formula needed
for the DDE link.
DDE Formulae
To create your own DDE spreadsheet, you will need to write a specific formula
to extract each item of information required.
Select the cell you wish to add the data to, then type in the following formula to
point your spreadsheet to ShareScope Plus or Pro:
=ShareScopeDDE|EXCHANGE_EPIC!A_B (For A and B see page 46)
A few examples of the different exchange codes include:
FX
Foreign Exchange (Forex)
LSE
London Stock Exchange (listed equities)
NAS
NASDAQ Indices (US)
UKI
United Kingdom Indices (e.g. FTSE 100)
USI
American Indices (e.g. DJIA, S&P 500)
For a full list please see the on-screen Help.
For EPIC put in the code of the relevant company or index.
Then you will need to add the extra information for the type of data that you
want to extract. You can do this using the table on page 46.
Page 44
Here are some further examples of formulae to help get you started:
FTSE 100, United Kingdom Indices, Current Mid Price
=ShareScopeDDE|UKI_UKX!MID
Vodafone Group plc, London Stock Exchange, Lowest Mid Price
=ShareScopeDDE|LSE_VOD!MID_LOW
Microsoft Corp, NASDAQ (normal market), Trade Price
=ShareScopeDDE|NNM_MSFT!TRADE
Hilton Hotels CP, New York Stock Exchange, Opening Price
=ShareScopeDDE|NYSE_HLT!RTOPEN
US Cellular, American Stock Exchange, Previous Close Price
=ShareScopeDDE|AMEX_USM!CLOSE
These examples show you how to combine the formula using the table on page
46 to add the necessary information to your spreadsheet.
Once the intraday data formulae have been added as required, you are then
free to use all the functions of a spreadsheet package to manipulate the
information.
For more information on the functions of DDE links, please refer to section 16
of the ShareScope User Guide and consult the Help menu in your spreadsheet
package or the ShareScope on-screen Help.
Page 45
Page 46
Index
A
Alarms
Adding global alarms, 33
Adjusting individual alarms, 31
Alarms on lines, 32
Intraday alarms, 31
News alarms, 32
Setting individual alarms, 31
Triggered alarms, 35
Viewing triggered alarms, 34
Analytics
Intraday analytics, 18
C
Columns
Adding intraday columns, 24
Adding trades/quotes columns, 38
Fit width, 26
Sorting columns, 26
Context menus
Intraday columns context menu, 24
Intraday graph context menu, 14
List window context menu, 22
Trades/quotes context menu, 37
D
Data
Delivery levels, 7
Intraday data, 5, 7
Licence agreements, 7
OHLCV data, 5
Dynamic Data Exchange (DDE)
Creating a DDE link, 43
DDE formulae, 44
Examples, 44
E
Exchanges
Selecting exchanges, 7
Page 47
G
Graphs
Adding intraday analytics to graphs, 18
Graph design, 14
Intraday graph design, 14
Intraday graph window, 13
Lines on graphs, 19
Micrographs, 21, 25, 26
Shapes, 19
I
Intraday
Adding intraday columns, 24
Alarms, 31
Adding global alarms, 33
Adjusting individual alarms, 31
News alarms, 32
Setting alarms on lines, 32
Setting individual alarms, 31
Triggered alarms, 35
Viewing triggered alarms, 34
Analytics, 18
Connecting to the data feed, 8
Data, 5, 7
Add or share intraday data, 10
Graph window, 13
Analytics, 18
Context menu, 14
Graph design, 14
Lines, 19
Shapes, 19
List window, 21
News, 9
Price history, 10
Terminology, 5
Trades and quotes list, 37
Windows, 11
Page 48
L
Library
Opening the library, 15
Saving and restoring settings, 15
List window
Adding intraday columns, 24
Context menu, 22
Fit width, 26
List design, 22
List window, 21
Sorting columns, 26
M
Messaging, 39
Closing messaging,
Reading messages,
Sending messages,
Setting your profile,
41
41
40
39
N
News
AFX news, 9
Intraday news, 9
Intraday news alarms, 32
O
OHLCV
OHLCV data, 5
OHLCV terminology, 6
Q
Quotes
Adding trades/quotes columns, 38
Trades and/or quotes list, 37
Trades or quotes, 37
T
Terminology
Intraday terminology, 5
OHLCV terminology, 6
User guide terminology, 3
Page 49
Ticker, 27
Closing the price ticker, 30
Ticker design, 28
Trade and/or quotes list, 37
Adding columns, 38
W
Windows, 11
Adding and resizing windows, 12
Intraday graph window, 13
Linking windows, 11
List window, 21
Resizing windows, 12
Windows layout, 12
Page 50
Ionic Information Limited
140 Goswell Road, London, EC1V 7DY
Phone 020 7549 1100 • Fax 020 7549 1101
Email [email protected] • Web www.sharescope.co.uk