1
Cisco Performance Visibility Manager 1.0
Technical Implementation Guide
Corporate Headquarters
Cisco Systems Inc.
170 West Tasman Drive
San Jose, Ca 95134-1706
USA
http://www.cisco.com/en/US/products/sw/netmgtsw/index.html
Tel:
408 525-4000
800-553-NETS (6387)
FAX: 4008 526-4100
Corporate Headquarters
Cisco Systems, Inc.
170 West Tasman Drive
San Jose, CA 95134-1706
USA
www.cisco.com
Tel: 408 526-4000
800 553-NETS (6387)
Fax: 408 526-4100
European Headquarters
Cisco Systems International
BV
Haarlerbergpark
Haarlerbergweg 13-19
1101 CH Amsterdam
The Netherlands
www-europe.cisco.com
Tel: 31 0 20 357 1000
Fax: 31 0 20 357 1100
Americas Headquarters
Cisco Systems, Inc.
170 West Tasman Drive
San Jose, CA 95134-1706
USA
www.cisco.com
Tel: 408 526-7660
Fax: 408 527-0883
Asia Pacific Headquarters
Cisco Systems, Inc.
168 Robinson Road
#28-01 Capital Tower
Singapore 068912
www.cisco.com
Tel: +65 6317 7777
Fax: +65 6317 7799
Cisco Systems has more than 200 offices in the following countries and regions. Addresses, phone numbers, and fax numbers are listed on
the Cisco Web site at www.cisco.com/go/offices.
Argentina • Australia • Austria • Belgium • Brazil • Bulgaria • Canada • Chile • China PRC • Colombia • Costa Rica • Croatia • Cyprus
Czech Republic • Denmark • Dubai, UAE • Finland • France • Germany • Greece • Hong Kong SAR • Hungary • India • Indonesia • Ireland
Israel • Italy • Japan • Korea • Luxembourg • Malaysia • Mexico • The Netherlands • New Zealand • Norway • Peru • Philippines • Poland
Portugal • Puerto Rico • Romania • Russia • Saudi Arabia • Scotland • Singapore • Slovakia • Slovenia • South Africa • Spain • Sweden
Switzerland • Taiwan • Thailand • Turkey • Ukraine • United Kingdom • United States • Venezuela • Vietnam • Zimbabwe
Copyright © 2004 Cisco Systems, Inc. All rights reserved. CCIP, CCSP, the Cisco Powered Network mark, Cisco Unity, Follow Me Browsing, FormShare, and StackWise
are trademarks of Cisco Systems, Inc.; Changing the Way We Work, Live, Play, and Learn, and iQuick Study are service marks of Cisco Systems, Inc.; and Aironet, ASIST,
BPX, Catalyst, CCDA, CCDP, CCIE, CCNA, CCNP, Cisco, the Cisco Certified Internetwork Expert logo, Cisco IOS, the Cisco IOS logo, Cisco Press, Cisco Systems, Cisco
Systems Capital, the Cisco Systems logo, Empowering the Internet Generation, Enterprise/Solver, EtherChannel, EtherSwitch, Fast Step, GigaStack, Internet Quotient, IOS,
IP/TV, iQ Expertise, the iQ logo, iQ Net Readiness Scorecard, LightStream, Linksys, MGX, MICA, the Networkers logo, Networking Academy, Network Registrar, Packet,
PIX, Post-Routing, Pre-Routing, RateMUX, Registrar, ScriptShare, SlideCast, SMARTnet, StrataView Plus, Stratm, SwitchProbe, TeleRouter, The Fastest Way to Increase
Your Internet Quotient, TransPath, and VCO are registered trademarks of Cisco Systems, Inc. and/or its affiliates in the United States and certain other countries.
All other trademarks mentioned in this document or Web site are the property of their respective owners. The use of the word partner does not imply a partnership relationship
between Cisco and any other company. (0402R)
Printed in the USA
All contents are Copyright © 1992–2004 Cisco Systems, Inc. All rights reserved. Important Notices and Privacy Statement.
Page 2 of 66
TECHNICAL IMPLEMENTATION GUIDE
Cisco Performance Visibility Manager 1.0
INTRODUCTION ............................................................................................................................................................................4
DATA COLLECTION AND TRAFFIC ANALYSIS ..........................................................................................................................4
TRAFFIC ANALYSIS INCLUDING TOP-N ANALYSIS ..................................................................................................................4
ART MONITORING .......................................................................................................................................................................4
HISTORICAL INFORMATION ........................................................................................................................................................4
REAL TIME AND TRENDING REPORTS .......................................................................................................................................4
PROACTIVE MONITORING ...........................................................................................................................................................4
NAM GUI DRILL DOWN ..............................................................................................................................................................5
CISCOWORKS AND LDAP INTEGRATION ..................................................................................................................................5
DEPLOYMENT CONSIDERATIONS AND PLANNING ..........................................................................................................6
STEPS IN THE PVM DEPLOYMENT PROCESS .............................................................................................................................6
Basic questions about the Problems to be addressed ..............................................................................................................7
Placing Cisco NAM in Your Network .....................................................................................................................................7
Typical workflow for deploying Cisco PVM............................................................................................................................8
Configure the NAMs in Your Network....................................................................................................................................8
Deploy PVM and add the NAMs in Cisco PVM......................................................................................................................8
Create the Datasource Groups (DSGs) in Cisco PVM............................................................................................................9
Start monitoring your network using Cisco PVM...................................................................................................................9
USAGE SCENARIOS ....................................................................................................................................................................10
NAM SETUP ................................................................................................................................................................................10
CISCO PVM INITIAL SETUP .......................................................................................................................................................11
USAGE SCENARIOS: GATHER STATISTICS AND TEST MONITORING AND TROUBLESHOOTING .......................................19
Scenario 1: Traffic Profiling .................................................................................................................................................19
Scenario 2: Proactive Monitoring .........................................................................................................................................25
Scenario 3: Troubleshooting .................................................................................................................................................31
OVERVIEW OF PVM FUNCTIONALITY .....................................................................................................................................35
Traffic Analysis using Cisco PVM ........................................................................................................................................35
Application Response Time Analysis in Cisco PVM.............................................................................................................42
Baselining and Alerts in Cisco PVM .....................................................................................................................................46
CISCO PVM REQUIREMENTS AND SIZING ...............................................................................................................................51
CISCO PVM INSTALLATION AND UNINSTALLATION .............................................................................................................52
MAINTAINING AND TROUBLESHOOTING CISCO PVM ...........................................................................................................56
CONCLUSION ...............................................................................................................................................................................59
APPENDIX .....................................................................................................................................................................................60
DEPLOYMENT Q&A ...................................................................................................................................................................60
DEPLOYMENT TROUBLESHOOTING .........................................................................................................................................63
FOR MORE INFORMATION.........................................................................................................................................................65
All contents are Copyright © 1992–2004 Cisco Systems, Inc. All rights reserved. Important Notices and Privacy Statement.
Page 3 of 66
INTRODUCTION
The Cisco® Performance Visibility Manager is an enterprise-level, centralized network management tool that enhances the Cisco Network
Analysis Module (NAM) for Cisco Catalyst® 6500 Series switches, 7600 Series routers and Branch Routers series. Cisco PVM provides a
centralized and integrated End-to-End (E2E) network view, by aggregating and correlating information from multiple NAMs that are
strategically deployed in the network. Cisco PVM is highly scalable, and uses a highly extensible architecture which makes it easy to add
additional Cisco device instrumentation like Netflow, IP SLA agent and NBAR in future releases.
Cisco PVM is a feature-rich network management tool.
The following features are currently available in PVM 1.0.
Data Collection and Traffic Analysis
Cisco PVM collects traffic statistics from multiple NAMs and aggregates the information based on user-defined datasource groups to provide
you an intuitive and integrated end-to-end view of your network, allowing you to quickly pinpoint trouble spots.
Traffic Analysis including Top-N Analysis
Cisco PVM’s Traffic Analysis, including Top-N Analysis, provides unparalleled visibility into the traffic running in your network. By
aggregating and analyzing traffic in real time, you can detect and troubleshoot problems in the network before the users are adversely affected.
PVM has the capability to aggregate real-time information for up to 7 days. You can traverse back in time and troubleshoot a client problem.
ART Monitoring
Cisco PVM’s Application Response Time Monitoring feature lets you correlate response time data from various NAMs and provides you with
information on how much time the traffic spent in the network. Armed with this information, you can quickly identify whether the problem is in
the network or in the application, and direct resources toward solving the issue instead of identifying it.
Historical Information
Cisco PVM provides a highly scalable datastore for retaining historical traffic information. The raw traffic data and the historical aggregated
data are by default stored for long periods of time (up to 3 years) in the datastore.
Real Time and Trending reports
Cisco PVM also provides comprehensive real-time and trending reports to help you with effective capacity planning, trend analysis, and
network status monitoring. Cisco PVM includes a rich set of report suites and a highly flexible scheduler. The ability to automatically run
reports, when used in conjunction with real-time and trending reports is invaluable when trying to monitor your network and troubleshooting it.
Also, reports are automatically archived so that traffic statistics are available even if the data is purged from the data store.
Proactive Monitoring
Cisco PVM’s baselining and alerting feature provides an invaluable tool to proactively monitor your network. By using this policy-based
feature you can automatically baseline your network traffic patterns so you can be alerted in case of any deviations. With Cisco PVM, you can
set dynamic thresholds, which allow you to account for expected variations in traffic patterns while still retaining the ability to identify
anomalous traffic patterns.
Cisco Internal Use Only
Copyright © 2006 Cisco Systems, Inc. All rights reserved.
Page 4 of 66
NAM GUI Drill down
Cisco PVM provides you the ability to drill down into the NAM GUI for more detailed and efficient troubleshooting, once it has been identified
with the help of PVM’s traffic analysis and monitoring components.
CiscoWorks and LDAP Integration
Cisco PVM provides integration with CiscoWorks DCR and LDAP directories and you can efficiently administer your network equipment,
users and credentials.
Cisco Internal Use Only
Copyright © 2006 Cisco Systems, Inc. All rights reserved.
Page 5 of 66
DEPLOYMENT CONSIDERATIONS AND PLANNING
Cisco PVM works in conjunction with the Cisco Network Analysis Modules (NAMs) to provide you in-depth visibility into your network
traffic. In Cisco PVM 1.0, traffic statistics are collected from the NAMs and their associated Switches/Routers. Technologies such as RSPAN
and Netflow can be used to gather data from other devices.
Cisco PVM communicates with the NAMs and their associated devices through SNMP. The data that is gathered from the NAM modules
comes from the SNMP MIBs (Management Information Bases) that the NAM supports (RMON, DSMON and ART). Cisco PVM collects
SMON (VLAN statistics) and mini-RMON (port statistics) and MIB II (interface statistics) information directly from switches and routers.
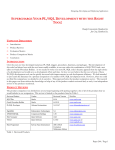
Once NAMs have been deployed and configured, Cisco PVM can be installed and deployed on any machine that meets the hardware and
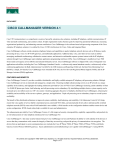
software requirements and has network access to the deployed NAMs and their devices. Figure 1 shows a sample deployment scenario.
Sample Deployment Scenario:
PVM in LAN and WAN
HEADQUARTERS
Traffic statistics from various NAMs are
collected, aggregated and correlated by
PVM
Data Center
REMOTE OFFICE
PVM
3845
NAM
WAN
Cloud
NAM
BRANCH A
NAM
Catalyst
6500
With NAM
2851
Network Management Technology Group
NAM
© 2005 Cisco Systems, Inc. All rights reserved.
Figure 1.
4
Cisco PVM 1.0 Deployment
Steps in the PVM Deployment Process
The steps in the PVM deployment process are as follows. High level descriptions of each of these steps are provided in the sections that follow.
1.
Get answers to the basic questions about the network problems to be addressed (as listed in the following section).
2.
Determine the optimal locations where you can place Cisco NAMs in your network.
3.
Set up the Cisco NAMs and configure them to collect the desired statistics to solve the problem.
4.
Deploy Cisco PVM and add the NAMs and their associated devices in PVM.
Cisco Internal Use Only
Copyright © 2006 Cisco Systems, Inc. All rights reserved.
Page 6 of 66
5.
Create the appropriate datasource groupings of NAMs and/or Switch/Routers to aggregate data from.
6.
Use the Traffic Analysis features of Cisco PVM to identify or troubleshoot the problem.
Basic questions about the Problems to be addressed
To decide how to deploy Cisco PVM and Cisco NAM-1/NAM-2 in the network, first answer some questions that address the purpose and needs
of the administrator and how Cisco PVM and the Cisco NAMs can provide an accurate analysis. This approach helps ensure the effective use of
Cisco PVM and the Cisco NAMs that it depends on for traffic data and minimizes the actual cost of deployment.
The following questions help in deployment planning:
• Is there a specific application or response-time problem?
• Employing voice or data QoS delivery?
• Is the network monitoring for trending, capacity planning, or fault management?
• Are there acute problems? If so, what are they?
• Is the network experiencing some combination of these problems?
A clear understanding of the objectives of monitoring would help make appropriate deployment decisions and would aid in using the Cisco
PVM to your best advantage.
Placing Cisco NAM in Your Network
Once you have answers to the questions the next step is to determine the optimal locations where you can place Cisco NAMs in your network to
get the statistics
Following are suggestions addressing the questions mentioned:
•
For addressing a specific application or response-time problem, place the NAM near the center where servers are located and also
near the client either in access or distribution layer or on a branch router.
•
To monitor QOS, follow one of the following. (1) If you have a configuration where the marking is retained end-end, place NAMs
centrally and monitor the DSCP values. (2) If the marking are set to change at various layers, place NAMs in those layers.
•
For trending and capacity planning, place NAMs at strategic locations in your network such as core/distribution layers, and data
center/server farm levels. If you would like get capacity planning information on branch traffic, then place NAMs at the level as well.
•
To troubleshoot a problem, it is necessary to have NAMs at a location very close to problems. Since you are aware of your network
and most common areas of problems, you would be the best judge of this location. For example, one warehouse has a problem on its
Miami branch where they see huge overload on their circuit between 3:30-4 on Fridays. Hence it is critical for them to have NAMs in
their branch location to easily login and troubleshoot this problem from PVM.
Following is a list of recommendations on possible placement of Cisco NAMs in your network.
• Distribution Layer: Placing the Cisco NAMs at the distribution layer is highly recommended as this layer yields LAN aggregation that is
perfect for providing a NAM with rich data such as application and host usage. One or more Cisco NAMs can be placed at this layer to take
advantage of gathering data on applications, hosts, conversations, virtual LANs (VLANs), and VoIP.
• Server Farms: Place near server farms (Web, FTP, and Domain Name System [DNS], for example), data centers, or near IP telephony
devices (Cisco CallManager), IP phones, and gateways where the Cisco NAM can see request-response exchanges between servers and
clients and provide rich traffic analysis, including ART.
Cisco Internal Use Only
Copyright © 2006 Cisco Systems, Inc. All rights reserved.
Page 7 of 66
• Access Layer: Place Cisco NAMs at the access layer only if critical clients are required to be monitored. IP phones, for example, can be
monitored for latency or for adequate response to and from Cisco CallManagers.
• WAN Edge: Place Cisco NAMs at the WAN edge to gather WAN statistics from Optical Services Module (OSM) or FlexWAN interfaces, or
to collect NetFlow statistics on remote NetFlow-enabled routers. This can provide usage statistics for links, applications (protocol
distributions), hosts, and conversations, which can be useful for trending data and capacity planning.
• Branch Office: Place Cisco NAMs in the branch office to troubleshoot remote sites, similar to being on the campus, but taking full
advantage of the remote accessibility and local data collection of the Cisco NAMs.
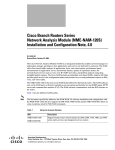
Typical workflow for deploying Cisco PVM
A user can expect to perform the following steps in deploying PVM.
Figure 2.
Typical workflow for Deploying Cisco PVM
Initial steps of work flow such as installation and walk through of general PVM functionality are detailed in a section after the usage scenarios.
Configure the NAMs in Your Network
Once the NAMs have been strategically deployed in the network, it is imperative that they be configured to collect the appropriate statistics that
can aid you in answering the questions you have about the traffic on your network. Cisco NAMs collect some traffic statistics by default.
However, it is always a good practice to verify and ensure that the core statistics that you are interested in are indeed configured to be collected
by the NAM. For more details on configuring NAMs consult the NAM Deployment Guide.
Note: The configuration of the NAMs can also be done after importing them into PVM.
Deploy PVM and add the NAMs in Cisco PVM
Once the NAMs have been deployed and configured, you can deploy PVM on any machine that meets the system requirements for PVM. The
requirements specification is listed in detail in the PVM Requirements and Sizing section. After Cisco PVM is successfully installed, you can
create and manage users who have access to Cisco PVM. You can also configure PVM with information regarding the NAMs and their
associated devices that it should collect traffic data from as described in the PVM Setup section.
Cisco Internal Use Only
Copyright © 2006 Cisco Systems, Inc. All rights reserved.
Page 8 of 66
Create the Datasource Groups (DSGs) in Cisco PVM
Since Cisco PVM collects information from multiple NAMs, and each NAM can be monitoring multiple datasources, you have to group these
datasources together in Cisco PVM to view useful aggregated data. This is essential for aggregation, and also a requirement to perform traffic
analysis and view reports in Cisco PVM. This is described in detail in the PVM Setup section.
Start monitoring your network using Cisco PVM
Once DSGs have been created in PVM, you are ready to start traffic analysis using Cisco PVM. You can view and schedule the wide range of
reports that are available in Cisco PVM. You can also start using the base-lining and alerting features of Cisco PVM. If you want to solve
application response time issues, you can create ART Groups and start seeing response time information from the NAMs. Let’s go through
some of the real-world scenarios to better understand PVM usage.
Cisco Internal Use Only
Copyright © 2006 Cisco Systems, Inc. All rights reserved.
Page 9 of 66
USAGE SCENARIOS
After following the workflow of installing Cisco PVM, the next step is to understand the usage of the statistics provided by Cisco PVM so you
can utilize it to monitor your network. This section provides details on Cisco PVM and NAM setup from configuring NAM to setting up the
data source groups using the Cisco PVM GUI. This section also provides you with scenarios to help you understand and use PVM.
NAM Setup
Once the Cisco NAM modules are deployed, configuration of the Cisco NAM modules can be accomplished through the NAM GUI or the
available CLI interface. This section provides information regarding the configuration for NAMs that is necessary for Cisco PVM to
communicate with them. For more details on the steps necessary to configure the Cisco NAM modules, see the Cisco NAM Deployment Guide.
Cisco PVM requires the following information from NAM:
•
Communication information – This is information necessary for Cisco PVM to communicate with the NAM
•
Statistics Collection information – This is traffic information that Cisco PVM collects from the NAM
The mode of communication between Cisco PVM and the deployed Cisco NAM modules is SNMP. To enable Cisco PVM to talk through
SNMP to the NAM, you have to provide the IP address and the appropriate SNMP community strings. Both Read-Only (RO) and Read-Write
(RW) community strings are required. Cisco PVM does not change configuration information on the NAMs in version 1.0. The exception to
this rule is Response Time configuration, hence the necessity for the RW community string. More information on this is provided in the section
describing the Application Response Time (ART) feature of Cisco PVM.
To configure the IP address and community strings for the NAM and to start the Cisco NAM GUI, you can perform the following steps:
1.
Insert the Cisco NAM module into any available slot (except the slot reserved for supervisor modules) in your Switch or Router.
2.
Decide on host names and IP addresses for each Cisco NAM. Perform basic configuration.
a. Session to the Cisco NAM from the switch/router. Review the Installation and Configuration notes for switches that run Cisco Catalyst
OS or native Cisco IOS Software because this command varies.
An example follows:
Console> (enable) session mod_num --- Catalyst OS
Console> (enable) session slot slot_num processor 1 --- Cisco IOS Software
b. Assign the Cisco NAM following from its CLI. An example follows:
Root@localhost# ip address ip-address subnet-mask
ip broadcast broadcast-address
ip host name
ip gateway default-gateway
ip domain domain-name
ip nameserver ip-address [ip-address]
c. To enable the HTTP server and NAM Traffic Analyzer application, enable HTTP on the Cisco NAM. An example follows:
Root@localhost# ip http server {enable | disable}
For secure web access, you can enable the HTTP secure server.
d. Also, configure all necessary SNMP strings to match the switch’s read-write strings.
For example:
snmp community <community-string> {ro | rw}
3.
Configure the NAM Traffic Analyzer to collect traffic statistics.
Cisco Internal Use Only
Copyright © 2006 Cisco Systems, Inc. All rights reserved.
Page 10 of 66
e. Log into the Web application, configure the SPAN sessions, and enable data collection such as applications, hosts and conversations.
See the following user guide for Cisco NAM.:
http://www.cisco.com/en/US/products/sw/cscowork/ps5401/products_user_guide_list.html
Tip:
Note that Cisco PVM can only collect traffic information that the NAMs are collecting. To see traffic data for a given NAM, ensure that the
NAM is collecting the statistic that you require. The only exception is the Response Time statistics, for which Cisco PVM will configure the
NAM automatically.
Cisco PVM Initial Setup
After the configuration of the NAMs that you have deployed on your network, some configuration activity is required to setup Cisco PVM.
Configuration activities on Cisco PVM include the management of users, management of NAMs and the creation of Datasource Groups. This
section describes the steps needed to configure and manage users in Cisco PVM and the setup of the NAMs and their associated devices.
User Setup
Access to Cisco PVM requires permission-based security assignments. Users are assigned to one of two groups, or account types: Administrator
or General User. The administrator has permissions to perform all available functions in Cisco PVM, while the General User is limited to traffic
analysis functions like viewing reports.
By default, Cisco PVM relies on its own authentication and authorization repository created during installation. After installation, the system
can be configured to use an LDAP (Lightweight Directory Access Protocol) server for user authorizations instead of the Cisco PVM repository.
Note:
If you configure Cisco PVM for LDAP authorization, you will no longer be able to view the user list, add/edit/delete users or modify user
passwords from the Cisco PVM GUI. If you attempt to do any of the operations mentioned, you will see a message informing you that all user
management functions are maintained in an enterprise-specific tool outside of Cisco PVM.
User Management through the GUI
With Cisco PVM you can create, edit and delete users through its GUI. These users are maintained in its repository and any changes to user
credentials through the GUI are only reflected in this repository and are not propagated to tools outside Cisco PVM. You will have created an
Administrator type user during installation, which you can user to login to create additional users. You can create edit or delete users by
clicking on the Admin Tab and Users menu Item and then clicking the appropriate button. To edit and delete users you have to select a user
before performing the action.
Cisco Internal Use Only
Copyright © 2006 Cisco Systems, Inc. All rights reserved.
Page 11 of 66
To add a user, click Add and fill in the appropriate information in the window shown. For more details on configuring users through the GUI,
see the User Guide.
User management through LDAP
Cisco PVM provides the user the ability to manage authentication and authorization through a LDAP server. When configured, Cisco PVM will
use the LDAP protocol to communicate with the LDAP server whenever user authentication or authorization is necessary in PVM.
The LDAP configuration file is located at /opt/CSCOpvm/jboss/bin/texasConfig.properties. When Cisco PVM is not operating in LDAP
mode, the ldap.enabled property in the config file is set to false. To enable LDAP mode, set this value to true.
Cisco PVM can communicate with the LDAP server in two modes: Non-SSL and SSL.
The configuration for Non-SSL is as follows:
•
•
•
•
•
ldap.enabled=true
ldap.auth.scheme=simple
ldap.account.name=admin
ldap.server.name=ware.trendium.com
ldap.server.port=389
The configuration for SSL is as follows:
•
ldap.enabled=true
Cisco Internal Use Only
Copyright © 2006 Cisco Systems, Inc. All rights reserved.
Page 12 of 66
•
•
•
•
ldap.auth.scheme=ssl
ldap.account.name=admin
ldap.server.name=ware.trendium.com
ldap.server.port=636
Note:
The parameters such as ldap.account.name, ldap.server.name and ldap.server.port are relative to the test environment. The PVM
administrator needs to obtain these parameters from LDAP administrator.
For SSL communication with the LDAP server, you need to import the public key from the LDAP server. Assume that you have copied the
public certificate (including the BEGIN and END lines) to a text file /opt/CSCOpvm/cert.txt on the PVM server. Then you need to perform the
following steps to import the certificate into Cisco PVM.
1.
Ensure that the cacerts file is writable:
$cd /opt/CSCOpvm/j2sdk142/jre/lib/security
$chmod +w cacerts
2.
Import the public key into the keystore:
$/opt/CSCOpvm/j2sdk142/bin/keytool -import -file "/opt/CSCOpvm/cert.txt" -keystore cacerts
When asked for the keystore password type changeit. When asked if PVM should trust the certificate, type yes.
The output is as follows:
Enter keystore password: changeit
Owner: CN=ware, OU=Engineering, O=Trendium, L=Sunrise, ST=FL, C=US
Issuer: CN=ware, OU=Engineering, O=Trendium, L=Sunrise, ST=FL, C=US
Serial number: 81523838
Valid from: Tue Jan 17 13:04:26 EST 2006 until: Tue Apr 17 14:04:26 EDT 2007
Certificate fingerprints:
MD5: 91:58:60:10:C6:62:59:C2:41:C1:F9:E6:69:11:72:41
SHA1: C1:ED:01:F5:21:C9:C9:A1:AD:34:B0:99:70:D2:52:52:06:7B:7E:D5
Trust this certificate? [no]: yes
Certificate was added to keystore
Ensure that the information you enter is appropriate for your organization.
Mapping LDAP users to PVM roles
Cisco PVM uses two user groups: Admin and General. To map the various LDAP groups to PVM user groups, you can change the following
two properties in the config file:
ldap.admin.group.name=<ldap group name>, <another ldap group name>
ldap.general.group.name=<ldap group name>, <another ldap group name>
You can put multiple ldap groups separated by commas.
Adding a NAM through the GUI
Configuring NAMs and their associated devices in Cisco PVM is an easy process, and can be done in one of two ways. You can either add an
individual NAM and its associated device through the Cisco PVM GUI, or you can import multiple NAMs and their devices through the import
feature. This section describes the steps involved in configuring NAMs in Cisco PVM.
Cisco Internal Use Only
Copyright © 2006 Cisco Systems, Inc. All rights reserved.
Page 13 of 66
Cisco PVM allows the user to add an individual NAM and its associated device through the GUI. Click the Setup Tab and select the NAMs
menu item to see the list of NAMs.
Click Add to add a NAM and its device.
Note:
1.
You can add only the NAM and add the Switch/Router later. In this case, Cisco PVM collects information from the NAM and display
traffic statistics for the NAM datasources. No information is collected from the associated Switch/Router till you add the
Switch/Router.
2.
The two enabled checkboxes enables or disables collection from the NAM and its associated device in Cisco PVM and does not
enable/disable the device itself.
3.
The NAM User ID and password fields accept the login credentials for the NAM web interface. If any information is provided, it is
used during the single sign-on process. If no information is provided, Cisco PVM tries the single sign-on using the login credentials of
the user currently initiating the process, and if that fails, Cisco OVM opens the Login page for the NAM GUI.
4.
Ensure that the SNMP credentials are correct. The RO and RW community strings are both needed. The default SNMP timeout value is
Cisco Internal Use Only
Copyright © 2006 Cisco Systems, Inc. All rights reserved.
Page 14 of 66
set to be 50 ms. This might not be appropriate for your network topology. Ensure that this value is appropriate based on your
knowledge of the network.
5.
While Cisco PVM automatically determines the type of NAM being added, it relies on the user’s specification of the Switch/Router
device type. Ensure that you select the appropriate resource type. Select NM_ROUTER for ISR’s, NAM_ROUTER for the 7600 Series
router and NAM_SWITCH for the 6500 Series switch.
6.
Cisco PVM attempts to communicate with the NAM with the SNMP credentials supplied. If Cisco PVM was unable to communicate
with the NAM being added, it displays an error message: “Unable to configure device type: Unable to obtain the device type for
NAM”. If you see this error, ensure that you have supplied the appropriate SNMP credentials, IP address of the device and ensure that
the device is up and running.
Importing Multiple Devices
Cisco PVM provides the user with the ability to import many devices at once through its integration with the CiscoWorks Device Credential
Repository. Cisco PVM can read DCR export files and import the devices it finds in the Comma Separated Value (.csv) file. You can also
create your own. CSV file and use it to import devices. This section explains the import feature.
From the NAM list page, click Import to display the Import dialog box. Select the appropriate. CSV file and click Upload File. The message
“File was successfully uploaded” will be displayed.
Note:
1.
Files greater than 1M in size cannot be uploaded.
2.
You have to click Cancel to close the Import dialog after uploading the file.
3.
Cisco PVM runs an Import Manager process on the server that is responsible for processing the uploaded files. This process checks the
upload directory ($PVM_BASE/server/ftp/NamImport) every 1 minute and processes any files it finds there. Once processed, the file is
moved to a “processed” directory in the NamImport directory.
4.
Due to the process explained earlier you might not see the NAMs that you import immediately after a successful upload. Wait for a few
of minutes before trying to troubleshoot. Also, remember to refresh the NAM list to see the new devices.
Cisco Internal Use Only
Copyright © 2006 Cisco Systems, Inc. All rights reserved.
Page 15 of 66
5.
Any problems encountered during the import process are reported in the Alerts window.
6.
Remember to refresh the Alerts window periodically as well to see the latest list of alerts.
Import File Formats
Cisco PVM supports the DCR v3 Export file format and a user-defined format that is based on the tokens found in the DCR v3 export file. The
tokens
that
it
supports
are
management_ip_address,
host_name,
domain_name,
display_name,
snmp_v2_ro_comm_string,
snmp_v2_rw_comm_string, http_username, http_password, out of which the management_ip_address, snmp_v2_ro_comm_string and
snmp_v2_rw_comm_string tokens are mandatory for the import to succeed.
DCR Export File
The DCR export utility can be used to export the list of devices whose credentials are managed in CiscoWorks DCR. An example of the export
file is shown in the Figure
User created CSV file
You can create your own CSV file with devices you want to import. A sample file is shown in the Figure
Cisco Internal Use Only
Copyright © 2006 Cisco Systems, Inc. All rights reserved.
Page 16 of 66
Note:
1.
Remember to wait for at least one minute for the devices to be imported. Also, remember to refresh the NAM list page to view the latest
list of NAMs in Cisco PVM.
2.
When using a user-defined csv file to do the import, it is critical to include the header line. Without the header, Cisco PVM cannot
make sense of the values in the file.
3.
Through the GUI, Cisco PVM does not allow the user to add a Switch/Router without adding a NAM. Through the import facility, you
can add Switches that have a NAM associated while not adding the NAM through the same import file. So you can add switches and
routers separately from the NAMs which they host, but they should have a NAM configured.
Datasource Group (DSG) Creation
Once NAMs have been imported or added in Cisco PVM, the datasources for these NAMs are automatically discovered by Cisco PVM. For
Cisco PVM to aggregate and correlate the traffic statistics from these various datasources, you have to group these datasources into a logical
grouping called Datasource Groups (DSGs). All traffic analysis functionality is dependant on these groupings. This section explains the process
in more detail.
Click the Setup Tab and then on the DSG menu item. The NAM list is displayed.
Click Add to add a DSG.
Cisco Internal Use Only
Copyright © 2006 Cisco Systems, Inc. All rights reserved.
Page 17 of 66
NAM Type DSG: This type of DSG allows the user to group NAM datasources
Switch/Router Type DSG: This type of DSG allows the user to group Switch/Router datasources
Depending on the type of DSG you select, the devices and datasources for the appropriate type are shown. You can select the device, click the
right arrow to list the datasources for that device, and then select the datasources to add to the group. For more detailed instructions on this
process and what the individual fields mean, see the Cisco PVM User Guide.
Note:
1.
Cisco PVM collects interface statistics for all switch/router interfaces. It also collects mini-RMON information from switches/routers if
it is available.
2.
Cisco ISRs do not support mini-RMON, so only interface table statistics are collected from ISRs. While with Cisco PVM you can group
datasources from ISRs and Switch/Routers that support mini-RMON (7600 Series Routers and 6500 Series Switches), the information
available from these two groups are different. So if you group together datasources from ISRs and mini-RMON supporting devices, you
see Interface reports for all datasources, but Ethernet statistics reports are available for only those datasources that support mini-RMON.
3.
When grouping datasources, ensure that you select datasources that carry the traffic that you are interested in.
4.
When you add switches or routers in Cisco PVM, it creates some default datasource groups for you. When you add a router, Cisco PVM
creates a default ALL_INTERFACES group which contains all discovered interfaces on the router. When you add a switch, in addition
to the ALL_INTERFACES group, Cisco PVM creates an ALL_VLAN group with all discovered VLANs.
Cisco Internal Use Only
Copyright © 2006 Cisco Systems, Inc. All rights reserved.
Page 18 of 66
Usage Scenarios: Gather Statistics and Test Monitoring and Troubleshooting
After completing the deployment planning and configuration for the Cisco NAMs and Cisco PVM, you can gather statistics and test their
monitoring and troubleshooting capabilities. The statistics to gather depend on your goals. To optimize the monitoring capacity of Cisco PVM,
enable statistics collections only for the areas of interest rather than enabling all collections at once on the Cisco NAM. Also, ensure to use the
enable/disable feature on the configured NAMs in Cisco PVM to collect statistics only from those NAMs that you require.
The following scenarios will demonstrate these capabilities and highlight the primary areas of interest for network management.
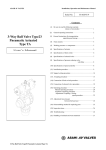
Scenario 1: Traffic Profiling
Most enterprise networks have many protocols running on their network. Network engineers need to monitor these protocols to see which
protocols are using the available bandwidth and fine tune them, also to monitor unwanted protocols from being used.
a
b
Step 1. Create a Datasource Group which contains the datasources on which you want to profile the application traffic.
a.
Click Setup Æ DSG.
b.
Click Add.
Cisco Internal Use Only
Copyright © 2006 Cisco Systems, Inc. All rights reserved.
Page 19 of 66
c
d
f
e
g
h
Step 1 (Contd)
c.
Type the Name
d.
Select the NAM Type in the Type dropdown
e.
Select the device.
f.
Click the right arrow to see the datasources from the device.
g.
Select the appropriate datasource and click the down arrow to add the datasource to the group.
h.
After you have added all the datasources, click OK to create the datasource group.
Cisco Internal Use Only
Copyright © 2006 Cisco Systems, Inc. All rights reserved.
Page 20 of 66
When you click the Monitor Tab, a
Network Overview report is
automatically launched for the first
DSG in the list. Use the drop downs to
select the appropriate DSG, View and
Report
a
b
c
d
The report shows the Cumulative Rates
for the Applications. If you would like to
view the TopN, you can select TopN
from the drop down list and click on
Refresh.
You can also click the arrows next to
the metric to sort the table.
Step 2. Go to the Monitor tab and select the Applications Report Suite.
a.
Click the Monitor Tab.
b.
Click
(right arrow) at the top left corner to toggle the menu, and the
(down arrow) at the top right corner to toggle the
parameters page.
c.
Select the DSG you just created, and the Aggregated view type.
d.
From the menu on the left, click the Applications menu item and select the Applications Report.
Cisco Internal Use Only
Copyright © 2006 Cisco Systems, Inc. All rights reserved.
Page 21 of 66
a
The list of hosts that were using this
application protocol is shown to aid in
monitoring.
b
d
c
Step 3. If you find a protocol that is using excessive bandwidth, you can find out who is using it.
a.
Click the Protocol of interest.
b.
PVM lists the hosts that were using the protocol and the amount of traffic they generated.
c.
You can analyze the host in detail by clicking the Host IP.
d.
You can also analyze the trends by clicking the ‘T’ hyperlink
Cisco Internal Use Only
Copyright © 2006 Cisco Systems, Inc. All rights reserved.
Page 22 of 66
a
b
c
d
e
f
Step 4. You can also schedule these reports to be run at a given time for later perusal.
a.
Click the Reports Tab. By default the Applications Report page is shown.
b.
Select the report period.
c.
Select the datasource group and specify the view type.
d.
Type a report name.
e.
Schedule the report to run at a given time.
f.
Click Run.
Cisco Internal Use Only
Copyright © 2006 Cisco Systems, Inc. All rights reserved.
Page 23 of 66
b
a
c
d
e
Step 4. (Contd.)
a.
Scheduled reports are visible from the View Schedules menu item.
b.
Click the Schedules tab to see scheduled reports.
c.
Reports that have already been run are available in the Completed tab.
d.
Click the report hyperlink to view it.
e.
You can also view reports of a particular type by selecting the appropriate report suite in the Archived Reports menu section.
Cisco Internal Use Only
Copyright © 2006 Cisco Systems, Inc. All rights reserved.
Page 24 of 66
Scenario 2: Proactive Monitoring
Network engineers receive calls to troubleshoot user issues. They would like to proactively monitor the network and troubleshoot issues before
users become aware of them. Assume that users are complaining of intermittent slow response times from a particular server. PVM can be used
to monitor response times from the server and alert the network engineer of the potential trouble, allowing the engineer to take the appropriate
action before the users notice any degradation in performance.
a
b
Step 1. Create an ART Group that carries traffic you are interested in.
a.
Click ART tab.
b.
Click Add.
Cisco Internal Use Only
Copyright © 2006 Cisco Systems, Inc. All rights reserved.
Page 25 of 66
c
d
e
f
g
i
Step 1. (Contd.)
c.
Type a Name for the ART Group.
d.
Type the appropriate Report Interval
e.
Select the NAM from the list.
f.
Select the appropriate datasource from the NAM
g.
Click Add
h.
Repeat steps to add all the datasources.
i.
Click OK.
Cisco Internal Use Only
Copyright © 2006 Cisco Systems, Inc. All rights reserved.
Page 26 of 66
a
b
c
Step 2. Create a Threshold for the Application Response Time of the server you are interested in.
a.
Click the Setup tab
b.
Click the Thresholds menu item.
c.
Click Add
Cisco Internal Use Only
Copyright © 2006 Cisco Systems, Inc. All rights reserved.
Page 27 of 66
f
d
e
i
j
Step 2. (Contd.)
d.
Type the Name for the Threshold.
e.
Select the severity of the Alert to be issued.
f.
Select ART from the Statistics list.
g.
Select the Average Response Time metric.
h.
Select the ART Group you just created.
i.
Type the IP Address of the server you want to monitor.
j.
Click OK to create the Threshold.
g
h
Cisco Internal Use Only
Copyright © 2006 Cisco Systems, Inc. All rights reserved.
Page 28 of 66
a
b
Step 3. PVM will now start base-lining the Average Response time for that server. If the thresholds are crossed, it issues an alert.
a.
To view alerts, click Alerts tab.
b.
To view a specific alert click the severity hyperlink of the appropriate alert.
Cisco Internal Use Only
Copyright © 2006 Cisco Systems, Inc. All rights reserved.
Page 29 of 66
c
Step 3. (Contd.)
c.
PVM displays the details of the threshold violation.
Cisco Internal Use Only
Copyright © 2006 Cisco Systems, Inc. All rights reserved.
Page 30 of 66
Scenario 3: Troubleshooting
You are base-lining your response times from the server. An alert is issued that a critical corporate server has a very high response time when
compared to the baseline. You want to find out if the apparent slow response time is due to the network or the application. Once you find that
the problem is indeed with the network, you want to know where the problem is and correlate the response time problem in context with other
traffic in your network.
a
b
Enter a client IP that would have accessed the server in the given time period. Then
search Art Groups and select the ART group for which the alert was issued.
Select the client
and server NAMs
Select the server
for which the alert
was issued.
c
d
Step 1. Run a Network Flight Time Report for the server and a client in the ART group for which the alert was issued.
a.
Click the ART tab.
b.
Click Reports -> Network Flight Time
c.
Type the parameters.
d.
Click Run
Cisco Internal Use Only
Copyright © 2006 Cisco Systems, Inc. All rights reserved.
Page 31 of 66
a
c
d
b
The Link Utilization is
very high and close to
maximum.
Step 2. Verify the link utilization on the client Branch Router.
a.
Click the Monitor tab
b.
Click Switch/Router -> Interface
c.
In the Parameters Pane, select the appropriate DSG and time period.
d.
Click Refresh
Cisco Internal Use Only
Copyright © 2006 Cisco Systems, Inc. All rights reserved.
Page 32 of 66
a
b
c
Step 3. Using the PVM Single Sign-On feature, logon to the Branch Router NM-NAM for further troubleshooting.
a.
Click the Setup tab
b.
Verify the appropriate NAM
c.
Click Connect
d.
PVM takes you to the NAM Overview page.
If an application is utilizing extra bandwidth on the branch router, you can use the Single Sign-On feature of PVM to logon to the NM-NAM on
the branch router and check for the applications that are using that particular link.
You find that a multi- GB FTP transfer was initiated by a host.
You report this to the network planning group and close the ticket.
Cisco Internal Use Only
Copyright © 2006 Cisco Systems, Inc. All rights reserved.
Page 33 of 66
a
b
c
d
Step 3. Using the PVM Single Sign-On feature, logon to the Branch Router NM-NAM for further troubleshooting.
a.
Click Monitor Æ Apps
b.
Select the appropriate datasource
c.
Top protocols are displayed.
Select the FTP and click details to view the hosts using that protocol.
Cisco Internal Use Only
Copyright © 2006 Cisco Systems, Inc. All rights reserved.
Page 34 of 66
Overview of PVM functionality
You now have an understanding of usage of Cisco PVM with some of the scenarios mentioned earlier This section will explain all the features
of Cisco PVM to provide a thorough overview of Cisco PVM capabilities.
Traffic Analysis using Cisco PVM
Cisco PVM provides two ways to perform traffic analysis. For active monitoring of network traffic, use the Monitoring feature. For historical
traffic analysis, use the Reporting feature. The following table provides information on when to use each feature and the differences between
the two.
Monitoring
The Cisco PVM monitor function provides near real-time and real-time access to resource data, and summary views of aggregated traffic data
with drill-down capability, formatted into tables and graphs for troubleshooting and analyzing current network performance. Cisco PVM
displays individual and aggregated NAM metrics, including displays for single NAM data sources, for multiple NAM data aggregated across
the network, and for all NAMs. Additionally, the Monitor tab displays a snapshot of current network activity immediately upon access.
Using the Monitor function, you can display near real-time and dynamic traffic data for applications, hosts, conversations, DCSP groups,
switches and routers, and VLAN data. You can view network resources based on these data sources and drill down to access details about a
particular resource. Reports can be viewed, printed, and saved as PDF, Microsoft Excel, and Rich Text Format files.
To access the Monitoring functionality, click the Monitoring tab. Cisco PVM automatically displays a Network Overview Report for the first
DSG in the list, and the following screen is seen.
Cisco Internal Use Only
Copyright © 2006 Cisco Systems, Inc. All rights reserved.
Page 35 of 66
Clicking the right arrow or the green Monitor bar on the left toggles the display of the Generate Reports menu. Similarly clicking the down
arrow or the green Monitor bar toggles the display of the parameters pane.
Cisco Internal Use Only
Copyright © 2006 Cisco Systems, Inc. All rights reserved.
Page 36 of 66
From the Parameters pane shown select the appropriate DSG, view and report type and the time frame for which to run the report. Then select
the appropriate report to run from the Generate Reports menu and Cisco PVM displays report.
Note:
1.
After login, Cisco PVM automatically displays the Monitoring Tab and runs the Network Overview Report for the first DSG it finds. If
the DSG has not been created, a popup asking you to create a DSG is displayed.
2.
Cisco PVM also optimizes the report for the available screen size. To display the entire report, Cisco PVM automatically minimizes
the Generate Reports menu and the Parameters pane. When you click the arrows on the panes, the display toggles and the panes
become visible.
3.
Every time you click a report, the Generate Reports menu and the Parameters pane are minimized. Also, every time you click the
Monitoring tab, the panes are minimized and a report is automatically launched.
4.
When you change the selections in the parameter pane, especially the DSG parameter, it can take a second or more to load the other
parameters specific to that DSG.
5.
When you select the Switch/Router report suite in the Generate Reports menu, sometime you may see a popup error message which
says no data available. The DSG dropdown lists all the Switch/Router type DSGs and since Cisco PVM automatically chooses the first
DSG in the list, sometimes the DSG may contain datasources which do not support the report chosen (For ex: the first DSG contains
ISR datasources and the report chosen is the Ethernet Traffic report. In this case, select the appropriate DSG from the list.
6.
A similar situation may be encountered with the VLAN report suite. Cisco PVM lists all Switch/Router DSGs and the first DSG for
which Cisco PVM auto launches the report might not have any VLANs. Here, again, select the appropriate DSG from the list.
Aggregation Schemes
Cisco PVM allows the user to view the data gathered for the datasources in a DSG in three different ways. These aggregation schemes are:
Cisco Internal Use Only
Copyright © 2006 Cisco Systems, Inc. All rights reserved.
Page 37 of 66
Datasource – This scheme allows the user to view traffic statistics per datasource.
Aggregated – This scheme allows the user to view aggregated traffic statistics for all datasources in the DSG.
All NAM – This scheme allows the user to view traffic statistics aggregated per NAM in the DSG.
These aggregation schemes are available for all report suites. For the Switch/Router report suite, the All NAM scheme is called All Device.
Note:
1.
If the user selects All NAM, the report that is shown could have multiple pages, one per NAM.
2.
Also, if the selected DSG has multiple NAMs and Cisco PVM has not been able to gather traffic statistics from some NAMs for any
reason, it will display a “No Data Found” message for those NAMs but will display the traffics statistics for those NAMs that it has
collected traffic statistics from. Use the report navigation links located at the top of the report to navigate the report.
Report Views
Cisco PVM provide three types of report views. These are:
Cumulative – This is a tabular representation of the absolute cumulative data over the chosen time period.
Current Rates – This is a tabular representation of the rate over the chosen time period. (Cumulative data divided by the number of seconds in
the time period)
Top N – This represents the Top N over the chosen time period for a given statistic.
Real-Time and Trend Charts
From the tabular reports (Cumulative and Current Rate reports), links provide the user a way to see real-time statistics and trend reports for a
given set of parameters.
The “R” hyperlink provides a window where the real-time statistic of choice can be viewed.
Cisco Internal Use Only
Copyright © 2006 Cisco Systems, Inc. All rights reserved.
Page 38 of 66
The “T” hyperlink provides a trend report which displays all the data points for the given time period and shows a trend line for the statistic of
choice.
Note:
1.
Real-time data is gathered from a chosen datasource once every 5 seconds.
2.
Data gathered by the real-time feature is not stored in the database.
3.
When you click the “R” hyperlink, a window is displayed with all the datasources in the DSG and the available statistics for the type of
report from which the “R” hyperlink was clicked. To view any real time data, you have to select the appropriate datasource to poll.
4.
Trend reports show all the data points available for a given time period. If there are a large number of data points available, the report
can get cluttered. Select a different (lesser) time period if this is the case.
Drill-downs
Cisco PVM provides drill-downs from reports. For example, wherever you see an IP address, click the IP address to drill-down into the Host
Detail report for that IP.
The following general rules apply for drill-downs:
1.
2.
3.
Wherever you see a host IP address, click the host IP to see the Host Detail Report for that host.
Wherever you see an application, click the application to see the Application Details Report for that application.
Wherever you see a NAM name in a report, you can click the NAM name to logon to the NAM
The following table lists the drill-downs reports available.
Cisco Internal Use Only
Copyright © 2006 Cisco Systems, Inc. All rights reserved.
Page 39 of 66
Report Name
Drill-Down Reports Available
Overview
•
Host Details
•
Application Details
•
DSCP Applications
Applications
Application Details
Hosts(IP)
Host Details
Conversations
Host Details
DSCP Applications
Application details
DSCP Host
Host Details
Note:
1.
To provide the single sign-on feature, Cisco PVM has to communicate with an applet. This requires the proper support from the client
side browser. If you are unable to login to the NAM using single sign-on and see an error when you click a NAM link, follow the
following procedure to set the appropriate environment in the browser.
Click "Tools" Æ "Internet Options"
Select the Advanced Tab, and scroll to "Java (Sun)"
Select the box next to the "Use Java 2" version
Next, select the Security Tab, and click "Custom Level"
Scroll to "Scripting of Java applets"
Ensure the "Enable" is selected.
Click OK to save your preference.
The following figure shows a sample drill-down into Host Detail Report from the Hosts Report.
Show Host details report here
Reporting
For historical reporting, Cisco PVM provides a Reporting feature that is different from the reports that are generated from the Monitoring tab.
All the report suites that are available in the Monitoring section are also available in the Reporting section. The Reports section provides a way
to schedule the Host and Applications Details Reports as well.
The following figure shows the general layout of the Reports section.
Cisco Internal Use Only
Copyright © 2006 Cisco Systems, Inc. All rights reserved.
Page 40 of 66
The menu pane on the left pane lists the reports suites. You can click any of the reports, and then select the appropriate parameters in the right
pane to either schedule the report or to run it right away. The parameters are mostly self-explanatory and are similar to the ones you select in
the Monitoring tab.
From the Scheduled Reports menu subsection, you can select the View Schedules menu item to view the schedules of reports to be run. Cisco
PVM lists the scheduled, running, pending and completed reports.
Clicking the document name displays the report.
From the Archived Reports section, you can view either the archives of the currently selected report suite, or the archived reports of any type by
choosing the appropriate menu item. The following figure shows the archives portal.
Cisco Internal Use Only
Copyright © 2006 Cisco Systems, Inc. All rights reserved.
Page 41 of 66
Clicking the version number displays the report.
Note:
1.
2.
Reports generated from the Reports Tab are automatically archived. These archives are versioned each run of a particular report.
If you schedule numerous reports to be run at high frequency, the archive can balloon into a huge list. Currently all archived reports
have to be deleted individually, so exercise caution when scheduling reports.
3.
The report archive is independent of the data from which the reports were generated. Even if data is purged from the database, the
reports generated from that data is available after the purging.
4.
Scheduled reports move from the Schedules bin to the Pending bin to the Running bin and then to the Completed bin in the archives
portal. Reports do not appear in the Pending and Running bin unless there are a number of reports scheduled to run at the same time.
5.
All drill-down rules that are applicable in the Monitoring section are applicable in the Reports section as well.
6.
All drill-down reports that are available in the Monitoring section are available in the Reports section as well.
Application Response Time Analysis in Cisco PVM
Cisco PVM collects information from Cisco NAMs, which have the ability to provide response time statistics based on the ART MIB. Cisco
PVM can collect this ART information from multiple NAMs and correlate them to provide you with the network flight time, which is the
amount of time traffic spent in the network.
Art Setup
To enable correlation of the response time data, Cisco PVM employs the concept of ART Groups which are conceptually similar to the DSGs
used in other areas of PVM, with the exception that Cisco PVM creates response time configurations for the datasources involved in an ART
group, whereas no changes are made on the NAM for DSGs.
To setup an ART group, click Add from the Setup page of the ART tab.
Cisco Internal Use Only
Copyright © 2006 Cisco Systems, Inc. All rights reserved.
Page 42 of 66
Note:
1.
You can include multiple datasources from multiple NAMs in an ART group. Select the NAM of interest from the list and then add the
datasources from those NAMs to the chosen list of datasources.
2.
The Report Interval parameter is an artifact of the ART MIB, which defines when the ART MIB consolidates the response time
statistics and starts a new collection cycle. The default value for this parameter is 1800 seconds (30 minutes). So even if the collection
cycle in Cisco PVM is set to be 5 minutes, if the report interval is set at 30 minutes, you can see reports only after 30 minutes. If you
want to see ART information sooner, ensure this parameter is changed.
3.
Cisco PVM creates the configurations necessary on the NAMs to monitor response times. However, these configurations do not show
up in the NAM GUI. Since PVM can be deployed in multiple locations, it uses the host name of the server on which it is located when
creating these configurations. Cisco NAM GUI only displays configurations created through the GUI. If you want to see the
configurations created by Cisco PVM, telnet into the NAM and use the ‘show monitor art’ command.
Art Reports
Once Cisco PVM has created the configurations on the NAM and is actively collecting ART statistics from the NAM, you can see reports for
those statistics.
To view the available reports, click the Reports menu item in the left pane.
Cisco PVM provides four types of ART reports:
Cisco Internal Use Only
Copyright © 2006 Cisco Systems, Inc. All rights reserved.
Page 43 of 66
Server Response Time (SRT) – Gives you the server side latency statistics from the Server side NAMs.
Client/Server Response Time (CSRT) – Gives you the total roundtrip response time from the client side NAMs.
Client/Server Investigation (CSI) – Similar to CSRT, but for a specific client
Network Flight Time (NFT) – Gives you the network latency between the Client and Server NAMs
To display a given report, select the report from the left hand pane, provide the necessary information in the parameters pane and click Run. A
sample NFT Report is as shown
Cisco Internal Use Only
Copyright © 2006 Cisco Systems, Inc. All rights reserved.
Page 44 of 66
Note:
1.
Pre-filtering: Cisco PVM depends on traffic statistics gathered by the NAM to perform its reporting. Cisco PVM performs some prefiltering of the data is has collected for the various ART Groups. If no data is available for a given time period, you will not be able to
see any ART groups and hence see a report. In this case you will see a message that says that no ART Groups were found for the given
period. If you see this message, try changing the parameters.
2.
NFT depends on Cisco PVM being able to correlate information from the client and server NAMs. Since there can be multiple client
and server NAMs, to see a NFT report, you have to specify the client and server NAMs from the NAMs that belong to the ART group.
3.
Cisco PVM synchronizes collection cycles among the datasources that belong to an ART group. This does not guarantee that data is
collected from the NAMs that you select to run a NFT report on. If similar data points are not available from the NAMs you select, you
might see a warning message that asynchronous data points were seen. Cisco PVM ,displays all the available data points. If both the
client-side and server-side data points are available, Cisco PVM calculates the NFT and displays it.
ART Report Archives
Similar to the archive functionality available in the Reports tab, ART Reports are archived. You can view the archives for the currently selected
report by clicking the Current Report Archives menu item in the Archived reports subsection. You can also look at the archives for any type of
report by clicking the appropriate link in this section.
Archived reports are versioned and are available even after the dependant data is purged from the Cisco PVM database.
Cisco Internal Use Only
Copyright © 2006 Cisco Systems, Inc. All rights reserved.
Page 45 of 66
From the Scheduled Reports menu subsection, you can select the View Schedules menu item to view the schedules of reports to be run. Cisco
PVM lists the scheduled, running, pending and completed reports.
Baselining and Alerts in Cisco PVM
Cisco PVM provides you with the ability to proactively monitor the network using thresholds. You can identify problems and trouble spots
before they impact users. Threshold violations result in alerts, which can be viewed in the Alert Viewer. Cisco PVM provides you with the
ability to set two kinds of thresholds.
Fixed Thresholds – These thresholds accept absolute values for severity levels and the statistic of choice, the crossing of which results in
alerts.
Dynamic Thresholds – These thresholds accept percentages. When a dynamic threshold is set, Cisco PVM starts baselining the selected
statistic by creating a moving average and calculating the standard deviation for incoming data points. The standard deviation and moving
average combine to account for traffic patterns and also for expected spikes in traffic. Cisco PVM uses these values to calculate a rising and
falling threshold level (Baseline + Standard deviation = Rising Threshold, Baseline - Standard deviation = Falling Threshold) and issues alerts
when the incoming values are the specified percentage over the threshold levels.
To create a threshold, click Add in the Thresholds menu item of the Setup tab. The following screen is displayed.
Cisco Internal Use Only
Copyright © 2006 Cisco Systems, Inc. All rights reserved.
Page 46 of 66
Select the type of statistics and the particular metric that are required. You also need to specify which DSG you want to monitor (In the case of
ART statistics, you will need to specify an ART group). Depending on the type of statistic required more fields will appear and you can further
tailor the threshold.
For example, when you select Host Statistics, an IP Address field and an Application field appear.
You can select the minimum severity level required and Cisco PVM allows you to define the values for that and all other higher severity levels.
Specify a name and description for the threshold.
Note:
1.
The area to define the absolute values for a fixed threshold and percentages for a dynamic threshold is minimized by default. If you
select fixed Threshold, this area automatically expands and you can fill in the values.
2.
If you are creating a dynamic threshold, Cisco PVM assumes the default percentages that are defined in the Preferences section of
Setup for the various severity levels. (You can edit these values by clicking Edit in the Preferences page. The default values are 100,
80, 60 and 40 percent for Critical, Major, Minor and Warning level alerts.)
3.
If you want change these values only for the threshold you are creating, you can select and edit the values from the list. If you want to
change the default values, change them using the Edit functionality in the Preferences page.
When you set a dynamic threshold, Cisco PVM baselines the statistic. The process of baselining involves three different time intervals.
Aggregation Period (Default is 5 mins) – The frequency at which data is aggregated and alerts are issued over the aggregated data.
Observation Period (Default is 60 mins) – The frequency at which the baseline value is recalculated based on the aggregated data.
Cisco Internal Use Only
Copyright © 2006 Cisco Systems, Inc. All rights reserved.
Page 47 of 66
Baseline Period (Default is 1 day) – The amount of time over which the moving average baseline is calculated.
Note:
1.
Collected data is aggregated with the frequency specified by the Aggregation Period. Alerts are issued if the aggregated value
exceeds the previous cycles calculated value of Baseline + Standard Deviation and Baseline – Standard Deviation.
2.
While the Baseline Period and Observation Period are system-wide values and can be edited through the Setup/Preferences page,
the Aggregation Period can be specified over individual thresholds.
3.
The aggregation period does not apply for Application Response Time statistics. This is because ART statistics are calculated over
the Duration period specified in the ART configuration, and are aggregated over that duration by default.
4.
Once baselines have been calculated, Cisco PVM displays the current baseline value in the Threshold list and in the Threshold detail
page.
5.
If you change the Aggregation Period for a baseline, the system automatically recalculates the baseline based on that aggregation
period.
Generating SNMP Traps
Cisco PVM generates SNMP traps for the issued alerts. You can specify that a SNMP trap be generated for a particular threshold by selecting
the SNMP Trap check box in the Add/Edit Threshold page. When the SNMP Trap is enabled, a Trap Community String field is displayed
where you can specify the destination community string.
SNMP Trap destinations can be specified by editing the $PVM_BASE/server/etc/agent_config/sp_thresholdMonitor.config file. These
destinations are grouped by community strings and each community string can encompass multiple destination IP Addresses and you can define
multiple community strings in the file. You can define a trap destination in this file as follows:
[snmptarget]
Cisco Internal Use Only
Copyright © 2006 Cisco Systems, Inc. All rights reserved.
Page 48 of 66
trapCommunity = public
trapDestination = 172.16.11.161
trapPort = 162
You can define multiple [snmptarget] blocks, one for each destination.
Alerts in Cisco PVM
Cisco PVM generates alerts in various circumstances and these alerts can be viewed in the Alert Viewer. The Alert Viewer can be accessed by
clicking on the Alerts Tab. By default, any alerts over last hour are displayed. You can change the time period and view alerts over that time
period.
Alerts in Cisco PVM are color coded. For example, if there is a Critical severity alert, Cisco PVM displays a red icon next to the alert. Major,
Minor and Warning severity alerts are coded with Orange, Yellow and Cyan icons. For a complete list of severity levels and color codes, see
the Cisco PVM User Guide.
Cisco PVM displays alerts of three types:
NAM Alarms – These are alarms that are gathered by Cisco PVM from the NAMs it is monitoring.
Threshold Violations – These alarms are generated by Cisco PVM based on threshold violations within Cisco PVM.
System Events – These are alerts displayed from the system health monitoring processes in Cisco PVM, and include server error condition
notifications in Cisco PVM.
Cisco Internal Use Only
Copyright © 2006 Cisco Systems, Inc. All rights reserved.
Page 49 of 66
Note:
1.
NAM Alarms are obtained by Cisco PVM from the RMON MIB in the NAM. Since the MIB information does not specify a severity
level, Cisco PVM always designates a NAM alarm as Minor severity level.
2.
NAM Alarms can also be raised due to threshold violations in the NAM. If the NAM alarm was raised as a result of a threshold
violation in the NAM, the Description field in the alert detail denotes the name of the threshold in the NAM that was violated. If the
threshold was created in Cisco PVM, the description gives you the name of the threshold in PVM.
3.
System Events can include status messages and error condition notifications from server-side components in Cisco PVM. For example,
when importing devices from a CSV file, you notice status and error messages from the Import Manager. You may see SNMP timeout
messages if Cisco PVM is unable to communicate with a device. You also see system health alerts for database and CPU utilizations.
4.
System health monitoring is performed through a java process. The thresholds and severity levels used in monitoring the system
performance are fixed and cannot be changed.
You can look at the Alerts detail screen by clicking the severity link on the Alerts list page. The Alert detail screen provides available
information on the particular alert.
Cisco Internal Use Only
Copyright © 2006 Cisco Systems, Inc. All rights reserved.
Page 50 of 66
Cisco PVM Requirements and Sizing
Cisco PVM is a network monitoring software that runs on Linux.
The minimum recommended hardware and software configurations are as follows:
Minimum Server Requirements
Hardware:
•
2 Intel Xeon CPU – 3.4 GHz
•
2 GB RAM
•
4 GB HD space available for the application and third–party software
•
70 GB HD space available in the host installation directory (This depends on the number of NAMs you want to monitor. The
sizing table provides guidance on the hard disk space required)
•
100 MB Ethernet card
Software:
•
Red Hat Linux Advanced Server Version 3 with Kernel 2.4 (Update 2 or later)
•
IE 6.0 (JavaScript and cookies enabled)
•
Adobe Reader 6.01 – 6.04
Minimum Client Requirements
Hardware:
•
Pentium 4 Processor
•
256 MB RAM
Software:
•
•
•
Windows XP or 2000
IE 6.0 (Java support, JavaScript and cookies enabled)
Adobe Reader 6.01 – 6.04
Note:
1.
Linux Version 3 is available at: http://www.redhat.com/rhel/details/enterpriselinux3/
2.
When installing Linux, ensure that you do not install a firewall on the server. If you elect to install the firewall, ensure that HTTP,
HTTPS and SNMP traffic can get through.
3.
Internet Explorer 6.0 SP2 is recommended. Users running Windows 2000 and IE 6.0 SP1 must ensure that all Microsoft updates for
both Windows and IE have been installed.
4.
To ensure that the correct browser functionality is enabled on the client, navigate to Tools > Internet Options > Advanced in the
browser menu and click Restore Defaults Æ Apply Æ OK.
Cisco PVM Sizing
Cisco Internal Use Only
Copyright © 2006 Cisco Systems, Inc. All rights reserved.
Page 51 of 66
Cisco PVM supports a maximum of 200 NAM–2s, or the equivalent of 100 NAM–2s plus 300 NM–NAMs. The hardware requirements for
Cisco PVM installations differ depending on the number of NAMs the system is intended to support.
The requirements are broken down into three configurations:
•
Small – used in configurations of up to 5 NAM–2s
•
Medium – used in configurations of up to 50 NM–NAMs + 50 NAM–2s
•
Large – used in configurations of up to 200 NAM–2s or 300 NM–NAMs + 100 NAM–2s
Maximum NAMs
CPUs
RAM
Disk Space Required
5 NAM–2s
2 Intel Xeon – 3.4 GHz
2 GB
70 GB
50 4 Intel Xeon – 3.4 GHz
4 GB
850 GB in high–performance
50 NAM–2s +
NM–NAMs
100 NAM–2s +
array configuration
300 4 Intel Xeon Dual–Core – 3.0 GHz 8 GB
NM–NAMs
4,600 GB in high–performance
array configuration
For configurations that fall in between, it is preferable to use the sizing figures in the next highest range. For example, if you have 20 NAM-2’s
that you want to monitor, it is preferable to select the Medium configuration figures. Determine the exact numbers depending on your
knowledge of your network.
Cisco PVM Installation and Uninstallation
This section explains the steps necessary to install Cisco PVM. Cisco PVM requires that a certain amount of disk space be available in specific
directories for the installation to proceed.
The following directories or partitions are required:
•
•
•
Oracle data partition – default: /u01
Install directory – default: /opt/CSCOpvm
Oracle install directory – default: /opt/oracle
Note:
1.
Cisco PVM’s install procedure asks the user to specify the Install directory and the Oracle data partition during the installation process.
The Oracle install directory is fixed and cannot be changed.
The individual partition’s disk space requirements are as follows:
PVM and Oracle install directory (/opt) > 3.5 GB of free disk space
Oracle data partition (/u01) > 70 GB of free disk space (Depends on the number of NAMs you want to support in PVM)
The installation will not proceed if the disk space requirements are not met. If installing on a network directory, it is necessary to ensure that the
correct permissions are set for the user on the network directory.
Cisco Internal Use Only
Copyright © 2006 Cisco Systems, Inc. All rights reserved.
Page 52 of 66
Note:
1.
If the environment you are installing in is configured for NIS, ensure that ‘oracle’ and ‘pvmadm’ users are not created. Cisco PVM will
create these users.
Install Procedure:
This section describes the steps necessary to install PVM.
1.
Insert DVD into DVD drive.
2.
Open a command shell and go to the DVD drive root (login as root).
Ex: cd /dev/cdrom
3.
Start the installation:
$./installpvm
Follow the prompts and change the install directories if necessary.
4.
Install the License File:
$su – pvmadm
$cp sp_license.dat <PVM_INSTALL_DIR>/server/etc
5.
Install a SSL Certificate
6.
Start PVM
$su – pvmadm
$pvm start
7.
Login to PVM GUI at https://<host name>:8443/
Note:
1.
The license file needs to be obtained from the Cisco support web site. Contact your Cisco representative for details on how to obtain the
license.
2.
Cisco PVM supports secure access only to the GUI. You have to install either a self-generated SSL certificate or a SSL certificate
issued by a Certifying Authority to access the Cisco PVM GUI. If you are installing a certificate issued by a certifying Authority,
follow the procedure specified by the issuer and install the certificate at $JBOSS_HOME/server/default/conf/ssl.keystore. If you are
generating your own certificate, you can use the java keytool as follows:
cd <PVM_INSTALL_DIR>/j2sdk142/bin
keytool –genkey –keyalg RSA –storepass changeit –keystore $JBOSS_HOME/server/default/conf/ssl.keystore
Follow the prompts and finally when it asks for the keystore password, answer it as ‘changeit’.
3.
If you want to use a password other than ‘changeit’ for the keystore, make the following configuration changes to JBOSS configuration
file located at $PVM_BASE/jboss/server/default/deploy/jbossweb-tomcat41.sar/META-INF/jboss-service.xml
keystorePass parameter in the SSL Connector entry for port 8443 to the password you entered for the keystore.
Cisco Internal Use Only
Copyright © 2006 Cisco Systems, Inc. All rights reserved.
Page 53 of 66
Change the
Remember to generate and install the SSL certificate as ‘pvmadm’ user
Troubleshooting Tips:
1.
Verify the log files for any signs of trouble. Cisco PVM places the installation log files in the $PVM_BASE/installlogs directory. The
main Cisco PVM install log file is named ‘sp_installMM.DD.YY.hh.mm.ss.log’. From there you can glean enough information to look
at the other log files and find the issue. If unable to do so, contact Cisco TAC.
2.
If you are re-installing, ensure that the prior installation is completely uninstalled.
Uninstall Procedure:
This section describes the steps necessary to uninstall PVM. While uninstalling Cisco PVM, remove all the application’s components and data
files from the server. The uninstall process stops the Cisco PVM application and removes its components. It also removes Oracle and the
corresponding data files.
Removing Cisco PVM involves executing the uninstall routine as described
1.
Login as root user.
Ex: su - root
2.
Go to the directory where the script is located.
$ cd $PVM_BASE/server/bin
3.
Execute the script
$ ./uninstall_pvm.sh
The progress of uninstall is shown in the shell environment where the uninstall script was executed. If uninstall is completed successfully, all
Cisco PVM related artifacts have been removed from the system.
Note:
1.
Uninstallation of Cisco PVM removes any data and all configurations that might have been collected by Cisco PVM. If you intend to
reuse the configuration, follow the archiving procedure outlined in the section on Database maintenance.
Tip:
If you ever need to uninstall Cisco PVM manually, you can follow the following procedure:
1.
Stop Cisco PVM
$su – pvmadm
$pvm stop
2.
Shutdown any rogue PVM processes
$ps –ef | grep pvmadm
If you see any processes listed other than bash or ssh use kill -9 <pid> to terminate them.
3.
Shutdown Oracle
Cisco Internal Use Only
Copyright © 2006 Cisco Systems, Inc. All rights reserved.
Page 54 of 66
$su - oracle
$export ORACLE_SID=cnam
$sqlplus /nolog
sqlplus>connect /as sysdba
sqlplus>shutdown immediate
sqlplus>quit
$export ORACLE_SID=spdw
$sqlplus /nolog
sqlplus>connect /as sysdba
sqlplus>shutdown immediate
sqlplus>quit
$lsnrctl stop
4.
Shutdown any rogue Oracle processes
$ps –ef | grep ora
If you see any oracle process, kill them manually.
At this point, you should check any semaphores or queues that might be left open by the terminated oracle processes.
$ ipcs
If you see any semaphores or queues that belong to oracle, kill them using:
$ipcrm
The options for this command are:
-M <shmkey> removes the shared memory segment created with shmkey after the last detach is performed.
-m <shmid> removes the shared memory segment identified by shmid after the last detach is performed.
-Q <msgkey> removes the message queue created with msgkey.
-q <msgid> removes the message queue identified by msgid.
-S <semkey> removes the semaphore created with semkey.
-s <semid> removes the semaphore identified by semid.
5.
Remove Cisco PVM directories.
$rm –rf /tmp/*
$rm – rf /var/tmp/.oracle
$rm –rf /var/tmp/.flexlm
$rm – rf /var/tmp/root
$rm –rf /var/adm/PVM/*
$rm –rf /opt/CSCOpvm/*
$rm –rf /opt/oracle/*
$rm –rf /u01/*
6.
Follow your security guidelines to remove the ‘pvmadm’ and ‘oracle’ users from the system.
Start and Stop Procedure:
Starting and stopping Cisco PVM is a simple procedure.
To start Cisco PVM:
$su – pvmadm
$pvm start
To stop Cisco PVM:
$su – pvmadm
$pvm stop
Note:
1.
Cisco PVM is automatically started at server restart. Both Cisco PVM server processes and Oracle processes are started at server
Cisco Internal Use Only
Copyright © 2006 Cisco Systems, Inc. All rights reserved.
Page 55 of 66
restart. If Cisco PVM is manually stopped, it will have to be restarted manually as well.
2.
When Cisco PVM is started manually, ensure that you are starting it as ‘pvmadm’ user. Also, Cisco PVM starts both the Oracle
processes and the Cisco PVM server processes when the pvm start command is issued. To do this it uses the ‘sudo’ process available in
Linux to start Oracle as the ‘oracle’ user. If your network security process prevents access to the ‘pvmadm’ user to perform this
operation, Cisco PVM will start the server processes and you will be unable to login to PVM or see any data. If this is the case, you will
have to manually start the Oracle processes.
Login as root and perform the following procedure:
$su - oracle
$export ORACLE_SID=cnam
$sqlplus /nolog
sqlplus>connect /as sysdba
sqlplus>startup
sqlplus>quit
$export ORACLE_SID=spdw
$sqlplus /nolog
sqlplus>connect /as sysdba
sqlplus>startup
sqlplus>quit
$lsnrctl start
3.
A similar situation is encountered while stopping Cisco PVM if ‘sudo’ access is not granted to the ‘pvmadm’ user. In this case you
have to manually stop the Oracle processes.
Login as root and perform the following procedure:
$su - oracle
$export ORACLE_SID=cnam
$sqlplus /nolog
sqlplus>connect /as sysdba
sqlplus>shutdown immediate
sqlplus>quit
$export ORACLE_SID=spdw
$sqlplus /nolog
sqlplus>connect /as sysdba
sqlplus>shutdown immediate
sqlplus>quit
$lsnrctl stop
Troubleshooting Tips:
1.
The status of the start and stop commands is shown in the shell environment from which you issue those commands. If you find any
error messages during startup or shutdown, re-issue those commands. If the problem is encountered again, you can try starting it
manually.
Maintaining and Troubleshooting Cisco PVM
Cisco Internal Use Only
Copyright © 2006 Cisco Systems, Inc. All rights reserved.
Page 56 of 66
Cisco PVM is a database intensive software application. Similar to any database-driven application, Cisco PVM has some maintenance
activities that the user can perform to ensure good performance and trouble free use. The most important aspect of the maintenance activities is
database management.
Database Management
Cisco PVM uses 2 database instances to store the data it collects. Raw traffic statistics that are collected by the system are stored in the OLTP
database. This database is a relational database and also contains the configuration information like devices, DSGs and users for Cisco PVM.
The other database instance is an OLAP database where Cisco PVM stores aggregated information. This database is non-relational and is
optimized for data mining and retrieval. The instance ids and the default roles are as follows:
–
OLTP:
SID: CNAM
User: cnam / manc1521
–
Role: USER
OLAP:
SID: SPDW
User: tadw / tadw
–
Role: USER
OLTP & OLAP:
tadwop / tadwop
dw/password
Role: Operator
Role: DBA
Note:
1.
It is recommended that the user change these database passwords after installation.
Purging and retention period
Raw traffic statistics are aggregated and converted into OLAP artifacts by Cisco PVM. Raw traffic statistics are retained in the OLTP datastore
for 2 days after which they are purged from the database. The aggregated data in OLAP is retained based on retention policies defined in the
database. These retention periods default to 3 months for hourly data, 1 year for daily data and 3 years for monthly data. You can change these
retention periods by using standard SQL to modify the records in the database. To change the OLTP retention period, change the value of the
RETENTION_PERIOD column in the TA_RETENTION table of the CNAM database. To change the OLAP retention period, change the
values of the RETENTIONPERIOD column in the RETENTION table of the SPDW database. Login as dw to make the changes.
The purge process in Cisco PVM is enabled by default and cannot be disabled.
Archiving
Cisco PVM allows the user to archive, the data that has been collected and aggregated and the configuration information from Cisco PVM for
storage. The archive process has many options that the user can specify to either schedule the archive or run immediately. Using the appropriate
switches, the user can archive both raw traffic statistics, historical data, and backup configuration information for later use on another
installation of Cisco PVM.
The archive process is disabled by default. When enabled, the archive process archives only that information not previously archived. Archives
can be re-imported into Cisco PVM. This re-imported data is not archived again.
The archive process can be enabled or disabled by using the following command:
$su – pvmadm
Cisco Internal Use Only
Copyright © 2006 Cisco Systems, Inc. All rights reserved.
Page 57 of 66
$archive –p <tadwop password> -f <archive file location> [-I] [-[{T|H}]C] {start|stop}
The I flag runs the archive process immediately instead of scheduling it. If the I flag is not specified, the archive process will be scheduled as a
cron job which runs daily at 3:00 AM.
The H flag indicates to Cisco PVM to include historical information in the archive.
The T flag indicates to Cisco PVM to include transactional (raw statistics) information in the archive.
The C flag indicates to Cisco PVM to include configuration information in the archive.
Note:
1.
To archive the NAM and DSG configurations, use the flag TC, and to archive the OLAP configuration information use the flag HC.
Specifying just the C flag is equivalent to specifying both.
2.
The archive is done using the standard Oracle export utility. The exported data is compressed for data storage.
Importing the archived files
Data that has been archived can be re-imported. To import the archive, you have to first unzip it using the command:
gunzip -c archive_filename|cpio -icvB “*[switch]*”
where the switch is the type of archive.
Once unzipped, the archive can be imported using the command:
imp tadwop@{cnam | spdw} file=/directory/filename ignore=y full=y
where:
– cnam is used for transaction archives
– spdw is used for historical archives
– the directory is the location used for the original backup
– the file name is from the unzipped list of files containing.dmp extensions
Example:
If you want to re-host PVM from Host A to Host B, the following procedure would enable you to export and import the configuration
information:
On Host A:
$ su – pvmadm
$ cd /<PVM_INSTALL_DIR>/server/bin
$ archive –p <Operator password> -f < filename> -TCI start
On Host B:
$ su – pvmadm
$ imp file=<filename> userid=tadwop/tadwop@CNAM ignore=y full=y
For more information about database related information, see the Cisco PVM User Guide.
Cisco Internal Use Only
Copyright © 2006 Cisco Systems, Inc. All rights reserved.
Page 58 of 66
CONCLUSION
This guide attempts to make the deployment of Cisco PVM on your network easier to plan and execute. The tasks that you need to perform to
successfully deploy and use Cisco PVM are explained in detail. If you want in-depth understanding of Cisco PVM, see the User Guide and
other documentation for Cisco PVM. This guide also attempts to look at some of the scenarios in daily network management and how Cisco
PVM can help you accomplish your objective. While the scenarios listed are not comprehensive, they aid you in familiarizing yourself with the
capabilities of Cisco PVM.
Cisco Internal Use Only
Copyright © 2006 Cisco Systems, Inc. All rights reserved.
Page 59 of 66
APPENDIX
Deployment Q&A
Q. What login permissions are required to install Cisco PVM?
A. Cisco PVM installation requires root-level access to the Linux server that has been configured to run Cisco PVM.
Q. Why does Cisco PVM not overwrite an existing Cisco PVM installation?
A. When Cisco PVM detects an existing installation, the install routine notifies the user and stops the installation. The application must be
uninstalled before re-installation is permitted. For more information, see the Cisco Performance Visibility Manager Installation Guide.
Q. What are the default installation directory locations?
A. Pathnames for Cisco PVM components are as follows:
• Cisco PVM Installation directory – /opt/CSCOpvm. If required, select a different pathname when prompted.
• Data storage directory – The default directory for the data storage directory is /u01/. If required, select a different root when prompted.
Q. Can I change the default installation directory locations?
A. Yes, but you must ensure that enough disk space is available in the installation directory (minimum 70 GB).
Q. Is there a log file generated during installation? If so, where is it located?
A. Yes, the Cisco PVM installer provides status and progress messages during the installation. These messages are provided to the console and
are also logged. Additionally, errors related to the application installation and database installation are raised to the console and logged.
These logs are written to the following locations:
• Database install log: [installation directory]/installlogs/sp_dbinstmm.dd.yy.hh.mm.ss.log
• Application install log: [installation directory]/installlogs/spinstallmm.dd.yy.hh.mm.ss.log
• Reports install log: [installation directory]/installlogs/sp_install_reports.log
Q. What are the minimum hardware and software requirements to deploy and operate Cisco PVM?
A. See the Installation Requirements chapter of the Cisco Performance Visibility Manager Installation Guide.
Q. What are the minimum installation directory space and data directory storage requirements to deploy and operate Cisco PVM?
Cisco Internal Use Only
Copyright © 2006 Cisco Systems, Inc. All rights reserved.
Page 60 of 66
A. The installation software requires a minimum of 4.0 GB of disk space to install Cisco PVM and third-party software. Cisco PVM requires
that a minimum of 70 GB of disk space be available in the data storage directory. For more information about storage requirements based on the
number of NAMs you intend to support, see the Cisco Performance Visibility Manager Installation Guide.
Q. What are the ports and protocols used by Cisco PVM?
A. See Table 1-1.
Q. How do I obtain a license file for Cisco PVM?
A. Cisco Systems support provides the Cisco PVM license file. The customer installs the license file on the host machine where Cisco PVM is
installed. See the Cisco Performance Visibility Manager Installation Guide for details.
Q. Before contacting Cisco to obtain a license file, what information do I need?
A. Cisco PVM users must request a license file from Cisco.
The following information is required during registration:
• Host name – obtained by executing the command host name on the host computer which Cisco PVM is installed.
• Host ID – obtained by executing the command lmhostid on the host computer which Cisco PVM is installed.
• Product – specific product for your host computer.
For additional details, see Installing the Cisco PVM License in the Cisco Performance Visibility Manager Installation Guide.
Q. What is the difference between Evaluation and Production modes of operation?
A. Without a valid license file installed, Cisco PVM operates in Evaluation mode and stops operating once the 90-day evaluation period
expires. In Production mode, the license has no expiration.
Cisco Internal Use Only
Copyright © 2006 Cisco Systems, Inc. All rights reserved.
Page 61 of 66
Q. Does Cisco PVM provide tracing capability?
A. The Cisco PVM collection framework provides tracing capabilities from the Cisco PVM server. The trace level can be configured which
dictates the detail of the trace information. The trace information is logged into separate files for each collector. Some of the security and
system logs that appear in the Cisco PVM GUI are also useful to troubleshoot certain problems. Filtering can be applied to Security Logs in the
Admin GUI to view specific logs.
Cisco Internal Use Only
Copyright © 2006 Cisco Systems, Inc. All rights reserved.
Page 62 of 66
Deployment Troubleshooting
Symptom - During the Cisco PVM installation, I receive the error message “Not enough free disk space”.
Possible Cause - The Cisco PVM installation directory has insufficient disk space.
Recommended Action - Check the Cisco Performance Visibility Manager Installation Guide for disk space requirements, free up the
required space in the installation directory, and repeat the installation process.
Symptom - During the Cisco PVM installation, I receive the error message “Incorrect OS version”.
Possible Cause - You attempted to install Cisco PVM on an unsupported OS or OS version.
Recommended Action - Install Cisco PVM on a server that is running Red Hat Linux Advanced Server Version 3 with Kernel 2.4 (Update
2 or later). Linux Version 3 is available at: http://www.redhat.com/rhel/details/enterpriselinux3/.
Symptom - During the Cisco PVM installation, I receive the error message “Invalid Installation Directory”.
Possible Cause - An invalid Cisco PVM installation directory (such as a directory on the DVD or on the network with no write
permission) was specified.
Recommended Action - Use the default /opt/CSCOpvm/ directory or type the correct directory path at the installation directory prompt.
Symptom - During the Cisco PVM installation, I receive the error message “Invalid Data Storage Directory”.
Possible Cause - An invalid Cisco PVM data storage directory was specified.
Recommended Action - Use the default /u01/ directory or type the correct directory path at the data storage directory prompt.
Symptom - During the Cisco PVM installation, I receive the error message “WARNING!!! - Some of Cisco PVM processes are still running
…”
Possible Cause - This symptom indicates that Cisco PVM is still running (from a previous installation).
Recommended Action - Stop Cisco PVM and processes, uninstall the previous version, and repeat the installation. For more information,
see Uninstalling Cisco PVM in the Cisco Performance Visibility Manager Installation Guide.
Symptom - I cannot write to the /tmp directory to install Cisco PVM.
Possible Cause - You do not have the correct permissions to write to the /tmp directory.
Recommended Action - Logged in as root, change the permissions on the /tmp directory (chmod 777 /tmp).
Cisco Internal Use Only
Copyright © 2006 Cisco Systems, Inc. All rights reserved.
Page 63 of 66
Symptom - After successfully installing the Cisco PVM product, when I invoke the web page to access the PVM GUI, I get the error message
“The page cannot be displayed” from the web browser.
Possible Cause - You did not generate the SSL key file. This file is necessary to run the Cisco PVM GUI.
Recommended Action - Generate the SSL key file. See the Cisco Performance Visibility Manager Installation Guide for more
information on how to generate the SSL key file.
Symptom - I am getting erratic and unexpected responses from my web browser.
Possible Cause - You are using Cisco PVM on an unsupported web browser. Another possible cause could be that the appropriate JRE
version is not installed on the machine running the browser.
Recommended Action - Use Internet Explorer 6.0 (6.0 SP2 is recommended). Ensure that IE is configured Enabling Java and JavaScript,
has all the latest updates from Microsoft, and accepts all cookies. Also ensure that JRE version 1.4.2 is installed on the machine running
the browser.
Cisco Internal Use Only
Copyright © 2006 Cisco Systems, Inc. All rights reserved.
Page 64 of 66
For More Information
Release Notes for Cisco Performance Visibility Manager, 1.0 (OL-8615-01)
http://www.cisco.com/en/US/products/ps6768/prod_release_note09186a0080640a00.html
Cisco Performance Visibility Manager User Guide (OL-8620-01)
http://preview.cisco.com/en/US/products/ps6768/products_user_guide_book09186a008063d44f.html
Cisco Performance Visibility Manager Installation Guide (OL-8614-01)
http://www.cisco.com/en/US/products/ps6768/products_installation_guide_book09186a008063d41d.html
Cisco Performance Visibility Manager Troubleshooting Guide (OL-8619-01)
http://www.cisco.com/en/US/products/ps6768/prod_troubleshooting_guide_book09186a008063d44c.html
Copyright Notices for Cisco Performance Visibility Manager (OL-10275-01)
http://preview.cisco.com/en/US/products/ps6768/products_regulatory_approvals_and_compliance09186a0080652dda.html
Cisco Internal Use Only
Copyright © 2006 Cisco Systems, Inc. All rights reserved.
Page 65 of 66
THE SPECIFICATIONS AND INFORMATION REGARDING THE PRODUCTS IN THIS MANUAL ARE SUBJECT TO CHANGE
WITHOUT NOTICE. ALL STATEMENTS, INFORMATION, AND RECOMMENDATIONS IN THIS MANUAL ARE BELIEVED TO BE
ACCURATE BUT ARE PRESENTED WITHOUT WARRANTY OF ANY KIND, EXPRESS OR IMPLIED. USERS MUST TAKE FULL
RESPONSIBILITY FOR THEIR APPLICATION OF ANY PRODUCTS.
THE SOFTWARE LICENSE AND LIMITED WARRANTY FOR THE ACCOMPANYING PRODUCT ARE SET FORTH IN THE
INFORMATION PACKET THAT SHIPPED WITH THE PRODUCT AND ARE INCORPORATED HEREIN BY THIS REFERENCE. IF
YOU ARE UNABLE TO LOCATE THE SOFTWARE LICENSE OR LIMITED WARRANTY, CONTACT YOUR CISCO
REPRESENTATIVE FOR A COPY.
The Cisco implementation of TCP header compression is an adaptation of a program developed by the University of California, Berkeley
(UCB) as part of UCB’s public domain version of the UNIX operating system. All rights reserved. Copyright © 1981, Regents of the
University of California.
NOTWITHSTANDING ANY OTHER WARRANTY HEREIN, ALL DOCUMENT FILES AND SOFTWARE OF THESE SUPPLIERS
ARE PROVIDED “AS IS” WITH ALL FAULTS. CISCO AND THE ABOVE-NAMED SUPPLIERS DISCLAIM ALL WARRANTIES,
EXPRESSED OR IMPLIED, INCLUDING, WITHOUT LIMITATION, THOSE OF MERCHANTABILITY, FITNESS FOR A
PARTICULAR PURPOSE AND NONINFRINGEMENT OR ARISING FROM A COURSE OF DEALING, USAGE, OR TRADE
PRACTICE.
IN NO EVENT SHALL CISCO OR ITS SUPPLIERS BE LIABLE FOR ANY INDIRECT, SPECIAL, CONSEQUENTIAL, OR
INCIDENTAL DAMAGES, INCLUDING, WITHOUT LIMITATION, LOST PROFITS OR LOSS OR DAMAGE TO DATA ARISING
OUT OF THE USE OR INABILITY TO USE THIS MANUAL, EVEN IF CISCO OR ITS SUPPLIERS HAVE BEEN ADVISED OF THE
POSSIBILITY OF SUCH DAMAGES.
Corporate Headquarters
Cisco Systems, Inc.
170 West Tasman Drive
San Jose, CA 95134-1706
USA
www.cisco.com
Tel: 408 526-4000
800 553-NETS (6387)
Fax: 408 526-4100
European Headquarters
Cisco Systems International
BV
Haarlerbergpark
Haarlerbergweg 13-19
1101 CH Amsterdam
The Netherlands
www-europe.cisco.com
Tel: 31 0 20 357 1000
Fax: 31 0 20 357 1100
Americas Headquarters
Cisco Systems, Inc.
170 West Tasman Drive
San Jose, CA 95134-1706
USA
www.cisco.com
Tel: 408 526-7660
Fax: 408 527-0883
Asia Pacific Headquarters
Cisco Systems, Inc.
168 Robinson Road
#28-01 Capital Tower
Singapore 068912
www.cisco.com
Tel: +65 6317 7777
Fax: +65 6317 7799
Cisco Systems has more than 200 offices in the following countries and regions. Addresses, phone numbers, and fax numbers are listed on the
Cisco web site at: www.cisco.com/go/offices.
Argentina • Australia • Austria • Belgium • Brazil • Bulgaria • Canada • Chile • China PRC • Colombia • Costa Rica • Croatia • Cyprus
Czech Republic • Denmark • Dubai, UAE • Finland • France • Germany • Greece • Hong Kong SAR • Hungary • India • Indonesia • Ireland
Israel • Italy • Japan • Korea • Luxembourg • Malaysia • Mexico • The Netherlands • New Zealand • Norway • Peru • Philippines • Poland
Portugal • Puerto Rico • Romania • Russia • Saudi Arabia • Scotland • Singapore • Slovakia • Slovenia • South Africa • Spain • Sweden
Switzerland • Taiwan • Thailand • Turkey • Ukraine • United Kingdom • United States • Venezuela • Vietnam • Zimbabwe
Copyright © 2005 Cisco Systems, Inc. All rights reserved. CCIP, CCSP, the Cisco Powered Network mark, Cisco Unity, Follow Me Browsing, FormShare, and StackWise
are trademarks of Cisco Systems, Inc.; Changing the Way We Work, Live, Play, and Learn, and iQuick Study are service marks of Cisco Systems, Inc.; and Aironet, ASIST,
BPX, Catalyst, CCDA, CCDP, CCIE, CCNA, CCNP, Cisco, the Cisco Certified Internetwork Expert logo, Cisco IOS, the Cisco IOS logo, Cisco Press, Cisco Systems, Cisco
Systems Capital, the Cisco Systems logo, Empowering the Internet Generation, Enterprise/Solver, EtherChannel, EtherSwitch, Fast Step, GigaStack, Internet Quotient, IOS,
IP/TV, iQ Expertise, the iQ logo, iQ Net Readiness Scorecard, LightStream, Linksys, MGX, MICA, the Networkers logo, Networking Academy, Network Registrar, Packet,
PIX, Post-Routing, Pre-Routing, RateMUX, Registrar, ScriptShare, SlideCast, SMARTnet, StrataView Plus, Stratm, SwitchProbe, TeleRouter, The Fastest Way to Increase
Your Internet Quotient, TransPath, and VCO are registered trademarks of Cisco Systems, Inc. and/or its affiliates in the United States and certain other countries.
All other trademarks mentioned in this document or Web site are the property of their respective owners. The use of the word partner does not imply a partnership relationship
between Cisco and any other company. (0402R)
Printed in the USA
Cisco Internal Use Only
Copyright © 2006 Cisco Systems, Inc. All rights reserved.
Page 66 of 66