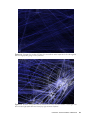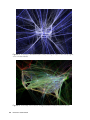
1
r
e
l
p
m
a
S
e
e
Fr
O’Reilly Ebooks—Your bookshelf on your devices!
When you buy an ebook through oreilly.com, you get lifetime access to the book, and
whenever possible we provide it to you in four, DRM-free file formats—PDF, .epub,
Kindle-compatible .mobi, and Android .apk ebook—that you can use on the devices of
your choice. Our ebook files are fully searchable and you can cut-and-paste and print
them. We also alert you when we’ve updated the files with corrections and additions.
Learn more at http://oreilly.com/ebooks/
You can also purchase O’Reilly ebooks through iTunes,
the Android Marketplace, and Amazon.com.
Beautiful Visualization
Edited by Julie Steele and Noah Iliinsky
Copyright © 2010 O’Reilly Media, Inc. All rights reserved.
Published by O’Reilly Media, Inc., 1005 Gravenstein Highway North, Sebastopol, CA 95472.
O’Reilly books may be purchased for educational, business, or sales promotional use. Online
editions are also available for most titles (http://my.safaribooksonline.com). For more information,
contact our corporate/institutional sales department: (800) 998-9938 or [email protected].
Editor: Julie Steele
Production Editor: Rachel Monaghan
Copyeditor: Rachel Head
Proofreader: Rachel Monaghan
Indexer: Julie Hawks
Cover Designer: Karen Montgomery
Interior Designer: Ron Bilodeau
Illustrator: Robert Romano
The O’Reilly logo is a registered trademark of O’Reilly Media, Inc. Beautiful Visualization, the
cover image, and related trade dress are trademarks of O’Reilly Media, Inc.
Many of the designations used by manufacturers and sellers to distinguish their products are
claimed as trademarks. Where those designations appear in this book, and O’Reilly Media, Inc.
was aware of a trademark claim, the designations have been printed in caps or initial caps.
While every precaution has been taken in the preparation of this book, the publisher and authors assume no responsibility for errors or omissions, or for damages resulting from the use of
the information contained herein.
ISBN: 978-1-449-37987-2
C o nte nts
Preface. . . . . . . . . . . . . . . . . . . . . . . . . . . . . . . . xi
1
On Beauty. . . . . . . . . . . . . . . . . . . . . . . . . . . . . .
1
Noah Iliinsky
2
What Is Beauty?
Learning from the Classics
How Do We Achieve Beauty?
Putting It Into Practice
Conclusion
1
3
6
11
13
Once Upon a Stacked Time Series.. . . . . . . . . . . . . .
15
Matthias Shapiro
3
Question + Visual Data + Context = Story
Steps for Creating an Effective Visualization
Hands-on Visualization Creation
Conclusion
16
18
26
36
Wordle.. . . . . . . . . . . . . . . . . . . . . . . . . . . . . . .
37
Jonathan Feinberg
4
Wordle’s Origins
How Wordle Works
Is Wordle Good Information Visualization?
How Wordle Is Actually Used
Conclusion
Acknowledgments
References
38
46
54
57
58
58
58
Color: The Cinderella of Data Visualization.. . . . . . . . .
59
Michael Driscoll
Why Use Color in Data Graphics?
Luminosity As a Means of Recovering Local Density
Looking Forward: What About Animation?
Methods
Conclusion
References and Further Reading
59
64
65
65
67
67
v
5
Mapping Information: Redesigning the New York City
Subway Map.. . . . . . . . . . . . . . . . . . . . . . . . . . .
69
Eddie Jabbour, as told to Julie Steele
6
The Need for a Better Tool
London Calling
New York Blues
Better Tools Allow for Better Tools
Size Is Only One Factor Looking Back to Look Forward
New York’s Unique Complexity
Geography Is About Relationships
Sweat the Small Stuff
Conclusion
69
71
72
73
73
75
77
79
85
89
Flight Patterns: A Deep Dive. . . . . . . . . . . . . . . . . .
91
Aaron Koblin with Valdean Klump
Techniques and Data
Color
Motion
Anomalies and Errors
Conclusion
Acknowledgments
7
94
95
98
99
101
102
Your Choices Reveal Who You Are:
Mining and Visualizing Social Patterns .. . . . . . . . . . . 103
Valdis Krebs
Early Social Graphs
Social Graphs of Amazon Book Purchasing Data
Conclusion
References
8
103
111
121
122
Visualizing the U.S. Senate Social Graph
(1991–2009).. . . . . . . . . . . . . . . . . . . . . . . . . . . 123
Andrew Odewahn
Building the Visualization
The Story That Emerged
What Makes It Beautiful?
And What Makes It Ugly?
Conclusion
References
vi
Contents
124
131
136
137
141
142
9
The Big Picture: Search and Discovery. . . . . . . . . . . . 143
Todd Holloway
The Visualization Technique
YELLOWPAGES.COM
The Netflix Prize
Creating Your Own
Conclusion
References
10
144
144
151
156
156
156
Finding Beautiful Insights in the Chaos
of Social Network Visualizations.. . . . . . . . . . . . . . . 157
Adam Perer
Visualizing Social Networks
Who Wants to Visualize Social Networks?
The Design of SocialAction
Case Studies: From Chaos to Beauty
References
11
157
160
162
166
173
Beautiful History: Visualizing Wikipedia.. . . . . . . . . . . 175
Martin Wattenberg and Fernanda Viégas
Depicting Group Editing
History Flow in Action
Chromogram: Visualizing One Person at a Time
Conclusion
12
175
184
186
191
Turning a Table into a Tree: Growing Parallel Sets
into a Purposeful Project.. . . . . . . . . . . . . . . . . . . . 193
Robert Kosara
Categorical Data
Parallel Sets
Visual Redesign
A New Data Model
The Database Model
Growing the Tree
Parallel Sets in the Real World
Conclusion
References
194
195
197
199
200
202
203
204
204
Contents
vii
13
The Design of “X by Y”.. . . . . . . . . . . . . . . . . . . . . 205
Moritz Stefaner
Briefing and Conceptual Directions
Understanding the Data Situation
Exploring the Data
First Visual Drafts
The Final Product
Conclusion
Acknowledgments
References
14
205
207
208
211
216
223
225
225
Revealing Matrices. . . . . . . . . . . . . . . . . . . . . . . . 227
Maximilian Schich
The More, the Better?
Databases As Networks
Data Model Definition Plus Emergence
Network Dimensionality
The Matrix Macroscope
Reducing for Complexity
Further Matrix Operations
The Refined Matrix
Scaling Up
Further Applications
Conclusion
Acknowledgments
References
15
228
230
231
233
235
239
246
247
247
249
250
250
250
This Was 1994: Data Exploration
with the NYTimes Article Search API. . . . . . . . . . . . . 255
Jer Thorp
Getting Data: The Article Search API
Managing Data: Using Processing
Three Easy Steps
Faceted Searching
Making Connections
Conclusion
viii
Contents
255
257
262
263
265
270
16
A Day in the Life of the New York Times. . . . . . . . . . . 271
Michael Young and Nick Bilton
Collecting Some Data
Let’s Clean ’Em First
Python, Map/Reduce, and Hadoop
The First Pass at the Visualization
Scene 1, Take 1
Scene 1, Take 2
The Second Pass at the Visualization
Visual Scale and Other Visualization Optimizations
Getting the Time Lapse Working
So, What Do We Do with This Thing?
Conclusion
Acknowledgments
17
272
273
274
274
277
279
280
284
285
287
287
290
Immersed in Unfolding Complex Systems.. . . . . . . . . 291
Lance Putnam, Graham Wakefield, Haru Ji, Basak Alper,
Dennis Adderton, and Professor JoAnn Kuchera-Morin
Our Multimodal Arena
Our Roadmap to Creative Thinking
Project Discussion
Conclusion
References
18
291
293
296
309
309
Postmortem Visualization: The Real Gold Standard . . . . 311
Anders Persson
Background
Impact on Forensic Work
The Virtual Autopsy Procedure
The Future for Virtual Autopsies
Conclusion
References and Suggested Reading 312
312
315
325
327
327
Contents
ix
19
Animation for Visualization:
Opportunities and Drawbacks. . . . . . . . . . . . . . . . . 329
Danyel Fisher
Principles of Animation
Animation in Scientific Visualization
Learning from Cartooning
Presentation Is Not Exploration
Types of Animation
Staging Animations with DynaVis
Principles of Animation
Conclusion: Animate or Not?
Further Reading
Acknowledgments
References
20
330
331
331
338
339
344
348
349
350
350
351
Visualization: Indexed.. . . . . . . . . . . . . . . . . . . . . . 353
Jessica Hagy
Visualization: It’s an Elephant. Visualization: It’s Art. Visualization: It’s Business. Visualization: It’s Timeless. Visualization: It’s Right Now. Visualization: It’s Coded.
Visualization: It’s Clear. Visualization: It’s Learnable. Visualization: It’s a Buzzword. Visualization: It’s an Opportunity.
353
355
356
357
359
360
361
363
365
366
Contributors. . . . . . . . . . . . . . . . . . . . . . . . . . . . 369
Index.. . . . . . . . . . . . . . . . . . . . . . . . . . . . . . . . 375
x
Contents
C h a p t e r Si x
Flight Patterns: A Deep Dive
Aaron Koblin with Valdean Klump
There are roads in the sky. We can’t see them, but they are there: distinct,
sharply defined avenues, traversed by thousands of airplanes every day. As individual observers we might never guess this was the case, but plotting the raw flight data
shows us otherwise (Figure 6-1).
Flight Patterns is a project I started in 2005 that visualizes civilian air traffic in the
United States and Canada. It exists in two mediums: still imagery, which traces aircraft
arriving and departing from U.S. and Canadian airports over a 24-hour period, and
video imagery, which depicts the same data in motion. In this chapter, I’ll show you
some of these images and talk about the techniques I used to render them. I’ll also
share some thoughts on why I find this project so compelling, and why I hope you will
as well.*
*All of the images in this chapter are available in high resolution online, so if you find them intriguing, I recommend that you visit my website to get a better look at them: http://www.aaronkoblin.
com/work/flightpatterns/. On the site, you may zoom in to the visualizations as well as view them in
colors indicating aircraft altitude, model, and manufacturer. You may also view videos of the flight
data in motion.
91
Figure 6-1. Flight Patterns, a visualization of aircraft location data for airplanes arriving at and
departing from U.S. and Canadian airports
To begin with, I want to draw your attention to what I believe are the two most striking features of the visualization. The first is the tendency of airplanes to follow the
exact same flight paths as other planes. When I originally rendered the data, I expected
to see tight groupings of planes close to airports and a vast dispersion between them.
Instead, I found the opposite: flight paths between airports tend to cluster, and then, as
the planes get closer to landing or departing, their flight paths tend to disperse (Figures
6-2 and 6-3).
When you think about it, this is quite interesting. The sky is wide open, without any
natural restrictions whatsoever, so planes can travel by any route they choose. And yet
when looking at Flight Patterns, it almost appears as if there’s a map to the sky, a kind
of aerial highway system, with designated routes between various destinations. You
can even make out the roads.
Why is this happening? To be honest, I don’t know for sure. The routes may simply
be the most efficient flight paths, or—more likely, I think—they may be determined
by a combination of many factors: the airplanes’ autopilot systems, governmentmandated flight paths, directions from the carriers, air traffic control systems, rules
meant to limit traffic over areas with large populations, and meteorological factors
such as wind direction and air pressure. Regardless, I think this tendency is striking,
because it shows the logical organization of a completely open space. It’s for this reason that I chose the word “patterns” for the name of the project.
92
Beautiful Visualization
Figure 6-2. Closeup of a section of Figure 6-1 that reflects what I expected to find throughout
the data: flight paths going in every direction
Figure 6-3. Another closeup that reflects what I found to be common instead: clear, bright lines
that indicate flight paths followed closely by high volumes of planes
chapter 6: flight patterns: a deep dive
93
The second striking feature of Flight Patterns is that it allows us to visualize the vastness of the U.S. and Canadian air transportation system. To me, this is what makes
data visualization so valuable. We cannot grasp the totality of flight traffic in the U.S.
and Canada by looking up at the sky or by seeing the raw numbers, but we can understand it through visualization. Viewed together, the flight paths show us more than the
sum of their parts: they show us a system—and the system, I believe, is beautiful. It
reveals something not just about flight paths, but about the geography of human populations, and more broadly, of our species’s clear desire to travel.
Techniques and Data
Flight Patterns was created with Processing,* a programming language that is particularly
suited for data visualization. Once the flight data was procured (always a critical step), I
wrote a simple Processing program to translate each data point’s latitude and longitude
into a 2D map on my computer screen. Concurrently, I added selective color to each
point to indicate information such as altitude and aircraft model. I then exported all of
these images as TGA files.
The videos were a little trickier. Showing the airplanes as moving dots failed to reveal
the progress of each flight. So instead I drew lines between each data point, and, after
a set time interval (3 minutes or 5 minutes, depending on the dataset), I added a 4%
black opacity layer over the entire map. This meant that older flight paths would fade
into the background over time, which helped to show the planes’ progress.
The data used in Flight Patterns is a processed version of the Aircraft Situation Display
to Industry (ASDI) feed, a record of all civilian flight paths that is published by the
FAA.† The feed is available only to companies with ties to the aviation industry. Thanks
to my colleague Scott Hessels, I received 28 hours’ worth of this flight data in 2005.
My initial visualization was a contribution to the Celestial Mechanics project completed along with Gabriel Dunne at UCLA’s Design | Media Arts program.
The initial dataset I worked with was from March 19–20, 2005, and includes 141,029
flights, sampled every 3 minutes, for a total of 6,871,383 data points. Three years later,
in 2008, I worked with Wired magazine to obtain another dataset. This data came from
August 12–13, 2008, and includes 205,514 flights, sampled every minute, for a total of
26,552,304 data points.
The data I received that was derived from the ASDI feed included the following information for each data point:
*See http://processing.org.
†“Civilian” means all nonmilitary commercial and private flights tracked by the FAA.
94
Beautiful Visualization
• Latitude
• Longitude
• Altitude
• Aircraft manufacturer
• Aircraft model
• Timestamp
• Flight number
If you are interested in seeing some of the data yourself, the FAA presently provides a
sample of the ASDI feed in XML format at http://www.fly.faa.gov/ASDI/asdi.html.
Color
Flight Patterns does not use any complex mapmaking techniques: simply plotting the
data speaks for itself. However, color plays an important role in telling different stories
using the same flight paths. Figures 6-4 through 6-9 show some examples.
Figure 6-4. In this map, color indicates altitude, with pure white meaning the plane is at ground
level
chapter 6: flight patterns: a deep dive
95
Figure 6-5. A closeup on the Atlanta airport, clearly showing the layout of the runways (again,
color indicates altitude)
Figure 6-6. In this map, color is used to distinguish between different models of aircraft
96
Beautiful Visualization
Figure 6-7. A map of a single aircraft model, showing only flights on Embraer ERJ 145 regional
jets
Figure 6-8. Another map of a single aircraft model, showing only flights on Boeing 737 jets
chapter 6: flight patterns: a deep dive
97
Figure 6-9. In this map, separate colors show takeoffs and landings: orange indicates a
descending plane and blue indicates an ascending plane
Motion
In motion, Flight Patterns reveals new pieces of information, including aircraft direction and volume over time. The visualization tracks flights from one evening to the
next in order to show the country falling asleep and waking up the following day
(Figures 6-10 and 6-11).
Figure 6-10. The East Coast wakes up: this still image, from 7:31 a.m. EST on March 20, 2005,
shows high activity on the East Coast and virtual stillness on the West Coast (except for a few
redeye flights flying northeast from Hawaii)
98
Beautiful Visualization
Figure 6-11. At 4:10 p.m. EST, we see a very different story: at this moment, air traffic peaks
with 19,255 planes in the air
On my website, I’ve also included a video of a 3D visualization that plots altitude along
the z-axis in a 3D projection. In order for this axis to be discernible versus the lateral
scale of the continent, I’ve exaggerated the altitude considerably, and it makes for a
dense but interesting visualization. It doesn’t print well, however. I recommend you
take a look online if you’re interested.
Anomalies and Errors
Like many datasets, the data I used in Flight Patterns contained a number of errors
and anomalies, some of which I removed. For example, while trying to find the fastest flight in the dataset, I identified one flight that crossed the entire country in 6
minutes—clearly an error. Another flight zigzagged dramatically (and impossibly)
north and south while crossing the country—another clear error. I removed both of
these flights.
There were other anomalies, however, that I kept. For example, the flight paths over
the north Atlantic appear jagged (Figure 6-12). I opted to keep this data in the visualization because it was important to show the flights coming from Europe. I don’t know
why those errors are there. They could indicate problems with the planes’ instruments, the processing of the ASDI, or an error by the data supplier. After fretting about
it for a long time, I decided to simply leave the data as it was. Also, when looking for
the shortest flight, I found that over 3,000 aircraft had reported their locations without
ever departing the airport; I kept these anomalies, too.
chapter 6: flight patterns: a deep dive
99
Figure 6-12. Flight paths over the north Atlantic show some anomalies in the data
If you look carefully at the visualization, you will notice some interesting features. One
obvious example is the restricted no-fly zones over Nevada (Figure 6-13). It doesn’t
appear as if these no-fly zones are completely restricted, though: a tiny number of
flights crossing this dark space are just discernable.
Figure 6-13. A closeup look at no-fly zones in the southwest United States
100
Beautiful Visualization
Every time you work with large, organic datasets, you will find errors and anomalies,
and I think it’s important to consider how to handle them. For each case, I ask myself,
will I harm the integrity of the data by manipulating it? If the answer is yes, it’s best to
simply leave the data as it is or, in the case of obvious errors, remove them entirely. If
anything, you should celebrate anomalies rather than removing them (and be sure to
investigate them for the interesting stories).
Conclusion
Flight Patterns is a simple data visualization, and this simplicity makes it compelling
for several reasons. For one thing, the project reveals a map of our air transit system,
which is something that has never before been visualized publicly, as far as I’m aware.
Secondly, the visualization is easy to understand, even though it is made entirely from
data—the airports in the visualization create nodes that conform to our geographical
conception of North America (Figure 6-14). Likewise, the densest flight paths fall over
areas of high population, just as we’d expect.
Figure 6-14. A closeup on the southwest United States—how many airports can you identify?
chapter 6: flight patterns: a deep dive
101
Finally, I find Flight Patterns compelling because it is comforting. This is perhaps a
strange emotion to associate with a map, but by showing the orderliness of air transport and by uncovering the mystery of how planes get from place to place, Flight
Patterns reveals a logical system that we are only a tiny part of when sitting in seat
16A at 34,000 feet. It’s comforting, I think, to see a system that works so well, at such
a high volume. With over 200,000 flights in one day in the U.S. and Canada alone, we
truly have created roads in the sky, every one of them guiding thousands of people
from origin to destination, and with a remarkable safety record. In this sense, Flight
Patterns is more than a data visualization: it is a showcase for the miracle of modern
air travel.
Acknowledgments
I owe the idea and inspiration for Flight Patterns to two colleagues at UCLA, Gabriel
Dunne and Scott Hessels. In 2005, we started an art project called Celestial Mechanics
(http://cmlab.com) that depicts air and space systems in motion. A small part of the project was devoted to aircraft flight data, and they provided me with the data so I could
build what became Flight Patterns. Thanks also to Mark Hansen, of UCLA, and Wired
magazine (especially Carl DeTorres) for further assistance in procuring the data for
these images.
Want to read more?
You can find this book at oreilly.com
in print or ebook format.
It’s also available at your favorite book retailer,
including iTunes, the Android Market, Amazon,
and Barnes & Noble.
Spreading the knowledge of innovators
oreilly.com