1
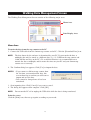
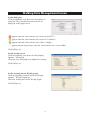
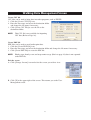
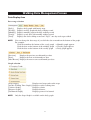
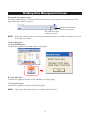
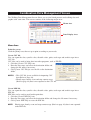
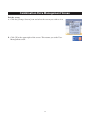
Omron Health Management Software Ver 1.6 User’s Help Manual Copyright 2006-2012 Omron Healthcare Co., Ltd. World Rights Reserved IM-HMS-HEM-SOFT-IT2-A-06-11/2011 TABLE OF CONTENTS Before Using the Software Important Safety Information . . . . . . . . . . . . . . . . . . . . . . . . . . . . . . . . . . . . . . . . . . . . . . . . . . 4 Intended Use . . . . . . . . . . . . . . . . . . . . . . . . . . . . . . . . . . . . . . . . . . . . . . . . . . . . . . . . . . . . . . 4 Operating Environment Requirement . . . . . . . . . . . . . . . . . . . . . . . . . . . . . . . . . . . . . . . . . . . . .5 User Management Screen Register new user . . . . . . . . . . . . . . . . . . . . . . . . . . . . . . . . . . . . . . . . . . . . . . . . . . . . . . . 6 Edit a user . . . . . . . . . . . . . . . . . . . . . . . . . . . . . . . . . . . . . . . . . . . . . . . . . . . . . . . . . . . . . 7 Delete a user . . . . . . . . . . . . . . . . . . . . . . . . . . . . . . . . . . . . . . . . . . . . . . . . . . . . . . . . . . . 7 Search for a user on the user list . . . . . . . . . . . . . . . . . . . . . . . . . . . . . . . . . . . . . . . . . . . . 7 View user data . . . . . . . . . . . . . . . . . . . . . . . . . . . . . . . . . . . . . . . . . . . . . . . . . . . . . . . . . . 7 Change the title names on user list . . . . . . . . . . . . . . . . . . . . . . . . . . . . . . . . . . . . . . . . . . . 7 Change sorting order or hide user list at startup . . . . . . . . . . . . . . . . . . . . . . . . . . . . . . . . . 8 Create CSV file . . . . . . . . . . . . . . . . . . . . . . . . . . . . . . . . . . . . . . . . . . . . . . . . . . . . . . . . . 8 Exit the screen . . . . . . . . . . . . . . . . . . . . . . . . . . . . . . . . . . . . . . . . . . . . . . . . . . . . . . . . . . 8 Blood Pressure Data Management Screen Menu Area Transfer the data from the monitor to the PC . . . . . . . . . . . . . . . . . . . . . . . . . . . . . . . . . . . 9 Print the screen . . . . . . . . . . . . . . . . . . . . . . . . . . . . . . . . . . . . . . . . . . . . . . . . . . . . . . . . . 9 Set the target blood pressure . . . . . . . . . . . . . . . . . . . . . . . . . . . . . . . . . . . . . . . . . . . . . . 10 Create CSV file . . . . . . . . . . . . . . . . . . . . . . . . . . . . . . . . . . . . . . . . . . . . . . . . . . . . . . . . 10 Create PDF file . . . . . . . . . . . . . . . . . . . . . . . . . . . . . . . . . . . . . . . . . . . . . . . . . . . . . . . . 11 Exit the screen . . . . . . . . . . . . . . . . . . . . . . . . . . . . . . . . . . . . . . . . . . . . . . . . . . . . . . . . . 11 Data Display Area Function Chart . . . . . . . . . . . . . . . . . . . . . . . . . . . . . . . . . . . . . . . . . . . . . . . . . . . . . . . . . 11 Date range selection . . . . . . . . . . . . . . . . . . . . . . . . . . . . . . . . . . . . . . . . . . . . . . . . . . . . . 12 Time range selection . . . . . . . . . . . . . . . . . . . . . . . . . . . . . . . . . . . . . . . . . . . . . . . . . . . . 12 Graph selection . . . . . . . . . . . . . . . . . . . . . . . . . . . . . . . . . . . . . . . . . . . . . . . . . . . . . . . . 12 View the data list . . . . . . . . . . . . . . . . . . . . . . . . . . . . . . . . . . . . . . . . . . . . . . . . . . . . . . . 15 Enter data manually . . . . . . . . . . . . . . . . . . . . . . . . . . . . . . . . . . . . . . . . . . . . . . . . . . . . . 17 Walking Data Management Screen Menu Area Transfer the data from the step counter to the PC . . . . . . . . . . . . . . . . . . . . . . . . . . . . . . . 18 Print the screen . . . . . . . . . . . . . . . . . . . . . . . . . . . . . . . . . . . . . . . . . . . . . . . . . . . . . . . . 18 Set the daily goal . . . . . . . . . . . . . . . . . . . . . . . . . . . . . . . . . . . . . . . . . . . . . . . . . . . . . . . 19 Set the startup screen . . . . . . . . . . . . . . . . . . . . . . . . . . . . . . . . . . . . . . . . . . . . . . . . . . . . 19 Set the starting date on Weekly graph . . . . . . . . . . . . . . . . . . . . . . . . . . . . . . . . . . . . . . . 19 Create CSV file . . . . . . . . . . . . . . . . . . . . . . . . . . . . . . . . . . . . . . . . . . . . . . . . . . . . . . . . 20 Create PDF file . . . . . . . . . . . . . . . . . . . . . . . . . . . . . . . . . . . . . . . . . . . . . . . . . . . . . . . . 20 Exit the screen . . . . . . . . . . . . . . . . . . . . . . . . . . . . . . . . . . . . . . . . . . . . . . . . . . . . . . . . . 20 Data Display Area Date range selection . . . . . . . . . . . . . . . . . . . . . . . . . . . . . . . . . . . . . . . . . . . . . . . . . . . . . 21 Graph selection . . . . . . . . . . . . . . . . . . . . . . . . . . . . . . . . . . . . . . . . . . . . . . . . . . . . . . . . 21 Event and step counter usage . . . . . . . . . . . . . . . . . . . . . . . . . . . . . . . . . . . . . . . . . . . . . . 22 View walking data . . . . . . . . . . . . . . . . . . . . . . . . . . . . . . . . . . . . . . . . . . . . . . . . . . . . . . 22 2 TABLE OF CONTENTS Combination Data Management Screen Menu Area Print the screen . . . . . . . . . . . . . . . . . . . . . . . . . . . . . . . . . . . . . . . . . . . . . . . . . . . . . . . . 23 Create CSV file . . . . . . . . . . . . . . . . . . . . . . . . . . . . . . . . . . . . . . . . . . . . . . . . . . . . . . . . 23 Create PDF file . . . . . . . . . . . . . . . . . . . . . . . . . . . . . . . . . . . . . . . . . . . . . . . . . . . . . . . . 23 Exit the screen . . . . . . . . . . . . . . . . . . . . . . . . . . . . . . . . . . . . . . . . . . . . . . . . . . . . . . . . . 24 Data Display Area Date range selection . . . . . . . . . . . . . . . . . . . . . . . . . . . . . . . . . . . . . . . . . . . . . . . . . . . . . 25 Walking graph selection . . . . . . . . . . . . . . . . . . . . . . . . . . . . . . . . . . . . . . . . . . . . . . . . . 25 Time range selection . . . . . . . . . . . . . . . . . . . . . . . . . . . . . . . . . . . . . . . . . . . . . . . . . . . . 25 Transferring/Merging User Data . . . . . . . . . . . . . . . . . . . . . . . . . . . . . . . . . . . . . . . . . . . . . . . .26 Uninstalling the Software . . . . . . . . . . . . . . . . . . . . . . . . . . . . . . . . . . . . . . . . . . . . . . . . . . . . . .29 3 Before Using the Software • Use this software and Help Manual under conditions described on the License Agreement applicable to this product. • It is prohibited to use or copy all or part of this software and Help Manual without prior permission from Omron Healthcare Co., Ltd. • The specifications of this software and the descriptions in this Help Manual are subject to change without prior notice. • The screen images printed in this Help Manual may slightly differ from the images displayed by the software. • Microsoft, Windows, Internet Explorer, Access, and Excel are registered trademarks or trademarks of Microsoft Corporation in the United States and other countries. • Adobe, Adobe logo, Acrobat and Reader are registered trademarks or trademarks of Adobe Systems Incorporated in the United States and other countries. • Other company names and product names used in this Help Manual are trademarks or registered trademarks of the respective companies. Trademark and registered trademark symbols such as ® and TM are omitted in this Help Manual. • In this Help Manual, the Microsoft Windows 7 Operating System is abbreviated to “Windows 7”, the Microsoft Windows Vista Operating System is abbreviated to “Windows Vista”, the Microsoft Windows XP Operating System is abbreviated to “Windows XP”, and the Microsoft Windows 2000 Professional Operating System is abbreviated to “Windows 2000”. Also, Microsoft Internet Explorer is abbreviated to “Internet Explorer”, and Microsoft Excel is abbreviated to “Excel”. Important Safety Information Always consult your doctor. Self-diagnosis of measurement results and self-treatment are dangerous. Intended Use This product is designed to view the data transferred from the Omron blood pressure monitor or the Omron step counter on a PC. It is mainly designed for general household use. Please read this Help manual, the blood pressure monitor’s manual, the step counter’s manual, and the PC’s manual before using this product. 4 Operating Environment Requirement The following operating environments are required to run this software. Supported OS: Microsoft Windows 2000 Professional (SP4) Microsoft Windows XP Home Edition (SP3) Microsoft Windows XP Professional (SP3)* Microsoft Windows Vista Home Basic (SP2) Microsoft Windows Vista Home Premium (SP2) Microsoft Windows Vista Business (SP2) Microsoft Windows Vista Enterprise (SP2) Microsoft Windows Vista Ultimate (SP2) Microsoft Windows 7 Starter (SP1) Microsoft Windows 7 Home Basic (SP1) Microsoft Windows 7 Home Premium (SP1) Microsoft Windows 7 Professional (SP1) Microsoft Windows 7 Ultimate (SP1) PC: 800 MHz or higher CPU, PC/AT compatible machine Memory capability: 512 MB or more Hard disc space: 32 MB or more** Display: Super VGA (800 × 600 pixel) or higher resolution video adapter and monitor Others: A CD-ROM USB connector (USB Revision 1.1 compliant) Adobe Acrobat Reader 8 or higher NOTES: • If the OS environmental requirements are above those listed, then additional resources may be required. • Some other screens may appear according to the OS of your PC. Install the software with referring to the screens appear on your PC. * Microsoft® Windows® XP 64 bit edition is excluded. ** Additional 200 MB is necessary in the case that Microsoft .NET or MDAC is not installed. 5 User Management Screen This software can register multiple users and manage the data for their blood pressure measurements and walking. Data is controlled by user name. User List Register new user Click the [Add User] icon then enter the user name and other information if necessary into the memo fields. Click [OK] to register. NOTES: • A user name must be entered to register a new user. • The user name can be up to 28 characters, using either letters or numbers. • Up to 1000 unique users can be registered depending on the amount of free disc space in your PC. • The characters / \ : * ? ” < > | , ; cannot be used in User Name. • The characters , ; cannot be used in Memo1 and Memo2. Click [Password Options] on the dialog box to set a password if desired. Click [OK] to confirm. NOTES: • Remember your password. If you forget your password you cannot log in, edit or delete the user. Write your password down, and keep it in a secure location. • To cancel the password leave the “New Password” and the “Input again for confirmation” fields blank. 6 User Management Screen Edit a user Select the user name on the user list then click the [Edit User] icon. Delete a user Select the user name on the user list then click the [Delete User] icon. NOTE: To select multiple users click the desired users while pressing the Ctrl key or the Shift key. Search for a user on the user list Enter the keywords in “User Name”, “Memo 1” or “Memo 2” then click [Start Search]. Click [Clear Search Terms] to clear the keywords. Click [Display User List] to display all users. View user data Select the user name on the user list then click the [Graphs Screen] icon. When you click on the [Graphs Screen] icon for the first time, the dialog box to select [Blood Pressure Monitor] or [Step Counter] will appear. Select the icon that represents the data you want to view. The next time that you click on the [Graphs Screen] icon, it will automatically display the screen for the data type you viewed the previous time. If you wish to change which information you want to view, click on the [Change Screens] icon, and pick the appropriate selection. Change the title names on user list Click the [Option] icon then click the [Setting Heading Names] tab. Enter title names if needed. Click [OK] to confirm. 7 User Management Screen Change sorting order or hide user list at startup Click the [Option] icon then click the [Display Options at Startup] tab. Select sorting order on “Sorting order at startup” to change the order at startup. Select “Do not Display” on “User List Display at Startup” to hide the user list at startup. Create CSV file This software can create a CSV file for export and database purposes for a single user or multiple users. CSV files can be used to bring data into other programs, such as EXCEL. NOTE: To select multiple users click the desired users while pressing the Ctrl key or the Shift key. 1. Select single or multiple users on the user list then click the [Create CSV file] icon. 2. Click either [Blood Pressure Data] or [Step Counter Data]. 3. Select the destination folder and change the file name if necessary. 4. Click [Create CSV File] to save the file to the destination folder. Exit the screen Click [X] at the upper right of the screen. You will exit the Omron Health Management Software program. 8 Blood Pressure Data Management Screen The Blood Pressure Data Management screen consists of the following major areas. Menu Area Data Display Area Menu Area Transfer the data from the monitor to the PC 1. Connect the USB cable from the Omron blood pressure monitor to the PC. Click the [Download Data] icon. 2. The Confirm dialog appears. Click [Yes] to import the data. When you transfer the data for the first time, the [Options] box as shown below will appear. Select the model of your monitor, and if your monitor is M10-IT, M9 Premium or i-Q142, select USER A or USER B of the monitor you use. 3. Start importing data. Click [Cancel] if you want to cancel. 4. The dialog box appears when complete. Click [OK]. NOTES: • You cannot transfer the data while taking a blood pressure reading. • Do not turn the PC off or unplug the USB cable while the data is being transferred. Print the screen Click the [Print] icon, then set up to print according to your needs. 9 Blood Pressure Data Management Screen Set the target blood pressure Click the [Options] icon. [Set Systolic target (mmHg)] Enter your target systolic blood pressure value. An orange line indicating your systolic blood pressure target appears on the graph. [Set Diastolic target (mmHg)] Enter your target diastolic blood pressure value. An orange line indicating your systolic blood pressure target appears on the graph. [Date is shaded pink if difference between your morning and evening systolic blood pressure values is above] Enter the limit difference between morning and evening systolic blood pressure value. When the difference exceeds the limit, the corresponding dates are shaded pink on the graph. NOTE: This function is available only in the case morning value is higher than evening value. Click [OK] to set. Create CSV file CSV files can be used to bring data into other programs, such as EXCEL. 1. Click the [Create CSV File] icon. 2. Enter the date range and select the destination folder and change the file name if necessary. 3. Click [Create CSV File] to save the file to the destination folder. NOTE: This CSV file is not available for importing CSV data (Refer to Page 26). 10 Blood Pressure Data Management Screen Create PDF file PDF files can be used to email and/or print data. 1. Click the [Create PDF File] icon. 2. Enter the date range and select the destination folder and change the file name if necessary. 3. Click [Create PDF File] to create the PDF file. Exit the screen A. Click the [Change Screens] icon and select the screen you wish to view. B. Click [X] at the upper right of the screen. This returns you to the User Management screen. Data Display Area Function Chart [Blood Pressure and Pulse] [Morning Evening Comparison] [Frequency Distribution] [Weekly Average] [Time Range Selection] Data List Comment Entry Manual Data Entry [Weekly] ✔ ✔ ✔ ✔ ✔ ✔ ✔ [Monthly] ✔ ✔ ✔ ✔ ✔ ✔ ✔ 11 [Yearly] ✔ ✔ ✔ ✔ ✔ ✔ [All] ✔ [Data List] ✔ Blood Pressure Data Management Screen Date range selection [Weekly]: Displays weekly data [Monthly]: Displays monthly data [Yearly]: Displays yearly data [All]: Displays all data [Data List]: Displays the data list selected. Input the data ranges you wish to view. [Previous]: Displays the previous week/month/year data [Next]: Displays the next week/month/year data [Most Recent]: Displays the most recent week/month/year data Time range selection [Total]: [Morning]: [Daytime]: [Evening]: [Average]: Displays all of the data stored Displays the blood pressure and pulse readings recorded between 4:00 AM-9:59 AM Displays the blood pressure and pulse readings recorded between 10:00 AM-6:59 PM Displays the blood pressure and pulse readings recorded between 7:00 PM-3:59 AM Displays the average data for all readings Graph selection [Blood Pressure and Pulse]: Displays the trend of your blood pressure and pulse readings. 12 Blood Pressure Data Management Screen How to interpret the graph. Upper Line: Systolic value Lower Line: Diastolic value Dotted vertical line: Includes manually entered data Solid vertical bar: Only includes data downloaded from the blood pressure monitor Bar and dots in Blue: The average value of all the blood pressure and pulse readings taken in the morning (4:00 AM-9:59 AM) Bar and dots in Orange: The average value of all the blood pressure and pulse readings taken in daytime (10:00 AM-6:59 PM) Bar and dots in Purple: The average value of all the blood pressure and pulse readings taken in the evening (7:00 PM-3:59 AM) Pink shading: The difference between morning and evening systolic blood pressure value exceeds the designated limit for that day (Refer to “Set the target blood pressure” on page 10). Heart symbol: At least one Irregular Heartbeat reading is included in the data. If you move your cursor over the heart symbol, a box below will appear showing the number of total blood pressure readings and irregular heartbeats recorded during that time period. [Morning Evening Comparison]: Displays the average value of all the blood pressure and pulse readings taken in the morning and evening. 13 Blood Pressure Data Management Screen [Frequency Distribution]: Displays the frequency distribution of the blood pressure and pulse readings. [Weekly Average]: Displays the weekly average value of the blood pressure and pulse readings. When you use the M10-IT, M9 Premium or i-Q142 monitor, the first 3 measurements in the morning and last 3 measurements in the evening are averaged. When you use the MIT Elite Plus, R7, 637IT or RX Genius monitor, all measurements in the time range are averaged. NOTES: • If the data are imported as a CSV file, all measurements in the time range are averaged regardless of the monitor you use. • If one user uses 2 or more monitors, do not refer to the Weekly Average graph. 14 Blood Pressure Data Management Screen View the data list A. View the data list for a specific date range Click the [Data List] icon then select the date range. Click the [Search by Date] icon to change the date range. Check the corresponding box on the “Hide” column if you do not want a certain reading to be displayed in the graphs. NOTE: “Hide” is available only for the [Blood Pressure and Pulse] trend graph. B. View monthly data list Click the number of the month (1 = January, 2 = February, etc) on the bottom of the Yearly graph to view the data list for that month. Click the [Close] button at the bottom of the screen to close the data list. 15 Blood Pressure Data Management Screen C. View daily data list Click the date on the bottom of the Monthly or Weekly graph to view the data list for that day. In the Comment field, enter any information which you would like stored with the date shown, then click [Save] and [Close]. A circle appears in the Comment field under the date in which a comment was entered. 16 Blood Pressure Data Management Screen Enter data manually Click the [View/Enter Data] icon on the Weekly Blood Pressure and Pulse graph. Enter your blood pressure and pulse readings at the bottom of the data list in the yellow area. Check the box to enter an Irregular Heartbeat. Click [Save] and [Close] to save the data. Manually entered data is shaded pink in the data list. Data downloaded from the blood pressure monitor is shaded blue or white in the data list. There is no distinction between blue and white shaded data; the two shade colors are used to simply make the data list easier to read. To delete a row of manually entered data, leave all the columns blank, then click [Save] and [Close]. NOTES: • The data downloaded from the blood pressure monitor cannot be deleted, but it can be hidden. • You will still be able to enter the data manually regardless of the period displayed in the graph. 17 Walking Data Management Screen The Walking Data Management Screen consists of the following major areas. Menu Area Data Display Area Menu Area Transfer the data from the step counter to the PC 1. Connect the USB cable from the Omron step counter to the PC. Click the [Download Data] icon. NOTE: The date shown by the software is determined by your PC. If you transfer the data at midnight, data may be stored as a different date. (e.g. 11:59 PM on the step counter and 12:00 AM the next day on the PC). To avoid this situation, it is recommended not to transfer the data at midnight, and to ensure the times on your PC and your Omron step counter are set correctly. 2. The Confirm dialog box appears. Click [Yes] to import the data. NOTES: • If you connect a different step counter from the last time you transferred the data, this screen shows up to confirm you still want to import and save the data. • Data cannot be changed once it has been transferred. 3. Start importing data. Click [Cancel] if you want to cancel. 4. The dialog box appears when complete. Click [OK]. NOTE: Do not turn the PC off or unplug the USB cable while the data is being transferred. Print the screen Click the [Print] icon, then set up to print according to your needs. 18 Walking Data Management Screen Set the daily goal Click the [Options] icon, then enter the numbers as instructed. The goal and achievement levels are displayed on the graph screen. appears when the achievement level is between 0 and 75%. appears when the achievement level is between 76 and 99%. appears when the achievement level is 100% or higher. ∞ appears instead of percentage when the achievement level exceeds 1000%. Click [OK] to set. Set the startup screen Click the [Options] icon, then select the [Display Options – Startup] tab. Check the view and graph to be displayed at startup. Click [OK] to set. Set the starting date on Weekly graph Click the [Options] icon then select the [Display Options – Weekly Graph] tab. Check the starting date for the Weekly Graph. Click [OK] to set. 19 Walking Data Management Screen Create CSV file CSV files can be used to bring data into other programs, such as EXCEL. 1. Click the [Create CSV File] icon. 2. Enter the date range and select the destination folder and change the file name if necessary. 3. Click [Create CSV File] to save the file to the destination folder. NOTE: This CSV file is not available for importing CSV data (Refer to Page 26). Create PDF file PDF files can be used to email and/or print data. 1. Click the [Create PDF File] icon. 2. Enter the date range and select the destination folder and change the file name if necessary. 3. Click [Create PDF File] to create the PDF file. NOTE: Hourly steps, hourly event and step counter usage (Refer to page 22) data is not exported to the PDF file. Exit the screen A. Click [Change Screens] icon and select the screen you wish to view. B. Click [X] at the upper right of the screen. This returns you to the User Management screen. 20 Walking Data Management Screen Data Display Area Date range selection [Daily]: [Weekly]: [Monthly]: [Yearly]: [Total]: NOTE: Displays daily graph with hourly steps Displays weekly graph with daily walking record Displays monthly graph with daily walking record Displays yearly data with monthly walking record Displays the total walking record and “Top 5” one-day total steps walked You can change the date range if you click the date or month on the bottom of the graph. For example: Click the month on the bottom of the yearly graph → Monthly graph appears Click the date on the bottom of the monthly graph → Weekly graph appears Click the date on the bottom of the weekly graph → Daily graph appears [Previous]: Displays the previous week/month/year data [Next]: Displays the next week/month/year data [Most Recent]: Displays the most recent week/month/year data Graph selection [Steps Graph]: [Aerobic Walking Time Graph]: [Calories Graph]: [Distance Graph]: [Fat Burned Graph]: NOTE: Displays total steps and aerobic steps Displays aerobic walking time Displays calories Displays distance Displays grams of fat burned Only the Steps Graph is available on the daily graph. 21 Walking Data Management Screen Event and step counter usage The daily graph displays 1) the hour when Event button on step counter was pressed, and 2) the hour when step counter was used. The hour when Event button was pressed The hour when step counter was used NOTE: If the step counter senses any movement during the hour, it records it as being in use even if no steps were taken. View walking data A. View monthly data Click the bar graph of the month on the yearly graph. B. View daily data Click the bar graph of the date on the monthly or weekly graph. C. View hourly data Click the bar graph of the hour on the daily graph. NOTE: Only steps and aerobic steps are available for hourly data. 22 Combination Data Management Screen The Walking Data Management Screen allows you to view blood pressure and walking data and graphs at the same time. This screen consists of the following major areas. Menu Area Data Display Area Menu Area Print the screen Click the [Print] icon, then set up to print according to your needs. Create CSV file You can export the date, systolic value, diastolic value, pulse, total steps and aerobic steps into a CSV file. CSV files can be used to bring data into other programs, such as EXCEL. 1. Click the [Create CSV File] icon. 2. Enter the date range and select the destination folder and change the file name if necessary. 3. Click [Create CSV File] to save the file to the destination folder. NOTES: • This CSV file is not available for importing CSV data (Refer to Page 26). • Hourly steps, hourly event and step counter usage (Refer to page 22) data is not exported to the CSV file. Create PDF file You can export the date, systolic value, diastolic value, pulse, total steps and aerobic steps into a PDF file. PDF files can be used to email and/or print data. 1. Click the [Create PDF File] icon. 2. Enter the date range and select the destination folder and change the file name if necessary. 3. Click [Create PDF File] to create the PDF file. NOTE: Hourly steps, hourly event and step counter usage (Refer to page 22) data is not exported to the PDF file. 23 Combination Data Management Screen Exit the screen A. Click the [Change Screens] icon and select the screen you wish to view. B. Click [X] at the upper right of the screen. This returns you to the User Management screen. 24 Combination Data Management Screen Data Display Area Date range selection [Weekly]: [Monthly]: [Yearly]: Displays weekly graph with daily blood pressure/pulse readings and walking record Displays monthly graph with daily blood pressure/pulse readings and walking record Displays yearly graph with monthly blood pressure/pulse readings and walking record [Previous]: Displays the previous week/month/year data [Next]: Displays the next week/month/year data [Most Recent]: Displays the most recent week/month/year data Walking graph selection [Steps/Aerobic Steps Graph]: [Aerobic Walking Time Graph]: [Calories Graph]: [Distance Graph]: [Fat Burned Graph]: Displays total steps and aerobic steps Displays aerobic walking time Displays calories Displays distance Displays grams of fat burned Time range selection [Total]: [Morning]: [Daytime]: [Evening]: [Average]: Displays all of the data stored Displays the blood pressure and pulse readings recorded between 4:00 AM-9:59 AM Displays the blood pressure and pulse readings recorded between 10:00 AM-6:59 PM Displays the blood pressure and pulse readings recorded between 7:00 PM-3:59 AM Displays the average data for all readings 25 Transferring/Merging User Data A. Import CSV data Single or multiple user data from one PC can be transferred to another PC. 1. Go to the User Management screen. 2. Click on the user name(s) for whom you want to transfer data then click the [Create CSV File] icon. NOTE: To select multiple users click the desired users while pressing the Ctrl key or the Shift key. 3. Click either [Blood Pressure Data] or [Step Counter Data]. Repeat steps 2. through 5. if you need to transfer both blood pressure and step counter data. 4. Select the destination folder and change the file name if necessary. If transferring both blood pressure and step counter data, use different file names. 5. Click [Create CSV File] to save the file to the destination folder. NOTE: CSV file is not created when there is no data. 6. Install the Omron Health Management Software in a second PC and move the CSV files to that PC. 7. Launch the Omron Health Management Software on the second PC. 8. From the User Management screen, click the [File] tab then select [CSV Import]. 26 Transferring/Merging User Data 9. Select the CSV file for blood pressure data then click [Open]. If you do not need to import blood pressure data, click [Cancel]. NOTE: Select only the CSV file created by steps 1. through 5. 10. Select the CSV file for step counter data then click [Open]. If you do not need to import step counter data, click [Cancel]. NOTE: Select only the CSV file created by steps 1. through 5. 11. First the blood pressure data will be imported, followed by the step counter data. Click [Cancel] if you want to cancel. 12. This dialog box appears when data transfer is complete. Click [OK]. NOTE: Single or multiple user data from different PCs can be combined into one file for use on one PC by repeating steps 1. through 12. for each PC containing user data. Because all data is controlled by user name, duplicate user names can not be transferred into the same PC without losing the data from one or the other user name. 27 Transferring/Merging User Data B. Transferring the Microsoft Access database file Omron Health Management Software stores blood pressure and step counter data in one Microsoft Access database file named omron.mdb. This file is stored inside the [System] folder where the software was installed. This file can be transferred to another PC, however it will entirely replace the file on the receiving PC. NOTE: If you want to merge user data from multiple PCs into one PC, follow procedure A. Import CSV data. 1. Open the [System] folder inside the folder in which you installed the Omron Health Management Software. 2. Copy and paste the [omron.mdb] Microsoft Access database file to a CD or other storage device. 3. Install the Omron Health Management Software on the other PC. 4. Copy and paste the [omron.mdb] Microsoft Access database file from the storage device to the [System] folder located in the folder where you installed the Omron Health Management Software on the other PC. 28 Uninstalling the Software 1. 2. 3. 4. Select [All programs] or [Programs] from [Start] on the PC. Click [Omron Health Management Software]. Select [Uninstall Omron Health Management Software]. Follow the directions on the message boxes. NOTES: • When the software is uninstalled, all user data will be deleted. • When you update the software, follow the direction for updated software installation. • When the Operating System is Windows Vista or Windows 7 and the installation folder is [C:\Program Files\ OmronHealthcare\Omron Health Management Software], all data will not be deleted with the uninstallation. Please delete following folder to delete all. C:\Users\User_name\AppData\Local\VirtualStore\Program Files\OmronHealthcare\ Omron Health Management Software (Underlined part is Windows login name.) 29 Manufacturer OMRON HEALTHCARE Co., Ltd. 53, Kunotsubo, Terado-cho, Muko, Kyoto, 617-0002 JAPAN EU-representative OMRON HEALTHCARE EUROPE B.V. Kruisweg 577, 2132 NA Hoofddorp, THE NETHERLANDS www.omron-healthcare.com OMRON HEALTHCARE UK LIMITED Opal Drive, Fox Milne Milton Keynes, MK15 0DG U.K. Subsidiary OMRON MEDIZINTECHNIK HANDELSGESELLSCHAFT mbH John-Deere-Str. 81a 68163 Mannheim, GERMANY www.omron-medizintechnik.de OMRON Santé France SAS 14, rue de Lisbonne 93561 Rosny-sous-Bois Cedex, FRANCE