1
1 Preface
1.1 Brief description of the SM2 monitoring system
The SM2 monitoring system provides the user with statistics on the performance of the DP
system and on resource utilization.
It consists of the following components:
●
the SM2 monitoring program
●
the SM2U1 utility routine
●
the SM2R1 analysis routine
The SM2 monitoring program collects statistical data and outputs it either to a terminal and/
or to a file. The first option is ideally suited for real-time (online) monitoring. If the data is
output to file, the stored data can be analyzed (offline) at a later time.
The SM2U1 utility routine manages the SM2 output files and is occasionally used as a file
conversion leader for the SM2R1 analysis routine.
The SM2R1 utility routine manages the statistical data registered by SM2 and written to a
system-global SM2 output file.
The following products are also available and can be used to edit and display SM2
monitored data:
●
The SM2R1-PC analysis routine is used to graphically display the monitored data on a
PC.
●
The SM2ONLINE-PC monitoring program is used to simultaneously monitor and
display monitored data from several BS2000/OSD computers on a PC.
●
The SM2-PA analysis routine is used for user-specific SM2 output files.
U3585-J-Z125-8-76
1
Summary of contents
Preface
1.2 Target group
This manual is intended for system users who need information on the current system
workload. It will be of particular interest to computer center and systems support staff who
wish to assess the performance of their configuration and isolate bottleneck areas by
means of long-term monitoring.
1.3 Summary of contents
This is Volume 1 of a set of two manuals and describes the SM2 monitoring program.
Volume 2 describes the SM2U1 conversion routine and the SM2R1 analysis routine, and
gives an overview of the other analysis routines. These routines allow you to carry out
performance analyses in BS2000.
Volume 1: "Administration and Operation"
Chapter 1, Preface,
specifies the target group of the manual and provides pointers on how to use it.
Chapter 2, The SM2 monitoring program,
describes the monitoring program and gives a overview of the terminology used. This
chapter provides an introduction to system monitoring and optimization, and provides
suggestions on how to carry out performance monitoring with SM2.
Chapter 3, SM2 monitoring programs,
describes the SM2 monitoring programs and measurement data.
Chapter 4, SM2 operation,
describes SM2 operation and statements for real-time and background monitoring. The
statements are presented in two sections: an administration section and an evaluation
section. The first section describes the statements for the SM2 administrator for
controlling the monitoring process and outputting the monitored data to the SM2 output
file. The second section describes the statements available to nonprivileged SM2 users
for selecting and controlling reports.
Chapter 5, SM2 screen outputs,
describes the individual output forms (SM2 reports) for monitored data and the SM2
information screens.
Chapter 6, Notes on SM2 operation,
contains important information to be taken into account when using the monitoring
system.
2
U3585-J-Z125-8-76
Preface
Summary of contents
Chapter 7, Variables reports,
contains a table detailing variables and report groups.
Chapter 8, Messages,
lists all the program messages, together with an explanation and the action to be taken
in each case.
Chapter 9, Installation,
describes how to install SM2.
Chapter 10, Appendix,
contains descriptions of the SDF syntax and overviews of the SM2 statements.
At the back of the manual, you will find a glossary, lists of abbreviations, figures and tables,
and related publications, and an index.
Volume 2: "Analysis and Display of SM2 Monitored Data"
Chapter 1, Preface,
specifies the target group of the manual and provides pointers on how to use it.
Chapter 2, SM2U1 utility routine,
describes the functions and operation of the SM2U1 conversion routine.
Chapter 3, SM2R1 analysis routine,
describes the functions and operation of the SM2R1 analysis routine and the records
of the SM2R1 transfer file.
Chapter 4, Other analysis routines,
provides a short description of other analysis routines for SM2 monitored data which
may be ordered.
Chapter 5, Variables reports,
contains tables detailing variables, report groups, report names and reports on
monitored variables (with information on the variables in question).
Chapter 6, SM2 program interfaces,
presents the C interfaces SM2GMS and SM2GDAT and the assembly language
interface PFMON.
Chapter 7, Appendix,
contains descriptions of the SDF syntax and the data structures for C.
At the back of the manual, you will find a glossary, lists of abbreviations, figures and tables,
and related publications, and an index.
U3585-J-Z125-8-76
3
Changes made since the last version
Preface
1.4 Changes made since the last version of the manual
SM2 Version 13.0A (June 1999) incorporates the following major changes as compared to
the previous version (V12.0A, December 1996):
SM2
●
●
4
New monitoring programs
–
BCAM-CONNECTION
This monitoring program is used to record monitored data for defined connections.
–
DISK-FILE
This monitoring program is used to record inputs and outputs for selected disks.
–
HSMS
This monitoring program is used to record monitored data on the migration and
retrieval of files.
Changes to the monitoring programs
–
CHANNEL-IO
Monitored data is also output in the CHANNEL report and at the SM2GDAT
interface.
–
DISK
The number of possible devices has been increased to 256.
–
FILE
File-specific access times are also output.
–
PFA
Monitored data from SYMMETRIX controllers that do not comply with the PFA
concept is also recorded.
–
SERVICETIME
The number of possible devices has been increased to 256.
–
TASK
The number of devices that can be monitored has been increased to 64.
U3585-J-Z125-8-76
Preface
Changes made since the last version
●
New reports
–
BCAM CONNECTION
Outputs information on data that has been received/sent and on bucket-specific
times.
–
DISK FILE
Outputs files showing the inputs and outputs per second for the monitored disk
devices.
–
SYMMETRIX CONTROLLER
Outputs monitored data on the use of SYMMETRIX controllers.
–
SYMMETRIX DEVICE
Outputs monitored data on the use of the individual devices of a SYMMETRIX
controller.
●
Modified report output for the CHANNEL, DAB, DAB CACHE, FILE, GS, ISAM, PFA
CONTROLLER and VM2000 reports
●
New administrator statements
●
U3585-J-Z125-8-76
–
ADD-BCAM-CONNECTION-SET
Specifies the connection set for the new BCAM-CONNECTION monitoring
program.
–
REMOVE-BCAM-CONNECTION-SET
Specifies the connection set to be excluded from the monitoring process for the new
BCAM-CONNECTION monitoring program.
–
SET-BCAM-CONNECTION-PARAMETER
Specifies the global monitoring parameters for the BCAM-CONNECTION
monitoring program.
–
SET-DISK-FILE-PARAMETER
Defines the disk devices which are to be monitored by the new DISK-FILE
monitoring program.
Modified and enhanced administrator statements
–
SET-CHANNEL-IO-PARAMETER
Three-digit hexadecimal numbers can be specified for the CHANNELS operand.
–
SET-DISK-PARAMETER
The DEVICES operand has been extended to accept 256 device names.
5
Changes made since the last version
●
6
Preface
–
SET/MODIFY-COSMOS-PARAMETER
The new MEASUREMENT-TIME operand can be used to specify the duration of the
monitoring process.
In the TSN operand, up to 16 TSNs can be specified.
In the TSN, USER-ID, JOB-NAME and CATEGORY operands, the last character
may be an asterisk (*).
–
SET-SERVICETIME-PARAMETER
The DEVICES operand has been extended to accept 256 device names.
–
SET-TASK-PARAMETER
The DEVICES operand has been extended to accept 64 device names.
–
SHOW-ACTIVE/DEFINED-PARAMETER
The TYPE operand has been extended to include the new monitoring programs
BCAM-CONNECTION and DISK-FILE.
–
START/STOP/CHANGE-MEASUREMENT-PROGRAM
The TYPE operand has been extended to include the new monitoring programs
BCAM-CONNECTION, DISK-FILE and HSMS.
New, enhanced and obsolete user statements
–
The SELECT-SYMMETRIX-CONTROLLER user statement (select the
SYMMETRIX controller for the SYMMETRIX-DEVICE report) has been included in
the manual for the first time.
–
The REPORT user statement has been extended to include the values BCAM,
DISK_FILE (DFILE) and SYMMETRIX (SYM).
–
The CHANNEL user statement is now obsolete, since the CHANNEL report can
now output follow-up screens.
●
SM2 program interface
In the SM2GDAT macro, the variable ’unsigned long buffer_flags’ is now incompatible.
The BCAM-CONNCETION, CHANNEL-IO, DISK-FILE and HSMS data buffers are now
available.
●
Changes to the SM2 output file
In SM2 output files with freely selectable file characteristics, the block length must be
16.
●
Dynamic IO reconfiguration
SM2 recognizes a dynamic IO reconfiguration and, if necessary, automatically changes
the number of objects being monitored. This is described in a new section in chapter 2.
●
The constraints on SR2000 have been incorporated. For further information, please
refer to section 5.8 of the manual "OSD-SVP V2.0 User Interfaces on Systems with
RISC Architecture" [20].
U3585-J-Z125-8-76
Preface
Notational conventions
SM2U1
●
Extended statement: SELECT-MEASUREMENT-GROUPS
The statement has been extended to include
– the new monitoring programs BCAM-CONNECTION, DISK-FILE and HSMS
– the new report groups SYMMETRIX-CONTROLLER and SYMMETRIX-DEVICE.
SM2R1
●
New statement: PRINT-HSMS-STATISTICS
Data from the HSMS monitoring program is displayed in the form of tables.
●
Enhanced statement: PRINT-REPORTS
The statement has been extended to include the report groups BCAM-CONNECTION,
SYMMETRIX-CONTROLLER and SYMMETRIX-DEVICE.
The report groups CPU, DAB, DEVICE and FILE have been extended.
The operand REPORT-LIST=CHANNEL has been modified to take account of the
maximum channel number of 511.
●
Extended statement: PRINT-DISK-STATISTICS
The DEVICES operand has been extended to accept 256 device names.
●
Modified statement: PRINT-TASK-STATISTICS
The output has been modified to include a software and hardware operating time.
●
The calculation of average values has been modified.
Manual structure
The manual has been divided into two volumes. The individual chapters have been revised
and some sections reformatted. All screens have been replaced.
1.5 Notational conventions
All statements for controlling monitoring operations (SM2 administration statements) and
the statement interfaces of the SM2U1 and SM2R1 utilities are fully supported by the SDF
statement syntax. ISP statements are no longer available.
The SM2 functions for selecting and controlling screen output can only be addressed via
ISP.
For a description of the SDF syntax, see the appendix.
U3585-J-Z125-8-76
7
README file
Preface
1.6 README file
Information on any functional changes and additions to the current version of the product
described in this manual can be found in the product-specific README file. You will find the
README file on your BS2000 system under the file name SYSRME.SM2.130.E.
Ask your systems support staff for the user ID under which the README file is located. You
can view the README file by using the /SHOW-FILE command or an editor, and you can
print it out on a standard printer by means of the following command:
/PRINT-DOCUMENT SYSRME.SM2.130.E, LINE-SPACING=*BY-EBCDIC-CONTROL
8
U3585-J-Z125-8-76
2 The SM2 monitoring program
2.1 Overview
SM2 is a shareable program that runs under BS2000. It provides the user with information
on the status and performance of the system, making it possible to improve the performance of both the system and its applications. The mode and scope of monitored data
acquisition in SM2 can be controlled using commands and statements.
SM2 generates a number of system tasks which are responsible for collecting data and
writing it to the SM2 output files.
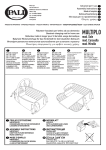
SM2 consists of privileged and nonprivileged components. Figure 1 shows the exchange of
information between the various SM2 tasks.
U3585-J-Z125-8-76
9
Overview
SM2 monitoring program
SM2
administrator
SM2
user
SM2
user
Monitored
task
...
BS2000
system kernel
SM2
monitoring
task
SM2
buffer
Key:
SM2
global write
task
SM2
user write
task
Flow of
monitored data
Communication for
controlling monitoring
operations
Boundary between
privileged and
nonprivileged
program sections
SM2
file
User
output file
Privileged
SM2 code
Nonprivileged
SM2 code
Figure 1: SM2 configuration
10
U3585-J-Z125-8-76
SM2 monitoring program
Operating modes/users
2.2 SM2 operating modes
SM2 offers three operating modes:
1. Real-time monitoring (information output to a data display terminal)
2. Background monitoring (information output to a file for subsequent analysis)
3. User-specific task monitoring
The operating modes can be used simultaneously.
When mode 1 is used, SM2 periodically outputs monitored data in the form of reports on
the data terminal. The color version of the 9752 Data Display Terminal is supported. This
data refers to the latest monitoring cycle (e.g. 150 seconds) and can be used as snapshots
for assessing the current system status. Only selected SM2 monitored data is output in this
mode.
When mode 2 is used, the collected data is output in the form records to a file, the SM2
output file. This data can be analyzed later using SM2 products. This mode allows for
selective use of the SM2 operands and is equally suitable for long-term monitoring with a
low system load and for brief special-purpose monitoring with a correspondingly higher
system load.
When mode 3 is used, the nonprivileged user (using the START-TASK-MEASUREMENT
command) can register tasks under his/her own ID for monitoring by SM2. In addition to the
task-specific monitored data, a command counter and SVC task statistics can be
requested. In the case of user-specific task monitoring, all information is written to userspecific SM2 output files.
U3585-J-Z125-8-76
11
Operating modes/users
SM2 monitoring program
2.3 Users
Privileged users
Privileged SM2 users are users who have been assigned the system privilege
SW-MONITOR-ADMINISTRATION. These fall into the following categories: "primary"
administrators, "secondary" administrators and other privileged users.
Entry of an administration statement gives the first privileged SM2 user the status of SM2
primary administrator. This user retains this status until he/she terminates his/her program
or switches over to online analysis using the CALL-EVALUATION-PART statement. The
SM2 primary administrator has all privileges, and there can only be one primary administrator at any one time.
The primary administrator is the only person who is authorized to admit other (secondary)
administrators (MODIFY-ADMINISTRATOR-ADMISSION statement) and to permit nonprivileged users to run monitoring programs (MODIFY-USER-ADMISSION).
With the exception of the MODIFY-ADMISSION statements, the secondary administrators
have the same rights as the primary administrator.
All administrators can:
–
–
–
create and close the SM2 output file
set monitoring parameters
activate or deactivate optional monitoring runs.
In addition to these privileges, the SM2 administrators can also use all statements of a
nonprivileged user. All other privileged users are only offered the SHOW functions and the
SELECT-HOSTS statement in the administration section.
Notes
SM2 cannot prevent the various administrators from carrying out operations which
contflict with one another. It is only possible to make sensible use of the system if the
different administrators agree on a common course of action.
Modification of the variables to be monitored and functions which can be added may
influence the real-time monitoring of other SM2 users. Modification of the monitoring
cycle applies to all SM2 users.
Nonprivileged users
All users who call the SM2 routine from a user ID without the system privilege
SW-MONITOR-ADMINISTRATION are categorized as nonprivileged users. These users
are only authorized to use the statements for controlling output during real-time monitoring.
12
U3585-J-Z125-8-76
SM2 monitoring program
Authorization table
2.4 Table of authorizations
The following table indicates which users are permitted to carry out which functions and
under what circumstances.
Sys. priv. SWMONADM
Function (group)
Pr. adm
Sec. adm Other
Priv. usr User
Start/stop functions
Start SM2 monitor
Terminate SM2 monitor
y
5
n
5
n
5
n
5
n
5
y
y
y
y
y
y
y
y
n
n
y
y
y
7
n
7
n
n
n
n
n
n
n
n
n
n
n
n
n
n
n
n
n
n
n
n
n
n
n
n
y
y
y
y
y
y
y
y
y
n
n
n
n
n
n
y
y
y
y
y
y
y
y
y
y
y
y
y
y
y
y
y
y
6
6
4
y
y
y
y
6
6
4
y
y
y
y
6
6
4
y
y
1
1
2
2
4
n
y
1
1
n
n
4
n
6
6
6
2
n
3
3
6
6
3
3
6
6
n
n
6
6
n
n
n
6
n
n
n
6
Administration functions
MODIFY-ADMINISTRATOR-ADMISSION
MODIFY-USER-ADMISSION
MODIFY-MEASUREMENT-PERIODS
OPEN-/CLOSE-LOG-FILE
ADD/REMOVE measurement object
SET/MOD measurement PARAMETER def.
INITIATE-COSMOS
START-/CHANGE-/STOP-MEASUREMENTPROGRAM
SHOW statements
CALL-EVALUATION-PART
SELECT-HOSTS
Analysis functions
OUTPUT / START
DEVICE
SELECT-DAB / -PCA / -PERIODIC-TASK / -PFA/
-UTM / -SYMMETRIX
STATUS
REPORT
RESTART
FILE
START-/CHANGE-/STOP-ISAM-STATISTICS
SHOW-USER-MEASURED-OBJECTS
CALL-ADMINISTRATION-PART
BS2000 commands
START-/STOP-TASK-MEASUREMENT
Other SM2 features
Monitor foreign files
Monitor foreign ISAM pools
Monitor foreign tasks
Monitor SVCs/PCounter
Table 1: Authorization table
U3585-J-Z125-8-76
13
Activating the monitoring task
SM2 monitoring program
Key
Pr. adm:
Primary administrator
Sec. adm:
Secondary administrator
Other:
Other privileged user
Priv. user:
Users permitted to execute a monitoring program as specified by MODIFYUSER-ADMISSION
User:
Users not permitted to execute a monitoring program
y:
Yes
n:
No
1:
Yes, but some reports are reserved for privileged users
2:
Yes if the corresponding monitoring process is permitted for the caller
3:
Yes, but only for the corresponding privileged monitoring program
4:
Yes, but only for objects registered by this user
5:
System privilege SUBSYSTEM-MANAGEMENT required; SM2 privileges
are irrelevant
6:
Yes, provided that "Priv. user" is also active
7:
Yes, except for the COSMOS monitoring program
2.5 Activating a monitoring task
When SM2 is called for the first time during a session, the SM2 monitoring task is activated.
This is an internal task which collects the monitored data, edits it, and stores it in a central
buffer. From this buffer, the data is transferred to the various SM2 user tasks or to the SM2
output file for output. If different offline and online periods are selected, the monitored data
is written to two central buffer stores.
The precise time at which the SM2 monitoring task was initiated and the online or offline
period selected is given in the SM2 MEASUREMENT STATUS under SM2 GATHERING
TASK CREATED AT, ONLINE PERIOD, OFFLINE PERIOD.
14
U3585-J-Z125-8-76
SM2 monitoring program
Acquisition of monitored data
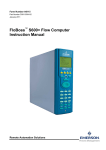
2.6 Acquisition of monitored data
SM2 records a wide range of monitored data and outputs it to either a screen and/or a file.
The data is collected at regular intervals, called monitoring cycles. Some of the monitoring
tasks are carried out by default, while others are carried out by special monitoring programs
which can be activated as and when required.
The monitored data is then processed and displayed internally by SM2 or by independent
SM2 monitoring and analysis routines.
There are three methods of collecting data:
●
Based on the monitoring cycle
Most of the monitored data (e.g. the CPU load) is collected at the end of each
monitoring cycle. The current count (or time stamp) is taken from the SM2 or system
tables, and the difference between this value and the value at the end of the last
monitoring cycle is calculated.
The same procedure is used to calculate the intermediate values for the methods
described below at the end of the monitoring cycle (except for the monitoring programs
DISK and TASK).
A monitoring cycle can be set to between 10 seconds and 1 hour.
●
Based on the sampling cycle
Because the status is constantly changing, it may not be appropriate to wait until the
end of the monitoring cycle to query some monitored data (e.g. device utilization). When
acquiring this type of monitored data, it is recommended that the monitoring cycle be
broken down into several sampling cycles. At the end of each sampling cycle, the
current monitored variable is obtained. Then, at the end of each monitoring cycle, the
mean value across all sampling cycles is computed.
A sampling cycle can be set between 200 milliseconds and 10 seconds.
●
Event-driven
Some monitored data (e.g. the distribution of disk operation times) is determined by
monitoring events within the system. When an event occurs, such as the start of an
input/output operation, an SM2 routine is activated which collects the event-specific
data. This data is then used to calculate the monitored variables.
U3585-J-Z125-8-76
15
Acquisition of monitored data
SM2 monitoring program
Analysis routine
SM2R1
SM2R1-PC
Output
buffer
SM2
in BS2000
SM2 data
buffer
Monitoring programs Tables Counter
SM2
file
I/O
buffer
BS2000 monitored object, event
Figure 2: Collecting monitored data
16
U3585-J-Z125-8-76
SM2 monitoring program
Monitoring cycle
2.7 Monitoring cycle
As mentioned above, SM2 collects data at regular intervals known as monitoring cycles
(except for the monitoring programs DISK and TASK). At the end of each monitoring cycle,
the processed data is written to the data buffer and to the SM2 output file, if one is available.
The length of the monitoring cycle is preset at 150 seconds when the subsystem is started.
The SM2 administrator can change this setting using the OFFLINE-PERIOD operand of the
MODIFY-MEASUREMENT-PERIODS statement. The value is entered under OFFLINE
PERIOD in SM2 MEASUREMENT STATUS .
Online monitoring cycle
The online cycle also defines a monitoring cycle in which the monitored data for online
analysis is collected and written to another buffer. The online cycle is deactivated by default.
It can be modified using the ONLINE-PERIOD parameter in the MODIFY-MEASUREMENTPERIODS statement. When the online cycle is deactivated, the ONLINE-PERIOD corresponds to the OFFLINE-PERIOD. The CYCLE column in each report shows the online
value currently set. In addition, the value under the ONLINE-PERIOD column is entered in
SM2 MEASUREMENT STATUS.
The online cycle should only be activated if the delay at the terminal is too great when
carrying out online monitoring. This may happen if a long monitoring cycle is set for output
to an SM2 output file. Please note that by activating the online cycle, you also increase the
workload on the system.
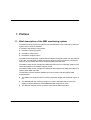
Sampling cycle
For monitored-data acquisition based on random sampling, SM2 subdivides the monitoring
cycle into a large number of small, regular time slots called sampling cycles. The monitoring
task is activated at the specified interval for data collection. At the end of each sampling
cycle, snapshots are taken for some variables. From the large number of snapshots, a mean
value is computed for each monitoring cycle.
The accuracy of the computed value thus depends on the length of the sampling cycle:
The shorter the sampling cycle, the greater the number of snapshots that can be taken
during the monitoring cycle. The SM2 workload on the system, however, increases simultaneously.
The sampling cycle is preset to 800 milliseconds when the subsystem is started.
The SM2 administrator can change this value in the SAMPLING-PERIOD operand of the
MODIFY-MEASUREMENT-PERIODS statement. The SAMPLING PERIOD column in the
SM2 MEASUREMENT STATUS indicates the current setting, while the SAMPLES column
in the individual reports contains the number of samples taken during the latest monitoring
cycle.
U3585-J-Z125-8-76
17
Outputting and saving monitored data
SM2 monitoring program
Monitoring cycle
Sampling cycle
val1
val2
val3
val4
..... valn
To obtain data, SM2 counts and
system counts are evaluated.
Mean values are computed,
percentage frequencies are
determined, and total values are
calculated in order to arrive at
monitored data.
1 n
value = --- ∑ val j
n 1
Figure 3: Relationship between the sampling cycle and the monitoring cycle
2.8 Outputting and saving monitored data
At the end of a monitoring cycle, the monitored data is summarized into groups which have
similar content, extended by the SM2 monitoring task to include additional information (time
stamp, host, ...), and then written to a central SM2 data buffer.
If a user has activated online monitoring, the monitored data is transferred from the central
data buffer to the buffer of the user task. Note that sensitive data is transferred to privileged
users only. The monitored data is then processed and output in the address space of the
user task.
For background monitoring, the SM2 administrator can open an SM2 output file. At the end
of a monitoring cycle, the monitored data is grouped into data records and written to the
SM2 output file. The information in the SM2 output file can be used for subsequent problem
and trend analyses. Special analysis routines are provided for this purpose.
18
U3585-J-Z125-8-76
SM2 monitoring program
Outputting and saving monitored data
Methods used for compressed output of monitored data
1. Mean values
SM2 adds up the sampled values at the end of each sampling cycle and computes a
mean value for each monitoring cycle (e.g. the number of tasks) as follows:
Average =
Sum of sampled values
LR2LR2LR2LR2LR2LR2LR2LR2LR2LR2LR2LR2LR2LR2LR2LR2LR2LR2LR2LR2LR2LR2LR2LR2LR2LR2
Number of samples
2. Percentage frequency
At the end of each sampling cycle, SM2 records the occurrence of specific events or
conditions and computes the percentage frequency of events (conditions) in relation to
the total number of samples (e.g. channel utilization) as follows:
Frequency =
Sum of occurrences
LR2LR2LR2LR2LR2LR2LR2LR2LR2LR2LR2LR2LR2LR2LR2LR2LR2LR2LR2LR2LR2LR2LR2LR2LR2
Number of samples
*100 %
3. Ascending system counters and SM2 counters
The activity during the monitoring cycle can be determined by calculating the
differences between values gathered at the beginning and the end of the monitoring
cycle (e.g. idle time).
4. Computation
SM2 computes some data from monitored data, e.g. the summation values for all
categories.
Uninterruptible clock resetting
SM2 works internally with UTC time. During the switch from daylight saving time to winter
time and vice versa, SM2 can continue to work without interruption.
U3585-J-Z125-8-76
19
SM2 monitored variables
SM2 monitoring program
2.9 SM2 monitored variables
The table below shows the main monitored variables of SM2.
A table showing the links between the monitored variables and monitoring programs,
ONLINE reports, and SM2R1 report groups can be found in chapter “Variables reports” on
page 361.
Monitored variable
Description
Cache
Access statistics and hit rates for
DAB caches
Number of read/write accesses to DAB cache areas per second
and the percentage frequency of read/write accesses to DAB
subareas without disk access.
Access statistics for ISAM pools
Number of ISAM accesses per second to pages in the ISAM
pool and directly to disk, as well as the number of ISAM
accesses with a delay per second.
Size of the ISAM pool, reserved pages and fixed pages in PAM
pages.
Access statistics and hit rates for
hiperfiles (PFA)
Number of read/write accesses to PCA or DAB cache areas per
second, and their percentage share of the total number of read/
write accesses.
Number of failed attempts to use the cache per second.
Access statistics and hit rates for
SYMMETRIX controllers
Number of read/write accesses to SYMMETRIX controllers and
devices.
Proportion of read/write accesses handled successfully by the
cache.
Access statistics and hit rates for
controllers with cache (PCA)
Number of read/write accesses and their percentage share of
the total number of read/write accesses for PCA controllers,
cache areas, and devices.
CPU
CPU utilization
Time during which the processor is in one of the following
statuses: TU, TPR, SIH, IDLE or STOP.
In SR2000 systems, /390 time will also be output.
Number of system calls
Number of SVC calls in TU/TPR per second, and the sum of all
SVC calls per second.
Files
Catalog access statistics
Number of read/write accesses to catalog entries/JV entries of
files per second, as well as average access times in milliseconds.
Table 2: SM2 monitored variables
20
U3585-J-Z125-8-76
SM2 monitoring program
Monitored variable
SM2 monitored variables
Description
Files (continued)
File access statistics
Number of PAM-WAIT, PAM-CHECK-READ, PAM-WRITE
operations and input/output operations per second for one file.
Distribution of input/output operations to files for selected disks.
File access times
Average access time in milliseconds for each input/output.
IOs
Number of input/output operations Number of input/output operations per second.
Number of paging input/output
operations
Channel utilization and channel
transmission rates
Number of input/output operations or transferred PAM blocks
per channel.
Device utilization and transmission Device utilization in % without/because of paging activities.
rates
Length of device queues
Number of input/output requests addressed to a device.
Duration of input/output operations Hardware operating time between SDV command and channel
interruption for input/output operations of a specific device,
measured in milliseconds.
Access distribution to cylinders/
PAM blocks of disks
Cylinder number/PAM block addressed for input/output
operation.
Number of input/output operations Number of input/output operations per second.
Communication
Response times
Average time in seconds between the receipt of a message on
the system and the sending of a response to the application.
Transaction times
Average time in seconds between input and the last output.
Thinking time
Time between an output and the resulting subsequent input.
Wait time
Average wait time for incoming messages before being
processed by the application.
Transaction rate
Number of transactions per second.
Length of transaction message
Average length in bytes of input/output messages for selected
connection sets.
Number of input/output operations Number of read/write accesses per second, and the number of
of network devices
bytes transferred.
Network transmission rate
Transmission rate for all TCP/IP connections; data transfer
information for specific connections.
Table 2: SM2 monitored variables
U3585-J-Z125-8-76
21
SM2 monitored variables
Monitored variable
SM2 monitoring program
Description
Memory
Main memory utilization
Number of 4-KB pages in main memory.
Utilization of paging area
Number of pageable 4-KB pages on the devices.
Utilization of virtual address space Number of class 1 through class 4 pages in the virtual address
space.
Page fault rate
Number of page fault interrupts per second.
Access statistics for global storage Number of read/write accesses to global storage per second
and the number of bytes transferred per second.
Subsystem
PCS data
Service rate of the affected categories in %, job delays and
SERVICE RATEs per second.
UTM response times and
transaction rates
Number of dialog and asynchronous transactions per second
and the average time in seconds taken for the transaction.
Number and duration of send jobs Number of send jobs per second, as well as average total and
via MSCF
wait times.
POSIX data
File accesses, message accesses, semaphore activities, buffer
utilization and all types of system accesses per second.
Lock requests to the DLM
Number of enqueue, convert, dequeue and information lock
requests per second, as well as the number of lock allocations
and releases per second.
Data on synchronization functions
in HIPLEX (NSM)
HSMS data
Data on the migration of files to the background level and the
retrieval of files to the processing level.
Task
Number of tasks
Number of BATCH, DIALOG, TP and system tasks.
Length of task queues
Number of tasks in a category.
Dwell times in task queues
Dwell times in task queues per category.
Frequency of task activation and
deactivation
Task-specific utilization of
resources
Service units per second, percentage CPU utilization,
input/output operations per second, used pages in 4-KB pages,
paging read per second.
Utilization and queues for task
locks
Percentage utilization of a task lock and the number of tasks in
the task lock queue.
Table 2: SM2 monitored variables
22
U3585-J-Z125-8-76
SM2 monitoring program
Monitored variable
SM2 monitored variables
Description
VM2000
Hypervisor activities
Percentage active and idle times of the system.
Guest system activities
Planned and measured CPU utilization as a percentage.
Table 2: SM2 monitored variables
U3585-J-Z125-8-76
23
Analyzing monitored data
SM2 monitoring program
2.10 Analyzing monitored data
There are several tools on various different platforms which can be used to process and
display monitored data.
SM2-ONLINE (BS2000/OSD)
SM2-ONLINE is a component of the SM2 monitoring program. At the end of each
monitoring cycle, it outputs monitored data in the form of reports. For further information,
please refer to chapter “SM2 screen output” on page 201ff.
SM2R1 (BS2000/OSD)
SM2R1 is a component of SM2 and analyzes the SM2 output file. SM2R1 outputs statistics
in tabular form and time series in chart form to a file which is ready to print. For further information, please refer to the chapter “SM2R1 analysis routine” in Volume 2 of the SM2
manual [21].
SM2R1-PC (Microsoft Windows)
The SM2R-PC routine can be purchased separately, and is a development of SM2R1. It
makes use of the graphical options offered by a PC when displaying monitored data. SM2
output files from various BS2000/OSD computers can be analyzed in an single analysis
run. The result data can be displayed in tabular form and can be edited graphically. Charts
can be copied into the clipboard and transferred to any Windows application that can
access the clipboard. For further information, please refer to the chapter “Additional utility
routines” in Volume 2 of the SM2 manual [21].
SM2ONLINE-PC (Microsoft Windows)
The SM2ONLINE-PC utility can be purchased separately and is used to simultaneously
display and monitor SM2 data from several BS2000/OSD computers online. The monitored
data is supplied in the form of charts which are updated at the end of every monitoring cycle.
Each monitored variable can be subjected to threshold monitoring. Alarms signalling
threshold violations can be both audible and visual. For further information, please refer to
the chapter “Additional utility routines” in Volume 2 of the SM2 manual [21].
SM2-PA (BS2000/OSD)
The SM2-PA routine can be purchased separately and is used to analyze user-specific SM2
output files from user task monitoring operations. The result data is displayed in the form of
statistics and offers information on task resource utilization and/or the performance of user
programs. For further information, please refer to the chapter “Additional utility routines” in
Volume 2 of the SM2 manual [21] and the manual “SM2-PA” [8].
24
U3585-J-Z125-8-76
SM2 monitoring program
Performance expectations of the user
2.11 Performance expectations of the user
When assessing the performance of a DP system, the user is generally interested in:
●
the time it takes for the system to respond to requests,
●
how many requests the system can handle within a given period of time, and
●
what resources are used.
The performance level of the hardware (e.g. the number of instructions processed per
second) and of the operating system (e.g. task management efficiency) are generally of
secondary interest.
Interactive mode criteria
A distinction is made between inquiry-and-transaction mode and timesharing mode:
In inquiry-and-transaction mode, the terminal users can communicate only with
programs which are specific to a given application. Normally, a large number of users
interact with a relatively small number of application programs.
In interactive (or timesharing) mode, the terminal users enter their own application
programs for interactively processing a given task. The application programs are generally
controlled by system programs for creating, testing and updating files and programs.
In both inquiry-and-transaction mode and timesharing mode, the unit of DP operation is a
transaction.
The transaction time is the delay between the arrival of the input at the host and the output
of the acknowledgment. The DP system can output several responses with different
response times for a single transaction. If resources are not released when a transaction is
completed but are reserved for the next transaction, the transaction is known as a multi-step
transaction.
U3585-J-Z125-8-76
25
Performance expectations of the user
SM2 monitoring program
The sum of single-step and multi-step transactions required for handling one application is
called an operation.
The characteristic criteria for describing performance expectations are:
●
Transaction rate
Sum of all successfully completed transactions per unit of time
●
Response time
Time required for processing by the DP system
●
Number of simultaneously active users.
The monitored values for these characteristics are determined in SM2 by the monitoring
program BCAM-CONNECTION (page 35), RESPONSETIME (page 45) and UTM
(page 53).
Batch processing criteria
In batch processing, the unit of DP processing is a job.
●
Throughput rate
Number of successfully processed jobs per unit of time
●
Dwell time
Time required for processing a job
For the individual user, a satisfactory performance (short response time, short dwell time)
is obtained if the required resources are available when they are requested. This
requirement can easily be meet if utilization of the requested resources (in particular of the
input/output devices) is kept to a minimum.
The DP system performance, on the other hand, is characterized by the transaction and
throughput rates, where maximum utilization of the resources is desirable for economic
reasons.
These contradictory performance requirements relating to resource utilization can be
fulfilled only by carefully planning the workload and the associated resource requirements.
26
U3585-J-Z125-8-76
SM2 monitoring program
System monitoring
2.12 Using SM2 for system monitoring
Depending on the mode of monitored-data acquisition (frequency, scope), we must
consider two different applications:
●
Trend monitoring (= long-term monitoring) for obtaining data for system capacity
planning
●
Bottleneck analysis for locating and eliminating performance problems
Trend monitoring
The utilization data of the following resources is required in order to carry out long-term
system capacity planning:
–
–
–
–
CPUs
channels
devices
main memory
Additional monitoring routines need not be activated.
It is advisable to use the following settings for monitoring periods:
Sampling cycle (SAMPLING-PERIOD):
Monitoring cycle (OFFLINE-PERIOD):
Analysis subinterval
1000 milliseconds
5 minutes
1 hour
The monitoring period should cover the entire period from SYSTEM READY through to
SHUTDOWN. If output of the online screen report takes too long during the session, you
can shorten the online monitoring cycle.
Monitoring times are set using the MODIFY-MEASUREMENT-PERIODS statement.
It is a good idea to create a new SM2 output file every day (OPEN-LOG-FILE / CLOSELOG-FILE statements). The SM2U1 routine can be used to combine (and split) daily SM2
output files to create one large file, known as the master SM2 output file. The daily SM2
output files must be added to the master SM2 output file in chronological order.
U3585-J-Z125-8-76
27
System monitoring
SM2 monitoring program
Bottleneck analysis
Before monitoring is started, you must clarify any performance problems, i.e. performance
expectations that are not satisfied. The following problems may exist:
●
System-oriented performance problems
These arise if the system throughput rate is unsatisfactory, and are indicated by a low
transaction rate and/or throughput rate. The most likely cause is the overloading of one
or more resources.
●
User-oriented performance problems
These occur due to long delays when handling specific load requirements.
The following monitored variables should be used to analyze bottlenecks. SM2 also allows
for more extensive analysis through addition monitoring programs.
These monitored variables and monitoring programs make it easier to locate overloaded
resources:
Monitored variable
Monitoring program
Number of tasks in the system queues and at devices
Monitored by default
Number of input/output operations per device
Monitored by default
Working set per category
Monitored by default
CPU utilization and number of input/output operations per category
SYSSTAT
Number of input/output operations and volume of data transferred per CHANNEL-IO
channel
Access to catalog entries
CMS
Number of transactions
RESPONSETIME, BCAMCONNECTION, and UTM
Table 3: Monitoring programs used to locate overloaded resources
The following settings are recommended for monitoring times (MODIFY-MEASUREMENTPERIODS statement):
Sampling cycle (SAMPLING PERIOD):
Monitoring cycle (OFFLINE-PERIOD):
Analysis subinterval:
Monitoring period:
400 milliseconds
60 seconds
1 - 5 minutes
0.5 - 5 hours
Monitoring must be carried out during peak load periods.
Due to the shorter monitoring cycle and the activated monitoring programs, bottleneck
analysis produces a large volume of data compared to trend monitoring. The volume of data
corresponds to the number of objects monitored and the number of events (DISK
monitoring program). The resulting SM2 output file may be very large.
28
U3585-J-Z125-8-76
SM2 monitoring program
Efficient DP system usage
Because of the volume of data generated, it does not make sense to copy all data record
types into the master SM2 output file. SM2U1 can be used to suppress certain data records
when updating the master SM2 output file.
To investigate delays when handling special load requirements, you will need further information in addition to the system utilization data described above. To begin with, the
monitoring program PERIODIC-TASK or TASK can be used to select a task. The DISK-FILE
monitoring program can be used for overloaded disks to determine the files accessed most
frequently. It is not possible to list general guidelines for the additional selection of
monitoring programs. For further information, please refer to the “Performance Handbook”
[5].
2.13 Basic procedure for ensuring efficient DP system usage
To minimize performance analysis problems, the following procedure should be adhered to:
●
Define the performance expectations (see page 25).
●
Check the extent to which performance expectations are satisfied once productive
operation has begun. This involves carrying out a “basis” test.
●
If some performance expectations are not satisfied, check whether these are systemoriented or user-oriented.
●
Check for errors in the system setup.
●
Carry out a bottleneck analysis (see the section “Automatic performance analysis” in
the chapter “SM2R1 analysis routine” and the description of the START-AUTOMATICANALYSIS statement in Volume 2 of the SM2 manual [21]).
Concentrate on those bottlenecks whose elimination promises the greatest performance improvement.
●
After eliminating the detected bottlenecks, repeat the bottleneck analysis. Many bottlenecks remain hidden until after some kind of intervention.
●
Monitor the system at regular intervals (see page 27) to detect saturation symptoms in
the main resources (due to increasing loads) and to avoid critical system conditions.
The procedure is described in detail in the “Performance Handbook” [5], which also explains
how to interpret the results.
U3585-J-Z125-8-76
29
SM2 in computer networks
SM2 monitoring program
2.14 SM2 in computer networks
SM2 provides functions for the central online monitoring and control of monitored-data
acquisition in a computer network.
The monitored data is independently recorded on each host in the network by a local SM2
monitoring program, and is exchanged between the hosts via a LAN. In this way, the online
reports of all hosts can be output on any computer in the network.
There are also reports which output the combined monitored data of the various hosts.
All control statements for the acquisition of monitored data (changing monitoring cycles,
switching monitoring programs, etc.) can be entered on any host for all computers in the
network.
The SM2 functions for monitored-data acquisition in a network are also available in a
HIPLEX network.
Prerequisites for using SM2 in computer networks
1. An MSCF connection of type CCS (Closely Coupled System) must exist between all
hosts in the network.
For further information on this connection type, refer to the “HIPLEX MSCF” manual [4].
2. The SM2 functions for monitored-data acquisition in a network can only be used for
those computers in the network which run the same version of SM2.
3. SM2 must be started once on all computers in the network (e.g. with START-SM2) or at
least loaded via the DSSM command /START-SUBSYSTEM
SUBSYSTEM-NAME=SM2.
Selecting hosts with SM2
The privileged statement SELECT-HOSTS (see page 110) selects the computers to which
all subsequently entered SM2 statements are to be sent. This statement always applies to
the user who issues it. Following the END statement and a restart, the default value applies
again, i.e. SM2 statements are only executed on the local host.
The SHOW-SELECTED-HOSTS statement (see page 140) provides information on the
selected hosts. This includes the time of the last monitored variable queried.
30
U3585-J-Z125-8-76
SM2 monitoring program
SM2 in computer networks
Users in a computer network
SM2 distinguishes between privileged users (“primary” and “secondary” administrators and
other privileged users) and nonprivileged users. This also applies in a computer network.
It does not distinguish between the rights of local and remote users.
Users can have different rights on different hosts, depending on their privileges and the
rights they have already been assigned. In particular, the primary administrator of a host
can come from a different host. These primary administrators can be identified on the
MEASUREMENT STATUS screen by the additional output of the host name.
The set of administration statements available may be restricted according to the rights of
the user. As a result, the set of permitted statements may vary from one host to the next.
Prohibited statements are rejected by the relevant hosts. If several hosts are selected, the
statements of the first specified host are displayed in the user dialog.
Screen output
The screens containing the local data of a particular host are output in succession. These
are followed by the screens of the next host, and so on. The system name in the top lefthand corner of the screen indicates which host to which the screen belongs.
Before the local screens of the individual hosts, screens showing combined data from the
whole network can be output (GLOBAL, NSM and SHARED-PVS reports):
– The GLOBAL report provides an overview of the utilization of all hosts in the network.
– The NSM report outputs data of the NSM subsystem for all hosts in the network.
– The SHARED-PVS report shows the access to shared disk devices.
These reports only cover the hosts which have been previously selected by means of the
SELECT-HOSTS statement.
Standard SM2 output file
The standard SM2 output file is created on every host on the home pubset. To enable the
SM2 output files of the various hosts to be distinguished later on, the file name also includes
the system name.
U3585-J-Z125-8-76
31
SM2 in computer networks
SM2 monitoring program
Restrictions for the computer network
1. The BS2000 /START-TASK-MEASUREMENT command can only be used on the local
host.
2. Scroll commands
– Scrolling backward with “-” or “-R” is not supported across host boundaries; i.e. you
cannot scroll back from the first report of one host to the last report of the previous
host.
– You can only change to the first report of the previous host using the scroll
command “-N” (node) (see page 152).
– You can only access the reports containing combined monitored data using “-N”
while scrolling backward.
– The scroll command “--” always displays the first selected report.
3. The monitored values of the individual hosts are only output together if the time also
corresponds. The system clocks on all hosts should be synchronized as far as possible
and the same monitoring cycle must be set in SM2.
If no valid or new file exists, the following outputs are possible:
– SHOW-SELECTED-HOSTS statement
In the LAST BUFFER column, RSLT NOT VALID is output for the last monitored
variable queried instead of the time.
– GLOBAL and NSM reports
In the column for the monitored variables, “∗∗∗” is output.
– SHARED PVS report
The message “SOME DATA MISSED” is output.
– Local reports
For local reports, the message “NO DATA FROM xyz” is output.
Dynamic IO reconfiguration
SM2 recognizes a dynamic IO reconfiguration and, if need be, automatically modifies the
range of objects monitored. The monitoring programs CHANNEL-IO, SERVICETIME,
SYSSTAT, TASK and NET-DEVICE and the monitoring process for CHANNEL/DEVICE are
terminated internally and then restarted. As a result, monitored variables cannot be
supplied for the most recent monitoring cycle.
Monitoring program definitions with wildcards *ALL, *DISK or *TAPE are re-interpreted.
32
U3585-J-Z125-8-76
3 SM2 monitoring programs
3.1 Overview
SM2 offers a range of optional monitoring programs that record additional data. A distinction
is drawn between privileged monitoring programs, which only an SM2 administrator can
start and stop, and monitoring programs for user-specific monitored objects, for which the
permission of the SM2 primary administrator is required (see the MODIFY-USERADMISSION statement, page 98).
The monitoring programs are started and stopped by means of START-MEASUREMENTPROGRAM and STOP-MEASUREMENT-PROGRAM. For some monitoring programs,
monitoring parameters must be defined with the SET-<programname>-PARAMETER
statement and/or the objects to be monitored must be selected with ADD-... and REMOVE... before the program is started.
The data supplied by the monitoring programs is output on screen and/or to the SM2 output
file. To start monitoring programs that output their data exclusively to the SM2 output file,
an SM2 output file must be open. All other monitoring programs also write their data to the
SM2 output file when it is open. In the case of screen output with some monitoring
programs, it is possible to use a SELECT-... statement to select additional, object-specific
online reports.
The following table indicates the monitoring programs:
– for which parameters must be defined or the objects to be monitored must be selected
– that output their data exclusively to the SM2 output file
– that output data in an online report on the screen
– that output data in an online report only to privileged users
– for which additional, object-specific reports can be selected.
Restriction
The monitoring programs GS and GSVOL cannot be used with SR2000 as certain
hardware and system requirements are not met.
U3585-J-Z125-8-76
33
Overview
SM2 monitoring programs
Monitoring programs Parameter/
monitored
object
definition
BCAM-CONNECTION
CHANNEL-IO
CMS
COSMOS
DAB
DISK
DISK-FILE
DLM
FILE
GS
GSVOL
HSMS
ISAM
MSCF
NET-DEVICE
NSM
PCA
PERIODIC-TASK
PFA
POSIX
RESPONSETIME
SERVICETIME
SVC
SYSSTAT
TASK
TCP-IP
TLM
UTM
VM
USER FILE
USER ISAM
USER TASK
Output
exclusively to
file
x
x
Online output
Name of the
online report
Selection
Only
privileged of additional reusers
ports
BCAM CONNECTION
CHANNEL
CMS
x
x (1)
x
x
x
x
DAB
DISK FILE
DLM
FILE
GS
GSVOL
x
ISAM
MSCF
NET DEVICE
NSM
PCA
PERIODIC TASK
PFA, SYMMETRIX
POSIX
RESPONSETIME
x
x
x
x
x
x
x
x
x
x
x
SVC
CATEGORY
x
TCP/IP
TLM
UTM
VM2000
x
FILE
ISAM
x (2)
Table 4: Overview of the SM2 monitoring programs
(1) COSMOS outputs data to a separate SM2 output file (see the description of COSMOS).
(2) Output is to a user-specific SM2 output file.
34
U3585-J-Z125-8-76
SM2 monitoring programs
BCAM-CONNECTION
3.2 Privileged SM2 monitoring programs
BCAM-CONNECTION
Monitored data on connection sets
The BCAM-CONNECTION monitoring program supplies monitored data for connections
that are combined in connection sets. It provides monitored variables for DCAM applications (with NEA names) and socket applications (with port numbers) only. Information is
recorded on INWAIT, REACT, INPROC and OUTPROC times.
–
The INWAIT time is defined as the time between the display of a BCAM message at an
application and the retrieval of this message by the application.
–
The REACT time is defined as the time between an application’s send call and the
receive call which immediately precedes it. If the send and receive calls are logically
linked, then the REACT time can be seen as the time it takes for the application to
respond. In dialog-oriented applications, each input is normally followed by the appropriate output.
–
The INPROC time is defined as the time between the arrival of a message at BCAM and
the retrieval of this message by the application. The INPROC time includes the INWAIT
time.
–
The OUTPROC time is defined as the time between a send call and the transfer of the
last byte of a message to the network. Data transfer to the network may also be delayed
by the receiving party.
In addition, statistics are recorded on incoming and outgoing data (jobs, the volume of data,
packets, etc.).
The SM2 administrator can use the SET-BCAM-CONNECTION-PARAMETER and ADDBCAM-CONNECTION-SET statements to define global and connection-specific monitoring
parameters respectively.
The SET-BCAM-CONNECTION-PARAMETER statement must be entered before the first
ADD-BCAM-CONNECTION-SET statement.
Global parameters
Time statistics are recorded bucket-specifically. The BUCKET parameters consist of a list
of the maximum INWAIT, REACT, INPROC and OUTPROC times, arranged in order of
magnitude. The ranges defined in these lists apply to all connection sets defined in the
ADD-BCAM-CONNECTION-SET statement.
<integer 1 .. 99999> is an integer which defines a limit value. The number of limit values in
this list implicitly determines the number of ranges. This may vary from list to list, but four
limit values is the maximum.
U3585-J-Z125-8-76
35
BCAM-CONNECTION
SM2 monitoring programs
The last value in the list of ranges specifies the overflow limit. All monitored variables that
exceed this limit are included under the last range. The bucket parameters in BCAM can be
specified by both SM2 and other applications. It is also possible to disable monitored data
acquisition entirely.
The SET-BCAM-CONNECTION-PARAMETER statement contains the *UNCHANGED
operand value. This causes SM2 to leave the bucket parameters set in BCAM as they are,
and to adopt these values for its own monitoring program definition.
If the SET-BCAM-CONNECTION-PARAMETER statement is used to define alternative
bucket parameters, then these will also be set in BCAM when you start the monitoring
program. If you modify the bucket parameters in BCAM during the monitoring process, the
new parameters will also apply to SM2.
If monitore- data acquisition is disabled in BCAM during monitoring, SM2 will reenable it
using the parameters defined in SM2.
Connection-specific parameters
A connection is defined by an NEA name or a port number, the type of connection, and the
host name. A connection set is understood as a number of connections defined by specifying these objects.
The objects may be specified using
– a fully qualified name (name),
– a partially qualified name (name*), or
– or an unqualified name (*ANY, *LOCAL, *REMOTE, *BOTH).
Using an unqualified name may lead to fluctuations in the number of connections in a
connection set during monitoring. The BCAM-CONNECTION screen shows the number of
connections of the connection set which are currently being monitored. A connection set is
defined by specifying a list of up to 16 name definitions. You can specify either NEA application names or port numbers, but not both.
You must also specify the type of connection:
*LOCAL
Only connections within the host
*REMOTE
Only remote connections
*BOTH
All connections
Another distinguishing feature used to select connections is the names of the hosts
between which the connection exists. It is possible to define up to 32 connection sets.
36
U3585-J-Z125-8-76
SM2 monitoring programs
BCAM-CONNECTION
Examples of monitoring program definitions
Example 1
SET-BCAM-CONNECTION-PARAMETER
INWAIT-BUCKETS
= *UNCHANGED,
REACT-BUCKETS
= *UNCHANGED,
INPROC-BUCKETS
= *UNCHANGED,
OUTPROC-BUCKETS = *UNCHANGED
ADD-BCAM-CONNECTION-SET
SET-NAME = setname1,
CONNECTION-SELECTION = *BY-NEA-NAME (
CONNECTION-NAME = *SPECIFIED (
LOCAL-APPLICATION
= $DIALOG,
PARTNER-APPLICATION = *ANY)),
CONNECTION-TYPE = *REMOTE,
HOST-SELECTION
= *SPECIFIED (
LOCAL-HOST-NAME
= *LOCAL,
PARTNER-HOST-NAME = hostname1)
START-MEASUREMENT-PROGRAM TYPE = *BCAM-CONNECTION
In these statements, the monitoring parameters set in BCAM are transferred. A connection
set is defined which records all connections with the name type NEA and the local application name $DIALOG. The connections are remote and lead to the specified hosts.
U3585-J-Z125-8-76
37
CHANNEL-IO
SM2 monitoring programs
Example 2
REMOVE-BCAM-CONNECTION-SET SET-NAME = *ALL
SET-BCAM-CONNECTION-PARAMETER
ADD-BCAM-CONNECTION-SET
SET-NAME = setname2,
CONNECTION-SELECTION = *BY-PORT-NUMBER(
PORT-NUMBER = *SPECIFIED (
LOCAL-PORT-NUMBER
= 5000,
PARTNER-PORT-NUMBER = *ANY)),
CONNECTION-TYPE = *BOTH,
HOST-SELECTION
= *SPECIFIED (
LOCAL-HOST-NAME = *LOCAL,
PARTNER-HOST-NAME = hostname2)
CHANGE-MEASUREMENT-PROGRAM TYPE = *BCAM-CONNECTION
These statements end the current monitoring process and restart it using new parameters.
The bucket parameters are set to their default values. A connection set is defined which
records all connections with the local port number 5000 and which lead to the specified
host.
CHANNEL-IO
Monitored data on the channel load
The CHANNEL-IO monitoring program provides precise information on the channel load.
For each channel to be monitored, it returns the number of I/O operations for PAM block
transfer, byte transfer, and without data transfer (NODATA). In addition, it indicates the
volume of data transferred for PAM block and byte transfer in PAM blocks.
CMS
Monitored data on the catalog management system
The CMS monitoring program provides information on the performance of the catalog
management system. It outputs monitored variables for each catalog and for all private
disks.
38
U3585-J-Z125-8-76
SM2 monitoring programs
COSMOS
COSMOS
Monitored data on the system for bottleneck analysis
COSMOS is an event-driven monitoring program for recording detailed system data that is
required particularly for bottleneck analyses of OLTP applications. It collects monitored data
for all tasks, for task groups (which can be selected by user ID, category, or job name), or
for individual tasks. Because of the high volume of very detailed monitored data involved,
COSMOS should only be used for short-term monitoring. Intimate knowledge of the internal
workings of the system is required to interpret the monitored data.
COSMOS is an SM2 add-on product and only available on special release. A detailed
description is supplied with the product.
DAB
Monitored data on DAB activities
SM2 outputs highly detailed information on DAB activity in all DAB cache areas. Intensive
use of DAB in parallel may result in a large volume of data traffic in SM2.
DISK
Monitored data on disk access
The monitoring program for disk statistics permits fine analysis of the frequency with which
the cylinders or blocks of a disk are accessed, and of the duration of I/O operations. SM2R1
provides analyses of the records supplied by SM2. These analyses, combined with a
knowledge of how files are mapped to cylinder/block areas, make it possible to optimize the
mean access time for disk I/O operations.
Monitored variables
The following information is recorded for each completed disk access to a selected disk
device:
–
mnemonic device name
–
cylinder/block number addressed when I/O is started (at the time of the SDV or STARTSUBCHANNEL command)
–
duration of hardware I/O (time between the initiation of I/O using the SDV or STARTSUBCHANNEL command) until termination of I/O (as the result of a channel interrupt)
–
I/O identifier specifying read, write or other I/O operations
The monitored data recorded is then written only to an SM2 output file, from which it can be
analyzed by SM2R1 (PRINT-DISK-STATISTICS statement).
U3585-J-Z125-8-76
39
DISK-FILE
SM2 monitoring programs
Due to the large amount of data generated and the resulting high load on the CPU, this
monitoring program should be used for short monitoring operations only (between half an
hour and one hour), and only on a small number of disk devices.
Note
The only access values recorded are ones where an I/O chain begins with a search
command (SEEK). This is usually the case for most access attempts, with the exception
of the following instances:
1. When formatting disks (VOLIN)
2. When accessing the VOL1 label
DISK-FILE
Monitored data on file access for selected disks
This monitoring program provides information on physical access to files on a selected disk,
provided that access was by way of the I/O output system of privileged PAM (PPAM). This
includes file access using the methods EAM (Evanescent Access Method), ISAM (Indexed
Sequential Access Method), SAM (Sequential Access Method) and UPAM (User Primary
Access Method).
In the case of multiprocessor systems, monitoring is restricted to I/O operations originating
in the local system running SM2.
Note
Due to the extension of the I/O path, the monitoring program should only be used for
short periods of time.
DLM
Monitored data on lock requests
The DLM (Distributed Lock Manager) monitoring program provides information on lock
requests from TU, TPR and NSM.
40
U3585-J-Z125-8-76
SM2 monitoring programs
FILE
FILE
Monitored data on file access for selected files
This monitoring program provides information on the number and average duration of file
access, provided that access was by way of the I/O output system of privileged PAM
(PPAM). This includes file access using the methods EAM (Evanescent Access Method)
and ISAM (Indexed Sequential Access Method).
In addition, data is recorded for the access methods SAM (Sequential Access Method) and
UPAM (User Primary Access Method), all disk access, and all access to magnetic tape files
with standard blocks.
The FILE statistics also contain the access times for files. The monitored time covers the
logical duration of I/O operations between start and end of a job from the point of view of
the software. For asynchronous I/O operations, this time can be considerably greater than
the hardware time.
In the case of multiprocessor systems, monitoring is restricted to I/O operations originating
in the local system running SM2.
HSMS
Monitored data on file migration
This monitoring program supplies information on the migration of files to the background
level and the retrieval of files to the processing level.
GS
Monitored data on access to global storage
This monitoring program provides information on read and write access to global storage
(GS), categorized by partitions.
GSVOL
Monitored data on volumes in global storage
This monitoring program provides information on read and write access to volumes which
are emulated on global storage.
U3585-J-Z125-8-76
41
ISAM
SM2 monitoring programs
ISAM
Monitored data on ISAM pools
When the BS2000 component NK-ISAM is installed, the monitoring program for ISAM pools
provides information on the performance of the ISAM buffer management facility. ISAM
buffer management is aimed at reducing the physical I/O operations involved in accessing
ISAM files. Using the information recorded in this monitoring program, the access behavior
of this ISAM pool can be optimized by modifying the parameters of an ISAM pool, as
required (for more details on the ISAM access method, please refer to the "DMS Macros"
manual [2]).
Users can issue the BS2000 command SHOW-ISAM-POOL-ATTRIBUTES to obtain information on the pool names.
MSCF
Monitored data on communication between hosts
The MSCF (Multiple System Control Facility) monitoring program provides information on
communication between the local host and other hosts.
NET-DEVICE
Monitored data on network devices
This monitoring program provides information on access to and the transferred data of
network devices (mainframe interface controllers).
NSM
Monitored data on HIPLEX MSCF®
The NSM (Node Serialization Manager) monitoring program provides information on the
basic functions of a HIPLEX MSCF® network.
42
U3585-J-Z125-8-76
SM2 monitoring programs
PCA
PCA
Monitored data on 3419/21 disk controllers under PCA
This monitoring program records monitored data on 3419/21 disk controllers managed by
the PCA (Peripheral Cache Administrator) subsystem. It is used to record statistics on the
ADM PFA cache areas (Administrator Controlled Performant File Access). The main
purpose of the subsystem is to configure the cache integrated in the controller according to
the particular needs of the user, achieving a higher I/O throughput rate or shorter I/O times.
The monitored values recorded by the PCA monitoring program serve to evaluate the
efficiency of the cache configuration and to provide pointers on how to improve the utilization of the cache.
Unlike other SM2 monitoring programs, these statistics are not processor-oriented, rather
they relate globally to a particular controller. This fact should be taken into account particularly when interpreting monitored data. For example, high hit or miss rates for a disk device
supported by the cache do not necessarily imply that these were triggered by the host
running SM2. Also, this does not mean that the disk device listed was ever addressed by
the SM2 host via the controller, or that the device has even been generated on this host.
This information about the particular configuration should be obtained before SM2 is put to
practical use, in other words before selecting controllers or caches, with the aid of PCA
subsystem SHOW commands.
PERIODIC-TASK
Monitored data on tasks
This monitoring program records the most important utilization data for all tasks. Each user
can himself/herself use the SELECT-PERIODIC-TASK-PARAMETER statement to specify
the sort criterion and the output information for online output. The privileged statement
SET-PERIODIC-TASK-PARAMETER is used to specify the tasks whose data is to be
written to the SM2 output file. This prevents the SM2 output file from becoming too large.
Nonprivileged users receive information only on those tasks that are under their user ID.
U3585-J-Z125-8-76
43
PFA
SM2 monitoring programs
PFA
Monitored data on caches under User PFA
User PFA (User Controlled Performant File Access) allows users to assign performance
attributes to files, thus converting them into hiperfiles (High Performance Files). The idea
behind hiperfiles is that file access is accelerated by buffering the file in a high-speed cache
in order to avoid the slow disk input/output operations. The following cache media are used
for hiperfiles: main memory (MM), global storage (GS), 3419/21, 3860 and SYMMETRIX
cache controllers, and SSDs (solid state disks). Depending on the cache medium, the
caches are administered by DAB (main memory, ES, GS), by PCA (disk controllers with
cache, CTL), or by the hardware itself (SYMMETRIX).
The PFA monitoring program records monitored data on all user PFA caches. This data may
overlap with that contained in the PCA, DAB and SYMMETRIX reports.
Note
The PFA monitoring program also records information on SYMMETRIX controllers
which are not used in accordance with the PFA concept. This information is output to
the SYMMETRIX reports (see page 302ff) and applies globally to the SYMMETRIX
controller. In other words, the data output is not host-oriented.
The data in PFA reports refers to the PFA cache and is likewise not host-oriented.
Only SYMMETRIX reports should be taken into account for SYMMETRIX controllers.
With the introduction of SYMMETRIX reports, it no longer makes sense to configure
PFA pubsets in SYMMETRIX controllers.
POSIX
Monitored data on POSIX
This monitoring program provides information on the POSIX subsystem.
This information corresponds to the options and output data of the SINIX command “sar”.
44
U3585-J-Z125-8-76
SM2 monitoring programs
RESPONSETIME
RESPONSETIME
Monitored data on the BCAM pool
The RESPONSETIME monitoring program records information on response times, think
times, transactions times, and wait times in the BCAM pool. It supplies useful monitored
data for dialog-oriented DCAM applications only (with NEA names).
The response time is understood to mean the time between the receipt of a message by
the host and the sending of a response to the partner application.
SM2 makes a distinction between two kinds of response time:
Definition 1
The time between an input (receipt of a message) and the next output
(sending of a message) via the same connection .
Definition 2
The time between an input and the next output or all follow-up outputs sent
before a further input.
The SM2 administrator can choose between these two definitions (using the SETRESPONSETIME-PARAMETER or MODIFY-RESPONSETIME-PARAMETER statement).
The think time is understood to mean the time taken between output and the next (subsequent) input. The transaction time is understood to mean the total time elapsed between
an input and the final output. The wait time is understood to mean the time between entry
of a message in the BCAM pool and retrieval of the message from this pool.
For simplicity, interaction is the term used as an overall definition covering the wait,
response, think, transaction times.
U3585-J-Z125-8-76
45
RESPONSETIME
SM2 monitoring programs
Example: Calculating the time values
TI
TO1
TO2
TR
TO3
TO4
TI,next
t
TI
Input time stamp
TO
Output time stamp
TR
Time stamp of the current receive action in the BCAM application
RT1
= TO1-TI
RT2
= RT2, TO2-TO1, TO3-TO2, TO4-TO3 Response time (definition 2)
TrT
= TO4-TI
Transaction time
ThT
= TI,next-TO4
Think time
WT
= TR-TI
Wait time
Response time (definition 1)
The outputs at times TO1,2 cannot refer to the input at time TI because the latter was not
retrieved until time TR.
The outputs at times TO3,4 can (but need not) refer to the input at time TI.
Because the monitoring is performed in the BCAM transport system, no definite statement
can be made about the logical (application-specific) connection between the individual
inputs and outputs.
With dialog-oriented applications, each input is generally followed by the associated output,
so the correct response times can be established.
SM2 interprets each message from a partner application to a BCAM application as an input
and each message from a BCAM application to a partner application as an output. No
distinction is made as to whether the communications partner of the BCAM application is a
data display terminal or an application in a partner system.
In order to restrict monitoring to individual connections, SM2 employs the BCAM application
name. SM2 assumes that the transmitter or receiver (data display terminal) has been
uniquely assigned to a specific application name.
There are some special applications for which this application name has not been defined.
Specific response time measurement by SM2 is not suitable for such cases, but the corresponding values are recorded in the total.
46
U3585-J-Z125-8-76
SM2 monitoring programs
RESPONSETIME
Wait times within the communications host and data transfer times cannot be taken into
consideration.
Example: Responses to a /SHOW-FILE-ATTRIBUTES command
SHOW-FILE-ATTRIBUTES
30 :V:$ABCxxxxx.BEISP
Response time
as per def. 1
54 :V:$ABCxxxxx.MAN.1
60 :V:$ABCxxxxx.MAN.2
Response time
as per def. 2
60 :V:$ABCxxxxx.MAN.3
30 :V:$ABCxxxxx.MAN.4
Transaction
time
30 :V:$ABCxxxxx.MAN.5
30 :V:$ABCxxxxx.MAN.6
51 :V:$ABCxxxxx.MAN.7
12 :V:$ABCxxxxx.MAN5.1
12 :V:$ABCxxxxx.MAN5.2
663* :V:$ABCxxxxx.SM2.MAN
:V: PUBLIC: 10= FILES. RES= 369, FREE= 164, REL= 153 PAGES
:V: PRIVATE: 1= FILES. RES= 663, FREE=
0, REL=
0 PAGES
The SM2 administrator can use the SET- or MODIFY-RESPONSETIME-PARAMETER
statement and the ADD-CONNECTION-SET statement to define global and connectionspecific monitoring parameters respectively.
Global parameters
If response times are recorded for specific categories (SCOPE=*CATEGORY), the calculation of means values per category only involves values which are below the maximum
corresponding bucket value. If no bucket-specific analysis is required, only one value is
required to determine the overflow limit. If more than one bucket has been defined, values
below this limit are ignored as being irrelevant, and the category assignment valid at the end
of interaction remains applicable
Using the parameter CONNECTION-NUMBER=<integer 1..8187>, the maximum number
of connections to be monitored is defined. Once this number is reached, response time
monitoring continues, in which case SM2 will react to any unrecorded interaction in the
following manner:
U3585-J-Z125-8-76
47
RESPONSETIME
SM2 monitoring programs
–
The message "NOTE: CONNECTION NUMBER TOO LOW" will be issued in the SM2 output
report. Each of the RESPONSETIME screens (see description of the RESPONSETIME
report) will show the same message. The message is output only if no interactions were
recorded during the monitoring cycle in question.
–
An indication to this effect will be given in the SM2 response record at the end of this
monitoring cycle.
–
With SM2R1, the message SOME INTERACTIONS MISSED will be issued at the end
of the analysis. This message is output only if no interactions were recorded during the
analysis period in question.
The BUCKET parameters consists of a list of the maximum response, think, transaction and
wait times, arranged in order of magnitude. The ranges defined in the specified lists apply
to all connection sets specified in the ADD-CONNECTION-SET statement.
<integer 1 .. 99999> is an integer which defines the limit value. The number of limit values
in this list implicitly determines the number of ranges. This may vary from list to list, but five
limit values is the maximum. The last value in the list of ranges specifies the overflow limit.
All monitored variables that exceed this limit value are included under the last value, but are
not included in the calculation of mean values given in the RESPONSETIME report.
Connection-specific parameters
The SM2 administrator can monitor the response time both globally, i.e. for all possible
connections, and for specific individual connections, connection groups, or connection sets.
A connection is uniquely defined in the local the host by specifying the following objects:
–
–
–
–
the name of an application
the name of a partner
the host name of the partner
the type of connection
A connection group is understood as number of connections which are defined by specifying the objects listed above. The objects may be specified using a fully qualified name
(name), a partially qualified name (name*), or an unqualified name (*ALL). For example,
($DIALOG,*ALL,*ALL) defines a connection group which includes the $DIALOG application.
A connection set is understood as a combination of connection groups. It is defined by
specifying a list of up to five connection groups.
For example, (($DIALOG,*ALL,*ALL),(UTM1,*ALL,*ALL)) defines a connection set which
combines two connection groups with the $DIALOG and UTM1 applications.
48
U3585-J-Z125-8-76
SM2 monitoring programs
RESPONSETIME
This monitoring program supplies statistics for each connection set. In addition, the set of
all connections is monitored on an ongoing basis. When selecting which connections are to
be monitored, the SM2 administrator can define up to 15 connection sets. (*ALL,*ALL,*ALL)
is always set automatically as the additional connection set. Furthermore, the SM2 administrator must specify whether the selected connections are to be monitored or excluded
from monitoring using the *BY-CONNECTION or *EXCEPT-CONNECTION operand of the
ADD-CONNECTION-SET statement. With *EXCEPT-CONNECTION, all connections
except for those in the specified connection groups are monitored.
The SM2 administrator can also specify the type of the connection. If *LOCAL is specified,
connections within the host are taken into account. This makes it possible to record the
response times for individual applications, even if it would normally appear to the system
that everything is running under the OMNIS carrier application.
Each defined connection set can consist of a maximum of five connection groups. The total
number of connection groups which can be defined is, in turn, limited to 15 at most.
Examples of the RESPONSETIME monitoring program
Example 1
SET-RESPONSETIME-PARAMETER
ADD-CONNECTION-SET SET-NAME=setname1,SET-DEFINITION=*BY-CONNECTION,
CONNECTION-SET=((utm1,*ALL,*ALL),(utm2,*ALL,*ALL),(utm3,t1,pr1))
ADD-CONNECTION-SET SET-NAME=setname2,SET-DEFINITION=*BY-CONNECTION,
CONNECTION-SET=(utm3,*ALL,*ALL),CONNECTION-TYPE=*BOTH,
ADD-CONNECTION-SET SET-NAME=setname3,SET-DEFINITION=*EXCEPT-CONNECTION,
CONNECTION-SET=((*ALL,termx*,*ALL),(omnis,*ALL,*ALL))
ADD-CONNECTION-SET SET-NAME=setname4,SET-DEFINITION=*EXCEPT-CONNECTION,
CONNECTION-SET=((utm1,*ALL,*ALL),(omnis,*ALL,*ALL),(apl1,t1,pr1))
START-MEASUREMENT-PROGRAM TYPE=*RESPONSETIME
The above statements are used to explicitly define four connection sets: the first by
specifying a list of three connection groups. These three connection groups are taken
as a whole. The second connection set takes account of local and remote connections.
All the other connection sets only take account of remote connections (ï default
setting). The third connection set defines all connections which are neither part of the
OMNIS application nor belong to a partner whose name begins with “termx”. The fourth
connection set combines all connections which belong to neither the UTM1 or OMNIS
application nor to the explicit connection (apl1,t1,pr1).
U3585-J-Z125-8-76
49
SERVICETIME
SM2 monitoring programs
Example 2
REMOVE-CONNECTION-SET SET-NAME=*ALL
MODIFY-RESPONSETIME-PARAMETER DEFINITION=*2
ADD-CONNECTION-SET SET-NAME=setname,SET-DEFINITION=*EXCEPT-CONNECTION,
CONNECTION-SET=($OMNIS,*ALL,*ALL)
CHANGE-MEASUREMENT-PROGRAM TYPE=*RESPONSETIME
The above statements terminate the RESPONSETIME monitoring program (apart from
*GLOBAL) and restart it, monitoring all connections with the exception of the $OMNIS
application. In addition, the response time as defined in definition 2 is monitored. All
other monitoring parameters from the response time monitoring process just terminated
are retained.
Example 3
SET-RESPONSETIME-PARAMETER CONNECTION-NUMBER=100,RESPONSETIME-BUCKETS=
(50,100,200),THINKTIME-BUCKETS=(50,100,150,200,250)
START-MEASUREMENT-PROGRAM TYPE=*RESPONSETIME
The SET-RESPONSETIME-PARAMETER statement is used to automatically define a
connection set with the name *GLOBAL; all connections in this set are monitored
(CONNECTION(*ALL,*ALL,*ALL)). In addition, here the number of connections is
limited to 100. Three limits (50,100,200) are set for the response time, and five limits
(50,100,150,200,250) for the think time. The transaction time and the wait time in the
BCAM pool are set to their default values.
SERVICETIME
Monitored data on the service time
This monitoring program is used to carry out detailed monitoring of the service times of
individual devices. This applies, in particular, to systems using DCS (Dynamic Channel
Subsystem). For systems which do not have DCS, the service time is split up into the device
queue time and the remaining service time.
For systems with DCS, a more precise picture of the remaining service time can be
obtained. Information is output on the time from Start Subchannel to Start IO (function
pending time), the device queue time (further subdivided into the device connect time and
the device disconnect time), and the remaining service time (see definition in the glossary).
DCS does not support the detailed monitoring of devices on byte multiplexer channels. For
these devices, SM2 outputs the same monitored data as for systems which do not have
DCS.
In the case of systems with an incomplete DCS, SM2 outputs the same monitored data as
for systems which do not have DCS.
The monitored values are only output to the SM2 output file.
50
U3585-J-Z125-8-76
SM2 monitoring programs
SVC
In the case of processors with DCS in which there are several guest systems running under
VM2000, the SERVICETIME monitoring program can only be started by one of these guest
systems. Any attempts to start this function from a second guest system will be accepted
without an error message, but no DCS-specific monitored data will be returned. In general,
when using SHARED-DEVICES under VM2000, DCS-specific data will not be delivered by
any of the guest systems (see the "VM2000" manual [9]).
Note for SR2000
Information on device disconnect times cannot be supplied for devices connected to a bus.
SVC
Monitored data on SVC calls
This monitoring program records all the SVC calls in the system.
The monitored data returned will be of interest only to performance specialists, since
detailed knowledge of the internal workings of the system is required to interpret it.
SYSSTAT
Global system and category-specific monitored data
This SM2 function provides information on important global system or category-specific
variables. The most important aspect of these variables is that they can be obtained using
event-driven methods. These monitored values make it possible to assign values which are
otherwise global by default (CPU, I/O) to individual categories, i.e. the category-related
share of the load can be determined. For precise determination of category dilation, the
SET-SYSSTAT-PARAMETER statement is required to include all devices in the monitoring
process. The queue statistics are automatically activated when the monitoring program is
started. The monitored data is written to the SM2 output file; some of the values are
displayed on screen in the CATEGORY report.
U3585-J-Z125-8-76
51
TASK
SM2 monitoring programs
TASK
Task-specific monitored data
The purpose of this function is to provide task-specific variables, from which the resource
requirements of individual tasks can be determined.
This data can be used for the following purposes:
–
–
–
to determine which tasks most frequently use specific resources
to optimize operation by relocating loads
as input data for simulation models or analytic calculations.
SM2 writes this data to the SM2 output file, from which subsequent analysis is possible. As
with SM2 reports, data cannot be output during the monitoring process.
When defining the monitoring program, the tasks to be monitored must be specified. Both
user tasks and system tasks can be monitored.
SM2 can monitor both current tasks already executing or further tasks created in the course
of monitoring operations.
Monitoring information can be written to the SM2 output file at two points in time:
1. At task termination time, if the task is terminated during monitoring.
2. At monitoring termination time, if the task is still executing when the monitoring program
is terminated.
If the devices to be monitored are defined in the DEVICES operand of the SET-TASKPARAMETER statement, the number and service time of I/O operations for these devices
are output for each task according to whether they are hardware- or software-related. Due
to the time and effort involved in gathering this monitored data, this monitoring program
should only be used for brief periods of time (e.g. one hour) or for a small number of tasks.
For each task, it is possible to monitor up to 64 devices.
TCP-IP
Monitored data on TCP/IP connections
This monitoring program provides information on TCP/IP connections.
52
U3585-J-Z125-8-76
SM2 monitoring programs
TLM
TLM
Monitored data on locks
The TLM (TASK LOCK MANAGER) monitoring program records monitored data on locks
managed by the Task Lock Manager. The occupation and average queue length of each
lock are determined.
The monitored data returned will be of interest only to performance specialists, since
detailed knowledge of the internal workings of the system is required to interpret it.
UTM
Monitored data on UTM applications
The UTM monitoring program records application-specific monitored data and outputs it to
the screen or to the SM2 output file. It can only generate monitored data if the following
conditions have been fulfilled:
–
–
–
the UTM-SM2 subsystem is started
the UTM applications are delivering data
BS2000 Accounting is started (only for DB-specific user values).
For UTM versions < V5.0, the UTM-SM2 subsystem must be started manually before the
respective UTM application begins to deliver data.
As of UTM V5.0, the UTM-SM2 subsystem is started automatically.
The UTM application must be ready to deliver data to SM2.
In the KDCDEF run (operand MAX SM2=ON / OFF / NO), it is possible to influence the
transfer of monitored data.
–
SM2=OFF (default setting)
No monitored data is delivered.
If you use the UTM administration interface with KDCAPPL and SM2=ON, the transfer
of monitored data can be activated subsequently for each UTM application.
–
SM2=ON
Data is delivered.
Additional administration is not required.
–
SM2=NO
No data is delivered. It is not possible to start the transfer of data subsequently.
The settings for the transfer of monitored data are active only if the UTM-SM2 subsystem
has already been started (only applicable for UTM versions < V5.0).
U3585-J-Z125-8-76
53
VM
SM2 monitoring programs
DB-specific utilization figures (UDS and SESAM only) are only supplied if the following
conditions are met:
–
–
–
–
BS2000 Accounting is active.
The UTM accounting record UTMA is switched on (using the BS2000 command
MODIFY-ACCOUNTING-PARAMETERS SET-RECORD-TYPE=UTMA).
UTM Accounting is switched on (using the KDCAPPL statement, parameter ACC=ON).
Monitored-data acquisition is enabled in SESAM (using the statement
ACC,TP=ON,CPU).
More information on this subject can be found in the manual “UTM - Generating and Administering Applications” [10].
VM
CPU shares of virtual machines
SM2 records the share of CPU time required by the various virtual machines of a VM2000
system. The monitoring program supplies information for all virtual machines on the VM1
monitoring system only. On all other VMs, only the values for the local VM are output. In
NATIVE mode, a message is output every time an attempt is made to start this monitoring
program.
54
U3585-J-Z125-8-76
SM2 monitoring programs
FILE
3.3 Nonprivileged SM2 monitoring programs
The following instructions must be heeded when using nonprivileged monitoring programs.
You should also refer to the descriptions of the corresponding privileged monitoring
programs for a better understanding of monitoring-program-specific features and variants.
FILE
Monitored data on file access
With this monitoring program, a user can only include files in the monitoring process if the
SM2 primary administrator has permitted the monitoring of file access values. This
permission can be granted either to all users or to users with certain IDs.
In this case, the SM2 MEASUREMENT STATUS screen will have the entry FILE in the line
entitled USER MEASUREMENTS ALLOWED.
Each authorized user can include and exclude files which are set up under his own ID. It is
also possible to include files which do not exist. Privileged users are not treated differently
from normal users.
The FILE statistics also contain the access times for files. The monitored time covers the
logical duration of I/O operations between start and end of a job from the point of view of
the software. For asynchronous I/O operations, this time can be considerably greater than
the hardware time.
Any monitored files are excluded from the monitoring process once SM2 is terminated.
All together, up to 16 files can be monitored by this monitoring program; no values for these
files are written to the SM2 output file.
ISAM
Monitored data on ISAM pools
With this monitoring program, a user can only include ISAM pools in the monitoring process
if the SM2 primary administrator has permitted ISAM pool monitoring. This permission can
be granted either to all users or to users with certain IDs. In this case, the SM2
MEASUREMENT STATUS screen will have the entry ISAM in the line entitled USER
MEASUREMENTS ALLOWED.
Each authorized user can include or exclude global ISAM pools and all task-specific or
user-specific ISAM pools which have been created or are being created under his user ID.
U3585-J-Z125-8-76
55
TASK
SM2 monitoring programs
SM2 does not check whether an ISAM pool exists when a user tries to include it; in other
words an ISAM pool can be included in the monitoring process even before it has been
created. If an ISAM pool which has been included does not exist during the monitoring
cycle, all its monitored data will be listed with blanks. Since the total number of ISAM pools
that can be monitored by SM2 for nonprivileged users is limited to 16, care must be taken
not to unnecessarily include too many non-existent ISAM pools in the monitoring operations.
No values are written to the SM2 output file for ISAM pools monitored with the aid of this
monitoring program.
TASK
Task-specific monitored data
A user can start this monitoring program only if the primary SM2 administrator has
permitted user-specific task monitoring. This permission can be granted either to all users
or to users with certain IDs. In this case, the SM2 MEASUREMENT STATUS screen will
contain the entry TASK in the line entitled USER MEASUREMENTS ALLOWED.
With the /START-TASK-MEASUREMENT command, the user is then given the option of
including tasks under his/her own ID for monitoring by SM2. This task information is stored
in a user-specific SM2 output file and it can then be analyzed using the SM2-PA analysis
routine (see the "SM2-PA" manual [8]).
56
U3585-J-Z125-8-76
4 SM2 operation
4.1 Starting and terminating SM2
4.1.1 Starting the program
SM2 is called with the following BS2000 command :
START-SM2
Format
START-SM2
VERSION = *STD / <product-version mandatory-man-corr> /
<product-version mandatory-man-without-corr> / <product-version without-man-corr>
,MONJV = *NONE / <filename 1..54 without-gen-vers>
,CPU-LIMIT = *JOB-REST / <integer 1..32767>
Operands
VERSION =
Specifies the version of SM2 to be called.
VERSION = *STD
The current version is called.
VERSION = <product-version>
The specified version is called.
U3585-J-Z125-8-76
57
Starting and terminating SM2
SM2 operation
MONJV =
Specifies the name of the job variable to be monitored in the SM2 run. The job variable must
already be cataloged.
MONJV = *NONE
No job variable is specified.
MONJV = <filename 1..54 without-gen-vers>
Specifies the name of a job variable already cataloged.
CPU-LIMIT =
Specifies the CPU time required for the SM2 run. In interactive mode, the user is notified by
the system if this time is exceeded. In batch mode, the SM2 run is terminated.
CPU-LIMIT = *JOB-REST
There is no limit on the CPU time available to the program.
CPU-LIMIT = <integer 1..32767>
Specifies the CPU time required for the SM2 run.
4.1.2 Terminating the program
SM2 is terminated using the END statement.
●
The automatic output mode is terminated with the BREAK function. The END statement
is entered after returning to program mode (using /INFORM-PROGRAM).
●
In controlled mode, END can be entered instead of an output control character just like
any other output statement.
SM2 acknowledges program termination with the message
SM2 TERMINATED NORMALLY.
Note
Monitored data acquisition is never terminated by the END statement. Termination of
the SM2 subsystem is only possible by explicitly issuing the command
/STOP-SUBSYSTEM SUBSYSTEM-NAME=SM2.
58
U3585-J-Z125-8-76
SM2 operation
Overview
4.2 Overview of SM2 operation
After the program load message, SM2 prompts you to enter statements.
Each caller (privileged or nonprivileged user, see section “Users” on page 12) is initially
taken to the analysis subinterval of SM2. Here the user can do the following:
–
–
–
select monitored data for output on-screen
control screen output
output information on the monitoring process
In addition, the privileged user (SM2 call with the system privilege SW-MONITORADMINISTRATION) also has the option of using the CALL-ADMINISTRATION-PART
statement to change to the administration facility. Here the SM2 administrator can perform
the following administration tasks:
–
–
–
–
–
–
define monitoring parameters
activate/deactivate optional monitoring runs
set up the SM2 output file
assign privileges for nonprivileged users
output information on the monitoring process
specify a host for SM2 statements and reports (only applies for privileged users
themselves)
In order to be able to issue the statements used to control real-time monitoring, the privileged user must switch into the analysis subinterval (using the CALL-EVALUATION-PART
statement). In doing so, the privileged user defines his/her status as an SM2 administrator.
U3585-J-Z125-8-76
59
Typical SM2 run
SM2 operation
Typical SM2 run
Start SM2
/START-SM2
SM2 monitoring task set up internally
(in first SM2 call during system run)
Switch to administration facility
Set monitoring cycle
Open SM2 output file
Start monitoring programs
Switch to analysis subinterval
Select online reports
CALL-ADMINISTRATION-PART
//MODIFY-MEASUREMENT-PERIODS
OFFLINE-PERIOD=<cycle>
//OPEN-LOG-FILE FILE=<filename>
//START-MEASUREMENT-PROGRAM
TYPE=<monitoring-program>
//CALL-EVALUATION-PART
REPORT <reportname>
During the monitoring cycle, data is
collected and formatted.
On completion of the monitoring cycle, data is
written to the central buffer and the SM2 file.
SM2 output file
Start output of
online reports
START
Analyze SM2 output file
during SM2 run
Terminate SM2-ONLINE
Terminate monitored-data acquisition,
implicitly close SM2 output file,
and unload SM2
END
/STOP-SUBSYSTEM
SUBSYSTEM-NAME=SM2
Analyze SM2 output file
after SM2 run
60
U3585-J-Z125-8-76
SM2 operation
Statements for SM2 adminstrators
4.3 Statements for SM2 administrators
These statements are used by SM2 administrators to control data acquisition by SM2. The
statements for assigning authorizations to nonprivileged users and for admitting other SM2
administrators are only available to the SM2 primary administrator
Statements for switching between the analysis subinterval and the administration
facility
Statement
Function
CALL-ADMINISTRATION-PART
Switch from the analysis subinterval to the administration
facility
CALL-EVALUATION-PART
Switch from the administration facility to the analysis
subinterval
Statements for defining monitoring programs
Some monitoring programs require you to specify which objects are to be monitored and
with what parameters. The ADD, REMOVE, SET and MODIFY statements are provided for
this purpose.
The ADD statements each define an object to be monitored by a particular monitoring
program. The REMOVE statements can be used to exclude a set of monitored objects,
defined with the aid of ADD statements, from the monitoring process. The SET statements
define a list of objects to be monitored or the monitoring parameters. The MODIFY statements can be used to modify the default values. The objects to be monitored or the
monitoring parameters defined using the statements listed above can be output using the
SHOW-DEFINED-PARAMETER statement. Monitoring of the defined objects does not
begin until the monitoring programs are started (using the START-MEASUREMENTPROGRAM statement) or restarted (using CHANGE-MEASUREMENT-PROGRAM).
The monitoring program definitions become active and can be output using the
SHOW-ACTIVE-PARAMETER statement.
U3585-J-Z125-8-76
61
Statements for SM2 adminstrators
62
SM2 operation
Statement
Function
ADD-BCAM-CONNECTION-SET
Add a connection set for BCAM-CONNECTION
monitoring
ADD-CONNECTION-SET
Add a connection set (applications and partner
systems) for RESPONSETIME monitoring
ADD-COSMOS-EVENT
Define events for monitored-data acquisition
ADD-FILE
Define a file to be monitored
ADD-ISAM-POOL
Define an ISAM pool to be monitored
MODIFY-COSMOS-PARAMETER
Modify the parameters for COSMOS monitoring
MODIFY-RESPONSETIME- PARAMETER
Modify the parameters for RESPONSETIME
monitoring
REMOVE-BCAM-CONNECTION-SET
Exclude a connection set from BCAM-CONNECTION
monitoring
REMOVE-CONNECTION-SET
Exclude a connection set from RESPONSETIME
monitoring
REMOVE-COSMOS-EVENT
Remove events from the COSMOS monitoring parameters
REMOVE-FILE
Remove file(s) from the FILE monitoring parameters
REMOVE-ISAM-POOL
Remove ISAM pool(s) from the ISAM monitoring
parameters
SET-BCAM-CONNECTION-PARAMETER
Define BCAM-CONNECTION monitoring parameters
SET-CHANNEL-IO-PARAMETER
Define CHANNEL-IO monitoring parameters
SET-COSMOS-PARAMETER
Define COSMOS monitoring parameters
SET-DISK-PARAMETER
Define DISK monitoring parameters
SET-DISK-FILE-PARAMETER
Define DISK-FILE monitoring parameters
SET-PERIODIC-TASK-PARAMETER
Define PERIODIC-TASK monitoring parameters
SET-RESPONSETIME-PARAMETER
Define RESPONSETIME monitoring parameters
SET-SERVICETIME-PARAMETER
Define SERVICETIME monitoring parameters
SET-SYSSTAT-PARAMETER
Define SYSTAT monitoring parameters
SET-TASK-PARAMETER
Define TASK monitoring parameters
U3585-J-Z125-8-76
SM2 operation
Statements for SM2 adminstrators
Statements for preparing, starting, and stopping monitoring programs
Once you have defined the objects to be monitored, the monitoring program run can be
started. Certain preparations are recommended for the COSMOS monitoring program to
ensure that it starts quickly and without errors. After defining new monitored objects/
monitoring parameters, the monitoring program run must be stopped and then started
again in order to actually add the newly defined objects and parameters to the monitoring
program. The INITIATE, START, CHANGE and STOP statements are used for this purpose.
Statement
Function
INITIATE-COSMOS
Prepare the COSMOS monitoring program
START-MEASUREMENT-PROGRAM
Start the monitoring program run
CHANGE-MEASUREMENT-PROGRAM
Stop the current monitoring program run and restart
it with new monitored objects/monitoring parameters
STOP-MEASUREMENT-PROGRAM
Terminate the monitoring program run
The START statement is used to start the monitoring programs. The CHANGE statement
is required following the redefinition of monitored objects/monitoring parameters of the
monitoring program run in order to add the new objects/parameters to the monitoring
program. The monitoring program run is stopped and then started with the new monitored
objects/monitoring parameters. The STOP statement terminates the specified monitoring
programs.
The START, CHANGE and STOP statements merely interrupt the current monitoring cycle.
Statements for opening and closing the SM2 output file and controlling monitoreddata acquisition
In addition to the output of reports on the screen, monitored data can be continuously
written to file. Creating the SM2 output file (OPEN-LOG-FILE) and closing it (CLOSE-LOGFILE) is a privilege reserved for SM2 administrators. The OPEN-LOG-FILE statement can
be used to modify the predefined SM2 file attributes.
The MODIFY-MEASUREMENT-PERIODS statement can be used to modify the monitoring
cycles for background monitoring (collecting and writing monitored data to the SM2 output
file), and to modify the screen output and the sampling cycle.
Statement
Function
OPEN-LOG-FILE
Open the SM2 output file
CLOSE-LOG-FILE
Close the SM2 output file
MODIFY-MEASUREMENT-PERIODS
Modify the SM2 monitoring cycle
U3585-J-Z125-8-76
63
Statements for SM2 adminstrators
SM2 operation
Statements for assigning privileges
At the beginning of the program, the nonprivileged user is not allowed to monitor tasks, files
or ISAM pools. But by using the MODIFY-USER-ADMISSION statement, the primary SM2
administrator can grant or withdraw permission for all BS2000 users to monitor tasks under
their own ID, files and ISAM pools. The MODIFY-ADMINISTRATOR-ADMISSION statement
allows the primary SM2 administrator to admit additional (secondary) administrators.
Statement
Function
MODIFY-USER-ADMISSION
Define authorizations for nonprivileged users
MODIFY-ADMINISTRATOR-ADMISSION
Admit additional SM2 administrators
Statements for outputting information
The SHOW statements provide information on the monitoring status, the objects, and the
monitoring parameters for selected monitoring programs, as well as on the status of the
SM2 system tasks.
Statement
Function
SHOW-MEASUREMENT-STATUS
Output the monitoring status
SHOW-DEFINED-PARAMETER
Output defined monitoring parameters
SHOW-ACTIVE-PARAMETER
Output active monitoring parameters
SHOW-USER-MEASURED-OBJECTS
Output monitored objects and associated users
SHOW-SM2-STATUS
Output the status of SM2 system tasks
SHOW-SELECTED-HOSTS
Output selected hosts
Statement for specifying hosts for administration statements and screen outputs
This statement is used to specify the hosts to which the SM2 administration statements
apply and for which the screens are to be output.
64
Statement
Function
SELECT-HOSTS
Define hosts for SM2 statements and screen output
U3585-J-Z125-8-76
SM2 operation
Statements for SM2 adminstrators
Statement for terminating the SM2 program
The END statement is used to terminate the SM2 session. However, monitoring operations
which have already been initiated are not affected, i.e. they continue to run.
Statement
Function
END
Terminate the SM2 run
The following sections describe the statements for SM2 administrators in alphabetical
order.
Notes
In all statements which allow you to use wildcard syntax, only the character * is supported
as the last character. All other constructs possible in SDF are rejected with a error message.
The internal program name for syntax validation in SM2 statements in EDT is SM2130.
U3585-J-Z125-8-76
65
ADD-BCAM-CONNECTION-SET
Statements for SM2 administrators
ADD-BCAM-CONNECTION-SET
Add connection set for BCAM-CONNECTION monitoring
Function
This statement is used to define a connection set which is to be added to the BCAMCONNECTION monitoring program definition.
The following features must be specified:
– the type of connection with local and partner (connection) names
– the names of the local and partner systems
– an indication of whether the connections are local or remote
It is possible to define up to 32 connection sets.
This statement must be preceded by a SET-BCAM-CONNECTION-PARAMETER
statement.
Format
ADD-BCAM-CONNECTION-SET
SET-NAME = <alphanum-name 1..16>
,CONNECTION-SELECTION = *BY-NEA-NAME(...) / *BY-PORT-NUMBER(...)
*BY-NEA-NAME(...)
CONNECTION-NAME = list-poss(16): *SPECIFIED(...)
*SPECIFIED(...)
LOCAL-APPLICATION = *ANY / <alphanum-name 1..8 with wild>
,PARTNER-APPLICATION = *ANY / <alphanum-name 1..8 with wild>
*BY-PORT-NUMBER(...)
PORT-NUMBER = list-poss(16): *SPECIFIED(...)
*SPECIFIED(...)
LOCAL-PORT-NUMBER = *ANY / <integer 1..65535>
,PARTNER-PORT-NUMBER = *ANY / <integer 1..65535>
,CONNECTION-TYPE = *REMOTE / *LOCAL / *BOTH
,HOST-SELECTION = *ANY / *SPECIFIED(...)
*SPECIFIED(...)
LOCAL-HOST-NAME = *LOCAL / <alphanum-name 1..8 with-wild>
,PARTNER-HOST-NAME = *ANY / <alphanum-name 1..8 with-wild>
66
U3585-J-Z125-8-76
Statements for SM2 administrators
ADD-BCAM-CONNECTION-SET
Operands
SET-NAME = <alphanum-name 1..16>
Defines a name for the selected connection set.
CONNECTION-SELECTION =
Defines the type of connection set to be monitored.
CONNECTION-SELECTION = *BY-NEA-NAME(...)
Defines a selection of connections in accordance with the application name.
CONNECTION-NAME = list-poss(16): *SPECIFIED(...)
LOCAL-APPLICATION = *ANY / <alphanum-name 1..8 with wild>
*ANY: No special local application is selected.
<alphanum-name 1..8>: Specifies the name of the selected local application.
An asterisk (*) is also permitted as the last character in a wildcard specification.
,PARTNER-APPLICATION = *ANY / <alphanum-name 1..8 with wild>
*ANY: No special partner application is selected.
<alphanum-name 1..8>: Specifies the name of the selected partner application.
An asterisk (*) is also permitted as the last character in a wildcard specification.
CONNECTION-SELECTION = *BY-PORT-NUMBER(...)
Defines a selection of connections in accordance with the port number.
PORT-NUMBER = list-poss(16): *SPECIFIED(...)
LOCAL-PORT-NUMBER = *ANY / <integer 1..65535>
*ANY: No special local transport address is selected.
<integer 1..65535>: Local transport address.
PARTNER-PORT-NUMBER = *ANY / <integer 1..65535>
*ANY: No special partner transport address is selected.
<integer 1..65535>: Partner transport address.
CONNECTION-TYPE =
Specifies the type of connection to be taken into consideration for the connection set.
CONNECTION-TYPE = *REMOTE
Only remote connections are taken into consideration.
CONNECTION-TYPE = *LOCAL
Only local connections are taken into consideration.
CONNECTION-TYPE = *BOTH
Both local and remote connections are taken into consideration.
U3585-J-Z125-8-76
67
ADD-BCAM-CONNECTION-SET
Statements for SM2 administrators
HOST-SELECTION =
Defines the names of the hosts between which the connections to be monitored should
exist.
HOST-SELECTION = *ANY
No special host name is selected.
HOST-SELECTION = *SPECIFIED(...)
LOCAL-HOST-NAME = *LOCAL / <alphanum-name 1..8 with-wild>
*LOCAL: The local host name should be used.
<alphanum-name 1..8>: Specifies the name of the local host. With some connections,
the local processor name may differ from the host name. An asterisk (*) is also
permitted as the last character in a wildcard specification.
PARTNER-HOST-NAME = *ANY / <alphanum-name 1..8 with-wild>
*ANY: No special partner host should be assumed.
<alphanum-name 1..8>: Specifies the name of the partner host. An asterisk (*) is also
permitted as the last character in a wildcard specification.
68
U3585-J-Z125-8-76
Statements for SM2 administrators
ADD-CONNECTION-SET
ADD-CONNECTION-SET
Add connection set for RESPONSETIME monitoring
Function
This statement is used to define a connection set which is to be added to the
RESPONSETIME monitoring program definition. A connection set consists of one or more
(as many as five) connection groups. The connection set can be either positively defined
(i.e. all groups specified in this connection set are monitored) or negatively defined (i.e. all
groups except those specified in the connection set are monitored). For each connection
set, a freely selectable name must be assigned; the name is the one under which this set
can be addressed in the REMOVE-CONNECTION-SET statement and also addressed by
SM2R1 for analysis purposes. If a connection set is defined, it is also possible to specify
whether remote, local or both types of connections are to be taken into account for the set.
SM2 then passes the correct parameter value to BCAM-SM2. This value then applies to this
connection set only.
This statement cannot be entered until after the SET-RESPONSETIME-PARAMETER
statement has been entered. The SET-RESPONSETIME-PARAMETER statement
automatically defines a connection set with the name *GLOBAL in which all connections are
monitored (*CONNECTION (*ALL,*ALL,*ALL)). The value CONNECTION-TYPE=
*REMOTE applies for this connection set and cannot be changed.
A total of 16 connection sets (*GLOBAL inclusions) may be defined with a total of 16
different connection groups ((*ALL,*ALL,*ALL) inclusion). If this number is exceeded, the
statement will be rejected and a message to this effect issued. If an attempt is made to
declare more than one set under one set name, the statement will be rejected and a
message will be issued.
U3585-J-Z125-8-76
69
ADD-CONNECTION-SET
Statements for SM2 administrators
Format
ADD-CONNECTION-SET
SET-NAME = <alphanum-name 1..16>
,SET-DEFINITION = *BY-CONNECTION / *EXCEPT-CONNECTION
,CONNECTION-SET = list-poss(5): *CONNECTION(...)
*CONNECTION(...)
APPLICATION = *ALL / <alphanum-name 1..8 with-wild>
,PARTNER = *ALL / <alphanum-name 1..8 with-wild>
,PROCESSOR = *ALL / <alphanum-name 1..8 with-wild>
,CONNECTION-TYPE = *REMOTE / *LOCAL / *BOTH
Operands
SET-NAME = <alphanum-name 1..16>
Defines a name for the selected connection set.
SET-DEFINITION =
Defines the connection set to be monitored.
SET-DEFINITION = *BY-CONNECTION
All connection groups defined in the connection set are monitored.
SET-DEFINITION = *EXCEPT-CONNECTION
All connection groups except those defined in the connection set are monitored.
CONNECTION-SET = list-poss(5): *CONNECTION(...)
Defines a selection of up to five connection groups.
APPLICATION = *ALL / <alphanum-name 1..8 with-wild>
*ALL: No special application is selected.
<alphanum-name 1..8>: Specifies the name of the selected application. An asterisk (*)
is also permitted as the last character in a wildcard specification.
PARTNER = *ALL / <alphanum-name 1..8 with-wild>
*ALL: No special partner is selected.
<alphanum-name 1..8>: Specifies the name of the selected partner. An asterisk (*) is
also permitted as the last character in a wildcard specification.
70
U3585-J-Z125-8-76
Statements for SM2 administrators
ADD-CONNECTION-SET
PROCESSOR = *ALL / <alphanum-name 1..8 with-wild>
*ALL: No special partner processor is selected.
<alphanum-name 1..8>: Specifies the name of the partner processor which has been
selected. An asterisk (*) is also permitted as the last character in a wildcard specification.
CONNECTION-TYPE =
Specifies the type of connection to be taken into consideration for the connection set.
CONNECTION-TYPE = *REMOTE
Only remote connections are taken into consideration.
CONNECTION-TYPE = *LOCAL
Only local connections are taken into consideration.
CONNECTION-TYPE = *BOTH
Both local and remote connections are taken into consideration.
Note
No application name is defined for applications that use the SOCKETS(BS2000) or
ICMX(BS2000) interface. Connections of these applications cannot be selected in SM2
using the ADD-CONNECTION-SET statement. They are contained in the *GLOBAL
connection set.
U3585-J-Z125-8-76
71
ADD-COSMOS-EVENT
Statements for SM2 administrators
ADD-COSMOS-EVENT
Define events for monitored-data acquisition
Function
This statement is used to define events which are to be added to the COSMOS monitoring
program definition.
Format
ADD-COSMOS-EVENT
EVENT-NAME = *STANDARD-EVENTS / list-poss(67): *STANDARD-EVENTS / *ACF / *BCAM / *BCPT /
*BLS / *BOUR / *CHTM / *CMD / *CMS / *DAB / *DCAM / *DLM / *EIA / *EIA2 / *EIA3 /
*FITC / *GSAC / *HAL / *IDLE / *INTR / *IONQ / *ISEV / *ISPL / *KAI / *LOCK / *MSG / *NSM / *PAGE /
*PAM / *PCCC / *PCTC / *PDEA / *PEND / *PIO / *PMIO / *PRGS / *PRGT / *PRTY / *RELM /
*REQM / *SDV / *SLOT / *SNAP / *STD1 / *STDI / *STDN / *SVC / *TGMA / *TGMP / *TGMT /
*TINF / *TLM / *TLT / *TSKI / *TSVC / *UTM / *VMCH / *VMH / *VMI / *VMLK / *VMPD /
*VMPR / *VMS / *VM2 / *WSCT / *XEIA
Operands
EVENT-NAME =
Specifies the name of the events to be recorded.
EVENT-NAME = *STANDARD-EVENTS
The following events are to be recorded by default: ACF, BLS, BOUR, CHTM, CMS, DAB,
EIA2, EIA3, FITC, IDLE, INTR, IONQ, PAGE, PAM, PCCC, PCTC, PEND, PMIO, PRGS,
PRGT, RELM, REQM, SDV, SVC, TSKI, TSVC, WSCT.
EVENT-NAME = list-poss(67): *STANDARD-EVENTS / *ACF / *BCAM / *BCPT /
*BLS / *BOUR / *CHTM / *CMD / *CMS / *DAB / *DCAM / *DLM / *EIA / *EIA2 / *EIA3 /
*FITC / *GSAC / *HAL / *IDLE / *INTR / *IONQ / *ISEV / *ISPL / *KAI / *LOCK / *MSG /
*NSM / *PAGE / *PAM / *PCCC / *PCTC / *PDEA / *PEND / *PIO / *PMIO / *PRGS /
*PRGT / *PRTY / *RELM / *REQM / *SDV / *SLOT / *SNAP / *STD1 / *STDI / *STDN /
*SVC / *TGMA / *TGMP / *TGMT / *TIC / *TINF / *TLM / *TLT / *TSKI / *TSVC / *UTM /
*VMCH / *VMH / *VMI / *VMLK / *VMPD / *VMPR / *VMS / *VM2 / *WSCT / *XEIA
The events specified in the list are to be recorded. The mandatory events CREA, DEST,
INIT, LGON, MMRC, PTSK and STAT are always recorded.
72
U3585-J-Z125-8-76
Statements for SM2 administrators
ADD-FILE
ADD-FILE
Define file to be monitored
Function
This statement is used to define a file which is to be added to the FILE monitoring program
definition. This monitoring program allows you to define up to 16 files for monitoring. If this
number is exceeded, the statement is rejected and a corresponding message is issued.
Format
ADD-FILE
FILE-NAME = <filename 1..54>
Operands
FILE-NAME = <filename 1..54>
Name of the file whose access values are to be monitored. The file name must be specified
as a fully qualified name.
U3585-J-Z125-8-76
73
ADD-ISAM-POOL
Statements for SM2 administrators
ADD-ISAM-POOL
Define ISAM pool to be monitored
Function
This statement is used to define an ISAM pool which is to be added to the ISAM monitoring
program definition. This monitoring program allows you to define up to 16 ISAM pools for
monitoring. If this number is exceeded, the statement is rejected and a message is issued.
Format
ADD-ISAM-POOL
POOL-NAME = <alphanum-name 1..8>
,SCOPE = *HOST-SYSTEM / *TASK(...) / *USER(...)
*TASK(...)
TSN = <alphanum-name 1..4>
*USER(...)
USER-ID = <alphanum-name 1..8>
,CAT-ID = *HOME-PVS / <catid 1..4>
Operands
POOL-NAME = <alphanum-name 1..8>
Specifies the name of the ISAM pool to be monitored.
SCOPE =
Defines the type of ISAM pool.
SCOPE = *HOST-SYSTEM
The pool here is a global ISAM pool.
SCOPE = *TASK(...)
The pool here is a task-specific ISAM pool.
TSN = <alphanum-name 1..4>
Specifies the TSN of the task under which the task-specific ISAM pool was set up.
74
U3585-J-Z125-8-76
Statements for SM2 administrators
ADD-ISAM-POOL
SCOPE = *USER(...)
The pool is a user-specific ISAM pool.
USER-ID = <alphanum-name 1..8>
Specifies the user ID under which the ISAM pool was set up. This must be specified
without the “$” sign.
CAT-ID =
Specifies the catalog ID of the public volume set to which the ISAM pool has been assigned.
The user ID must be specified without the “$” sign.
CAT-ID = *HOME-PVS
The ID here is the catalog ID of the home pubset.
CAT-ID = <cat-id 1..4>
Catalog ID of the public volume set to which the ISAM pool has been assigned.
U3585-J-Z125-8-76
75
CALL-ADMINISTRATION-PART
Statements for SM2 administrators
CALL-ADMINISTRATION-PART
Switch from evaluation part to administration facility
Function
This statement is used to switch from the evaluation part to the administration facility, which
provides an SDF statement interface.
To switch back to the analysis subinterval, use the CALL-EVALUATION-PART command.
Format
CALL-ADMINISTRATION-PART
76
U3585-J-Z125-8-76
Statements for SM2 administrators
CALL-EVALUATION-PART
CALL-EVALUATION-PART
Switch from administration facility to evaluation part
Function
This statement is used to switch from the administration facility to the evaluation part, i.e.
after this statement is entered all statements required for online analysis can be entered. To
switch back to SDF statement mode for administration purposes, use the CALL-ADMINISTRATION-PART command.
Format
CALL-EVALUATION-PART
U3585-J-Z125-8-76
77
CHANGE-MEASUREMENT-PROGRAM
Statements for SM2 administrators
CHANGE-MEASUREMENT-PROGRAM
Stop current monitoring program run and restart it with new
monitored objects
Function
This statement is used to stop the current monitoring program run and restart it using newly
defined monitored objects/monitoring parameters. The current monitoring cycle is interrupted.
Format
CHANGE-MEASUREMENT-PROGRAM
TYPE = list-poss(12): *BCAM-CONNECTION / *CHANNEL-IO / *COSMOS / *DISK / *DISK-FILE / *FILE /
*ISAM / *PERIODIC-TASK / *RESPONSETIME / *SERVICETIME / *SYSSTAT / *TASK
Operands
TYPE =
Specifies the type of monitoring program (the descriptions below are in alphabetical order)
to be restarted using the modified monitored objects/monitoring parameters.
TYPE = *BCAM-CONNECTION
The BCAM-CONNECTION monitoring program is restarted with new monitoring parameters or connection sets.
TYPE = *CHANNEL-IO
The CHANNEL-IO monitoring program is restarted with a new range of channels.
TYPE = *COSMOS
The COSMOS monitoring program is restarted with a new scope.
TYPE = *DISK
The DISK monitoring program is restarted with a new range of disks.
TYPE = *DISK-FILE
The DISK-FILE monitoring program is restarted with a new range of disks.
TYPE = *FILE
The FILE monitoring program is restarted with a new range of files.
78
U3585-J-Z125-8-76
Statements for SM2 administrators
CHANGE-MEASUREMENT-PROGRAM
TYPE = *ISAM
The ISAM monitoring program is restarted with a new range of ISAM pools.
TYPE = *PERIODIC-TASK
The PERIODIC-TASK monitoring program is restarted with a new range of tasks.
TYPE = *RESPONSETIME
The RESPONSETIME monitoring program is restarted with a new set of parameters or a
new range of connection sets.
TYPE = *SERVICETIME
The SERVICETIME monitoring program is restarted with a new range of devices.
TYPE = *SYSSTAT
The SYSTAT monitoring program is restarted with a new range of devices.
TYPE = *TASK
The TASK monitoring program is restarted with a new set of TSNs or a new range of
devices.
Note
Even if errors are detected when processing the CHANGE statement before the
monitoring programs are stopped, the monitoring programs continue to execute. If, after
stopping the program, errors are detected when restarting the monitoring programs, the
monitoring programs specified in the statement will still be stopped.
U3585-J-Z125-8-76
79
CLOSE-LOG-FILE
Statements for SM2 administrators
CLOSE-LOG-FILE
Close SM2 output file
Function
This statement is used to close an SM2 output file. The current monitoring cycle is interrupted.
Format
CLOSE-LOG-FILE
Note:
When the SM2 output file is closed, all monitoring programs are stopped and the
monitored data is written exclusively to the SM2 output file (see table “Overview of the
SM2 monitoring programs” on page 34).
80
U3585-J-Z125-8-76
Statements for SM2 administrators
END
END
Terminate SM2 run
Function
This statement is used to terminate SM2 administration. All current measurements are
continued using the currently defined monitoring parameters. This is also the case if no
further user is working with SM2. The only way to terminate SM2 along with the privileged
system tasks is to issue the DSSM command /STOP-SUBSYSTEM SUBSYSTEMNAME=SM2.
Format
END
U3585-J-Z125-8-76
81
INITIATE-COSMOS
Statements for SM2 administrators
INITIATE-COSMOS
Prepare COSMOS monitoring program
Function
The COSMOS monitoring program is fully initiated (prepared), but no events are recorded
yet - not even mandatory events. This statement is used to ensure to a large extent that the
COSMOS monitoring program subsequently starts without errors and quickly (without
mount messages).
Format
INITIATE-COSMOS
82
U3585-J-Z125-8-76
Statements for SM2 administrators
MODIFY-ADMINISTRATOR-ADMISSION
MODIFY-ADMINISTRATOR-ADMISSION
Admit additional SM2 administrators
Function
This statement is used by the SM2 primary administrator to admit additional secondary
administrators.
Format
MODIFY-ADMINISTRATOR-ADMISSION
CONCURRENCY = *NO / *YES
Operands
CONCURRENCY =
Specifies whether additional SM2 administrators are to be admitted.
CONCURRENCY = *NO
No additional SM2 administrators are to be admitted.
CONCURRENCY = *YES
Additional administrators are admitted. These administrators are allowed to execute all SM2
statements with the exception of MODIFY-ADMINISTRATOR-ADMISSION and MODIFYUSER-ADMISSION.
U3585-J-Z125-8-76
83
MODIFY-COSMOS-PARAMETER
Statements for SM2 administrators
MODIFY-COSMOS-PARAMETER
Modify parameters for COSMOS monitoring
Function
This statement is used to modify the COSMOS monitoring program definition.
It is useful when the SHOW-DEFINED-PARAMETER statement finds parameters that have
to be modified.
Format
(part 1 of 2)
MODIFY-COSMOS-PARAMETER
TITLE = *UNCHANGED / <c-string 1..80>
,BUFFER-SIZE = *UNCHANGED / <integer 1..7>
,NUMBER-OF-BUFFERS = *UNCHANGED / <integer 2..128>
,ADDITIONAL-INFO = *UNCHANGED / *NONE / list-poss(2): *CONFIGURATION / *VM2000(...)
*VM2000(...)
FILE-NAME = <filename 1..54 without-gen-vers>
,OUTPUT = *UNCHANGED / *DISK(...) / *WRAP-AROUND(...) / *TAPE(...) / *STREAM-TAPE(...)
*DISK(...)
FILE-NAME = list-poss(16): <filename 1..54 without-gen-vers>
*WRAP-AROUND(...)
FILE-NAME = <filename 1..54 without-gen-vers>
*TAPE(...)
FILE-NAME = list-poss(16): <filename 1..54 without-gen-vers>
*STREAM-TAPE(...)
FILE-NAME = list-poss(16): <filename 1..54 without-gen-vers>
Continued ➠
84
U3585-J-Z125-8-76
Statements for SM2 administrators
MODIFY-COSMOS-PARAMETER
(part 2 of 2)
,TASK-SELECTION = *UNCHANGED / *ALL / *SPECIFIED(...)
*SPECIFIED(...)
,JOB-NAME = *NOT-SPECIFIED / list-poss(8): <alphanum-name 1..8 with-wild>
,CATEGORY = *NOT-SPECIFIED / list-poss(8): <alphanum-name 1..7 with-wild>
,USER-ID = *NOT-SPECIFIED / list-poss(8): <alphanum-name 1..8 with-wild>
TSN = *NOT-SPECIFIED / list-poss(16): <alphanum-name 1..4 with-wild>
,TYPE = *NOT-SPECIFIED / list-poss(4): *SYSTEM / *DIALOG / *BATCH / *TP
,EVENT-SELECTION = *UNCHANGED / *ALL-BY-ADD-COSMOS-EVENT / *SPECIFIED(...)
*SPECIFIED(...)
EIA-INTERRUPT-CLASS = *UNCHANGED / *ANY / list-poss(5): *SVC / *PROGRAM /
*MACHINE-CHECK / *IO / *EXTERNAL
,EIA-SVC-NUMBER = *UNCHANGED / *ANY / list-poss(8): <integer 1..255>
,IO-DEVICE = *UNCHANGED / *ANY / list-poss(8): <alphanum-name 2..4>
,DAB-CACHE-ID = *UNCHANGED / *ANY / list-poss(8): <alphanum-name 1..32>
,MEMORY-CLASS = *UNCHANGED / *ANY / list-poss(4): *3 / *4 / *5 / *6
,SLOT-MEMORY-CLASS = *UNCHANGED / *ANY / list-poss(4): *3 / *4 / *5 / *6
,PEND-CODE = *UNCHANGED / *ANY / list-poss(16): <integer 1..22>
,LOCK-ID = *UNCHANGED / *ANY / list-poss(4): <alphanum-name 1..2>
,TLT-DESCRIPTOR = *UNCHANGED / *ANY / list-poss(8): <alphanum-name 1..3>
,TSKI-SWITCH = *UNCHANGED / *ANY / *TASK
,TSVC-SVC-NUMBER = *UNCHANGED / *ANY / list-poss(8): <integer 1..255>
,UNLOAD = *UNCHANGED / *AT-MEASUREMENT-PROGRAM-STOP / *AT-SM2-STOP
,MEASUREMENT-TIME = *UNCHANGED / *NOT-SPECIFIED / <integer 1..60>
Operands
TITLE =
Specifies the title of the COSMOS monitoring process.
TITLE = *UNCHANGED
The currently specified title is not changed.
TITLE = <c-string 1..80>
The specified title is assigned.
BUFFER-SIZE =
Specifies the number of 4K pages per buffer.
U3585-J-Z125-8-76
85
MODIFY-COSMOS-PARAMETER
Statements for SM2 administrators
BUFFER-SIZE = *UNCHANGED
The currently specified number of pages per buffer is not changed.
BUFFER-SIZE = <integer 1..7>
Buffers of the specified size (number of pages) are created.
NUMBER-OF-BUFFERS =
Specifies the number of buffers.
NUMBER-OF-BUFFERS = *UNCHANGED
The currently specified number of buffers is not changed.
NUMBER-OF-BUFFERS = <integer 2..128>
COSMOS creates the specified number of buffers for writing events.
ADDITIONAL-INFO =
Specifies additional data to be recorded.
ADDITIONAL-INFO = *UNCHANGED
The existing data specified for ADDITIONAL-INFO is not changed.
ADDITIONAL-INFO = *NONE
No additional data is recorded.
ADDITIONAL-INFO = *CONFIGURATION
The configuration at the start of monitoring is also recorded.
ADDITIONAL-INFO = *VM2000(...)
The VM2000 events are also recorded. For this purpose, they must be explicitly opened
(ADD-COSMOS-EVENT statement).
FILE-NAME = <filename 1..54 without-gen-vers>
Specifies the name of the file to which the VM2000 events are written.
OUTPUT =
Specifies how the COSMOS output files are written.
OUTPUT = *UNCHANGED
The currently specified value for OUTPUT is not changed.
OUTPUT = *DISK(...)
The COSMOS monitoring data is written sequentially to the files on hard disk; i.e. there is
a write task for each output file. If a monitoring data buffer is full, a write task is activated
that writes the buffer to the corresponding file.
FILE-NAME = list-poss(16): <filename 1..54 without-gen-vers>
Specifies the file(s) to which the COSMOS monitored data is written.
86
U3585-J-Z125-8-76
Statements for SM2 administrators
MODIFY-COSMOS-PARAMETER
OUTPUT = *WRAP-AROUND(...)
COSMOS monitored data is written to a file on disk. If the disk space allocated (PRIMARYALLOCATION) is insufficient, the file is overwritten from the top. The secondary allocation
(SECONDARY-ALLOCATION) must be set to zero.
FILE-NAME = <filename 1..54 without-gen-vers>
Specifies the file to which COSMOS monitored data is written.
OUTPUT = *TAPE(...)
The COSMOS monitored data is written sequentially to the files on tape (works as
described for OUTPUT=*DISK).
FILE-NAME = list-poss(16): <filename 1..54 without-gen-vers>
Specifies the file(s) to which COSMOS monitored data is written.
OUTPUT = *STREAM-TAPE(...)
The COSMOS output files are written in streaming mode. This reduces the chances of
events not being recorded, because the files are written to the tape continuously without
any repositioning of the tape.
FILE-NAME = list-poss(16): <filename 1..54 without-gen-vers>
Specifies the file(s) to which COSMOS monitored data is written.
TASK-SELECTION =
Specifies the tasks to be monitored.
TASK-SELECTION = *UNCHANGED
The current selection of tasks to be monitored is not changed.
TASK-SELECTION = *ALL
All tasks are monitored.
TASK-SELECTION = *SPECIFIED(...)
Specifies the tasks to be monitored by means of their TSN, user ID, job name, category or
type.
JOB-NAME =
The tasks are selected by means of their job name. An asterisk (*) is also permitted as
the last character in a wildcard specification.
JOB-NAME = *NOT-SPECIFIED
No tasks are selected by means of their job name.
JOB-NAME = list-poss(8): <alphanum-name 1..8 with-wild>
Specifies the job names of the tasks to be monitored.
U3585-J-Z125-8-76
87
MODIFY-COSMOS-PARAMETER
Statements for SM2 administrators
CATEGORY =
The tasks are selected by means of their category. An asterisk (*) is also permitted as
the last character in a wildcard specification.
CATEGORY = *NOT-SPECIFIED
No tasks are selected by means of their category.
CATEGORY = list-poss(8): <alphanum-name 1..7 with-wild>
Specifies the categories of the tasks to be monitored.
USER-ID =
The tasks are selected by means of their user ID.
USER-ID = *NOT-SPECIFIED
No tasks are selected by means of their user ID.
USER-ID = list-poss(8): <alphanum-name 1..8 with-wild>
Specifies the user IDs of the tasks to be monitored. These must be specified without
the “$” sign. An asterisk (*) is also permitted as the last character in a wildcard specification.
TSN =
The tasks are selected by means of their TSN. An asterisk (*) is also permitted as the
last character in a wildcard specification.
TSN = *NOT-SPECIFIED
No tasks are selected by means of their TSN.
TSN = list-poss(16): <alphanum-name 1..4 with-wild>
Specifies the TSNs of the tasks to be monitored.
TYPE =
The tasks are selected by means of their type. An asterisk (*) is also permitted as the
last character in a wildcard specification.
TYPE = *NOT-SPECIFIED
No tasks are selected by means of their type.
TYPE = *SYSTEM
All system tasks are to be monitored.
TYPE = *DIALOG
All interactive tasks are to be monitored.
TYPE = *BATCH
All batch tasks are to be monitored.
TYPE = *TP
All TP tasks are to be monitored.
88
U3585-J-Z125-8-76
Statements for SM2 administrators
MODIFY-COSMOS-PARAMETER
EVENT-SELECTION =
Specifies the events to be recorded. Their recording is linked to specific conditions.
EVENT-SELECTION = *UNCHANGED
The existing values for EVENT-SELECTION are not changed.
EVENT-SELECTION = *ALL-BY-ADD-COSMOS-EVENT
All open events are recorded.
EVENT-SELECTION = *SPECIFIED(...)
Only those events that satisfy the specified conditions are recorded.
EIA-INTERRUPT-CLASS =
Controls the recording of EIA events on the basis of their interrupt class (IC).
EIA-INTERRUPT-CLASS = *UNCHANGED
The currently specified ICs are not changed.
EIA-INTERRUPT-CLASS = *ANY
The recording of EIA events is independent of their IC.
EIA-INTERRUPT-CLASS = list-poss(5): *SVC / *PROGRAM /
*MACHINE-CHECK / *IO / *EXTERNAL
Only those EIA events with the specified IC are recorded.
EIA-SVC-NUMBER =
Controls the recording of EIA events on the basis of their SVC.
EIA-SVC-NUMBER = *UNCHANGED
The currently specified SVCs are not changed.
EIA-SVC-NUMBER = *ANY
The recording of EIA events is independent of their SVC.
EIA-SVC-NUMBER = list-poss(8): <integer 1..255>
Only those EIA events with the specified SVC(s) are recorded.
IO-DEVICE =
Controls the recording of SDV, CHTM, IONQ and PMIO events on the basis of their
mnemonic device name.
IO-DEVICE = *UNCHANGED
The currently specified mnemonic device names are not changed.
IO-DEVICE = *ANY
The recording of SDV, CHTM, IONQ and PMIO events is independent of their
mnemonic device name.
IO-DEVICE = list-poss(8): <alphanum-name 2..4>
Only those SDV, CHTM, IONQ and PMIO events with the specified mnemonic device
names are recorded.
U3585-J-Z125-8-76
89
MODIFY-COSMOS-PARAMETER
Statements for SM2 administrators
DAB-CACHE-ID =
Controls the recording of DAB events on the basis of their DAB cache IDs.
DAB-CACHE-ID = *UNCHANGED
The currently specified DAB cache IDs are not changed.
DAB-CACHE-ID = *ANY
The recording of DAB events is independent of their DAB cache IDs.
DAB-CACHE-ID = list-poss(8): <alphanum-name 1..32>
Only those DAB events with the specified DAB cache IDs are recorded.
MEMORY-CLASS =
Controls the recording of RELM and REQM events on the basis of their memory class.
MEMORY-CLASS = *UNCHANGED
The currently specified memory classes for RELM and REQM events are not changed.
MEMORY-CLASS = *ANY
The recording of RELM and REQM events is independent of their memory class.
MEMORY-CLASS = list-poss(4): *3 / *4 / *5 / *6
Only those RELM and REQM events with the specified memory classes are recorded.
SLOT-MEMORY-CLASS =
Controls the recording of SLOT events on the basis of their memory class.
SLOT-MEMORY-CLASS = *UNCHANGED
The currently specified memory classes for SLOT events are not changed.
SLOT-MEMORY-CLASS = *ANY
The recording of SLOT events is independent of their memory class.
SLOT-MEMORY-CLASS = list-poss(4): *3 / *4 / *5 / *6
Only those SLOT events with the specified memory classes are recorded.
PEND-CODE =
Controls the recording of PEND events on the basis of their pend code.
PEND-CODE = *UNCHANGED
The currently specified pend codes are not changed.
PEND-CODE = *ANY
The recording of PEND events is independent of their pend code.
PEND-CODE = list-poss(16): <integer 1..22>
Only those PEND events with the specified pend code are recorded.
LOCK-ID =
Controls the recording of LOCK events on the basis of their lock ID.
90
U3585-J-Z125-8-76
Statements for SM2 administrators
MODIFY-COSMOS-PARAMETER
LOCK-ID = *UNCHANGED
The currently specified lock IDs are not changed.
LOCK-ID = *ANY
The recording of LOCK events is independent of their lock ID.
LOCK-ID = list-poss(4): <alphanum-name 1..2>
Only those LOCK events with the specified lock IDs are recorded.
TLT-DESCRIPTOR =
Controls the recording of TLT on the basis of their TLT descriptor (TLT = Task Location
Table).
TLT-DESCRIPTOR = *UNCHANGED
The currently specified values for the TLT descriptor are not changed.
TLT-DESCRIPTOR = *ANY
The recording of TLT events is independent of their TLT descriptor.
TLT-DESCRIPTOR = list-poss(8): <alphanum-name 1..3>
Only those TLT events with the specified TLT descriptors are recorded.
TSKI-SWITCH =
Controls the recording of TSKI events on the basis of their TIC (Task in Control).
TSKI-SWITCH = *UNCHANGED
The currently specified value for TSKI-SWITCH is not changed.
TSKI-SWITCH = *ANY
The recording of TSKI events is independent of their TIC.
TSKI-SWITCH = *TASK
Only the first TSKI event of a TIC is recorded.
TSVC-SVC-NUMBER =
Controls the recording of TSVC events on the basis of their SVC numbers.
TSVC-SVC-NUMBER = *UNCHANGED
The currently specified SVC numbers are not changed.
TSVC-SVC-NUMBER = *ANY
The recording of TSVC events is independent of their SVC number.
TSVC-SVC-NUMBER = list-poss(8): <integer 1..255>
The TSVC events are recorded for the specified SVC numbers.
UNLOAD =
Specifies the time at which the COSMOS subsystem is to be unloaded.
UNLOAD = *UNCHANGED
The currently specified value is not changed.
U3585-J-Z125-8-76
91
MODIFY-COSMOS-PARAMETER
Statements for SM2 administrators
UNLOAD = *AT-MEASUREMENT-PROGRAM-STOP
The COSMOS subsystem is unloaded at the end of COSMOS monitoring.
UNLOAD = *AT-SM2-STOP
The COSMOS subsystem is unloaded at the end of SM2 monitoring.
MEASUREMENT-TIME =
Specifies the duration of the monitoring process.
MEASUREMENT-TIME = *UNCHANGED
The currently specified duration is not changed.
MEASUREMENT-TIME = *NOT-SPECIFIED
Monitoring is terminated by the user with the STOP-MEASUREMENT-PROGRAM
statement.
MEASUREMENT-TIME = <integer 1..60>
Specifies the time in minutes after which monitoring is to be terminated automatically.
92
U3585-J-Z125-8-76
Statements for SM2 administrators
MODIFY-MEASUREMENT-PERIODS
MODIFY-MEASUREMENT-PERIODS
Modify SM2 monitoring cycle
Function
This statement is used to modify the SM2 time periods which control the cyclical acquisition
of SM2 monitored data.
Format
MODIFY-MEASUREMENT-PERIODS
OFFLINE-PERIOD = *UNCHANGED / <integer 10..3600>
,ONLINE-PERIOD = *UNCHANGED / *SAME-AS-OFFLINE / <integer 10..3600>
,SAMPLING-PERIOD = *UNCHANGED / <integer 200..10000>
Operands
OFFLINE-PERIOD =
Specifies the SM2 monitoring cycle during which monitored data is collected and written to
a file.
OFFLINE-PERIOD = *UNCHANGED
The monitoring cycle defined here remains unchanged. At the time the program started this
value was defined as 150 seconds.
OFFLINE-PERIOD = <integer 10..3600>
Defines the SM2 monitoring cycle in seconds.
ONLINE-PERIOD =
Specifies the SM2 monitoring cycle during which the monitored data is collected for screen
output and then displayed. The cycle of the background monitoring operations (namely
gathering and writing the monitored data to the SM2 output file) is not changed.
ONLINE-PERIOD = *UNCHANGED
The online cycle remains unchanged. At program start time, this value is set to *SAME-ASOFFLINE, i.e. no separate online cycle is defined.
U3585-J-Z125-8-76
93
MODIFY-MEASUREMENT-PERIODS
Statements for SM2 administrators
ONLINE-PERIOD = *SAME-AS-OFFLINE
The online cycle is the same as for background monitoring. This setting is the optimum
setting for internal management of data. If the online cycle is not required for a longer period
of time, this offline setting is selected.
ONLINE-PERIOD = <integer 10..3600>
Defines an online cycle in seconds.
Note
If the same value is selected for OFFLINE-PERIOD and ONLINE-PERIOD, this is not
the equivalent of "ONLINE-PERIOD = *SAME-AS-OFFLINE". What is does mean is
that internally separate buffers are maintained and provided with data. For reasons
relating to the system load, such a parameter setting should be avoided.
SAMPLING-PERIOD =
Changes the sampling cycle during which samples are taken of some of the SM2 monitored
variables.
SAMPLING-PERIOD = *UNCHANGED
The sampling cycle remains unchanged. At program start time, this value is set to 800 milliseconds.
SAMPLING-PERIOD = <integer 200..10000>
Defines a sampling cycle in milliseconds. Values which are entered are rounded down to
multiples of 100 (milliseconds).
94
U3585-J-Z125-8-76
Statements for SM2 administrators
MODIFY-RESPONSETIME-PARAMETER
MODIFY-RESPONSETIME-PARAMETER
Modify parameters for RESPONSETIME monitoring
Function
This statement is used to modify the RESPONSETIME monitoring program definition.
Format
MODIFY-RESPONSETIME-PARAMETER
SCOPE = *UNCHANGED / list-poss(2): *BUCKET / *CATEGORY
,DEFINITION = *UNCHANGED / *1 / *2
,CONNECTION-NUMBER = *UNCHANGED / <integer 1..8187>
,RESPONSETIME-BUCKETS = *UNCHANGED / *STD-LIMITS / list-poss(5): <integer 1..99999>
,THINKTIME-BUCKETS = *UNCHANGED / *STD-LIMITS / list-poss(5): <integer 1..99999>
,TRANSACTTIME-BUCKETS = *UNCHANGED / *STD-LIMITS / list-poss(5): <integer 1..99999>
,WAITTIME-BUCKETS = *UNCHANGED / *STD-LIMITS / list-poss(5): <integer 1..99999>
Operands
SCOPE =
Defines whether recording of the response time data is to be bucket-specific or categoryspecific.
SCOPE = *UNCHANGED
The scope defined by this time will not be changed.
SCOPE = *BUCKET
The response time data is to be recorded based on buckets.
SCOPE = *CATEGORY
The response time data is to be recorded based on categories.
U3585-J-Z125-8-76
95
MODIFY-RESPONSETIME-PARAMETER
Statements for SM2 administrators
DEFINITION =
Defines the type of response time to be monitored.
DEFINITION = *UNCHANGED
The type of response time defined by this time will not be changed.
DEFINITION = *1
The response time valid is the period between user input and the first relevant output.
DEFINITION = *2
In addition to the response time defined by the value 1, the periods between output following
any entry are output individually as response times.
CONNECTION-NUMBER =
Specifies the maximum number of connections to be monitored.
CONNECTION-NUMBER = *UNCHANGED
The number of connections defined at this time for response time statistics remains
unchanged.
CONNECTION-NUMBER = <integer 1..8187>
The specified maximum number of connections is recorded.
RESPONSETIME-BUCKETS =
Defines the upper limits of up to five ranges (in units of 100 ms) in which the response times
are to be stored by order of magnitude.
RESPONSE-BUCKETS = *UNCHANGED
The currently defined upper limits of the ranges for response times are not changed.
RESPONSE-BUCKETS = *STD-LIMITS
Sets the upper limits of the ranges for responses time to 5, 10, 20, 50 and 100.
RESPONSE-BUCKETS = list-poss(5): <integer 1..99999>
Defines the upper limits of the ranges for response times. These must be specified in
ascending order.
THINKTIME-BUCKETS =
Defines the upper limits of up to five ranges (in units of 100ms) in which the think times are
to be stored by order of magnitude.
THINKTIME-BUCKETS = *UNCHANGED
The currently defined upper limits of the ranges for think times are not changed.
THINKTIME-BUCKETS = *STD-LIMITS
Sets the upper limits of the ranges for think times to 50, 150, 300, 600 and 1200.
THINKTIME-BUCKETS = list-poss(5): <integer 1..99999>
Defines the upper limits of the ranges for think times. These must be specified in ascending
order.
96
U3585-J-Z125-8-76
Statements for SM2 administrators
MODIFY-RESPONSETIME-PARAMETER
TRANSACTTIME-BUCKETS =
Defines the upper limits of up to five ranges (in units of 100ms) in which the transaction
times are to be stored by order of magnitude.
TRANSACTTIME-BUCKETS = *UNCHANGED
The currently defined upper limits of the ranges for transaction times are not changed.
TRANSACTTIME-BUCKETS = *STD-LIMITS
Sets the upper limits of the ranges for transaction times to 5, 10, 20, 50 and 100.
TRANSACTTIME-BUCKETS = list-poss(5): <integer 1..99999>
Defines the upper limits of the ranges for transaction times. These must be specified in
ascending order.
WAITTIME-BUCKETS =
Defines the upper limits of up to five ranges (in units of 100ms) in which the wait times in
the BCAM pool are to be stored by order of magnitude.
WAITTIME-BUCKETS = *UNCHANGED
The currently defined upper limits of the ranges for wait times in the BCAM pool are not
changed.
WAITTIME-BUCKETS =*STD-LIMITS
Sets the upper limits of the ranges for wait times in the BCAM pool to 1, 2, 5, 10 and 20.
WAITTIME-BUCKETS = list-poss(5): <integer 1..99999>
Defines the upper limits of the ranges for wait times in the BCAM pool. These must be
specified in ascending order.
U3585-J-Z125-8-76
97
MODIFY-USER-ADMISSION
Statements for SM2 administrators
MODIFY-USER-ADMISSION
Define authorizations for nonprivileged users
Function
This statement is used by the primary SM2 administrator to specify which users are
permitted to execute user-specific monitoring programs.
Format
MODIFY-USER-ADMISSION
TASK = *UNCHANGED / *ALLOW(...) / *INHIBIT
*ALLOW(...)
USER-ID = *ALL / list-poss(16): <alphanum-name 1..8>
,FILE = *UNCHANGED / *ALLOW(...) / *INHIBIT
*ALLOW(...)
USER-ID = *ALL / list-poss(16): <alphanum-name 1..8>
,ISAM = *UNCHANGED / *ALLOW(...) / *INHIBIT
*ALLOW(...)
USER-ID = *ALL / list-poss(16): <alphanum-name 1..8>
Operands
TASK =
Authorization for user-specific task monitoring is defined.
TASK = *UNCHANGED
The authorization for task monitoring defined at this point in time remains unchanged. At
program start time, user-specific task monitoring is not permitted.
TASK = *ALLOW(...)
User-specific task monitoring is permitted. The BS2000 commands /START-TASKMEASUREMENT and /STOP-TASK-MEASUREMENT are used to activate or deactivate
task monitoring.
98
U3585-J-Z125-8-76
Statements for SM2 administrators
MODIFY-USER-ADMISSION
USER-ID =
Specifies the users for whom task monitoring is permitted. An asterisk (*) is also
permitted as the last character in a wildcard specification.
USER-ID = *ALL
Task monitoring is permitted for all BS2000 users.
USER-ID = list-poss(16): <alphanum-name 1..8>
Task monitoring is permitted for users under the specified user IDs. These must be
specified without the “$” sign.
TASK = *INHIBIT
User-specific task monitoring using the BS2000 commands /START- and /STOP-TASKMEASUREMENT is prohibited. All currently active task monitoring operations are terminated.
FILE =
Authorization for file monitoring by nonprivileged users is defined.
FILE = *UNCHANGED
The authorization for file monitoring defined at this point in time remains unchanged. At
program start time, file monitoring by the nonprivileged user is not permitted.
FILE = *ALLOW(...)
File monitoring is permitted for nonprivileged users. The SM2 FILE statement is used to
activate a file to be monitored.
USER-ID =
Specifies the users for whom file monitoring is permitted.
USER-ID = *ALL
File monitoring is permitted for all BS2000 users.
USER-ID = list-poss(16): <alphanum-name 1..8>
File monitoring is permitted for users under the specified user IDs. These must be
specified without the “$” sign.
FILE = *INHIBIT
File monitoring is prohibited for nonprivileged users.
ISAM =
Authorization for monitoring ISAM pools by nonprivileged users is specified.
ISAM = *UNCHANGED
The authorization for monitoring ISAM pools defined at this point in time remains
unchanged. At program start time, monitoring of ISAM pools by a nonprivileged user is not
permitted.
U3585-J-Z125-8-76
99
MODIFY-USER-ADMISSION
Statements for SM2 administrators
ISAM = *ALLOW(...)
Monitoring of ISAM pools is permitted for nonprivileged users.
USER-ID =
Specifies the users for whom the monitoring of ISAM pools is permitted.
USER-ID = *ALL
Monitoring of ISAM pools is permitted for all BS2000 users.
USER-ID = list-poss(16): <alphanum-name 1..8>
Monitoring of ISAM pools is permitted for users under the specified user IDs. These
must be specified without the “$” sign.
ISAM = *INHIBIT
Monitoring of ISAM pools by means of the START-ISAM-STATISTICS or STOP-ISAMSTATISTICS statement is prohibited. All ISAM pool monitoring operations currently in
progress for nonprivileged SM2 users are terminated.
Notes
100
–
The restriction regarding the maximum number of objects to be monitored is not
changed.
–
If the *INHIBIT parameter is specified to withdraw execution permission from all users,
any objects monitored by a user are automatically deactivated for monitoring purposes.
If the list of user IDs is updated (*ALLOW(USER-ID=...)), users who had previously
started a monitoring operation can complete this operation, i.e. monitoring is not deactivated automatically.
U3585-J-Z125-8-76
Statements for SM2 administrators
OPEN-LOG-FILE
OPEN-LOG-FILE
Open SM2 output file
Function
This statement is used to open an SM2 output file. The current monitoring cycle is interrupted.
Format
OPEN-LOG-FILE
FILE = *STD / *BY-LINK-NAME
,BUFFER-OUTPUT = *NORMAL / *IMMEDIATE
Operands
FILE =
An SM2 output file is opened; it includes the options listed below. If any other SM2 output
file has already been opened at this point in time, it will be closed immediately.
FILE = *STD
A SAM file with the name SM2.hostname.yyyy-mm-dd.sss.nn is opened, where hostname
stands for the name of the system as it appears on the screens, yyyy.mm.dd for the day and
the point in time the file was created, sss for the number of the BS2000 session and nn for
the current number of the SM2 output file within this session (counting from 1). The file is
created under the ID from which the OPEN statement was issued. For information on the
file attributes, see section “Writing to the SM2 output file” on page 195.
FILE = *BY-LINK-NAME
Opens a SAM or PAM file with the name and file attributes previously defined in a ADDFILE-LINK command. The link name SMLINK is to be used.
U3585-J-Z125-8-76
101
OPEN-LOG-FILE
Statements for SM2 administrators
BUFFER-OUTPUT =
Defines file output.
BUFFER-OUTPUT = *NORMAL
A buffer, when full, is always written to a file.
BUFFER-OUTPUT = *IMMEDIATE
At the end of each monitoring cycle, a record for identifying the end of the cycle is written,
after which the output buffer is output immediately. Even buffers which are not completely
filled with data are output. This could lead to block corruption. Consequently, a file
generated in this way should not be processed using SM2U1; the sections of the block not
filled with data are removed in this case. This method of file output should be employed
when using SM2R1-PC and SM2ONLINE-PC V1.0, but it is no longer required for
SM2ONLINE-PC V2.0 or later.
102
U3585-J-Z125-8-76
Statements for SM2 administrators
REMOVE-BCAM-CONNECTION-SET
REMOVE-BCAM-CONNECTION-SET
Exclude connection set(s) from BCAM-CONNECTION
monitoring
Function
This statement is used to define the connection set(s) to be removed from the
BCAM-CONNECTION monitoring program definition.
Format
REMOVE-BCAM-CONNECTION-SET
SET-NAME = *ALL / <alphanum-name 1..16>
Operands
SET-NAME =
Specifies the name of the connection set to be removed from the monitoring program
definition.
SET-NAME = *ALL
All connection sets previously included in the monitoring process are now to be excluded.
SET-NAME = <alphanum-name 1..16>
Name of the connection set to be excluded from the monitoring process.
U3585-J-Z125-8-76
103
REMOVE-CONNECTION-SET
Statements for SM2 administrators
REMOVE-CONNECTION-SET
Exclude connection set(s) from RESPONSETIME monitoring
Function
This statement is used to define the connection set(s) to be removed from the
RESPONSETIME monitoring program definition. The connection set *GLOBAL (see also
ADD-CONNECTION-SET) cannot be removed.
Format
REMOVE-CONNECTION-SET
SET-NAME = *ALL / <alphanum-name 1..16>
Operands
SET-NAME =
SET-NAME = *ALL
All connection sets (apart from *GLOBAL) previously included in the monitoring process are
now to be excluded.
SET-NAME = <alphanum-name 1..16>
Name of the connection set to be excluded from the monitoring process.
104
U3585-J-Z125-8-76
Statements for SM2 administrators
REMOVE-COSMOS-EVENT
REMOVE-COSMOS-EVENT
Remove events from COSMOS monitoring parameters
Function
This statement is used to define events which are to be removed from the COSMOS
monitoring program definition.
Format
REMOVE-COSMOS-EVENT
EVENT-NAME = *STANDARD-EVENTS / *ALL / list-poss(67): *STANDARD-EVENTS / *ACF / *BCAM /
*BCPT / *BLS / *BOUR / *CHTM / *CMD / *CMS / *DAB / *DCAM / *DLM / *EIA / *EIA2 /
*EIA3 / *FITC / *GSAC / *HAL / *IDLE / *INTR / *IONQ / *ISEV / *ISPL / *KAI / *LOCK / *MSG / *NSM /
*PAGE / *PAM / *PCCC / *PCTC / *PDEA / *PEND / *PIO / *PMIO / *PRGS / *PRGT /
*PRTY / *RELM / *REQM / *SDV / *SLOT / *SNAP / *STD1 / *STDI / *STDN / *SVC /
*TGMA / *TGMP / *TGMT / *TIC / *TINF / *TLM / *TLT / *TSKI / *TSVC / *UTM / *VMCH / *VMH /
*VMI / *VMLK / *VMPD / *VMPR / *VMS / *VM2 / *WSCT / *XEIA
Operands
EVENT-NAME =
Specifies the names of the events to be removed from the monitoring program definition.
EVENT-NAME = *STANDARD-EVENTS
The following standard events are to be removed from the monitoring program definition:
ACF, BLS, BOUR, CHTM, CMS, DAB, EIA2, EIA3, FITC, IDLE, INTR, IONQ, PAGE, PAM,
PCCC, PCTC, PEND, PMIO, PRGS, PRGT, RELM, REQM, SDV, SVC, TSKI, TSVC, WSCT.
EVENT-NAME = *ALL
All events - except the mandatory events CREA, DEST, INIT, LGON, MMRC, PTSK and
STAT - are removed from the monitoring program definition.
U3585-J-Z125-8-76
105
REMOVE-COSMOS-EVENT
Statements for SM2 administrators
EVENT-NAME = list-poss(67): *STANDARD-EVENTS / *ACF / *BCAM / *BCPT /
*BLS / *BOUR / *CHTM / *CMD / *CMS / *DAB / *DCAM / *DLM / *EIA / *EIA2 /
*EIA3 / *FITC / *GSAC / *HAL / *IDLE / *INTR / *IONQ / *ISEV / *ISPL / *KAI / *LOCK /
*MSG / *NSM / *PAGE / *PAM / *PCCC / *PCTC / *PDEA / *PEND / *PIO / *PMIO /
*PRGS / *PRGT / *PRTY / *RELM / *REQM / *SDV / *SLOT / *SNAP / *STD1 / *STDI /
*STDN / *SVC / *TGMA / *TGMP / *TGMT / *TIC / *TINF / *TLM / *TLT / *TSKI / *TSVC /
*UTM / *VMCH / *VMH / *VMI / *VMLK / *VMPD / *VMPR / *VMS / *VM2 / *WSCT / *XEIA
The events specified in the list are removed from the monitoring program definition.
The mandatory events CREA, DEST, INIT, LGON, MMRC, PTSK and STAT are not
removed.
106
U3585-J-Z125-8-76
Statements for SM2 administrators
REMOVE-FILE
REMOVE-FILE
Remove file(s) from FILE monitoring parameters
Function
This statement is used to define the file(s) to be removed from the FILE monitoring program
definition.
Format
REMOVE-FILE
FILE-NAME = *ALL / <filename 1..54>
Operands
FILE-NAME =
FILE-NAME = *ALL
All files previously included in the monitoring process are now to be excluded.
FILE-NAME = <filename 1..54>
Specifies the name of the file to be excluded from the monitoring process. The name
specified must be the fully qualified name.
U3585-J-Z125-8-76
107
REMOVE-ISAM-POOL
Statements for SM2 administrators
REMOVE-ISAM-POOL
Remove ISAM pool(s) from ISAM monitoring parameters
Function
This statement is used to define the ISAM pool(s) to be removed from the ISAM monitoring
program definition.
Format
REMOVE-ISAM-POOL
POOL-NAME = *ALL / <alphanum-name 1..8>
,SCOPE = *ANY / *HOST-SYSTEM / *TASK(...) / *USER(...)
*TASK(...)
TSN = <alphanum-name 1..4>
*USER(...)
USER-ID = <alphanum-name 1..8>
,CAT-ID = *ANY / *HOME-PVS / <cat-id 1..4>
Operands
POOL-NAME =
POOL-NAME = *ALL
All ISAM pools previously included in the monitoring process are now to be excluded. The
SCOPE and CAT-ID entries are disregarded in this case.
POOL-NAME = <alphanum-name 1..8>
Specifies the name of the ISAM pool to be excluded from the monitoring process.
SCOPE =
Defines the type of ISAM pool to be excluded.
SCOPE = *ANY
Global, task-specific, and user-specific pools are to be excluded.
SCOPE = *HOST-SYSTEM
The pool is a global ISAM pool.
108
U3585-J-Z125-8-76
Statements for SM2 administrators
REMOVE-ISAM-POOL
SCOPE = *TASK(...)
The pool is a task-specific ISAM pool.
TSN = <alphanum-name 1..4>
Specifies the TSN of the task under which the task-specific ISAM pool has been set up.
SCOPE = *USER(...)
The pool is a user-specific ISAM pool.
USER-ID = <alphanum-name 1..8>
Specifies the user ID under which the ISAM pool has been set up. This must be
specified without the “$” sign.
CAT-ID =
Specifies the catalog ID of the public volume set to which the ISAM pool has been assigned.
CAT-ID = *ANY
Pools with any catalog ID are to be excluded.
CAT-ID = *HOME-PVS
The catalog ID is the catalog ID of the home pubset.
CAT-ID = <cat-id 1..4>
Catalog ID of the public volume set to which the ISAM pool is assigned.
U3585-J-Z125-8-76
109
SELECT-HOSTS
Statements for SM2 administrators
SELECT-HOSTS
Define hosts for SM2 statements and screen output
Function
This statement is used to define the hosts for which SM2 administration statements are to
apply and for which screens are to be output. If reports are output, the selected remote
hosts send their monitored data to the local host.
The statement only works locally for the user who issues it. Any caller with administration
rights can define his or her own list of hosts. The END statement deletes the definition.
Format
SELECT-HOSTS
HOST-NAME = *ALL / *LOCAL / list-poss(16): <alphanum-name 1..8>
,PARTNER-TYPE = *XCS / *CCS
Operands
HOST-NAME =
Specifies the appropriate host names.
HOST-NAME = *ALL
Selects all hosts.
HOST-NAME = *LOCAL
Selects the user’s own host.
HOST-NAME = list-poss(16): <alphanum-name 1..8>
Selects the hosts specified via the host names.
PARTNER-TYPE =
Specifies the MSCF-specific partner type of the host.
PARTNER-TYPE = *XCS
Selects hosts of partner type XCS.
PARTNER-TYPE = *CCS
Selects hosts of partner type CCS.
110
U3585-J-Z125-8-76
Statements for SM2 administrators
SELECT-HOSTS
Note
The host name uniquely identifies a host in a processor network. This name must be
specified in the SELECT-HOSTS statement and is output on the screens as the host
name.
Note that when an HIPLEX MSCF connection is set up, a processor name must be
specified.
The processor name can be different from the host name. The processor name only
identifies a system locally for one other system, not globally for the whole network.
The host name is the same as the local processor name.
U3585-J-Z125-8-76
111
SET-BCAM-CONNECTION-PARAMETER
Statements for SM2 administrators
SET-BCAM-CONNECTION-PARAMETER
Define BCAM-CONNECTION monitoring parameters
Function
This statement is used to define the global monitoring parameters for the
BCAM-CONNECTION monitoring program.
Format
SET-BCAM-CONNECTION-PARAMETER
INWAIT-BUCKETS = *STD-LIMITS / *UNCHANGED / list-poss(4):<integer 1..999999>
,REACT-BUCKETS = *STD-LIMITS / *UNCHANGED / list-poss(4):<integer 1..999999>
,INPROC-BUCKETS = *STD-LIMITS / *UNCHANGED / list-poss(4):<integer 1..999999>
,OUTPROC-BUCKETS = *STD-LIMITS / *UNCHANGED / list-poss(4):<integer 1..999999>
Operands
INWAIT-BUCKETS =
Defines the upper limits of up to four ranges (in units of 1 ms) in which the INWAIT times
are to be stored by order of magnitude.
INWAIT-BUCKETS = *STD-LIMITS
Sets the upper limits of the ranges for INWAIT times to 100, 200, 500 and 1000 ms.
INWAIT-BUCKETS = *UNCHANGED
The upper limits of the ranges for INWAIT times currently defined in BCAM are not changed.
INWAIT-BUCKETS = list-poss(4): <integer 1..999999>
Defines the upper limits of the ranges for INWAIT times. These must be specified in
ascending order.
REACT-BUCKETS =
Defines the upper limits of up to four ranges (in units of 1 ms) in which the REACT times
are to be stored by order of magnitude.
REACT-BUCKETS = *STD-LIMITS
Sets the upper limits of the ranges for REACT times to 500, 1000, 2000 and 4000.
REACT-BUCKETS = *UNCHANGED
The upper limits of the ranges for REACT times currently defined in BCAM are not changed.
112
U3585-J-Z125-8-76
Statements for SM2 administrators
SET-BCAM-CONNECTION-PARAMETER
REACT-BUCKETS = list-poss(4):<integer 1..999999>
Defines the upper limits of the ranges for REACT times. These must be specified in
ascending order.
INPROC-BUCKETS =
Defines the upper limits of up to four ranges (in units of 1 ms) in which the INPROC times
are to be stored by order of magnitude.
INPROC-BUCKETS = *STD-LIMITS
Sets the upper limits of the ranges for INPROC times to 100, 200, 500 and 1000 ms.
INPROC-BUCKETS = *UNCHANGED
The upper limits of the ranges for INPROC times currently defined in BCAM are not
changed
INPROC-BUCKETS = list-poss(4):<integer 1..999999>
Defines the upper limits of the ranges for INPROC times. These must be specified in
ascending order.
OUTPROC-BUCKETS =
Defines the upper limits of up to four ranges (in units of 1 ms) in which the OUTPROC times
are to be stored by order of magnitude.
OUTPROC-BUCKETS = *STD-LIMITS
Sets the upper limits of the ranges for OUTPROC times to 100, 200, 500 and 1000 ms.
OUTPROC-BUCKETS = *UNCHANGED
The upper limits of the ranges for OUTPROC times currently defined in BCAM are not
changed.
OUTPROC-BUCKETS = list-poss(4):<integer 1..999999>
Defines the upper limits of the ranges for REACT times. These must be specified in
ascending order.
U3585-J-Z125-8-76
113
SET-CHANNEL-IO-PARAMETER
Statements for SM2 administrators
SET-CHANNEL-IO-PARAMETER
Define CHANNEL-IO monitoring parameters
Function
This statement is used to define the channels for the CHANNEL-IO monitoring program.
Format
SET-CHANNEL-IO-PARAMETER
CHANNELS = *ALL / list-poss(64): <x-string 1..4>
Operands
CHANNELS =
CHANNELS = *ALL
All channels are to be monitored.
CHANNELS = list-poss(64): <x-string 1..4>
Specifies the channel addresses (channel path IDs) of the channels to be monitored. A
check is carried out to establish whether these channels are defined in the configuration.
114
U3585-J-Z125-8-76
Statements for SM2 administrators
SET-COSMOS-PARAMETER
SET-COSMOS-PARAMETER
Define COSMOS monitoring parameters
Function
This statement is used to define the monitoring parameters for the COSMOS monitoring
program. The mandatory events CREA, DEST, INIT, LGON, MMRC, PTSK and STAT are
defined automatically. Events specified beforehand with the ADD-COSMOS-EVENT
statement remain in the monitoring program definition.
The files specified with OUTPUT and ADDITIONAL-INFO=*VM2000 must already be
created.
The PRIMARY-ALLOCATION value of the SPACE operand (CREATE-FILE command) must
be at least twice the specified number of buffers for writing the events (NUMBER-OFBUFFERS) when creating the COSMOS output file(s).
The SECONDARY-ALLOCATION value of the SPACE operand (CREATE-FILE command)
must be set to zero when creating the COSMOS output file for WRAP-AROUND.
Format
(part 1 of 2)
SET-COSMOS-PARAMETER
TITLE = C ’COSMOS’ / <c-string 1..80>
,BUFFER-SIZE = 2 / <integer 1..7>
,NUMBER-OF-BUFFERS = 2 / <integer 2..128>
,ADDITIONAL-INFO = *CONFIGURATION / *NONE / list-poss(2): *CONFIGURATION / *VM2000(...)
*VM2000(...)
FILE-NAME = <filename 1..54 without-gen-vers>
,OUTPUT = *DISK (...) / *WRAP-AROUND(...) / *TAPE(...) / *STREAM-TAPE(...)
*DISK(...)
FILE-NAME = list-poss(16): <filename 1..54 without-gen-vers>
*WRAP-AROUND(...)
FILE-NAME = <filename 1..54 without-gen-vers>
Continued ➠
U3585-J-Z125-8-76
115
SET-COSMOS-PARAMETER
Statements for SM2 administrators
(part 2 of 2)
*TAPE(...)
FILE-NAME = list-poss(16): <filename 1..54 without-gen-vers>
*STREAM-TAPE(...)
FILE-NAME = list-poss(16): <filename 1..54 without-gen-vers>
,TASK-SELECTION = *ALL / *SPECIFIED(...)
*SPECIFIED(...)
JOB-NAME = *NOT-SPECIFIED / list-poss(8): <alphanum-name 1..8 with-wild>
,CATEGORY = *NOT-SPECIFIED / list-poss(8): <alphanum-name 1..7 with-wild>
,USER-ID = *NOT-SPECIFIED / list-poss(8): <alphanum-name 1..8 with-wild>
,TSN = *NOT-SPECIFIED / list-poss(16): <alphanum-name 1..4 with-wild>
,TYPE = *NOT-SPECIFIED / list-poss(4): *SYSTEM / *BATCH / *DIALOG / *TP
,EVENT-SELECTION = *ALL-BY-ADD-COSMOS-EVENT / *SPECIFIED(...)
*SPECIFIED(...)
EIA-INTERRUPT-CLASS = *ANY / list-poss(5): *SVC / *PROGRAM / *MACHINE-CHECK / *IO /
*EXTERNAL
,EIA-SVC-NUMBER = *ANY / list-poss(8): <integer 1..255>
,IO-DEVICE = *ANY / list-poss(8): <alphanum-name 2..4>
,DAB-CACHE-ID = *ANY / list-poss(8): <alphanum-name 1..32>
,MEMORY-CLASS = *ANY / list-poss(4): *3 / *4 / *5 / *6
,SLOT-MEMORY-CLASS = *ANY / list-poss(4): *3 / *4 / *5 / *6
,PEND-CODE = *ANY / list-poss(16): <integer 1..22>
,LOCK-ID = *ANY / list-poss(4): <alphanum-name 1..2>
,TLT-DESCRIPTOR = *ANY / list-poss(8): <alphanum-name 1..3>
,TSKI-SWITCH = *ANY / *TASK
,TSVC-SVC-NUMBER = *ANY / list-poss(8): <integer 1..255>
,UNLOAD = *AT-MEASUREMENT-PROGRAM-STOP / *AT-SM2-STOP
,MEASUREMENT-TIME = *NOT-SPECIFIED / <integer 1..60>
116
U3585-J-Z125-8-76
Statements for SM2 administrators
SET-COSMOS-PARAMETER
Operands
TITLE =
Specifies the title of the COSMOS monitoring process.
TITLE = C’COSMOS’
Sets the title of the COSMOS monitoring process to “COSMOS”.
TITLE = <c-string 1..80>
Sets the title of the COSMOS monitoring process to the value specified here.
BUFFER-SIZE =
Specifies the number of 4K pages per buffer.
BUFFER-SIZE = 2
The buffers created have a default size of two pages.
BUFFER-SIZE = <integer 1..7>
The buffers created have the specified number of pages.
NUMBER-OF-BUFFERS =
Specifies the number of buffers.
NUMBER-OF-BUFFERS = 2
By default, two buffers are created for writing events.
NUMBER-OF-BUFFERS = <integer 2..128>
COSMOS creates the specified number of buffers for writing the events.
ADDITIONAL-INFO =
Specifies the additional data to be recorded.
ADDITIONAL-INFO = *CONFIGURATION
The configuration at the start of monitoring is also recorded.
ADDITIONAL-INFO = *NONE
No additional data is recorded.
ADDITIONAL-INFO = *VM2000(...)
The VM2000 events are also recorded. For this purpose, they must be explicitly opened
(ADD-COSMOS-EVENT statement).
FILE-NAME = <filename 1..54 without-gen-vers>
Specifies the name of the file to which the VM2000 events are written.
OUTPUT =
Specifies how the COSMOS output files are written. The files must have already been
created. File link names are no longer necessary.
U3585-J-Z125-8-76
117
SET-COSMOS-PARAMETER
Statements for SM2 administrators
OUTPUT = *DISK(...)
The COSMOS monitored data is written sequentially to the files on hard disk; i.e. there is
one write task for each output file. If a monitored data buffer is full, a write task is activated
that writes the buffer to the appropriate file.
FILE-NAME = list-poss(16): <filename 1..54 without-gen-vers>
Specifies the file(s) to which the COSMOS monitored data is written.
OUTPUT = *WRAP-AROUND(...)
COSMOS monitored data is written to a file on disk. If the disk space allocated (PRIMARYALLOCATION) is insufficient, the file is overwritten from the top. The secondary allocation
(SECONDARY-ALLOCATION) must be set to zero.
FILE-NAME = <filename 1..54 without-gen-vers>
Specifies the file to which COSMOS monitored data is written.
OUTPUT = *TAPE(...)
The COSMOS monitored data is written sequentially to the files on tape (this works as
described for OUTPUT=*DISK).
FILE-NAME = list-poss(16): <filename 1..54 without-gen-vers>
Specifies the file(s) to which COSMOS monitored data is written.
OUTPUT = *STREAM-TAPE(...)
The COSMOS output files are written in streaming mode. This reduces the chances of
events not being recorded, because the files are written to the tape continuously without
any repositioning of the tape.
FILE-NAME = list-poss(16): <filename 1..54 without-gen-vers>
Specifies the file(s) to which COSMOS monitored data is written.
TASK-SELECTION =
Specifies the tasks to be monitored.
TASK-SELECTION = *ALL
All tasks are monitored.
TASK-SELECTION = *SPECIFIED(...)
Specifies the tasks to be monitored by means of their TSN, user ID, job name, category or
type.
JOB-NAME =
The tasks are selected by means of their job name.
JOB-NAME = *NOT-SPECIFIED
No tasks are selected by means of their job name.
JOB-NAME = list-poss(8): <alphanum-name 1..8 with-wild>
Specifies the job names of the tasks to be monitored. An asterisk (*) is also permitted
as the last character in a wildcard specification.
118
U3585-J-Z125-8-76
Statements for SM2 administrators
SET-COSMOS-PARAMETER
CATEGORY =
The tasks are selected by means of their category.
CATEGORY = *NOT-SPECIFIED
No tasks are selected by means of their category.
CATEGORY = list-poss(8): <alphanum-name 1..7 with-wild>
Specifies the categories of the tasks to be monitored. An asterisk (*) is also permitted
as the last character in a wildcard specification.
USER-ID =
The tasks are selected by means of their user ID.
USER-ID = *NOT-SPECIFIED
No tasks are selected by means of their user ID.
USER-ID = list-poss(8): <alphanum-name 1..8 with-wild>
Specifies the user IDs of the tasks to be monitored. These must be specified without
the “$” sign. An asterisk (*) is also permitted as the last character in a wildcard specification.
TSN =
The tasks are selected by means of their TSN.
TSN = *NOT-SPECIFIED
No tasks are selected by means of their TSN.
TSN = list-poss(16): <alphanum-name 1..4 with-wild>
Specifies the TSNs of the tasks to be monitored. An asterisk (*) is also permitted as the
last character in a wildcard specification.
TYPE =
The tasks are selected by means of their type.
TYPE = *NOT-SPECIFIED
No tasks are selected by means of their type.
TYPE = *SYSTEM
All system tasks are to be monitored.
TYPE = *BATCH
All batch tasks are to be monitored.
TYPE = *DIALOG
All interactive tasks are to be monitored.
TYPE = *TP
All TP tasks are to be monitored.
EVENT-SELECTION =
Specifies the events to be recorded. Their recording is linked to specific conditions.
U3585-J-Z125-8-76
119
SET-COSMOS-PARAMETER
Statements for SM2 administrators
EVENT-SELECTION = *ALL-BY-ADD-COSMOS-EVENT
All open events are recorded.
EVENT-SELECTION = *SPECIFIED(...)
Only those events that satisfy the specified conditions are recorded.
EIA-INTERRUPT-CLASS =
Controls the recording of EIA events on the basis of their interrupt class (IC).
EIA-INTERRUPT-CLASS = *ANY
The recording of EIA events is independent of their IC.
EIA-INTERRUPT-CLASS = list-poss(5): *SVC / *PROGRAM /
*MACHINE-CHECK / *IO / *EXTERNAL
Only those EIA events with the specified IC are recorded.
EIA-SVC-NUMBER =
Controls the recording of EIA events on the basis of their SVC.
EIA-SVC-NUMBER = *ANY
The recording of EIA events is independent of their SVC.
EIA-SVC-NUMBER = list-poss(8): <integer 1..255>
Only those EIA events with the specified SVC(s) are recorded.
IO-DEVICE =
Controls the recording of SDV, CHTM, IONQ, and PMIO events on the basis of their
mnemonic device name.
IO-DEVICE = *ANY
The recording of SDV, CHTM, IONQ, and PMIO events is independent of their
mnemonic device name.
IO-DEVICE = list-poss(8): <alphanum-name 2..4>
Only those SDV, CHTM, IONQ, and PMIO events with the specified mnemonic device
names are recorded.
DAB-CACHE-ID =
Controls the recording of DAB events on the basis of their DAB cache IDs.
DAB-CACHE-ID = *ANY
The recording of DAB events is independent of their DAB cache IDs.
DAB-CACHE-ID = list-poss(8): <alphanum-name 1..32>
Only those DAB events with the specified DAB cache IDs are recorded.
MEMORY-CLASS =
Controls the recording of RELM and REQM events on the basis of their memory class.
MEMORY-CLASS = *ANY
Only those RELM and REQM events with the specified memory classes are recorded.
120
U3585-J-Z125-8-76
Statements for SM2 administrators
SET-COSMOS-PARAMETER
SLOT-MEMORY-CLASS =
Controls the recording of SLOT events on the basis of their memory class.
SLOT-MEMORY-CLASS = *ANY
The recording of SLOT events is independent of their memory class.
SLOT-MEMORY-CLASS = list-poss(4): *3 / *4 / *5 / *6
Only those SLOT events with the specified memory classes are recorded.
PEND-CODE =
Controls the recording of PEND events on the basis of their pend code.
PEND-CODE = *ANY
The recording of PEND events is independent of their pend code.
PEND-CODE = list-poss(16): <integer 1..22>
Only those PEND events with the specified pend code are recorded.
LOCK-ID =
Controls the recording of LOCK events on the basis of their lock ID.
LOCK-ID = *ANY
The recording of LOCK events is independent of their lock ID.
LOCK-ID = list-poss(4): <alphanum-name 1..2>
Only those LOCK events with the specified lock IDs are recorded.
TLT-DESCRIPTOR =
Controls the recording of TLT on the basis of their TLT descriptor (TLT = Task Location
Table).
TLT-DESCRIPTOR = *ANY
The recording of TLT events is independent of their TLT descriptor.
TLT-DESCRIPTOR = list-poss(8): <alphanum-name 1..3>
Only those TLT events with the specified TLT descriptors are recorded.
TSKI-SWITCH =
Controls the recording of TSKI events on the basis of their TIC (Task in Control).
TSKI-SWITCH = *ANY
The recording of TSKI events is independent of their TIC.
TSKI-SWITCH = *TASK
Only the first TSKI event of a TIC is recorded.
TSVC-SVC-NUMBER =
Controls the recording of TSVC events on the basis of their SVC numbers.
TSVC-SVC-NUMBER = *ANY
The recording of TSVC events is independent of their SVC number.
U3585-J-Z125-8-76
121
SET-COSMOS-PARAMETER
Statements for SM2 administrators
TSVC-SVC-NUMBER = list-poss(8): <integer 1..255>
The TSVC events are recorded for the specified SVC numbers.
UNLOAD =
Specifies the time at which the COSMOS subsystem is to be unloaded.
UNLOAD = *AT-MEASUREMENT-PROGRAM-STOP
The COSMOS subsystem is unloaded at the end of COSMOS monitoring.
UNLOAD = *AT-SM2-STOP
The COSMOS subsystem is unloaded at the end of SM2 monitoring.
MEASUREMENT-TIME =
Specifies the duration of the monitoring process.
MEASUREMENT-TIME = *NOT-SPECIFIED
Monitoring is terminated by the user with the STOP-MEASUREMENT-PROGRAM
statement.
MEASUREMENT-TIME = <integer 1..60>
Specifies the time in minutes after which monitoring should be terminated automatically.
122
U3585-J-Z125-8-76
Statements for SM2 administrators
SET-DISK-PARAMETER
SET-DISK-PARAMETER
Define DISK monitoring parameters
Function
This statement is used to define the disk devices for the DISK monitoring program.
Format
SET-DISK-PARAMETER
DEVICES = list-poss(256): <alphanum-name 2..4 with-wild>
Operands
DEVICES = list-poss(256): <alphanum-name 2..4 with-wild>
Specifies the mnemonic device names of the disk devices to be monitored. A check is
carried out to establish whether these disk devices are defined in the configuration and are
in the “attached” state. An asterisk (*) is also permitted as the last character in a wildcard
specification.
Note
Up to 256 devices are monitored. If partial qualification means than more than 256
devices are defined, these are selected in the following order of priority:
–
–
–
U3585-J-Z125-8-76
devices whose mnemonic device names have been specified in their entirety
devices whose mnemonic device names have been specified in partially qualified
form
the sequence in the PDT (Physical Device Table)
123
SET-DISK-FILE-PARAMETER
Statements for SM2 administrators
SET-DISK-FILE-PARAMETER
Define DISK-FILE monitoring parameters
Function
This statement is used to define the disk devices for the DISK-FILE monitoring program.
Format
SET-DISK-FILE-PARAMETER
DEVICES = list-poss(8): <alphanum-name 2..4>
Operands
DEVICES = list-poss(8): <alphanum-name 2..4>
Specifies the mnemonic device names of the disk devices to be monitored. A check is
carried out to establish whether these disk devices are defined in the configuration.
124
U3585-J-Z125-8-76
Statements for SM2 administrators
SET-PERIODIC-TASK-PARAMETER
SET-PERIODIC-TASK-PARAMETER
Define PERIODIC-TASK monitoring parameters
Function
This statement is used to define the tasks from which monitored data is to be written to the
SM2 output file for the PERIODIC-TASK monitoring program.
Format
SET-PERIODIC-TASK-PARAMETER
LOG-TASKS = *NONE / *ALL / *SPECIFIED(...)
*SPECIFIED(...)
USER-ID = *NOT-SPECIFIED / list-poss(64): <alphanum-name 1..8>
,JOB-NAME = *NOT-SPECIFIED / list-poss(64): <alphanum-name 1..8>
Operands
LOG-TASKS =
Specifies the tasks for which monitored data is to be written to the SM2 output file.
LOG-TASKS = *NONE
No records are written to the SM2 output file.
LOG-TASKS = *ALL
Monitored data on all tasks is written to the SM2 output file.
LOG-TASKS = *SPECIFIED(...)
Monitored data on selected tasks is written to the SM2 output file.
USER-ID =
Tasks are selected on the basis of their user ID.
USER-ID = *NOT-SPECIFIED
Tasks are not selected on the basis of their user ID.
USER-ID = list-poss(64): <alphanum-name 1..8>
Monitored data on the tasks with the specified user IDs is written to the SM2 output file.
These user IDs must be specified without the “$” sign.
U3585-J-Z125-8-76
125
SET-PERIODIC-TASK-PARAMETER
Statements for SM2 administrators
JOB-NAME =
Tasks are selected on the basis of their job names.
JOB-NAME = *NOT-SPECIFIED
Tasks are not selected on the basis of their job names.
JOB-NAME = list-poss(64): <alphanum-name 1..8>
Monitored data on the tasks with the specified job names is written to the SM2 output
file.
126
U3585-J-Z125-8-76
Statements for SM2 administrators
SET-RESPONSETIME-PARAMETER
SET-RESPONSETIME-PARAMETER
Define RESPONSETIME monitoring parameters
Function
This statement is used to define the monitoring parameters for the RESPONSETIME
monitoring program.
Format
SET-RESPONSETIME-PARAMETER
SCOPE = *BUCKET / list-poss(2): *BUCKET / *CATEGORY
,DEFINITION = *1 / *2
,CONNECTION-NUMBER = *1024 / <integer 1..8187>
,RESPONSETIME-BUCKETS = *STD-LIMITS / list-poss(5): <integer 1..99999>
,THINKTIME-BUCKETS = *STD-LIMITS / list-poss(5): <integer 1..99999>
,TRANSACTTIME-BUCKETS = *STD-LIMITS / list-poss(5): <integer 1..99999>
,WAITTIME-BUCKETS = *STD-LIMITS / list-poss(5): <integer 1..99999>
Operands
SCOPE =
Defines whether the response time data is to be recorded by bucket or by category.
SCOPE = *BUCKET
The response time data is to be recorded by bucket.
SCOPE = *CATEGORY
The response time data is to be recorded by category.
U3585-J-Z125-8-76
127
SET-RESPONSETIME-PARAMETER
Statements for SM2 administrators
DEFINITION =
Defines the type of response time to be monitored.
DEFINITION = *1
This response time is the time between user input and the next output operation.
DEFINITION = *2
In addition to the response time defined with 1, the times between follow-up output operations to an input are recorded individually as response times.
CONNECTION-NUMBER =
Defines the maximum number of connections to be monitored.
CONNECTION-NUMBER = *1024
A maximum of 1024 connections are recorded.
CONNECTION-NUMBER = <integer 1..8187>
The maximum specified number of connections is recorded.
RESPONSETIME-BUCKETS =
Defines the upper limits of up to five ranges (in units of 100ms) in which the response times
are to be stored by order of magnitude.
RESPONSETIME-BUCKETS = *STD-LIMITS
Sets the upper limits of the ranges for response times to 5, 10, 20, 50 and 100.
RESPONSETIME-BUCKETS = list-poss(5): <integer 1..99999>
Defines the upper limits of the ranges for response times. These must be specified in
ascending order.
THINKTIME-BUCKETS =
Defines the upper limits of up to five ranges (in units of 100ms) in which the think times are
to be stored by order of magnitude.
THINKTIME-BUCKETS = *STD-LIMITS
Sets the upper limits of the ranges for think times to 50, 150, 300, 600 and 1200.
THINKTIME-BUCKETS = list-poss(5): <integer 1..99999>
Defines the upper limits of the ranges for think times. These must be specified in ascending
order.
128
U3585-J-Z125-8-76
Statements for SM2 administrators
SET-RESPONSETIME-PARAMETER
TRANSACTTIME-BUCKETS =
Defines the upper limits of up to five ranges (in units of 100ms) in which the transaction
times are to be stored by order of magnitude.
TRANSACTTIME-BUCKETS = *STD-LIMITS
Sets the upper limits of the ranges for transaction times to 5, 10, 20, 50 and 100.
TRANSACTTIME-BUCKETS = list-poss(5): <integer 1..99999>
Defines the upper limits of the ranges for transaction times. These must be specified in
ascending order.
WAITTIME-BUCKETS =
Defines the upper limits of up to five ranges (in units of 100ms) in which the wait times in
the BCAM pool are to be stored by order of magnitude.
WAITTIME-BUCKETS = *STD-LIMITS
Sets the upper limits of the ranges for wait times in the BCAM pool to 1, 2, 5, 10 and 20.
WAITTIME-BUCKETS = list-poss(5): <integer 1..99999>
Defines the upper limits of the ranges for wait times in the BCAM pool. These must be
specified in ascending order.
U3585-J-Z125-8-76
129
SET-SERVICETIME-PARAMETER
Statements for SM2 administrators
SET-SERVICETIME-PARAMETER
Define SERVICETIME monitoring parameters
Function
This statement is used to define the devices for the SERVICETIME monitoring program.
Format
SET-SERVICETIME-PARAMETER
DEVICES = list-poss(256): <alphanum-name 2..4 with-wild>
Operands
DEVICES = list-poss(256): <alphanum-name 2..4 with-wild>
Specifies the mnemonic device names of the devices to be monitored. A check is carried
out to establish whether these devices are defined in the configuration. An asterisk (*) is
also permitted as the last character in a wildcard specification.
Note
Up to 256 devices are monitored. If partial qualification means that more than 256
devices are defined, these are selected in the following order of priority:
–
–
–
130
devices whose mnemonic device names have been specified in their entirety
devices whose mnemonic device names have been specified in partially qualified
form
the sequence in the PDT (Physical Device Table)
U3585-J-Z125-8-76
Statements for SM2 administrators
SET-SYSSTAT-PARAMETER
SET-SYSSTAT-PARAMETER
Define SYSSTAT monitoring parameters
Function
This statement is used to define the devices for the SYSSTAT monitoring program.
Format
SET-SYSSTAT-PARAMETER
USED-DEVICES = *NONE / *ALL / list-poss(64): *DISK / *TAPE / <alphanum-name 2..4 with-wild>
Operands
USED-DEVICES =
USED-DEVICES = *NONE
No devices are to be monitored by the SYSSTAT monitoring program.
USED-DEVICES = *ALL
All devices are to be monitored with the exception of the communication controllers
(CTCCs, TRANSDATA 960s, 8170 Cluster Controllers, LAN adapters, HNCs and SCPs).
USED-DEVICES = list-poss(64): *DISK
All disk devices are to be monitored.
USED-DEVICES = list-poss(64): *TAPE
All tape devices are to be monitored.
USED-DEVICES = list-poss(64): <alphanum-name 2..4 with-wild>
Specifies the mnemonic device names of the devices to be monitored. A check is carried
out to establish whether these devices are defined in the configuration. An asterisk (*) is
also permitted as the last character in a wildcard specification.
Note
SM2R1 uses the devices defined here to determine, among other things, the time
equivalent for the productive performance of the peripherals (SM2R1 report 61) and the
dilation factor (SM2R1 report 57). If possible, all devices should be monitored to capture
precise values. If these reports are required, it is recommended that you specify USEDDEVICES=(*DISK,*TAPE).
U3585-J-Z125-8-76
131
SET-TASK-PARAMETER
Statements for SM2 administrators
SET-TASK-PARAMETER
Define TASK monitoring parameters
Function
This statement is used to define the tasks and devices for the TASK monitoring program.
All tasks can be selected, but this results in a higher system load. Tasks can be explicitly
defined using a list of TSNs, user IDs, job names and job classes. Tasks can also be
selected for monitoring by specifying a task attribute. If tasks are defined by specifying
multiple selection criteria, the selection is made by logical ORing, i.e. a task is selected if at
least one of the specified criteria has been satisfied.
Format
SET-TASK-PARAMETER
TASK-SELECTION = *ALL / *SPECIFIED(...)
*SPECIFIED(...)
TSN = *NOT-SPECIFIED / list-poss(64): <alphanum-name 1..4>
,USER-ID = *NOT-SPECIFIED / list-poss(32): <alphanum-name 1..8 with-wild>
,JOB-NAME = *NOT-SPECIFIED / list-poss(32): <alphanum-name 1..8 with-wild>
,JOB-CLASS = *NOT-SPECIFIED / list-poss(32): <alphanum-name 1..8 with-wild>
,TYPE = *NOT-SPECIFIED / list-poss(4): *SYSTEM / *BATCH / *DIALOG / *TP
,DEVICES = *NONE / *ALL / list-poss(64): *DISK / <alphanum-name 2..4 with-wild>
Operands
TASK-SELECTION =
Specifies the tasks to be monitored.
TASK-SELECTION = *ALL
All tasks are to be monitored.
TASK-SELECTION = *SPECIFIED(...)
The tasks to be monitored are selected via their TSN, user ID, job name, job class or their
type.
132
U3585-J-Z125-8-76
Statements for SM2 administrators
SET-TASK-PARAMETER
TSN =
TSN = *NOT-SPECIFIED
No tasks are selected using the TSN.
TSN = list-poss(64): <alphanum-name 1..4>
Specifies the TSNs of the tasks to be monitored. A task with the specified TSN is,
however, only monitored if it already existed when the task monitoring program was
started.
USER-ID =
USER-ID = *NOT-SPECIFIED
No tasks are selected using the user ID.
USER-ID = list-poss(32): <alphanum-name 1..8>
Specifies the user ID of the tasks to be monitored. An asterisk (*) is also permitted as
the last character in a wildcard specification. All tasks of the specified user ID which
existed at the start of the task monitoring program or which were created during the
monitoring program run are monitored. The user IDs must be specified without the “$”
sign.
JOB-NAME =
JOB-NAME = *NOT-SPECIFIED
No tasks are selected via their job names.
JOB-NAME = list-poss(32): <alphanum-name 1..8>
Specifies the job name of the task to be monitored. An asterisk (*) is also permitted as
the last character in a wildcard specification. All tasks with the job name specified at
selection time using the START-MEASUREMENT-PROGRAM or LOGON command
are monitored.
JOB-CLASS =
JOB-CLASS = *NOT-SPECIFIED
No tasks are selected via their job class.
JOB-CLASS = list-poss(32): <alphanum-name 1..8>
Specifies the job class of the tasks to be monitored. An asterisk (*) is also permitted as
the last character in a wildcard specification. All tasks with the job name specified at
selection time using the START-MEASUREMENT-PROGRAM or LOGON command
are monitored.
U3585-J-Z125-8-76
133
SET-TASK-PARAMETER
Statements for SM2 administrators
TYPE =
The tasks to be monitored are selected via their task attribute. All tasks with the
attributes specified at selection time using the START-MEASUREMENT-PROGRAM or
LOGON command are monitored. If the task attribute of a task is changed in the course
of the monitoring program session, this will not influence the measurement itself, i.e. the
task is neither excluded from nor included in monitoring as a result.
TYPE = *NOT-SPECIFIED
No tasks are selected via the task attribute.
TYPE = list-poss(4): *SYSTEM / *BATCH / *DIALOG / *TP
*SYSTEM:
*BATCH:
*DIALOG:
*TP:
All system tasks are to be monitored.
All batch tasks are to be monitored.
All interactive tasks are to be monitored.
All TP tasks are to be monitored.
DEVICES =
Specifies the devices to be monitored by the task monitoring program for each task. A check
is carried out to establish whether these devices are defined in the configuration. It is
possible to monitor up to 64 devices. If more than 64 devices are defined by means of partial
qualification or *DISK, these are selected in the following order of priority:
–
–
–
devices whose mnemonic device names have been specified in their entirety
devices whose mnemonic device names have been specified in partially qualified form
*DISK
With *DISK and *ALL, up to 64 mnemonic names are selected in the order given in the PDT
(Physical Device Table).
DEVICES = *NONE
No devices are to be monitored.
DEVICES = *ALL
All devices are to be monitored, with the exception of communication controllers (CTCCs,
TRANSDATA 960s, 8170 Cluster Controllers, LAN adapters and HNCs).
DEVICES = list-poss(64): *DISK
All disk devices are to be monitored.
DEVICES = list-poss(32): <alphanum-name 2..4 with-wild>
The specified devices are to be monitored. An asterisk (*) is also permitted as the last
character in a wildcard specification.
134
U3585-J-Z125-8-76
Statements for SM2 administrators
SHOW-ACTIVE-PARAMETER
SHOW-ACTIVE-PARAMETER
Output active monitoring parameters
Function
This statement is used to output the current objects and monitoring parameters for each
active monitoring program.
Format
SHOW-ACTIVE-PARAMETER
TYPE = *ALL / list-poss(12): *BCAM-CONNECTION / *CHANNEL-IO / *COSMOS / *DISK / *DISK-FILE /
*FILE / *ISAM / *PERIODIC-TASK / *RESPONSETIME / *SERVICETIME / *SYSSTAT / *TASK
Operands
TYPE =
Specifies the type of the active monitoring program for which the current objects and
monitoring parameters are to be output.
TYPE = *ALL
Outputs the objects and monitoring parameters for all active monitoring programs.
TYPE = *BCAM-CONNECTION
Outputs the objects and monitoring parameters for the active BCAM-CONNECTION
monitoring program. Only the bucket values currently set in BCAM are displayed.
TYPE = *CHANNEL-IO
Outputs the objects for the active CHANNEL-IO monitoring program.
TYPE = *COSMOS
Outputs the objects for the active COSMOS monitoring program.
TYPE = *DISK
Outputs the objects and monitoring parameters for the active DISK monitoring program.
TYPE = *DISK-FILE
Outputs the objects for the active DISK-FILE monitoring program.
TYPE = *FILE
Outputs the objects for the active privileged FILE monitoring program.
U3585-J-Z125-8-76
135
SHOW-ACTIVE-PARAMETER
Statements for SM2 administrators
TYPE = *ISAM
Outputs the objects and monitoring parameters for the active privileged ISAM monitoring
program.
TYPE = *PERIODIC-TASK
Outputs the objects and monitoring parameters for the active PERIODIC-TASK monitoring
program.
TYPE = *RESPONSETIME
Outputs the objects and monitoring parameters for the active RESPONSETIME monitoring
program.
TYPE = *SERVICETIME
Outputs the objects for the active SERVICETIME monitoring program.
TYPE = *SYSSTAT
Outputs the objects for the active SYSSTAT monitoring program.
TYPE = *TASK
Outputs the objects and monitoring parameters for the active TASK monitoring program.
136
U3585-J-Z125-8-76
Statements for SM2 administrators
SHOW-DEFINED-PARAMETER
SHOW-DEFINED-PARAMETER
Output defined monitoring parameters
Function
This statement is used to output the objects and monitoring parameters currently defined
for each definable monitoring program.
Format
SHOW-DEFINED-PARAMETER
TYPE = *ALL / list-poss(12): *BCAM-CONNECTION / *CHANNEL-IO / *COSMOS / *DISK / *DISK-FILE /
*FILE /*ISAM / *PERIODIC-TASK / *RESPONSETIME / *SERVICETIME / *SYSSTAT / *TASK
Operands
TYPE =
Specifies the type of the monitoring program for which the currently defined objects and
monitoring parameters are to be output.
TYPE = *ALL
Outputs the objects and monitoring parameters currently defined for all definable
monitoring programs.
TYPE = *BCAM-CONNECTION
Outputs the bucket values currently set in BCAM, provided the SET-BCAM-CONNECTIONPARAMETER statement has not yet been issued. If the SET-BCAM-CONNECTIONPARAMETER statement is entered with *UNCHANGED, the bucket values currently set in
BCAM are adopted by SM2 and can be output using the SHOW-DEFINED-PARAMETER
statement.
TYPE = *CHANNEL-IO
Outputs the objects and monitoring parameters currently defined for the CHANNEL-IO
monitoring program.
TYPE = *COSMOS
Outputs the objects and monitoring parameters currently defined for the COSMOS
monitoring program.
TYPE = *DISK
Outputs the objects and monitoring parameters for the active DISK monitoring program.
U3585-J-Z125-8-76
137
SHOW-DEFINED-PARAMETER
Statements for SM2 administrators
TYPE = *DISK-FILE
Outputs the objects for the active DISK-FILE monitoring program.
TYPE = *FILE
Outputs the objects for the active privileged FILE monitoring program.
TYPE = *ISAM
Outputs the objects and monitoring parameters for the active privileged ISAM monitoring
program.
TYPE = *PERIODIC-TASK
Outputs the objects and monitoring parameters for the active PERIODIC-TASK monitoring
program.
TYPE = *RESPONSETIME
Outputs the objects and monitoring parameters for the active RESPONSETIME monitoring
program.
TYPE = *SERVICETIME
Outputs the objects for the active SERVICETIME monitoring program.
TYPE = *SYSSTAT
Outputs the objects for the active SYSSTAT monitoring program.
TYPE = *TASK
Outputs the objects and monitoring parameters for the active TASK monitoring program.
138
U3585-J-Z125-8-76
Statements for SM2 administrators
SHOW-MEASUREMENT-STATUS
SHOW-MEASUREMENT-STATUS
Output monitoring status
Function
This statement is used to output the MEASUREMENT STATUS screen.
Format
SHOW-MEASUREMENT-STATUS
U3585-J-Z125-8-76
139
SHOW-SELECTED-HOSTS
Statements for SM2 administrators
SHOW-SELECTED-HOSTS
Output selected hosts
Function
This statement is used to output the hosts selected with the SELECT-HOSTS statement.
The display includes the host name, the processor name (from the point of view of the host
from which the statement was issued), and the time of the last monitored data queried.
If a new file is not available, the message “RSLT NOT VALID” may be output in place of the
clock. Possible reasons for this are listed below:
–
–
–
Monitored data was not queried since the SELECT-HOSTS statement.
The remote host is not sending.
The remote host shows a different system time or uses a different SM2 monitoring
cycle. Data from the respective hosts (including the local host) is output separately.
Format
SHOW-SELECTED-HOSTS
140
U3585-J-Z125-8-76
Statements for SM2 administrators
SHOW-SM2-STATUS
SHOW-SM2-STATUS
Output status of SM2 system tasks
Function
This statement is used to output information on the status of individual SM2 system tasks
and of the subsystems used by SM2.
Format
SHOW-SM2-STATUS
INFORMATION = *STD / *TASK / *EVENT-TRACE(...)
*EVENT-TRACE(...)
FROM = *ACTUAL / <integer 1..32767>
Operands
INFORMATION =
Provides information on the status of the SM2 system components.
INFORMATION = *STD
Provides information on the status of the SM2 system tasks and of the subsystems used by
SM2. The most recent event trace entries are also shown. The event trace entries contain
important events during execution of SM2. These events include:
–
–
–
start and termination of SM2 tasks
beginning and end of the use of other subsystems
any errors which occurred during execution of SM2 components
INFORMATION = *TASK
The status of the SM2 system tasks and of the subsystems used by SM2 is output.
INFORMATION = *EVENT-TRACE(...)
Event trace entries are output.
U3585-J-Z125-8-76
141
SHOW-SM2-STATUS
Statements for SM2 administrators
FROM =
Specifies the position as of which the trace entries are to be output. The position
specified corresponds to the most recent entry (the one with the highest number). If
trace entries which do not yet exist are selected, the most recent ones are output. The
fact that the trace buffer is overwritten cyclically means that it is possible that the
required entries are no longer all available. The last available entry is marked with the
symbol "===>".
FROM = *ACTUAL
The most recent trace entries are output.
FROM = <integer 1..32767>
The trace entries are output as of the specified number.
Note
For those users who are interested, the layout of the event trace entries is described
under the new STATUS TABLE screen.
142
U3585-J-Z125-8-76
Statements for SM2 administrators
SHOW-USER-MEASURED-OBJECTS
SHOW-USER-MEASURED-OBJECTS
Output monitored objects and associated users
Function
This statement is used to output the objects currently being monitored by users, together
with the associated users. Depending on the user’s system privileges (see table “Table of
authorizations” on page 13), the display includes either the user’s own objects or all users’
objects.
Format
SHOW-USER-MEASURED-OBJECTS
TYPE = *ALL / list-poss(3): *FILE / *ISAM / *TASK
Operands
TYPE =
Specifies the type of the user monitoring program for which the currently monitored objects
and corresponding users are to be output.
TYPE = *ALL
Outputs the objects currently monitored and the associated users for all user monitoring
programs.
TYPE = *FILE
Outputs the objects currently monitored and the associated users for the FILE monitoring
program.
TYPE = *ISAM
Outputs the objects currently monitored and the associated users for the ISAM monitoring
program.
TYPE = *TASK
Outputs the objects currently monitored and the associated users for the TASK monitoring
program.
U3585-J-Z125-8-76
143
START-MEASUREMENT-PROGRAM
Statements for SM2 administrators
START-MEASUREMENT-PROGRAM
Start monitoring program run
Function
This statement is used to start the monitoring programs specified under TYPE.
Format
START-MEASUREMENT-PROGRAM
TYPE = list-poss(31): *BCAM-CONNECTION / *CHANNEL-IO / *CMS / *COSMOS / *DAB / *DISK /
*DISK-FILE / *DLM / *FILE / *GS / *GSVOL / *HSMS / *ISAM / *MSCF / *NET-DEVICE /
*NSM / *PCA /*PERIODIC-TASK / *PFA / *POSIX / *RESPONSETIME / *SERVICETIME /
*SVC / *SYSSTAT / *TASK / *TCP-IP /*TLM / *UTM / *VM
Operands
TYPE =
Specifies the monitoring program to be started (the descriptions below are in alphabetical
order).
TYPE = *BCAM-CONNECTION
Starts the BCAM-CONNECTION monitoring program.
TYPE = *CHANNEL-IO
Starts the CHANNEL-IO monitoring program.
TYPE = *CMS
Starts the CMS monitoring program.
TYPE = *COSMOS
Starts the COSMOS monitoring program. This must be defined before it is started. If the
monitoring program has not been prepared, it is prepared implicitly (INITIATE-COSMOS).
TYPE = *DAB
Starts the DAB monitoring program.
TYPE = *DISK
Starts the DISK monitoring program.
TYPE =*DISK-FILE
Starts the DISK-FILE monitoring program.
144
U3585-J-Z125-8-76
Statements for SM2 administrators
START-MEASUREMENT-PROGRAM
TYPE = *DLM
Starts the DLM monitoring program.
TYPE = *FILE
Starts the FILE monitoring program.
TYPE = *GS
Starts the GS monitoring program.
TYPE = *GSVOL
Starts the GSVOL monitoring program.
TYPE = *HSMS
Starts the HSMS monitoring program.
TYPE = *ISAM
Starts the ISAM monitoring program.
TYPE = *MSCF
Starts the MSCF monitoring program.
TYPE = *NET-DEVICE
Starts the NET-DEVICE monitoring program.
TYPE = *NSM
Starts the NSM monitoring program.
TYPE = *PCA
Starts the PCA monitoring program.
TYPE = *PERIODIC-TASK
Starts the PERIODIC-TASK monitoring program.
TYPE = *PFA
Starts the PFA monitoring program.
TYPE = *POSIX
Starts the POSIX monitoring program.
TYPE = *RESPONSETIME
Starts the RESPONSETIME monitoring program.
TYPE = *SERVICETIME
Starts the SERVICETIME monitoring program.
TYPE = *SVC
Starts the SVC monitoring program.
TYPE = *SYSSTAT
Starts the SYSSTAT monitoring program.
U3585-J-Z125-8-76
145
START-MEASUREMENT-PROGRAM
Statements for SM2 administrators
TYPE = *TASK
Starts the TASK monitoring program.
TYPE = *TCP-IP
Starts the TCP-IP monitoring program.
TYPE = *TLM
Starts the TLM monitoring program.
TYPE = *UTM
Starts the UTM monitoring program.
TYPE = *VM
Starts the VM monitoring program.
Notes
–
For the BCAM-CONNECTION, CHANNEL-IO, COSMOS, DISK, DISK-FILE, FILE,
ISAM, PERIODIC-TASK, RESPONSETIME, SERVICETIME, SYSSTAT and TASK
monitoring programs, the monitoring parameters/monitored objects must be defined
using the appropriate statements before the program is started.
–
For further information on the monitoring programs, see page 33 ff.
Restriction
With SR2000, monitored data cannot be collected for the GS and GSVOL monitoring
programs.
146
U3585-J-Z125-8-76
Statements for SM2 administrators
STOP-MEASUREMENT-PROGRAM
STOP-MEASUREMENT-PROGRAM
Terminate monitoring program run
Function
This statement is used to terminate the monitoring programs specified under TYPE.
Format
STOP-MEASUREMENT-PROGRAM
TYPE = *ALL / list-poss(31): *BCAM-CONNECTION / *CHANNEL-IO / *CMS / *COSMOS / *DAB / *DISK /
*DISK-FILE / *DLM / *FILE / *GS / *GSVOL / *HSMS / *ISAM / *MSCF / *NET-DEVICE /
*NSM / *PCA / *PERIODIC-TASK / *PFA / *POSIX / *RESPONSETIME / *SERVICETIME /
*SVC / *SYSSTAT / *TASK / *TCP-IP / *TLM / *UTM / *VM
Operands
TYPE =
Specifies the type of monitoring program to be terminated (the descriptions below are in
alphabetical order).
TYPE = *ALL
Terminates all active monitoring programs.
TYPE = *BCAM-CONNECTION
Terminates the BCAM-CONNECTION monitoring program.
TYPE = *CHANNEL-IO
Terminates the CHANNEL-IO monitoring program.
TYPE = *CMS
Terminates the CMS monitoring program.
TYPE = *COSMOS
Terminates the COSMOS monitoring program.
TYPE = *DAB
Terminates the DAB monitoring program.
TYPE = *DISK
Terminates the DISK monitoring program.
U3585-J-Z125-8-76
147
STOP-MEASUREMENT-PROGRAM
Statements for SM2 administrators
TYPE = *DISK-FILE
Terminates the DISK-FILE monitoring program.
TYPE = *DLM
Terminates the DLM monitoring program.
TYPE = *FILE
Terminates the FILE monitoring program.
TYPE = *GS
Terminates the GS monitoring program.
TYPE = *GSVOL
Terminates the GSVOL monitoring program.
TYPE = *HSMS
Terminates the HSMS monitoring program.
TYPE = *ISAM
Terminates the ISAM monitoring program.
TYPE = *MSCF
Terminates the MSCF monitoring program.
TYPE = *NET-DEVICE
Terminates the NET-DEVICE monitoring program.
TYPE = *NSM
Terminates the NSM monitoring program.
TYPE = *PCA
Terminates the PCA monitoring program.
TYPE = *PERIODIC-TASK
Terminates the PERIODIC-TASK monitoring program.
TYPE = *PFA
Terminates the PFA monitoring program.
TYPE = *POSIX
Terminates the POSIX monitoring program.
TYPE = *RESPONSETIME
Terminates the RESPONSETIME monitoring program.
TYPE = *SERVICETIME
Terminates the SERVICETIME monitoring program.
TYPE = *SVC
Terminates the SVC monitoring program.
148
U3585-J-Z125-8-76
Statements for SM2 administrators
STOP-MEASUREMENT-PROGRAM
TYPE = *SYSSTAT
Terminates the SYSSTAT monitoring program.
TYPE = *TASK
Terminates the TASK monitoring program.
TYPE = *TCP-IP
Terminates the TCP-IP monitoring program.
TYPE = *TLM
Terminates the TLM monitoring program.
TYPE = *UTM
Terminates the UTM monitoring program.
TYPE = *VM
Terminates the VM monitoring program.
U3585-J-Z125-8-76
149
Statements for nonprivileged users
SM2 operation
4.4 Statements for nonprivileged users
These statements enable the nonprivileged user to select monitored data for output and
control the screen output. They can also be used by the SM2 administrator provided he/she
switches to the analysis subinterval using the CALL-EVALUATION-PART statement. This
automatically resets the status of the administrator; privileges and special authorizations
associated with some statements remain unchanged (see section “Users” on page 12).
These SM2 functions cannot be addressed through SDF. For a description of the ISP
syntax, see the appendix.
Default values for statements
All functions covered by the SM2 statements are predefined by means of default values at
program start time. The user must enter statements himself only if he wishes to change the
defaults or activate additional (optional) output operations.
An exception to the above is the START statement, which the user must employ to initiate
output of a report, as well as the END statement, which then terminates the SM2 session
for the particular user.
Statements for selecting monitored data for screen output
The following statements define the monitored data which is to be output to the individual
reports or which need not be output.
150
Statement
Function
DEVICE
Select devices with monitored data
FILE
Monitor files
SELECT-DAB-CACHE
Select DAB cache
SELECT-PCA-CONTROLLER
Select controllers for the PCA-CACHE report
SELECT-PCA-CACHE
Select cache for the PCA-DEVICE report
SELECT-PERIODIC-TASK-PARAMETER
Select sort criterion and output information for the
PERIODIC TASK report
SELECT-PFA-CACHE
Select PFA cache
SELECT-SYMMETRIX-CONTROLLER
Select SYMMETRIX controllers
SELECT-UTM-APPLICATION
Select UTM applications
SHOW-USER-MEASURED-OBJECTS
Output monitored objects
SELECT-UTM-APPLICATION
Select UTM applications
SHOW-USER-MEASURED-OBJECTS
Output monitored objects
START-ISAM-STATISTICS
Monitor ISAM pools
U3585-J-Z125-8-76
SM2 operation
Statements for nonprivileged users
Statement
Function
CHANGE-ISAM-STATISTICS
Include and exclude ISAM pools
STOP-ISAM-STATISTICS
Terminate the monitoring of ISAM pools
Statements for controlling reports
The following statements are used to control reports.
Statement
Function
OUTPUT
Define the output mode. Reports are output either
automatically at regular intervals (automatic output
mode) or at the request of the user (controlled mode).
REPORT
Select reports
RESTART
Start the output of selected reports. Unlike the START
statement, this statement does not allow for the retrieval
of new monitored data.
START
Start report output
In automatic output mode, the selected reports are output regularly over a defined period
of time. The overflow screens are not output in this mode.
The period of time over which reports are output is known as the output cycle. When the
program is started, this is preset to the current length of the monitoring cycle, but can be
changed by the user. The interval between reports depends on the number of reports
output in the last output cycle. In the first output cycle, reports are output without a delay.
The user must ensure that a practical relationship is maintained between the monitoring
cycle and the output cycle. Further information can be found under “Relationship between
the monitoring cycle and the output cycle” on page 153.
U3585-J-Z125-8-76
151
Statements for nonprivileged users
SM2 operation
In controlled mode, the individual reports are output at the request of the user, i.e. the user
can control SM2 report output or enter another statement.
The following scroll commands are available for controlling the output of SM2 reports which
may comprise one or more screens:
1. ++ selects the first screen of the first report of the next monitoring cycle.
2. - - selects the first screen of the first report of the current monitoring cycle.
3. +R selects the first screen of the next report.
If the current screen is the last for this monitoring cycle, the first screen of the first report
of the next monitoring cycle is displayed.
4. –R selects the first screen of the preceding report.
If the current screen is the first for this monitoring cycle, the current screen is displayed
again.
5. + selects the next sequential screen of the current report.
If the current screen is the last of the current report, the first screen of the next report is
displayed. The DUE or DÜ1 key can also be pressed instead of the + key.
6. – selects the preceding screen of the current report. If the current screen is the first of
this report, the first screen of the preceding report is displayed.
7. > selects the overflow screen for the current report. Overflow reports can exist for DAB,
PCA or UTM reports if it is not possible for all the monitored objects to fit on the same
screen.
If there is no overflow screen, > has the same effect as +.
8. < selects the previous overflow screen.
If there is no overflow screen, < has the same effect as -.
9. << selects the first screen of a report with overflow screens.
If there is no overflow screen, << has the same effect as -.
10. +N selects the first report of the next host.
If the current screen is the last one of this monitoring cycle, the first screen of the first
report from the next monitoring cycle is displayed.
In this case, the reports with network-specific data are displayed first, provided such
reports were selected.
11. -N selects the first report of the preceding host.
If the current report is the first one of the first host, the first report with network-specific
data is displayed, provided such a report was selected.
This method is useful for checking that suitable output and control statements have been
entered for a specific task or when a specific report is to be displayed for extended investigation at the terminal.
152
U3585-J-Z125-8-76
SM2 operation
Statements for nonprivileged users
Starting report output
Report output is started with the START or RESTART statement. In the case of the START
statement, new monitoring data is obtained from the central buffer of SM2 and then output.
In the case of the RESTART statement, reports are output with the data of the last START
statement.
SM2 enters the monitoring data in output forms called reports. Their format is fixed and
cannot be modified by the user. By means of statements, the user can specify that the
selected reports are to be output to the terminal, to the high-speed printer or to both
devices.
The reports contain factually related data (see the report types in chapter “SM2 screen
output” on page 201).
Monitoring then proceeds cycle after cycle. The reports are output either automatically or
upon user request.
Input during monitoring
The automatic output mode can be interrupted with the BREAK function (terminal key). To
allow interruption, the time interval between two consecutive reports is at least 2 seconds.
The /INFORM-PROGRAM command permits the user to return from system mode to SM2
program mode. All output statements can be entered as at program start time. Monitoring
is continued in the meantime. The output cycle begins when the START statement is
entered. The data monitored during the last completed monitoring cycle is again output
following the /INFORM-PROGRAM command.
In controlled mode, any output statement can be entered at any time instead of a scroll
statement without monitoring being interrupted. After the START statement, the reports for
the last completed monitoring cycle can be requested.
Relationship between the monitoring cycle and the output cycle
The first monitoring cycle begins when the SM2 monitoring task is initiated. In each cycle,
all of the required data is collected, edited and entered in a central buffer at the end of the
cycle. The SM2 user tasks fetch the output data from this buffer.
The output cycle of an SM2 user task begins when the START statement is entered. The
data collected during the last completed monitoring cycle is then fetched and output.
This means that the first reports can be output at the earliest one monitoring cycle length
after SM2 monitoring task initiation.
U3585-J-Z125-8-76
153
Statements for nonprivileged users
SM2 operation
Depending on the output mode and the length of the two cycles, the following situations are
possible:
A
Automatic output mode
A1
Monitoring cycle and output cycle have
the same length
Zeit
Meßintervalle
Zeit
Meßintervalle
Ausgabeintervalle
Monitored data acquisition and report
output take place at intervals of the same
length
If the system load is high, the time
required for output to the terminal may be
considerably increased; this may result in
the data of a particular monitoring cycle
being skipped during output.
A2
Monitoring cycle longer than output cycle
After all reports for a monitoring cycle
have been output, SM2 waits until data of
the next monitoring cycle becomes
available.
This causes the output interval to be
extended.
154
Ausgabeintervalle
U3585-J-Z125-8-76
SM2 operation
A3
Statements for nonprivileged users
Monitoring cycle shorter than output
cycle
Zeit
Meßintervalle
Ausgabeintervalle
Monitored data is lost because the
central buffer of the monitoring task is
cleared faster than the data is output
during the output cycle.
B
Controlled mode
If the user does not succeed in having all the reports of a monitoring cycle output
before the central buffer is filled again by the monitoring tasks, some monitoring cycles
will be lost. When a report is requested again, the first report of the new monitoring
cycle is output.
Note
The ACTIVITY, CHANNEL, and DEVICE
reports are requested in this example.
Zeit
Meßintervalle
REPORTS:
The data of the monitoring cycles marked
with * was overwritten in the central buffer
before the user requested all the reports
of the monitoring cycle shown first.
ACTIVITY
*
CHANNEL
+
+
DEVICE
+
ACTIVITY
U3585-J-Z125-8-76
+
155
Statements for nonprivileged users
SM2 operation
Statement for outputting information
The STATUS statement outputs the SM2-MEASUREMENT STATUS screen.
Statement
Function
STATUS
Output the monitoring status
General statements
The following statements control the SM2 run of the user (BREAK, END) and provide assistance as required (HELP, REMARK).
Statement
Function
BREAK
Change to system mode
HELP
Request user help information
REMARK
Insert remarks
END
Terminate monitoring
The following description of the statements for nonprivileged users is arranged in alphabetical order.
156
U3585-J-Z125-8-76
Statements for nonprivileged users
BREAK
BREAK
Switch to system mode
Function
This statement is used to interrupt SM2 processing and switch to the system’s command
mode.
Format
Operation
Operands
BREAK
U3585-J-Z125-8-76
157
CHANGE-ISAM-STATISTICS
Statements for nonprivileged users
CHANGE-ISAM-STATISTICS
Include and exclude ISAM pools
Function
This statement is used to include and exclude ISAM pools in the monitoring process.
ISAM pools can only be monitored if this is permitted by the SM2 primary administrator. If
this is the case, the entry ISAM appears in the USER MEASUREMENTS ALLOWED line
of the SM2 MEASUREMENT STATUS screen. SM2 supports the simultaneous monitoring
of up to 16 ISAM pools for the set of all users.
Format
Operation
CHANGE-ISAMSTATISTICS
Operand
*NONE
ADD-POOL =
(*POOL(
POOL-NAME=poolname1
*HOST-SYSTEM
[,SCOPE =
*TASK(TSN=tsn)
*USER
*HOME-PVS
,CAT-ID =
catid
*NONE
,REMOVE-POOL = (*POOL(
*OWN
]
)[,*POOL( )]...)
POOL-NAME=poolname1
*HOST-SYSTEM
[,SCOPE =
*TASK(TSN=tsn)
*USER
*HOME-PVS
,CAT-ID =
catid
]
)[,*POOL( )]...)
Operands
ADD-POOL
158
Defines which ISAM pools are to be included in the monitoring
process.
U3585-J-Z125-8-76
Statements for nonprivileged users
CHANGE-ISAM-STATISTICS
=*NONE
No ISAM pools are included in the monitoring process (default).
=*POOL()
Defines which ISAM pools are to be monitored. Up to 16 ISAM pools
can be defined in one list.
POOL-NAME
=poolname1
Defines a pool name up to 8 characters in length.
SCOPE
Defines the type of ISAM pool.
=*HOST-SYSTEM
The pool is a global ISAM pool (default).
=*TASK() The pool is a task-specific ISAM pool. The TSN operand defines the
task under which the ISAM pool has been set up.
TSN=tsn
TSN of the task under which the task-specific ISAM pool has been
set up.
=*USER
CAT-ID
The pool is a user-specific ISAM pool. It is only possible to include
and exclude ISAM pools under the user’s own ID.
Catalog ID of the public volume set to which the ISAM pool has been
assigned. This specification is part of the identification of the ISAM
pool (in addition to the specifications for POOL-NAME and
SCOPE).
=*HOME-PVS
The catalog ID is the one of the home pubset (default).
=catid
REMOVE-POOL
Catalog ID of the public volume set to which the ISAM pool has been
assigned.
Defines which ISAM pools are to be excluded from the monitoring
process.
=*NONE
No ISAM pools are to be excluded from the monitoring process
(default).
=*OWN
Only those ISAM pools included by a user in the monitoring process
are excluded.
=*POOL()
See the description of ADD-POOL=*POOL()
The *POOL structure name can be omitted, but if so it must not occur anywhere else in the
statement.
U3585-J-Z125-8-76
159
DEVICE
Statements for nonprivileged users
DEVICE
Select devices with monitored data
Function
This statement is used to select the devices and monitored data to be output in the
DEVICE report:
●
disk devices with the greatest amount of activity during the monitoring cycle (default
value)
●
other devices with the greatest amount of activity during the monitoring cycle
●
devices to which the user has assigned a high output priority
The statement also defines devices which are no longer output individually during the
subsequent output cycle.
In the DEVICE report, as many as eight devices and their monitored data can be listed
individually. All other active devices are output in the ACTIVE line by device name. The
number of these further devices depends on the length of the mnemonic names of the
devices which have been output.
This applies even if the user has specified a high priority for more than eight devices and if
more than eight devices were active in the course of a monitoring cycle.
SM2 outputs the values of the eight individual devices which experienced the most activity
during the monitoring cycle. The values of the other active devices are not output, although
their device names are (sorted according to activity).
The devices are addressed using 2 to 4-digit alphanumeric device identifiers assigned in
the DVC statement at system generation time. The current device IDs are logged in the
PHYSICAL DEVICE LISTING created at system generation time.
If you specify the PRINT-CONFIGURATION statement in SM2R1, a configuration table will
be output (see Volume 2 of the SM2 manual [21]). The current device identifiers can
likewise be taken from this table.
The monitored data does not cover the activities of the communication processors, local
cluster controllers, CTCCs, TRANSDATA 960s, 8170 Cluster Controllers, LAN adapters,
HNCs, SCP or GS.
160
U3585-J-Z125-8-76
Statements for nonprivileged users
DEVICE
Format
Operation
DEVICE
Operands
*DISK
*ALL
+
dev-name]
[
-
+
[
dev-name]
-
Operands
*DISK
Specifies the monitored data of up to 8 disk devices with the
greatest activity during the monitoring cycle.
The disk devices are sorted in descending order according to
activity, and the DEVICE report includes their monitored data.
This operand is predefined at program start time. It must only be
specified if the presetting has been changed but is to be reactivated.
*ALL
+
[
dev-name] ..
-
Specifies the monitored data of up to 8 devices with the greatest
activity during the monitoring cycle. The devices are sorted in
descending order according to activity, and the DEVICE report
includes their monitored data.
Designates devices whose monitored data is to be output
separately in the DEVICE report (+) or no longer to be output (-).
In the case of the first device in an input line, the sign can be
omitted. In this case this entry completely replaces the previously
valid device selection, and, at the same time, the presetting goes
into effect.
If the first device name in the input line is preceded by a sign, the
devices of this input line are added to those previously selected or
removed.
Each further device in the input line must be preceded by a sign.
dev-name
U3585-J-Z125-8-76
Mnemonic name for the device as assigned at system generation
(see the PDT - Physical Device Table).
161
DEVICE
Statements for nonprivileged users
+
Defines devices whose monitored data is to be output separately.
The monitored data is output only if the device was not active during
the monitoring cycle.
If the user has assigned a high output priority to less than eight
devices and at least eight devices in total were active and the user
did not withdraw priority from them, SM2 will take the free space and
give it the monitoring data of other active devices.
-
Defines devices to which the user does not wish to assign output
priority.
The mnemonic names of these devices are output in the ACTIVE
line of the DEVICE report only if they are among the devices with
the greatest activity during the monitoring cycle which do not appear
in the individual output list.
Example
DEVICE +H1
Device H1 is assigned a higher output priority to be able to better observe the monitored
data of this device for the report output. The values of the devices are output individually
and independent of their activity.
162
U3585-J-Z125-8-76
Statements for nonprivileged users
END
END
Terminate monitoring
Function
This statement is used to terminate the SM2 run for the user.
Format
Operation
Operands
END
U3585-J-Z125-8-76
163
FILE
Statements for nonprivileged users
FILE
Monitor files
Function
This statement is used to select one or more files whose monitored data is to be output in
the next monitoring cycle or is no longer to be output. The user may only include files in the
monitoring process if this is permitted by the SM2 primary administrator.
If this is the case, the entry FILE appears in the USER MEASUREMENTS ALLOWED line
of the SM2 MEASUREMENT STATUS screen.
Provided file monitoring is allowed, each user can include and exclude files which have
been set up under his user ID in the monitoring process. It is also possible to include and
exclude files which do not exist.
SM2 supports the simultaneous monitoring of up to 16 files for all users.
Format
Operation
Operands
FILE
NAME=filename
[ ,STATS = ON ]
[
]
,STATS = OFF
Operands
NAME
=filename
Specifies the name of the file whose access values are to be monitored
or to be excluded from further monitoring.
As a general rule, fully qualified file names must be specified, e.g.
:A:$USERID.FILE1 (see the “DMS Macros” manual [2]).
STATS
=ON Includes the specified file in the monitoring process if this has not
already been done (default).
=OFF Excludes the specified file from the monitoring process.
164
U3585-J-Z125-8-76
Statements for nonprivileged users
HELP
HELP
Request user help information
Function
This statement is used to request an overview of all SM2 statements.
Format
Operation
Operands
HELP
Output includes the statement name followed by a brief explanation of the statement.
U3585-J-Z125-8-76
165
OUTPUT
Statements for nonprivileged users
OUTPUT
Define output mode
Function
This statement is used to:
●
define the device (data display terminal and/or printer) to which the reports are output,
and
●
define the mode of output.
Reports are output either automatically at regular intervals (automatic output mode) or
at the request of the user (controlled mode).
Format
Operation
Operands
OUTPUT
TERMINAL
Y[ES]
[
=
]
TER
N[O]
HARDCOPY
Y[ES]
[,
= N[O] ]
HC
INTERVAL
[number]
[,
=
]
INT
C[ONTROLLED]
Operands
TERMINAL
=YES
Directs output of the reports to the data display terminal (default).
=NO
Deactivates report output to the data display terminal.
HARDCOPY
166
=YES
Directs output of the reports to the system file SYSLST.
If SM2 runs in batch mode, the reports are always output to
SYSLST.
=NO
Prevents output of the report to the system file SYSLST (default).
U3585-J-Z125-8-76
Statements for nonprivileged users
INTERVAL
=number
OUTPUT
Specifies the output mode.
Specifies automatic output mode (see page 154).
“number” defines the output cycle during which the reports are to be
output at regular intervals.
This can be an integer between 10 and 3600 seconds.
The INTERVAL=number specification is not mandatory. If it is
omitted, SM2 inserts the value for the output cycle by using the
value of the online monitoring cycle (default). An exception to this is
the first output cycle, in which the reports are output in direct
succession. With a normal workload, the system requires approximately one second to output a report. The value for the output cycle
should be at least as large as the sum of the output times of the
selected reports.
=CONTROLLED
Each report is output only at the request of the user (controlled
mode). The reports of the last completely executed cycle are
available for output. Each report can be requested using a paging
statement (see page 152) once SM2 displays the ENTER
COMMAND message. In place of the paging statements, any other
statement can also be used to request the report. The statement
OUTPUT INTERVAL=number can be used to switch to automatic
output mode.
Note
Before changing the output cycle, please refer to “Relationship between the monitoring
cycle and the output cycle” on page 153.
Example 1
OUTPUT INT=C
SM2 output is prompted via the data display terminal. Following every output
operation, the user is requested to enter a command. SM2 then executes the
statement. The user also has the option of controlling report output.
Example 2
OUTPUT TER=NO,HC=YES
SM2 output is to the SYSLST system file. There is no output to the data display
terminal. Output takes place in automatic mode. The analysis period is equal to the
monitoring cycle.
U3585-J-Z125-8-76
167
REMARK
Statements for nonprivileged users
REMARK
Insert remarks
Function
This statement is used to insert remarks in order to document procedures.
Format
Operation
Operands
REMARK
[any text]
Operands
any text
168
Any text can be inserted; the text can extend beyond more than one
line. Continuation lines must be marked by means of a hyphen
(continuation symbol). See also “Length of the statements” on
page 423 of the Appendix.
U3585-J-Z125-8-76
Statements for nonprivileged users
REPORT
REPORT
Select reports
Function
This statement is used to select the reports to be output.
Format
Operation
Operands
REPORT
STD
ALL
+
[ - report-type ]
+
[
report-type ]
-
Operands
STD
Selects the following reports:
–
–
–
–
ACTIVITY report
MEMORY report
CHANNEL report
DEVICE report
for output in the same order as shown above.
This operand must be specified only if the default value has been
changed and is to be reactivated.
ALL
All reports are output.
If a monitoring program has not been activated or is not supplying
any data at the moment, an appropriate message is output.
U3585-J-Z125-8-76
169
REPORT
Statements for nonprivileged users
+
[
report-type]...
-
Updates the list of reports to be output.
“report-type” designates the output reports, the identifiers of which
are as follows:
Report ID
Guarant.
abbrev.
ACF
ACTIVITY
ACF report
A, ACT
BCAM
CATEGORY
Report name
ACTIVITY report
BCAM CONNECTION report
CAT
CATEGORY report
CATQ
CATEGORY QUEUE report
CATW
CATEGORY WSET report
CHANNEL
C, CHA
CHANNEL report
CMS
CMS report
CPU
CPU report
DAB
DAB report
DEVICE
D, DEV
DEVICE report
DISK_FILE
DFILE
DISK FILE report
DLM
DLM report
FILE
F, FIL
FILE report
GLOBAL
G
GLOBAL report
GS
GS report
GSVOL
GSVOL report
ISAM
MEMORY
ISAM report
M, MEM
MSCF
NET_DEVICE
MEMORY report
MSCF report
NET
NET DEVICE report
NSM
NSM report
PCA
PCA reports
PCS
PCS report
PERIODIC
PFA
PER
PERIODIC TASK report (privileged
and nonprivileged 1 users)
PFA report
Table 5: Report identifiers, abbreviations and names
170
U3585-J-Z125-8-76
Statements for nonprivileged users
REPORT
Report ID
Guarant.
abbrev.
Report name
POSIX
POS
POSIX report
RESPONSE
R, RES
RESPONSETIME report
SHARED_PVS
SHA
SHARED PVS report
SVC
SVC report
SYMMETRIX
SYM
SYMMETRIX report
TCP_IP
TCP
TCP/IP report
TLM
TLM report
UTM
UTM report
VM
VM2000 report
1) For
nonprivileged users, the PERIODIC TASK report contains only
those tasks under their own user ID.
Table 5: Report identifiers, abbreviations and names
The user can specify both an individual report identifier with or
without prefix and multiple report identifiers (with prefix) one after
the other.
The sign preceding the first report type of a line is not mandatory. If
omitted, the newly specified report types of this line completely
replace the ones previously set.
If the first report type of a line is specified using a prefix, the reports
specified in this line are added to (+) or removed from (-) the
previous ones.
All further reports of an input line must be prefixed by a sign.
Example 1
REPORT +DAB+CMS
The reports for DAB and CMS are added to the reports already activated.
Example 2
REPORT ALL-DAB
All existing reports are activated, with the exception of the DAB report.
Restriction
With SR2000, the GS and GSVOL reports are not available.
U3585-J-Z125-8-76
171
RESTART
Statements for nonprivileged users
RESTART
Start output of selected reports
Function
This statement is used to start the output of reports with the data of the last START
statement.
Thus, unlike the START statement, it does not retrieve new monitored data from the central
buffer of SM2. The advantage of this for SM2 users is that new control and output statements can take effect before the next monitoring cycle. It only makes sense to use the
RESTART statement in controlled mode.
Format
Operation
Operands
RESTART
172
U3585-J-Z125-8-76
Statements for nonprivileged users
SELECT-DAB-CACHE
SELECT-DAB-CACHE
Select DAB cache
Function
This statement is used to select one or more DAB caches to be displayed in the DAB report.
For each selected DAB cache, a DAB-CACHE report is then output containing monitored
data on the subareas or files.
Format
Operation
Operands
SELECT-DAB-CACHE
cache-id
[ADD-CACHE-ID =
]
(cache-id1[,cache-id2]...)
[,REMOVE-CACHE-ID =
cache-id
(cache-id1[,cache-id2]...)
]
*ALL
Operands
ADD-CACHE-ID
=cache-id
Specifies up to 16 names of DAB caches. The monitored data of the
corresponding caches is output starting with the next monitoring
cycle. “cache-id” is the name of a DAB cache and can be up to 32
characters in length.
REMOVE-CACHE-ID
U3585-J-Z125-8-76
=cache-id
Specifies up to 16 names of DAB caches in a list. The monitored
data of the corresponding DAB caches is no longer output starting
with the next monitoring cycle. “cache-id” is the name of a DAB
cache and can be up to 32 characters in length.
=*ALL
Deletes all previously specified DAB caches from the name list, i.e.
their monitored data is no longer output starting with the next
monitoring cycle (default).
173
SELECT-PCA-CACHE
Statements for nonprivileged users
SELECT-PCA-CACHE
Select cache for PCA DEVICE report
Function
This statement is used to select one or more caches of a controller to be displayed in the
PCA CACHE report. For each selected cache, a PCA DEVICE report is then output
containing monitored data on the individual devices supported by the cache.
Format
Operation
Operands
SELECT-PCA-CACHE
*NONE
*ALL
CACHE =
number1
((CONTROLLER=cont1,CACHE-ID= *ALL
)[,...])
Operands
CACHE
Defines the caches for which monitored data is to be output in the
PCA DEVICE report.
=*NONE
The PCA DEVICE report is not to be output.
=*ALL
Monitored data is to be output for all caches of all controllers
(default).
=(.....)
CONTROLLER=cont
Specifies the superordinate controller for the caches whose IDs are
subsequently specified. This must be specified using the controller’s
mnemonic name, which is up to 4 characters in length.
CACHE-ID=number
Specifies the cache IDs for the superordinate controller to be taken
into account when outputting the PCA DEVICE report. “number” is
a number between 0 and 62 inclusively.
174
U3585-J-Z125-8-76
Statements for nonprivileged users
SELECT-PCA-CACHE
CACHE-ID=*ALL
All caches of the superordinate controller are to be taken into
account when outputting the PCA DEVICE report (default).
Note
It is possible to specify up to 32 pairs of controllers and caches.
U3585-J-Z125-8-76
175
SELECT-PCA-CONTROLLER
Statements for nonprivileged users
SELECT-PCA-CONTROLLER
Select controllers for PCA CACHE report
Function
This statement is used to select one or more controllers to be displayed in the PCA
CONTROLLER report. For each selected controller, a PCA CACHE report is then output
containing monitored data on the controller caches.
Format
Operation
Operands
SELECT-PCACONTROLLER
*NONE
*ALL
CONTROLLER =
controller
(controller1[,controller2]...)
Operands
CONTROLLER
176
Defines the controllers for which cache monitored data is to be
output in the PCA CACHE report.
=*NONE
The PCA CACHE report is not to be output.
=*ALL
Monitored data on the caches of all controllers are to be output
(default).
=controller
Specifies the mnemonic names (up to 4 characters) of the
controllers for which cache values are to be output. Up to 32
controllers may be specified.
U3585-J-Z125-8-76
Statements for nonprivileged users
SELECT-PERIODIC-TASK-PARAMETER
SELECT-PERIODIC-TASK-PARAMETER
Select sort criterion and output information for
PERIODIC TASK report
Function
This statement is used to specify the sort criterion and output information for the PERIODIC
TASK report.
Nonprivileged users can only select tasks belonging to their own user ID.
Format
Operation
SELECT-PERIODICTASK-PARAMETER
Operands
*ALL
USER-ID
(userid1[,userid2]...)
OUTPUT-INFORMATION =
*ALL
JOB-NAME
(jobname1[,jobname2]...)
[,SORT = [SERVICE-UNITS][,CPU][,IO][,UPG][,PAGING-READ]]
Operands
OUTPUT-INFORMATION
Selects user IDs or job names whose data is to be output on the
screen.
=USER-ID(...)
Outputs user IDs.
*ALL:
All tasks are output. A user ID can only be output if it exists (default).
userid:
The tasks with the specified user IDs (up to 16) are output. User IDs
must be specified without the “$” sign.
U3585-J-Z125-8-76
177
SELECT-PERIODIC-TASK-PARAMETER
=JOB-NAME(...)
Statements for nonprivileged users
Outputs job names.
*ALL:
All tasks are output. The job name can only be output if it exists
(default).
jobname:
The tasks with the specified job names (up to 16) are output.
SORT
Specifies sort criteria. A PERIODIC TASK report is created for each
sort criterion specified.
=SERVICE-UNITS, CPU, IO, UPG, PAGING-READ
The tasks are sorted on the basis of the specified criteria. If there
are several sort criteria, the variously sorted reports are output one
after the other.
If no task is found with the selected output information, the following message appears:
"NO PERIODIC TASK DATA FOR SELECTED <output-information>".
If no task is found with the specified sort criterion, "*NONE" is output in the first line under
TSN.
178
U3585-J-Z125-8-76
Statements for nonprivileged users
SELECT-PFA-CACHE
SELECT-PFA-CACHE
Select PFA cache
Function
This statement is used to request a PFA CONTROLLER report for specific caches listed in
the PFA CACHE report.
The PFA CONTROLLER report can only be output for caches served by PCA and provides
monitored data for the various controllers assigned to the pubset disks served by the
caches.
The monitored data contained in the PFA CONTROLLER report overlaps with the data
provided in the PCA reports for 3421 controllers.
Format
Operation
Operands
SELECT-PFA-CACHE
cache-id
[ADD-CACHE-ID =
]
cache-id1[,cache-id2]...)
cache-id
(cache-id1[,cache-id2]...)
]
[,REMOVE-CACHE-ID =
*ALL
Operands
ADD-CACHE-ID
=cache-id
Specifies the names of the PFA caches (up to 4 characters) for
which CONTROLLER reports are to be output. Up to 16 names can
be specified.
REMOVE-CACHE-ID
U3585-J-Z125-8-76
=cache-id
Specifies the names of the PFA caches (up to 4 characters) for
which CONTROLLER reports are no longer to be output. Up to 16
names can be specified.
=*ALL
CONTROLLER reports are no longer to be output for all PFA caches
specified previously (default).
179
SELECT-SYMMETRIX-CONTROLLER
Statements for nonprivileged users
SELECT-SYMMETRIX-CONTROLLER
Select SYMMETRIX controllers
Function
This statement is used to select up to 16 SYMMETRIX controllers to be displayed in the
SYMMETRIX CONTROLLER report.
For each selected controller, a SYMMETRIX DEVICE report is then output containing
monitored data on the individual devices supported by the controller.
Format
Operation
Operands
SELECT-SYMMETRIXCONTROLLER
controller-mn
[ADD-CONTROLLER-MN =
]
(controller-mn1[,controller-mn2]...)
[,REMOVE-CONTROLLER-MN =
controller-mn
(controller-mn1[,controller-mn2]...)
]
*ALL
Operands
ADD-CONTROLLER-MN
=controller-mn
Defines the controllers for which SYMMETRIX DEVICE reports are
to be output using the first controller mnemonic of the emulated
3860 controllers.
In all SM2 output, both controller mnemonics of an emulated 3860
controller are always output separated by a slash.
The following two mnemonic variants are available:
–
–
alphanum-name 2..2
x-text 4..4
In this statement, you need only specify the first controller
mnemonic. It is possible to define up to 16 controller mnemonics.
180
U3585-J-Z125-8-76
Statements for nonprivileged users
SELECT-SYMMETRIX-CONTROLLER
REMOVE-CONTROLLER-MN
=controller-mn
Defines the controllers for which SYMMETRIX DEVICE reports are
no longer to be output using the first controller mnemonic.
The following two mnemonic variants are available:
–
–
alphanum-name 2..2
x-text 4..4
In this statement, you need only specify the first controller
mnemonic. It is possible to define up to 16 controller mnemonics.
=*ALL
U3585-J-Z125-8-76
SYMMETRIX-DEVICE reports are no longer to be output for any
previously specified controllers (default).
181
SELECT-UTM-APPLICATION
Statements for nonprivileged users
SELECT-UTM-APPLICATION
Select UTM applications
Function
This statement is used to select up to 16 UTM applications to be displayed in the UTM
report. For each selected UTM application, a UTM APPLICATION report is then output.
Format
Operation
Operands
SELECT-UTMAPPLICATION
name
[ADD-APPLICATION =
]
(name1[,name2]...)
[,REMOVE-APPLICATION =
name
(name1[,name2]...)
]
*ALL
Operands
ADD-APPLICATION
=name
Specifies up to 16 UTM applications. “name” is the name of a UTM
application and can be up to 8 characters in length.
REMOVE-APPLICATION
182
=name
Specifies up to 16 UTM applications in a list. “name” is the name of
a UTM application and can be up to 8 characters in length.
=*ALL
All the UTM application names specified previously are deleted from
the name list, i.e. the monitored data for these applications will no
longer be output as of the next monitoring cycle (default).
U3585-J-Z125-8-76
Statements for nonprivileged users
SHOW-USER-MEASURED-OBJECTS
SHOW-USER-MEASURED-OBJECTS
Output monitored objects
Function
This statement is used to show an SM2 user the objects he/she is currently monitoring.
Format
Operation
Operands
SHOW-USERMEASURED-OBJECTS
TYPE = TASK
Operands
TYPE
=TASK
U3585-J-Z125-8-76
Outputs the user’s tasks currently being monitored by the userspecific task monitoring program.
183
START
Statements for nonprivileged users
START
Start report output
Function
This statement is used to start report output.
Format
Operation
Operands
START
184
U3585-J-Z125-8-76
Statements for nonprivileged users
START-ISAM-STATISTICS
START-ISAM-STATISTICS
Monitor ISAM pools
Function
This statement is used to select one or more ISAM pools whose monitored data is to be
output in the next monitoring cycle.
The user may include ISAM pools in the monitoring process only if the SM2 primary administrator has authorized the monitoring of ISAM pools. If this is the case, the entry ISAM
appears in the USER MEASUREMENTS ALLOWED line of the SM2 MEASUREMENT
STATUS screen.
If ISAM pool monitoring has been permitted, each user can activate or deactivate global
ISAM pools and all task-specific and user-specific ISAM pools which have been or will be
set up under his/her user ID.
SM2 supports the simultaneous monitoring of as many as 16 ISAM pools for all nonprivileged users.
Only the input of the last START-ISAM-STATISTIC statement applies here. If you wish to
monitor several ISAM pools, these must be specified in a START-ISAM-STATISTIC
statement.
Format
Operation
START-ISAM-STATISTICS
U3585-J-Z125-8-76
Operands
POOL-NAME=poolname1
*HOST-SYSTEM
[,SCOPE=
*TASK(TSN=tsn)
POOL = (*POOL(
*USER
*HOME-PVS
[,CAT-ID=
]
catid
]
)[,*POOL()]...)
185
START-ISAM-STATISTICS
Statements for nonprivileged users
Operands
POOL
=(*POOL(...))
Defines which ISAM pools are to be monitored. Up to 16 ISAM pools
can be defined in one list.
POOL-NAME
=poolname1
SCOPE
Defines a pool name of up to 8 characters in length.
Defines the type of ISAM pool.
=*HOST-SYSTEM The pool is a global ISAM pool (default).
=*TASK(...)
The pool is a task-specific ISAM pool. The TSN operand defines the
task to which the ISAM pool belongs.
TSN=
TSN of the task to which a task-specific ISAM pool belongs.
=*USER
The pool is a user-specific ISAM pool. Only ISAM pools under the
user’s own ID can be included or excluded in the monitoring
process.
CAT-ID
Catalog ID of the public volume set to which the ISAM pool is
assigned. The specification is part of the identification of an ISAM
pool (in addition to the POOL-NAME and SCOPE specifications).
=*HOME-PVS
The ID is the catalog ID of the home pubset (default).
=catid
Catalog ID of the public volume set to which the ISAM pool has been
assigned.
The *POOL structure name can be omitted, but if so it must not occur anywhere else in the
statement.
186
U3585-J-Z125-8-76
Statements for nonprivileged users
STATUS
STATUS
Output monitoring status
Function
This statement is used to output the MEASUREMENT STATUS screen.
Format
Operation
Operands
STATUS
U3585-J-Z125-8-76
187
STOP-ISAM-STATISTICS
Statements for nonprivileged users
STOP-ISAM-STATISTICS
Terminate monitoring of ISAM pools
Function
This statement is used to terminate monitoring of the ISAM pools previously included in the
monitoring process.
Format
Operation
Operands
STOP-ISAM-STATISTICS
Note
If permission to monitor the ISAM pools has been withdrawn by the SM2 primary administrator, all ISAM pools previously included in the output are automatically excluded.
188
U3585-J-Z125-8-76
SM2 operation
Activating user task monitoring
4.5 BS2000 commands for activating user task monitoring
Any user can have SM2 monitor tasks under his/her own ID, provided the SM2 primary
administrator has given permission for user task monitoring (by issuing the SM2 statement
MODIFY-USER-ADMISSION TASK=*ALLOW. The total number of tasks which can be
monitored simultaneously is limited to 16).
Only users who have been assigned the system privilege SW-MONITOR-ADMINISTRATION can start or terminate monitoring of any tasks.
Function
The BS2000 command /START-TASK-MEASUREMENT is used to specify the tasks to be
included in the monitoring process. The SM2 software monitor then records task-specific
monitored data and enters this data in a user-specific file.
In addition to task-specific monitoring data, program counter statistics and SVC statistics
on program runs can also be requested.
In the case of program counter statistics for counting commands, the program is interrupted
at defined intervals (using a timer) and the address of the next command to be executed
and contained in the program counter is transferred to the user-specific SM2 output file
(registering the number of times the counter sampled the program).
In the case of SVC statistics, all SVC program macros called during task monitoring are
recorded, and SVC numbers and macro addresses are also stored in the SM2 output file.
If the BS2000 command /STOP-TASK-MEASUREMENT is issued or the task is terminated,
user task monitoring ends and the user-specific SM2 output file is closed. In addition,
withdrawal of the primary SM2 administrator’s permission to monitor tasks (MODIFYUSER-ADMISSION TASK=*INHIBIT) as well as deactivation of SM2 (STOP-SUBSYSTEM
SUBSYSTEM-NAME=SM2) will terminate any currently executing task measurement
operations.
The product SM2-PA is provided to analyze the SM2 output file generated for user task
monitoring (for further information, please refer to the "SM2-PA" manual [8]).
Note
The user-specific SM2 output file can exceed the limit specified for the user by PUBLICSPACE-LIMIT in the ADD-USER- or MODIFY-USER-ATTRIBUTES command, even if
PUBLIC-SPACE-EXCESS=*NO is specified.
U3585-J-Z125-8-76
189
Activating user task monitoring
SM2 operation
Formats
START-TASK-MEASUREMENT
TSN = *OWN / <alphanum-name 1..4>
,FILE = *STD / *BY-LINK-NAME
,PCOUNTER-INTERVAL = *NONE / <integer 1..10000>
,SVC-STATISTICS = *OFF / *ON
,LOAD-INFO = *STD / *DETAILED
STOP-TASK-MEASUREMENT
TSN = *OWN / <alphanum-name 1..4>
Operands
TSN =
Specifies the task to be monitored or for which monitoring is to be terminated.
TSN = *OWN
The task invoking the command will be monitored or monitoring of that task will be terminated.
TSN = <alphanum-name 1..4>
The task with the TSN specified is monitored or monitoring of that task is terminated. Only
users who have been assigned the system privilege SW-MONITOR-ADMINISTRATION
can start or terminate monitoring of any tasks. All other users can only monitor their own
tasks.
Restriction: The task SM2U, which processes the user-specific SM2 output files, cannot be
monitored.
FILE =
Specifies the user-specific SM2 output file.
FILE = *STD
The user-specific SM2 output file contains the file attributes which are defined in the
following table.
FILE = *BY-LINK-NAME
The user defines the file name and further file attributes using the corresponding BS2000
commands. The file is assigned via the link name. The link name for the user-specific SM2
output file is PALINK.
190
U3585-J-Z125-8-76
SM2 operation
Activating user task monitoring
PCOUNTER-INTERVAL =
Defines the sampling cycle for command counter statistics (in CPU milliseconds).
PCOUNTER-INTERVAL = *NONE
The command counter is not activated.
PCOUNTER-INTERVAL = <integer 1..10000>
Sampling cycle in CPU milliseconds. The only samples recorded are those with the status
TU.
SVC-STATISTICS =
The SVC macros of the task to be measured are recorded and written to the user-specific
SM2 output file.
SVC-STATISTICS = *OFF
SVC statistics are not activated.
SVC-STATISTICS = *ON
SVC statistics are activated. The only SVCs recorded are those with the status TU.
LOAD-INFO =
Specifies the point at which the module loading information is to be recorded.
LOAD-INFO = *STD
The module loading information is only recorded when the program is started or terminated
(or when monitoring is started or terminated).
LOAD-INFO = *DETAILED
The module loading information is recorded when the program is started (or when
monitoring is started) and every time the task performs a load or unload operation.
U3585-J-Z125-8-76
191
Activating user task monitoring
SM2 operation
Command return codes
(SC2)
SC1
0
32
64
64
64
Maincode
CMD0001
NPS0050
NPS0044
NPS0045
NPS0046
64
64
64
64
64
NPS0047
NPS0051
NPS0065
NPS0066
NPS0067
Meaning/guaranteed messages
No errors
System error in SM2 modules, command rejected
No authorization for monitoring task, command rejected
Task already monitored by SM2
Task monitoring not started by /START-TASKMEASUREMENT, command rejected
Specified task does not exist
User cannot monitor specified task
Cannot monitor any more tasks
Invalid file attributes for user-specific SM2 output file
DMS code '(&00)' in the case of a macro ' (&01)' for user-specific
SM2 output file
Note
You will find a general description of the command return codes in the “Commands”
manual [15].
192
U3585-J-Z125-8-76
SM2 operation
Activating user task monitoring
Attributes of the user-specific SM2 output file
Operand for file
creation
FILE =*STD
FILE =*BY-LINK-NAME
Predefined
Optional
$userid.SM2.
TASKSTATISTIK.nnnn1)
filename
Block length
BUFFER-LENGTH =
*STD(SIZE=16)
BUFFER-LENGTH =
*STD(SIZE=number) 3)
Storage space
allocation
SPACE = *RELATIVE
(PRIMARY-ALLOCATION=48,
SECONDARY-ALLOCATION=48)
SPACE = *RELATIVE
(PRIMARY-ALLOCATION=number1,
SECONDARY-ALLOCATION=
number2) 2),3)
Access method
SAM
No selection option,
SAM format is mandatory.
Open mode
EXTEND
No selection option, the existing file is
always extended
Format of the data
blocks
BLOCK-CONTROL-INFO
is defined by the corresponding
(class 2) system parameter
BLOCK-CONTROL-INFO =
*PAMKEY/ *WITHIN-DATA-BLOCK/
*NO 4)
Definition of file
attributes
File name
1)
nnnn = TSN of the task to be monitored
PRIMARY-ALLOCATION and SECONDARY-ALLOCATION each 48 unless defined otherwise by
the user.
3) In the case of an SM2 output file assigned using link names, the BUFFER-LENGTH and SPACE
4) attributes are taken from the standard file, unless specified otherwise by the user.
4) The BLOCK-CONTROL-INFO=*NO operand is treated like BLOCK-CONTROL-INFO=
*WITHIN-DATA-BLOCK, because only SAM format is permitted for the file.
2)
Notes
To generate module-related program counter and SVC statistics, the load information
(the load address and length) of each module is required for each module which has
been linked into the monitored program or is to be loaded by the monitored program.
When the program or measurement is terminated by means of the /STOP-TASKMEASUREMENT command, SM2 determines this module information and writes it to
the SM2 output file.
U3585-J-Z125-8-76
193
Activating user task monitoring
SM2 operation
Under certain circumstances SM2 can only supply incomplete information or none at
all:
194
–
If the program to be monitored uses overlay techniques, the module loading information should be recorded using LOAD-INFO=DETAILED. If this is not done, the
samples and SVCs for all overlaid modules are assigned to the module loaded at
the time monitoring is terminated.
–
No information will be supplied for modules/subsystems loaded as SHARED.
–
No information will be supplied for programs which are linked and loaded without
LSD (List for Symbolic Debugging).
–
No information will be supplied for code sections which were not generated with the
aid of load events (e.g. if the code was put in memory dynamically requested by
means of MOVE commands).
U3585-J-Z125-8-76
SM2 operation
SM2 output file
4.6 Writing to the SM2 output file
Introduction
In addition to report output at the terminal and on the printer, consecutive output of
monitored data to the SM2 output file is provided for.
At file creation time, a system task is generated for writing to the SM2 output file. This
system task terminates when the SM2 output file is closed.
Use of the SM2 output file is recommended
–
when system utilization is to be monitored for an extended period of time (standard
case, trend monitoring)
–
for bottleneck analysis (peak load analysis) if special monitored data is required in
addition to the global system monitored data. The corresponding monitoring programs
must be activated for this purpose.
Only the SM2 administrator can create and close the SM2 output file.
The file attributes are preset by SM2, but the SM2 administrator can change the preset
default options.
The SM2R1 analysis routine converts the monitored data to bar charts and/or tables with
statistical data before output.
The SM2R1 data interface (SM2R1 transfer file) is available to users who wish to analyze
monitored data using their own programs. For information on the record structure of this file,
see the chapter “SM2R1 analysis routine” in Volume 2 of the SM2 manual [21]).
Attributes of the SM2 output file
The SM2 administrator can choose to create an SM2 output file with the preset file attributes
or to open an SM2 output file with freely selected attributes.
SM2 output file with preset file attributes
This file is opened with the statement OPEN-LOG-FILE FILE=*STD. SM2 opens a SAM file
in output mode and catalogs it under the name SM2.hostname.yyyy-mm-dd.sss.nn.
Here, hostname indicates the assignment to a host, yyyy.mm.dd is the date on which the
file was created, sss is the number of the BS2000 session and nn is the consecutive number
of the SM2 output file within that session (counted from 1).
U3585-J-Z125-8-76
195
SM2 output file
SM2 operation
SM2 output file with freely selected file attributes
Such a file is created with the statement OPEN-LOG-FILE FILE=*BY-LINK-NAME after the
name and attributes have been defined with the ADD-FILE-LINK command.
It is possible to define
–
–
a PAM file in output mode with a freely selectable name, or
a SAM file with freely selectable open mode and file name.
The following table contains the file attributes which are preset in SM2 or can be defined
with the FILE command:
File creation
operand
FILE=*STD
FILE=*BY-LINK-NAME
File attribute
definition
Preset
Optional
File name
SM2.hostname.
yyyy-mm-dd.sss.nn
filename 1 )
File link name
Block size
2)
SMLINK
BUFFER-LENGTH = BUFFER-LENGTH = *STD (SIZE=16)
*STD (SIZE=16)
Storage space
allocation
SPACE=*RELATIVE
(PRIMARYALLOCATION=512,
SECONDARYALLOCATION=512)
selectable 2 )
Access method
SAM
ACCESS-METHOD =
*UPAM
[,SHARED-UPDATE=
YES]3 )
ACCESS-METHOD =
*SAM
Open mode
OUTIN
OPEN-MODE = *OUTIN
OPEN-MODE =
*OUTPUT / *EXTEND
Format of the data
blocks
BLOCK-CONTROLINFO = *WITHINDATA-BLOCK
BLOCK-CONTROL-INFO = *PAMKEY /
*WITHIN-DATA-BLOCK / *NO
Table 6: Possible attributes of the SM2 output file
SM2 treats the operand BLOCK-CONTROL-INFO= *NO in the same way as
BLOCK-CONTROL-INFO= *WITHIN-DATA-BLOCK.
196
U3585-J-Z125-8-76
SM2 operation
SM2 output file
1)
It is advisable to select a file name that indicates the date and time of file creation, so
as to facilitate file sequencing in the input order required by SM2U1.
2)
Only block lengths of 16 are used. If no block length is specified, this is set to 16 by SM2.
If BUFFER-LENGTH is specified without the SPACE operand, SM2 uses the default
value 512 for the primary storage allocation and for the secondary storage allocation.
3)
ACCESS-METHOD=*UPAM,SHARED-UPDATE=*YES should be selected if the SM2
monitored data is to be analyzed using SM2R1-PC or SM2ONLINE-PC (V1.0 only).
This means that BUFFER-OUTPUT = *IMMEDIATE must be selected in the OPENLOG-FILE statement.
If the SM2 output file is created on a private volume (additional operands in the CREATEFILE command VOLUME=..,DEVICE-TYPE=...), the private disk must be defined as
"SYSTEM" with /SET-DISK-PARAMETER .. USER-ALLOCATION=*SHARE.
Note
The high block length may result in mismatches, which in turn cause the file to become
very large, particularly if BUFFER-OUTPUT=*IMMEDIATE was selected in the OPENLOG-FILE statement. However, this setting allows you to minimize the number of
“MISSED RECORDS”. The majority of mismatches can be eliminated by executing an
SM2U1 run, which means the advantages of this setting far outweigh the disadvantages.
“MISSED RECORDS” are records that could not be written to the SM2 output file due
to an input/output bottleneck and were therefore lost. They are indicated in the STATUS
TABLE screen and by SM2R1 in EVALUATION STATISTICS.
Managing the SM2 output file
PAM output file
PAM output files are formatted in blocks.
The records are not separated by block boundaries.
An SM2 output file created with SHARED-UPDATE=*YES can be analyzed by SM2R1-PC
during the monitoring process or converted to a SAM file by SM2U1 and then analyzed
using SM2R1.
U3585-J-Z125-8-76
197
SM2 output file
SM2 operation
SAM output file
The SAM output file format is logically similar to the PAM output file format.
An advantage of SAM output files is that they need not be converted before the SM2R1
analysis routine is called (see the chapter “SM2U1 utility routine” in Volume 2 of the SM2
manual [21]).
In the OUTPUT open mode, a new SAM output file can be created or a file can be replaced
by another file with the same name.
In the EXTEND open mode, an existing file can be expanded to accommodate further
record groups. This obviates the need to call the SM2U1 routine for merging several SM2
output files.
Opening and closing the SM2 output file
The OPEN-LOG-FILE statement opens the SM2 output file, while the CLOSE-LOG-FILE
statement closes the SM2output file; likewise the SM2 output file is implicitly closed when
SM2 is stopped (STOP-SUBSYSTEM SUBSYSTEM-NAME=SM2).
Notes
After a system breakdown or if the SM2 output file was not closed properly for some
other reason, the file must be processed with the SM2U1 routine.
The SM2 output file can exceed the limit specified by PUBLIC-SPACE-LIMIT in the
ADD-USER- or MODIFY-USER-ATTRIBUTES command, even if PUBLIC-SPACEEXCESS=*NO has been specified.
If the SM2 output file is already open, the OPEN-LOG-FILE statement closes it and then
opens a new SM2 output file. The monitoring programs DISK, SERVICETIME and
TASK, which write monitored data exclusively to the SM2 output file (see table
“Overview of the SM2 monitoring programs” on page 34), are not terminated in the
process.
An SM2 output file created with SHARED-UPDATE=*YES, can be analyzed during the
monitoring process using SM2R1-PC or SM2ONLINE-PC (V1.0 only).
198
U3585-J-Z125-8-76
SM2 operation
Examples
4.7 SM2 monitoring program: examples
Example 1
This simple example illustrates how SM2 is started and stopped again later on.
The following default options are used:
–
–
monitoring cycle: 150 seconds
sampling cycle: 800 milliseconds
Reports A (ACTIVITY), M (MEMORY), C (CHANNEL) and D (DEVICE) are output at the
terminal in automatic output mode. SM2 is interrupted after some time with the BREAK
function (terminal key) and terminated.
/START-SM2
START
.
(Output of the reports)
.
.
BREAK or [K2]
/INFORM-PROGRAM
END
Example 2
In this example, SM2 is started with data output to the SM2 output file. The file is given the
default name SM2.hostname.yyyy.mm.dd.sss.nn. The monitoring cycle is preset to 150
seconds and the sampling cycle to 800 milliseconds. The RESPONSETIME monitoring
program is started (in accordance with definition 1), and monitors up to 1024 connections.
The default options are used for the number of ranges and for the range limits for the
response, think, transaction and wait times.
The SM2 user task is then terminated and monitoring continues in the background.
SM2 is called again after some time to terminate the RESPONSETIME monitoring program
and close the SM2 output file.
U3585-J-Z125-8-76
199
Examples
SM2 operation
/START-SM2
CALL-ADMINISTRATION-PART
SET-RESPONSETIME-PARAMETER
START-MEASUREMENT-PROGRAM TYPE=*RESPONSETIME
OPEN-LOG-FILE FILE=*STD
END
.
.
.
.
/START-SM2
CALL-ADMINISTRATION-PART
STOP-MEASUREMENT-PROGRAM TYPE=*RESPONSETIME
CLOSE-LOG-FILE
END
Example 3
In this example, SM2 is started with data output to the SM2 output file. The file is given the
default name SM2.hostname.yyyy.mm.dd.sss.nn. The monitoring cycle is set to 20 seconds
and the sampling cycle to 200 ms. The RESPONSETIME monitoring program is started in
accordance with definition 1, and monitors up to 1024 connections. The default options are
used for the number of ranges and for the range limits for the response, think, transaction
and wait times. All monitored data is written to the SM2 output file. At the terminal, the A
(ACTIVITY), M (MEMORY), C (CHANNEL) and D (DEVICE) reports are output in automatic
output mode.
After some time, SM2 is interrupted with the BREAK function (terminal key) and terminated.
However, the SM2 output file remains open and the RESPONSETIME monitoring program
continues running.
/START-SM2
CALL-ADMINISTRATION-PART
SET-RESPONSETIME-PARAMETER
START-MEASUREMENT-PROGRAM TYPE=*RESPONSETIME
OPEN-LOG-FILE FILE=*STD
MODIFY-MEASUREMENT-PERIODS OFFLINE-PERIOD=20,SAMPLING-PERIOD=200
CALL-EVALUATION-PART
START
.
(Output of the Reports)
.
.
BREAK or [K2]
/INFORM-PROGRAM
END
200
U3585-J-Z125-8-76
5 SM2 screen output
The monitoring task collects monitored data during an online monitoring cycle, edits it, and
enters it in the central buffer when the online monitoring cycle is completed.
From the central buffer, each SM2 user task transfers the data into its own buffer and enters
it in output forms called reports.
These monitored data reports can then either be output at regular intervals throughout the
output cycle (automatic output mode), or can be requested individually by the user
(controlled mode). See “Statements for controlling reports” on page 151.
In addition, SM2 information screens are available, some in the administration facility only
and others in the analysis subinterval and the administration facility. Instead of monitored
data, these contain information on the monitoring process and on the status of SM2. The
following information screens can be output at the request of the user:
–
–
–
–
–
–
U3585-J-Z125-8-76
MEASUREMENT STATUS
USER MEASURED OBJECTS
DEFINED PARAMETER
ACTIVE PARAMETER
STATUS TABLE
SELECTED HOSTS
201
SM2 reports
SM2 screen output
SM2 reports
The monitored data is broken down into factually related groups and entered in various
reports. The following reports may be output without the SM2 administrator having to
activate an optional monitoring program.
202
ACF report
Overview of activation control of system task
management
ACTIVITY report
Overview of the overall system load
CATEGORY QUEUE report
Overview of the queue occupancy of all categories
CATEGORY WSET report
Overview of the working sets of all categories
CHANNEL report
Overview of the current channel occupancy.
The CHANNEL report is a special case:
The values BUSY and NON OVERLAP are output by
default. For other monitored data, you must use the
CHANNEL-IO monitoring program.
CPU report
Overview of CPU utilization for the various CPUs
DEVICE report
Overview of peripheral activities
GLOBAL report
Overview of host-specific monitored data on important
system activities
MEMORY report
Overview of main memory load and virtual address space
PCS report
Overview of PCS (Performance Control Subsystem)
activity (used only if PCS is installed)
SHARED PVS report
Overview of the I/Os and the queue lengths of the shared
pubsets
U3585-J-Z125-8-76
SM2 screen output
SM2 reports
The following reports can only be output if the SM2 administrator has activated the corresponding optional monitoring program beforehand or authorized the appropriate user
monitoring operations (MODIFY-USER-ADMISSION):
BCAM CONNECTION report
Overview of bucket-specific time statistics and information
on data sent and received
CATEGORY report
Overview of the consumption statistics of all categories
CHANNEL report
Overview of the current channel occupancy.
The CHANNEL report is a special case:
The values BUSY and NON OVERLAP are output by
default. For other monitored data, you must use the
CHANNEL-IO monitoring program.
CMS report
Overview of the activities of the catalog management
system (CMS)
DAB report
Overview of the activities of the disk access buffer function
(for a more detailed overview, see the DAB-CACHE
report)
DISK FILE report
Overview of the file activities of selected disk devices
DLM report
Overview of the activities of the Distributed Lock Manager
FILE report
Overview of the access values of files previously designated
GS report
Overview of the utilization of global storage
GSVOL report
Overview of the utilization of emulated volumes in global
storage (GS)
ISAM report
Overview of ISAM buffer management performance
MSCF report
Overview of the monitored data of the MSCF subsystem
NET DEVICE report
Overview of the utilization of network devices (ZAS,
mainframe interface controller)
NSM report
Overview of host-specific monitoring values of the
Distributed Lock Manager
PCA report
Overview of the monitored on the cache controllers
managed by the PCA subsystem (for more detailed information see the PCA CACHE report and the PCA DEVICE
report)
PERIODIC TASK report
Overview of the most important utilization data of all tasks:
privileged users receive information on all tasks, while
nonprivileged users receive information relating only to
those tasks under their own user IDs
U3585-J-Z125-8-76
203
SM2 reports
204
SM2 screen output
PFA CACHE report
Overview of the use of various caches (for more detailed
information, see the PFA CONTROLLER report)
POSIX report
Output of the monitoring data of the POSIX subsystem
RESPONSETIME report
Overview of the response time behavior throughout the
system
SVC report
Overview of the number of SVCs called
SYMMETRIX CONTROLLER
report
Overview of the utilization of SYMMETRIX controllers (for
more detailed information, see the SYMMETRIX DEVICE
report)
SYMMETRIX DEVICE report
Overview of the monitored data on selected controllers
TCP/IP report
Overview of the volume of data transmitted per IP address
and port number
TLM report
Overview of the Task Lock Manager calls (for privileged
users only)
UTM report
Overview of the consumption statistics for UTM applications and detailed values for the individual applications in
the UTM APPLICATION report
VM2000 report
Overview of values for the individual virtual machines of a
VM2000 system
U3585-J-Z125-8-76
SM2 screen output
SM2 information screens
SM2 information screens
The information screens are special in that they contain no monitored data, but provide
information on the monitoring run and on the SM2 status. These screens are only output if
explicitly requested by the user.
The first two screens listed are available in both the analysis subinterval and the
administration facility. The others are only available to privileged users in the administration
facility.
MEASUREMENT STATUS
Overview of all defined and active monitoring
programs
USER MEASURED OBJECTS
Overview of user-monitored objects
DEFINED PARAMETER
Overview of the monitoring parameters and
monitored objects defined for the individual
monitoring programs
ACTIVE PARAMETER
Overview of the monitoring parameters and
monitored objects defined for the individual
monitoring programs
STATUS TABLE
Status of the SM2 system tasks and of the
subsystems used by SM2
SELECTED HOSTS
Overview of the hosts selected using the SELECTHOSTS statement
Displaying follow-up screens to information screens
Entry
Meaning
' +' or key [K3] or [DUE
Page forward
' -' or key [K1]
Page backward (if you page backward from the first page,
the first page is output again)
' - -'
Page back to the first page
' END'
Terminate output of follow-on screens
All other entries have the same effect as ’+’.
The scroll commands can also be used to output the information screens of various hosts.
Note
It is not possible to page in batch and procedure modes. All follow-on screens are
always output.
U3585-J-Z125-8-76
205
SM2 information screens
SM2 screen output
The header line of each screen contains global information, namely:
CYCLE
Duration of the (online) monitoring cycle in seconds, i.e. period after
which the collected values are available for output
SAMPLES
Number of samples taken within the (online) monitoring cycle
These values are output if they are relevant to the current screen.
The host name is output in the top left-hand corner.
The date and time are output in the top right-hand corner of the screen. In the case of
statistics screens, this is the point at which the last (online) monitoring cycle was
terminated. For all other screens, it is the current time when the screen is output.
In the screens which concern the host network (GLOBAL, NSM, SHARED-PVS), the
header line displays the data of the first host listed in the report or of the first selected host.
If the list of selected hosts contains the local host, this host is always the first one in the list.
The remaining hosts appear in the order in which they were specified by the user in the
SELECT-HOSTS statement.
Representation of values in SM2 output screens
The string ***** is output in place of a value if no value is available.
The string <<<<< is output if computation is not possible. The string >digit digit digit ... is
output if the value does not fit into the available space.
Special terminals
–
3270 terminals
The reports can also be output on a 3270 terminal. The terminal type is queried (by
means of the TSTAT macro) and, if the 3270 terminal is recognized, the 23rd line (blank
line) of each report is omitted.
–
Terminals with a German keyboard
When reports are output on terminals with a German keyboard, for the sake of clarity,
the delimiter “|” is output as “!” rather than “ö”. The TSTAT macro is also used to query
the keyboard. In this case, PDN must be generated appropriately. When generating
PDN, the parameter DEUTSCH = JA / NEIN (German=yes/no) in the XOPCH macro
must be set to JA. The default setting is NEIN (see the “PDN Generation" manual [12]).
–
Terminal emulations on the PC
In the case of terminal emulations on t he PC (e.g. MT9750), the character set “International” must be set in the keyboard configuration in order to output the delimiter “/”.
206
U3585-J-Z125-8-76
SM2 screen output
Output sequence
Output sequence
Report name
Identifiers
GLOBAL
N
O
NSM
N
O
SHARED PVS
N
O
M
ACTIVITY
MEMORY
CHANNEL
O
M 1)
O
M
DEVICE
PERIODIC TASK
PRIVILEGED FILE
M
USER FILE
P
RESPONSETIME
M
ACF
CATEGORIE QUEUE
CATEGORIE WSET
PCS
DAB
O
M
O
M
CMS
O
M
UTM
O
M
DAB CACHE
UTM APPLICATION
F
F
M
PRIVILEGED ISAM
M
USER ISAM
P
VM2000
M
TLM
M
PCA CONTROLLER
O
M
PCA CACHE
F
O
M
PCA DEVICE
F
O
M
CPU
O
SVC
M
PFA CACHE
PFA CONTROLLER
F
O
M
O
M
Table 7: Output sequence
U3585-J-Z125-8-76
207
Output sequence
SM2 screen output
Report name
Identifiers
POSIX
M
CATEGORIE
M
MSCF
M
NET DEVICE
O
DLM
M
M
GSVOL
O
M
GS
O
M
TCP IP
O
M
BCAM CONNECTION
O
M
DISK FILE
O
M
SYMMETRIX CONTROLLER
O
M
O
M
SYMMETRIX DEVICE
F
Table 7: Output sequence
N:
F:
O:
M:
P:
Network report
Follow-up screen requested by means of a special statement
Report containing an overflow screen for further monitored objects
Monitoring program must be activated
Monitoring process must be permitted for the nonprivileged user
1)
The CHANNEL report contains information from the CHANNEL-IO monitoring
program as well as standard monitored data.
This sequence is maintained even if the user has suppressed output of some reports. The
suppressed records are simply skipped without any time being lost.
The same applies to output in controlled mode.
The reports of a given monitoring cycle can be requested in the above sequence. The data
of the next monitoring cycle is output only after the last record of the preceding cycle has
been output.
The reports are listed in alphabetical order in the following description.
208
U3585-J-Z125-8-76
SM2 reports
ACF report
5.1 SM2 reports
ACF report
This report supplies information on the activation control function (ACF) of the PRIOR task
scheduler. The data can be used to assess the internal activation decisions. Data
interpretation and consequential actions presuppose intimate familiarity with the activation
algorithm used in the PRIOR task scheduler and should therefore be left to system
specialists.
Report output
The REPORT ACF statement is used to request the output of the ACF report.
D016ZE04 SM2 ACF
99-03-24
14:30:00
COUNTERS PER MIN
+--------+--------+--------+--------+--------+--------+--------+--------+
| ACTIVA | FORCDA | PREEMT | INVOCL | INVOCS | MICTSR | SYSERV | FVI
|
| 3739.6 |
0.0 |
0.0 |
42.9 | 3738.1 | 5013.3 |
38.4 | 6712.5 |
+--------+--------+--------+--------+--------+--------+--------+--------+
RESOURCE UTILIZATION IN LAST INTERVAL
+--------+--------------+--------------+--------------+
|RESOURCE|
LOW
|
MEDIUM
|
HIGH
|
+--------+--------------+--------------+--------------+
| CPU
|
64.0 %
|
24.4 %
|
11.6 %
|
+--------+--------------+--------------+--------------+
| MEMORY |
100.0 %
|
0.0 %
|
0.0 %
|
+--------+--------------+--------------+--------------+
| PAGING |
100.0 %
|
0.0 %
|
0.0 %
|
+--------+--------------+--------------+--------------+
Monitoring information
COUNTERS PER MIN
The number of calls per minute is output for each of the variables listed in the table.
ACTIVA
Total number of task activations per minute
FORCDA
Number of task deactivations per minute enforced by ACF
U3585-J-Z125-8-76
209
ACF report
SM2 reports
PREEMT
Number of preemptions per minute
INVOCL
Number of "long" ACF invocations per minute
INVOCS
Number of "short" ACF invocations per minute
MICTSR
Number of micro-time-slice runouts per minute
SYSERV
Number of system services runouts per minute
FVI
Number of "Fremd vor Idle" (remote before idle) accesses per
minute. "Fremd vor Idle" access: a processor initiates a task from
the local Q1 of another processor if its own Q1 is empty, so as not
to become idle.
If all counts in a monitoring cycle are zero, SM2 outputs the message NO ACTIVATION
CONTROL FUNCTION ACTIVITY IN LAST INTERVAL.
D016ZE04 SM2 ACF
99-03-24
14:30:00
COUNTERS PER MIN
+--------+--------+--------+--------+--------+--------+--------+--------+
| ACTIVA | FORCDA | PREEMT | INVOCL | INVOCS | MICTSR | SYSERV | FVI
|
| 3739.6 |
0.0 |
0.0 |
42.9 | 3738.1 | 5013.3 |
38.4 | 6712.5 |
+--------+--------+--------+--------+--------+--------+--------+--------+
RESOURCE UTILIZATION IN LAST INTERVAL
+--------+--------------+--------------+--------------+
|RESOURCE|
LOW
|
MEDIUM
|
HIGH
|
+--------+--------------+--------------+--------------+
| CPU
|
64.0 %
|
24.4 %
|
11.6 %
|
+--------+--------------+--------------+--------------+
| MEMORY |
100.0 %
|
0.0 %
|
0.0 %
|
+--------+--------------+--------------+--------------+
| PAGING |
100.0 %
|
0.0 %
|
0.0 %
|
+--------+--------------+--------------+--------------+
RESOURCE UTILIZATION IN LAST INTERVAL
Utilization of the resources CPU, memory and paging is classified as low, medium and high
utilization. The percentages given in the table represent the share of total calls in the
monitoring cycle.
210
U3585-J-Z125-8-76
SM2 reports
ACTIVITY report
ACTIVITY report
This report provides the user with an overview of the most important system activities.
Report output
The REPORT ACTIVITY statement is used to request the output of the ACTIVITY report.
POSIX and RESPONSE data can only be output if the corresponding monitoring program
is activated.
When analyzing the monitoring results, it should be remembered that the SM2 monitoring
task is a system task that is kept active for the duration of the whole monitoring process.
Another system task is created for data entry in the SM2 output file, which is likewise kept
active for the duration of the whole monitoring process; the same applies to user task
monitoring.
When systems comprising a number of logical machines are being monitored, the mean
values of the monitored data for all active logical machines are output.
D016ZE04 SM2 ACTIVITY (VM)
CYCLE:
CPU UTILIZATION ( 2 LM'S)
+------+------+------+------+------+
| TU | TPR | SIH | IDLE | /390 |
+------+------+------+------+------+
| 22.6%| 22.5%| 10.4%| 44.3%| 0.0%|
+------+------+------+------+------+
120 S
PCS DATA
+-------+------+
| SRACT |RDACT |
+-------+------+
| 42739|
1.0|
+-------+------+
TASKS (CURRENT TASK TYPE)
+-------+-------+-------+-------+-------+
| BATCH| DIALOG|
TP |
SYS |#-TASKS|
+-------+-------+-------+-------+-------+
|
62.0| 368.5|
46.0| 198.8| 675.6|
+-------+-------+-------+-------+-------+
MEMORY
+--------+--------+--------+
|
NPP | WS-ACT |WS-WACT |
+--------+--------+--------+
| 480617 |
8915 |
0 |
+--------+--------+--------+
U3585-J-Z125-8-76
SAMPLES:
293
99-03-24
14:30:00
IO'S PER SEC
+-------+-------+-------+
| TOTAL | DISK | PAGE |
+-------+-------+-------+
| 402.7 | 210.5 |
0.0 |
+-------+-------+-------+
TASKS IN SCHEDULER QUEUES
+--------+--------+--------+--------+
| #-ACT | CPU-Q | IO-Q | PAG-Q |
+--------+--------+--------+--------+
|
95.0 |
1.7 |
2.7 |
0.0 |
+--------+--------+--------+--------+
POSIX DATA
+--------+---------+
| SCALL/S| FORK/S |
+--------+---------+
| 490.6 |
0.3 |
+--------+---------+
RESPONSE STATISTICS
+-------+-------+-------+
|NRESP/S| ART(S)| ATT(S)|
+-------+-------+-------+
| 38.2 |
0.1 |
0.6 |
+-------+-------+-------+
211
ACTIVITY report
SM2 reports
Monitoring information
(VM)
This abbreviation will be output in the first line if the system
monitored is a VM2000 system.
CPU UTILIZATION
(2 LM’S)
This additional information indicates how many logical machines
were active.
Proportion of CPU time during which the CPU was in the following processor states:
TU
User programs
TPR
Processing of program interrupts
SIH
Analysis of program interrupts
IDLE
Inactive
For systems comprising a number of logical machines, mean values
for all active logical machines are output.
The sum of the TU, TPR, SIH and IDLE times is always 100%. For
evaluation of the TU and TPR percentages, see section “Accuracy
of the SM2 data” on page 343ff.
In the monitoring cycle in which reconfiguration took place, these
values and the number of I/O operations are marked as invalid (*).
SM2 supplies a STOP time for each logical machine. This value
indicates the proportion of time during which the relevant logical
machine was inoperable.
The STOP time is output in the SM2 report CPU and by SM2R1 in
the *CPU report group when the parameter PROCESSORSPLITTING=*YES is specified.
/390
This value is supplied only on SR2000 machines. It indicates the
relative proportion of TU that has elapsed in /390 mode.
Note
The monitored data on CPU utilization and on service units is based on native CPU time
(see “CPU time and CPU service units on SR2000” on page 446 of the glossary).
212
U3585-J-Z125-8-76
SM2 reports
ACTIVITY report
PCS DATA
SRACT
Current overall system service rate
RDACT
Current delay of all jobs in the overall system
These fields will not contain any data if PCS was inactive during the last monitoring cycle.
IO’S PER SEC
These counts indicate the number of input/output operations (EXCP calls).
TOTAL
Sum of all I/O operations per second (including paging)
DISK
Number of DMS I/O operations to disk units per second (without
paging I/O operations)
PAGE
Number of paging I/O operations per second.
All paging operations (reading and writing) are counted.
U3585-J-Z125-8-76
213
ACTIVITY report
SM2 reports
D016ZE04 SM2 ACTIVITY (VM)
CYCLE:
CPU UTILIZATION ( 2 LM'S)
+------+------+------+------+------+
| TU | TPR | SIH | IDLE | /390 |
+------+------+------+------+------+
| 22.6%| 22.5%| 10.4%| 44.3%| 0.0%|
+------+------+------+------+------+
120 S
PCS DATA
+-------+------+
| SRACT |RDACT |
+-------+------+
| 42739|
1.0|
+-------+------+
TASKS (CURRENT TASK TYPE)
+-------+-------+-------+-------+-------+
| BATCH| DIALOG|
TP |
SYS |#-TASKS|
+-------+-------+-------+-------+-------+
|
62.0| 368.5|
46.0| 198.8| 675.6|
+-------+-------+-------+-------+-------+
MEMORY
+--------+--------+--------+
|
NPP | WS-ACT |WS-WACT |
+--------+--------+--------+
| 480617 |
8915 |
0 |
+--------+--------+--------+
SAMPLES:
293
99-03-24
14:30:00
IO'S PER SEC
+-------+-------+-------+
| TOTAL | DISK | PAGE |
+-------+-------+-------+
| 402.7 | 210.5 |
0.0 |
+-------+-------+-------+
TASKS IN SCHEDULER QUEUES
+--------+--------+--------+--------+
| #-ACT | CPU-Q | IO-Q | PAG-Q |
+--------+--------+--------+--------+
|
95.0 |
1.7 |
2.7 |
0.0 |
+--------+--------+--------+--------+
POSIX DATA
+--------+---------+
| SCALL/S| FORK/S |
+--------+---------+
| 490.6 |
0.3 |
+--------+---------+
RESPONSE STATISTICS
+-------+-------+-------+
|NRESP/S| ART(S)| ATT(S)|
+-------+-------+-------+
| 38.2 |
0.1 |
0.6 |
+-------+-------+-------+
Monitoring information
TASKS (CURRENT TASK TYPE)
BATCH
Average number of batch tasks during the monitoring cycle
DIALOG
Average number of interactive tasks during the monitoring cycle
TP
Average number of TP tasks during the monitoring cycle
SYS
Average number of system tasks during the monitoring cycle
#-TASKS
Average number of all tasks logged on to the system during the
monitoring cycle
Note
All batch, interactive, TP and system tasks are assigned to the TYPE to which they
belong at the time of sampling.
214
U3585-J-Z125-8-76
SM2 reports
ACTIVITY report
TASKS IN SCHEDULER QUEUES
#-ACT
Average number of all active tasks (including SM2 tasks)
CPU-Q
Average number of tasks waiting to use the processor(s) and of
tasks currently using the processor(s) (task queues 0 and 1, without
the SM2 monitoring task)
IO-Q
Average number of tasks waiting for I/O termination (tasks in task
queue 4 with I/O pend code)
PAG-Q
Average number of tasks waiting for paging (tasks in task queue 3)
U3585-J-Z125-8-76
215
ACTIVITY report
SM2 reports
D016ZE04 SM2 ACTIVITY (VM)
CYCLE:
CPU UTILIZATION ( 2 LM'S)
+------+------+------+------+------+
| TU | TPR | SIH | IDLE | /390 |
+------+------+------+------+------+
| 22.6%| 22.5%| 10.4%| 44.3%| 0.0%|
+------+------+------+------+------+
120 S
PCS DATA
+-------+------+
| SRACT |RDACT |
+-------+------+
| 42739|
1.0|
+-------+------+
TASKS (CURRENT TASK TYPE)
+-------+-------+-------+-------+-------+
| BATCH| DIALOG|
TP |
SYS |#-TASKS|
+-------+-------+-------+-------+-------+
|
62.0| 368.5|
46.0| 198.8| 675.6|
+-------+-------+-------+-------+-------+
MEMORY
+--------+--------+--------+
|
NPP | WS-ACT |WS-WACT |
+--------+--------+--------+
| 480617 |
8915 |
0 |
+--------+--------+--------+
SAMPLES:
293
99-03-24
14:30:00
IO'S PER SEC
+-------+-------+-------+
| TOTAL | DISK | PAGE |
+-------+-------+-------+
| 402.7 | 210.5 |
0.0 |
+-------+-------+-------+
TASKS IN SCHEDULER QUEUES
+--------+--------+--------+--------+
| #-ACT | CPU-Q | IO-Q | PAG-Q |
+--------+--------+--------+--------+
|
95.0 |
1.7 |
2.7 |
0.0 |
+--------+--------+--------+--------+
POSIX DATA
+--------+---------+
| SCALL/S| FORK/S |
+--------+---------+
| 490.6 |
0.3 |
+--------+---------+
RESPONSE STATISTICS
+-------+-------+-------+
|NRESP/S| ART(S)| ATT(S)|
+-------+-------+-------+
| 38.2 |
0.1 |
0.6 |
+-------+-------+-------+
Monitoring information
MEMORY
216
NPP
Number of pageable pages available in main memory
WS
Internal planning value (PPC = planned page count) which determines the size of the page working set of a task when the next
activation decision is taken (unit: 4-Kb pages)
WS-ACT
Sum of the average planned page counts of all active tasks
(including the SM2 monitoring task) (task queues 0 to 4)
WS-WACT
Sum of the average planned page counts of all ready interactive
tasks (task queue 5, with PCS also task queue 6)
U3585-J-Z125-8-76
SM2 reports
ACTIVITY report
POSIX DATA
SCALL/S
Number of all system calls per second
FORK/S
Number of FORK system calls per second
These two ACTIVITY report values are the same as the corresponding values of the POSIX
screen.
These fields will not contain any values if the POSIX monitoring program is not activated.
RESPONSE STATISTICS
NRESP/S
Number of responses per second
ART(S)
Average response time in seconds
ATT(S)
Average think time in seconds
These three ACTIVITY report response time values are the same as the corresponding
values of the global RESPONSETIME report screen.
These fields will not contain any values if the RESPONSETIME monitoring program is not
started.
U3585-J-Z125-8-76
217
BCAM CONNECTION report
SM2 reports
BCAM CONNECTION report
This report supplies information on the data sent and received as well as bucket-specific
time statistics for defined connection sets.
Report output
The REPORT BCAM statement is used to request the output of the BCAM CONNECTION
report.
The report can only be output if the SM2 administrator has
– defined the monitoring parameters using the SET-BCAM-CONNECTION-PARAMETER
statement
– defined the connection sets to be monitored using the ADD-BCAM-CONNECTIONSET statement
– started the monitoring process using the START-MEASUREMENT-PROGRAM
TYPE=*BCAM-CONNECTION statement
A separate screen is output for each of the connection sets to be monitored (up to 32). If
the number of connections to be monitored within a connection set is zero, no report is
output for that connection set.
D016ZE04 SM2 BCAM CONNECTION
SET:
DIALOG
CYCLE:
120 S
# CONNECTIONS:
99-03-24
14:30:00
304
| TSDU | DATA | BUFFER
% | PWIN | PDATA
+-----+-------+-------+-------------+-------+-------+
| IN |
2.1 |
0.2 |
0.0
0 |
5.7 |
9.2 |
| OUT |
8.8 |
3.2 |
0.2
0 |
3.9 | 10.9 |
+-----+-------+-------+-------------+-------+-------+
SCOM | ZWR
+-------+-------+
|
0.0 |
0.0 |
+-------+-------+
+-----------------+-----------------+-----------------+-----------------+
| INWAIT TIME
| REACT TIME
| INPROC TIME
| OUTPROC TIME
|
+-----------------+-----------------+-----------------+-----------------+
| BUCKET
COUNT | BUCKET
COUNT | BUCKET
COUNT | BUCKET
COUNT |
+-----------------+-----------------+-----------------+-----------------+
|
5
256 |
500
238 |
5
255 |
5
776 |
|
10
2 |
1000
8 |
10
3 |
10
21 |
|
100
0 |
2000
3 |
100
0 |
100
156 |
|
1000
0 |
4000
5 |
1000
0 |
1000
106 |
|> 1000
0 |> 4000
4 |> 1000
0 |> 1000
2 |
+-----------------+-----------------+-----------------+-----------------+
218
U3585-J-Z125-8-76
SM2 reports
BCAM CONNECTION report
Monitoring information
SET
Name of the connection set
# CONNECTIONS
Number of (active) connections in the connection set.
The computation includes only those connections that were active
both at the current monitoring time and at the end of the preceding
monitoring cycle.
IN/OUT
Data sent and received
TSDU
Number of TSDUs per second
TSDUs (Transport Data Service Units) correspond to application
jobs on BCAM.
DATA
Average volume of data in KB per TSDU
BUFFER
Amount of cache space occupied by unretrieved messages in KB
and as a percentage of the maximum buffer size.
This value describes the status at the end of the monitoring cycle,
and not the mean value over the entire monitoring cycle.
PWIN
Number of packets without user data (Packet WINdow) per second
PDATA
Number of packets with user data (Packet DATA) per second
SCOM
Number of send jobs per second in the event of a resource
bottleneck (Send Call Over Maximum)
ZWR
Number of packets with Zero Window Information per second, i.e.
where the partner application does not allow the sending of any
further data
INWAIT TIME
Time between the display of a message and the retrieval of that
message from the application
REACT TIME
Time between an application’s send call and the receive call which
immediately precedes it
INPROC TIME
Time between the arrival of a message at BCAM and the retrieval of
that message by the application
OUTPROC TIME
Time between a send call and the transfer of the last byte of a
message to the network
BUCKET
Limit values in milliseconds of the ranges within which the
monitored data is arranged by order of magnitude.
> indicates overflow values.
COUNT
Number of messages sent/received in the individual ranges
U3585-J-Z125-8-76
219
CATEGORY report
SM2 reports
CATEGORY report
This report provides an overview of the consumption statistics of the individual categories.
For each category, the percentage CPU time and the I/O operations for paging and disk
devices are output.
Report output
The REPORT CATEGORY statement is used to request the output of the CATEGORY
report.
The report can only be output if the SM2 administrator has
– defined the devices to be monitored using the SET-SYSSTAT-PARAMETER statement
– started the monitoring process using the START-MEASUREMENT-PROGRAM
TYPE=*SYSSTAT statement
D016ZE04 SM2 CATEGORY
CYCLE:
120 S
99-03-25
| CATEGORY
| CPU-TIME
| PAGING-IO
|
DISK-IO
|
|
NAME
|
(%)
|
(1/S)
|
(1/S)
|
+--------------+--------------+---------------+--------------+
| SUM
|
57.3
|
0.0
|
544.9
|
| SYS
|
5.0
|
0.0
|
34.0
|
| DIALOG
|
0.7
|
0.0
|
5.9
|
| BATCH
|
0.8
|
0.0
|
6.5
|
| TP
|
0.4
|
0.0
|
0.6
|
| TP1
|
6.9
|
0.0
|
22.6
|
| BATCHDB
|
0.0
|
0.0
|
0.0
|
| BATCHF
|
1.6
|
0.0
|
99.6
|
| DIALOG1
|
6.3
|
0.0
|
150.3
|
| DIALOG2
|
5.9
|
0.0
|
65.1
|
| DIALOG3
|
29.2
|
0.0
|
160.2
|
10:44:00
( 2 LM'S)
Monitoring information
This report contains the totals (SUM) for all categories in the first line following the table
header. The data for the individual categories (up to 16) is output in the following lines.
220
U3585-J-Z125-8-76
SM2 reports
CATEGORY report
The columns contain the following data:
CATEGORY NAME
Task category designation
CPU-TIME (%)
Each category’s percentage of the elapsed time in the monitoring
cycle (TU+TPR+SIH+IDLE)
PAGING-IO (1/S)
Total number of paging I/Os per second of the monitoring cycle
The pseudo-category SUM contains all paging I/Os (read, write). In
the individual categories, only the paging I/Os of type read are
output.
DISK-IO (1/S)
Total number of I/O operations performed on disk devices per
second of the monitoring cycle
(2 LM’s)
Number of active logical machines
Note on SR2000
The monitored data on CPU utilization is based on native CPU time (see “CPU time and
CPU service units on SR2000” on page 446 of the glossary).
U3585-J-Z125-8-76
221
CATEGORY QUEUE report
SM2 reports
CATEGORY QUEUE report
The PRIOR task scheduler uses three criteria for controlling main memory and CPU
utilization by the tasks. These criteria are
–
–
–
the task category,
the multiprogramming level, and
the task priority.
Detailed information on these criteria can be found in the manuals "Introductory Guide to
Systems Support" [6] and “Performance Handbook” [5]. In the following, only information
that is relevant for the SM2 reports is discussed.
Task category
In BS2000, 16 task categories are distinguished at present, i.e. the 4 standard categories
–
–
–
–
SYS (internal tasks and remote batch processing)
DIALOG (interactive mode)
BATCH (batch mode)
TP (inquiry-and-transaction mode)
and up to 12 categories that can be defined freely by the system administrator.
Multiprogramming level
The multiprogramming level denotes the number of tasks of a given category that may use
main memory concurrently, i.e. the number of active tasks of a category.
In the /MODIFY-TASK-CATEGORIES command the system administrator uses the
category attributes
MIN MPL
MAX MPL
WEIGHT
to specify the relative priority of each category in order to make decisions regarding
activation (= allocation of authorization to use main memory).
MIN MPL is used to specify a minimum number of active tasks of a category. The system
tries to reach the specified MIN MPL value first.
MAX MPL is used when there is no fixed limit, i.e. activation continues even after the
maximum MPL value as long as no resource bottleneck occurs.
WEIGHT is used to control the sequence of activation.
222
U3585-J-Z125-8-76
SM2 reports
CATEGORY QUEUE report
Report output
The REPORT CATQ statement is used to request the output of the CATEGORY QUEUE
report.
D016ZE04 SM2 CATEGORY QUEUE
CYCLE:
120 S
SAMPLES:
293
99-03-24
14:30:00
|CATEGORY |
TASKS IN SCHEDULER QUEUES
|
MPL
|
| NAME
|CPU-Q|IO-Q |PAG-Q| ACT | WACT | NADM | ALL | MIN | MAX |WEIGHT|
+---------+-----+-----+-----+------+------+------+-------+------+-----+------+
| SUM
| 1.7| 2.7| 0.0| 95.0|
0.0|
0.0| 675.6|
|
|
|
| SYS
| 0.2| 0.2| 0.0| 49.3|
0.0|
0.0| 198.9|
30|
64|
512|
| DIALOG | 0.0| 0.0| 0.0|
0.9|
0.0|
0.0|
33.1|
1|
8|
119|
| BATCH
| 0.0| 0.0| 0.0|
1.8|
0.0|
0.0|
9.0|
2|
4|
95|
| TP
| 0.0| 0.0| 0.0| 20.4|
0.0|
0.0|
34.0|
24|
31|
115|
| TP1
| 0.0| 0.0| 0.0|
2.9|
0.0|
0.0|
12.0|
4|
10|
126|
| BATCHDB | 0.0| 0.0| 0.0|
0.0|
0.0|
0.0|
0.0|
0|
2|
126|
| BATCHF | 0.1| 1.5| 0.0|
8.3|
0.0|
0.0|
53.0|
6|
8|
40|
| DIALOG1 | 0.5| 0.6| 0.0|
3.6|
0.0|
0.0| 327.8|
2|
9|
52|
| DIALOG2 | 0.2| 0.2| 0.0|
3.8|
0.0|
0.0|
3.8|
3|
9|
79|
| DIALOG3 | 0.7| 0.2| 0.0|
4.0|
0.0|
0.0|
4.0|
3|
5|
55|
Monitoring information
This report contains the totals (SUM) for all categories in the first line following the table
header. The data for the individual categories (up to 16) is output in the following lines.
U3585-J-Z125-8-76
223
CATEGORY QUEUE report
SM2 reports
The columns contain the following data:
CATEGORY NAME
Task category designation
TASK IN SCHEDULER QUEUES
CPU-Q
Average number of tasks of a category waiting to use the
processor(s) and of tasks currently using the processor(s) (task
queues 0 and 1, excluding the SM2 monitoring task)
IO-Q
Average number of tasks of a category waiting for I/O termination
(tasks in task queue 4 with I/O pend code)
PAG-Q
Average number of tasks of a category waiting for paging (tasks in
task queue 3)
ACT
Average number of active tasks of a category
WACT
Average number of inactive ready tasks of a category (tasks in task
queue 5)
NADM
Average number of tasks of a category waiting for activation (tasks
in task queue 6; this value is supplied only if PCS is used)
ALL
Total number of all tasks of a category
MPL
MIN
Average value of the minimum multiprogramming level used to
determine the activation of tasks of a category
MAX
Average value of the maximum multiprogramming level used to
determine the activation of tasks of a category.
This value is used primarily to prevent overloading by setting a load
limit.
WEIGHT
Average weight used to determine the activation sequence for the
task categories
In PCS mode the MIN MPL, MAX MPL and WEIGHT values are modified dynamically, i.e.
they no longer contain the system administrator specifications.
224
U3585-J-Z125-8-76
SM2 reports
CATEGORY WSET report
CATEGORY WSET-Report
Report output
The REPORT CATW statement is used to request the output of the CATEGORY WSET
report.
D016ZE04 SM2 CATEGORY WSET
CYCLE:
120 S
SAMPLES:
293
99-03-24
14:30:00
|CATEGORY |
WS-ALL
|
WS-ACT
|
WS-WACT
|
| NAME
| PPC | UPG | PPC | UPG | PPC | UPG |
+---------+-------+-------+-------+-------+-------+-------+
| SUM
| 53579 |386151 | 8915 | 62377 |
0 |
0 |
| SYS
| 5265 | 43006 | 3962 | 41027 |
0 |
0 |
| DIALOG | 2052 | 6901 |
56 |
148 |
0 |
0 |
| BATCH
|
486 | 1352 |
146 |
478 |
0 |
0 |
| TP
| 2430 | 3402 | 1839 | 2938 |
0 |
0 |
| TP1
| 2101 | 4921 |
455 | 1181 |
0 |
0 |
| BATCHDB |
0 |
0 |
0 |
0 |
0 |
0 |
| BATCHF | 1482 | 2611 |
463 | 1079 |
0 |
0 |
| DIALOG1 | 38278 |311814 |
509 | 3382 |
0 |
0 |
| DIALOG2 |
430 | 2498 |
430 | 2498 |
0 |
0 |
| DIALOG3 | 1055 | 9646 | 1055 | 9646 |
0 |
0 |
Monitoring information
This report contains the totals (SUM) for all categories in the first line following the table
header. The data for the individual categories (up to 16) is output in the following lines.
The columns contain the following data:
CATEGORY NAME
Task category designation
WS-ALL
PPC
Sum of the average planned page counts of all tasks in a category
UPG
Sum of the average used page counts of all tasks in a category
U3585-J-Z125-8-76
225
CATEGORY WSET report
SM2 reports
WS-ACT
PPC
Sum of the average planned page counts of the active tasks in a
category
UPG
Sum of the average used page counts of the active tasks in a
category
WS-WACT
PPC
Sum of the average planned page counts of the tasks in a category
waiting for activation.
UPG
Sum of the average used page counts of the tasks in a category
waiting for activation.
For an explanation of the values PPC and UPG, see “paging in BS2000” on page 452 of the
glossary.
226
U3585-J-Z125-8-76
SM2 reports
CHANNEL report
CHANNEL report
This report contains monitored data on the activity of block multiplexer I/O channels.
Report output
The REPORT CHANNEL statement is used to request the output of the CHANNEL report.
The values BUSY and NON OVERLAP are recorded by default.
Other monitored data can be output only if the SM2 administrator has
– defined the channels to be monitored using the SET-CHANNEL-IO-PARAMETER
statement
– started the monitoring process using the statement START-MEASUREMENTPROGRAM TYPE=*CHANNEL .
Data is sorted in accordance with the BUSY value.
Overflow screens may be requested for this report.
D016ZE04 SM2 CHANNEL
CYCLE:
120 S
SAMPLES:
293
99-03-24
14:30:00
CHANNEL | BUSY
| NON
|
PAM
|
BYTES
| NODATA
PATH-ID |
| OVERLAP |
IOS
| #PAGES |
IOS
| #PAGES |
IOS
--------+---------+---------+---------+---------+---------+---------+--------032
|
20 % |
6 % |
7.0 |
336.1 |
0.0 |
0.0 |
0.0
024
|
8 % |
3 % |
27.3 |
225.1 |
0.0 |
0.0 |
0.0
02F
|
6 % |
2 % |
23.3 |
96.9 |
0.0 |
0.0 |
0.4
022
|
5 % |
1 % |
24.0 |
201.2 |
0.0 |
0.0 |
0.0
02E
|
4 % |
1 % |
0.0 |
0.0 |
119.7 |
24.4 |
0.0
052
|
4 % |
2 % |
27.5 |
226.8 |
0.0 |
0.0 |
0.0
054
|
4 % |
2 % |
27.3 |
227.4 |
0.0 |
0.0 |
0.0
05F
|
4 % |
0 % |
23.1 |
99.3 |
0.0 |
0.0 |
0.5
05A
|
3 % |
0 % |
22.6 |
98.1 |
0.0 |
0.0 |
0.5
02A
|
3 % |
1 % |
23.3 |
99.9 |
0.0 |
0.0 |
0.4
05E
|
1 % |
1 % |
0.0 |
0.0 |
71.5 |
5.0 |
0.0
055
|
0 % |
0 % |
0.0 |
0.0 |
0.0 |
0.0 |
0.0
056
|
0 % |
0 % |
0.0 |
0.0 |
0.0 |
0.0 |
0.0
058
|
0 % |
0 % |
0.5 |
0.8 |
0.0 |
0.0 |
0.0
026
|
0 % |
0 % |
0.0 |
0.0 |
0.0 |
0.0 |
0.0
013
|
0 % |
0 % |
0.0 |
0.0 |
0.8 |
0.1 |
0.0
02D
|
0 % |
0 % |
0.0 |
0.0 |
0.0 |
0.0 |
0.0
U3585-J-Z125-8-76
227
CHANNEL report
SM2 reports
Monitoring information
The values BUSY and NON OVERLAP are recorded by default. All other values are output
only if the CHANNEL-IO monitoring program has been activated for the monitored
channels. In the case of non-monitored channels, blanks are entered.
CHANNEL-PATH-ID
Channel address.
BUSY
Percentage of the monitoring cycle during which the corresponding
channel was active.
NON OVERLAP
Percentage of the monitoring cycle during which the corresponding
channel was active and all processors were inactive.
PAM
PAM block transfer:
Number of I/O operations or number of 2K pages transferred per
second.
BYTES
Byte transfer:
Number if I/O operations or number of 2K pages transferred per
second.
NODATA
Number of I/O operations without data transfer per second.
Notes
228
–
Byte multiplexer channels cannot be monitored, since their activity is of secondary
important. Depending on the channel type, the CPU and the type of device connected,
activities which have a load between 0% and 100% are listed. In contrast to block multiplexer channels, high load values do not mean that there is a channel bottleneck, i.e.
high load values can be ignored.
–
SM2 is not notified of device management commands (see the “Commands” manual
[15]). In the monitoring cycle in which the operator enters such commands, the data for
the affected channels may be incorrect
–
No load values can be determined for CPUs with bus peripherals.
–
When using VM2000, please note that the channel occupancy values BUSY and NON
OVERLAP always indicate the overall load of the channel. The percentage utilization by
an individual guest system cannot be determined. The value NON OVERLAP is
therefore insignificant. The monitored data supplied by the CHANNEL-IO monitoring
program always refers to the respective guest system.
–
In the case of SR2000 systems, the values BUSY and NON OVERLAP cannot be
recorded for the BUS channels (channels 0 - F). The value 0 is always output.
U3585-J-Z125-8-76
SM2 reports
CMS report
CMS report
This report supplies performance data on the CMS (Catalog Management System). Data
is collected separately for each catalog. A separate screen is output for each PVS (public
volume set) imported during the last monitoring cycle and for all private volumes. The home
PVS is marked. Detailed information on CMS is contained in the manuals “HIPLEX MSCF”
[4] and “Introductory Guide to Systems Support” [6].
Multiprocessor systems
In a multiprocessor system, the CMS report supplies access data for the tasks of the system
which manages the catalog (LOCAL) as well as access data for tasks running on remote
computers. This data is listed under REMOTE.
In an integrated shared pubset, access by so-called slave processors is also recorded on
the master processor (SHARED identifier).
Report output
The REPORT CMS statement is used to request the output of the CMS report.
The report can only be output if the SM2 administrator has started the monitoring process
using the statement START-MEASUREMENT-PROGRAM TYPE=*CMS.
U3585-J-Z125-8-76
229
CMS report
SM2 reports
D016ZE04 SM2 CMS
CYCLE:
CAT-ID: 2OSG(MASTER)
120 S
SAMPLES:
HIT-RATE: 86.2%
293
99-03-24
14:30:00
#-BMT:128 (RESIDENT)
-------+--------+---------+---------+-------+-------+-------+--------+--------REQ. QU| SER. QU| BLOCK QU|USERID QU| CE QU | SFP QU| SMP QU| PH-RD/S| PH-WRT/S
-------+--------+---------+---------+-------+-------+-------+--------+--------0.03 |
0.00 |
0.03 |
0.03 | 0.16 | 0.00 | 0.00 |
0.6 |
0.7
-------+--------+---------+---------+-------+-------+-------+--------+--------------------------+-----------+-----------+-----------+-----------+-----------ITEMS
|
READ | READ-LBN |
SCAN | UPD-RENAME| WRITE/CLEAR
------------------+-----------+-----------+-----------+-----------+-----------RESPONSETIME (MS)|
1 |
0 |
2 |
|
40
LOCAL-FILE
(/S)|
0.9 |
0.0 |
2.1 |
0.0 |
0.6
JV
(/S)|
0.0 |
0.0 |
0.0 |
0.0 |
0.0
REMOTE-FILE (/S)|
0.0 |
0.0 |
0.0 |
0.0 |
0.0
JV
(/S)|
0.0 |
0.0 |
0.0 |
0.0 |
0.0
SHARED-FILE (/S)|
0.1 |
0.0 |
0.2 |
0.0 |
0.0
JV
(/S)|
0.0 |
0.0 |
0.0 |
0.0 |
0.0
------------------+-----------+-----------+-----------+-----------+------------
Monitoring information
CAT-ID
Catalog identifier
POOL OF
PRIVATE DISKS
This is output for private disks in place of CAT-ID. The monitoring
data refers to the F1 label accesses of all private disks.
HOME-PVS
The catalog is marked with HOME-PVS if it belongs to the home
public volume set.
MASTER
If the catalog belongs to an integrated shared pubset and the SM2
executes on the associated master processor, the catalog is
identified as the MASTER catalog.
SLAVE
If the catalog belongs to an integrated shared pubset and the SM2
executes on the associated slave processor, the catalog is identified
as the SLAVE catalog.
HIT-RATE
No read access is required if a wanted catalog entry is already in a
CMS storage area. HIT-RATE is the percentage of such (nonphysical) accesses of all read accesses.
For information on the CMS storage area refer to the “System Installation” manual [7].
230
U3585-J-Z125-8-76
SM2 reports
CMS report
#-BMT
Number of buffer management tables or buffers used by CMS (refer
to the “System Installation” manual [7])
PAGEABLE
Buffers are pageable (class 4 memory)
or
RESIDENT
D016ZE04 SM2 CMS
CAT-ID: 2OSG(MASTER)
Buffers are resident (class 3 memory). Refer to the “System Installation” manual [7].
CYCLE:
120 S
SAMPLES:
HIT-RATE: 86.2%
293
99-03-24
14:30:00
#-BMT:128 (RESIDENT)
-------+--------+---------+---------+-------+-------+-------+--------+--------REQ. QU| SER. QU| BLOCK QU|USERID QU| CE QU | SFP QU| SMP QU| PH-RD/S| PH-WRT/S
-------+--------+---------+---------+-------+-------+-------+--------+--------0.03 |
0.00 |
0.03 |
0.03 | 0.16 | 0.00 | 0.00 |
0.6 |
0.7
-------+--------+---------+---------+-------+-------+-------+--------+--------------------------+-----------+-----------+-----------+-----------+-----------ITEMS
|
READ | READ-LBN |
SCAN | UPD-RENAME| WRITE/CLEAR
------------------+-----------+-----------+-----------+-----------+-----------RESPONSETIME (MS)|
1 |
0 |
2 |
|
40
LOCAL-FILE
(/S)|
0.9 |
0.0 |
2.1 |
0.0 |
0.6
JV
(/S)|
0.0 |
0.0 |
0.0 |
0.0 |
0.0
REMOTE-FILE (/S)|
0.0 |
0.0 |
0.0 |
0.0 |
0.0
JV
(/S)|
0.0 |
0.0 |
0.0 |
0.0 |
0.0
SHARED-FILE (/S)|
0.1 |
0.0 |
0.2 |
0.0 |
0.0
JV
(/S)|
0.0 |
0.0 |
0.0 |
0.0 |
0.0
------------------+-----------+-----------+-----------+-----------+------------
U3585-J-Z125-8-76
231
CMS report
SM2 reports
Monitoring information
REQ. QU
Average number of requests waiting for the release of a buffer
management table or currently using a buffer management table.
If the request queue is always long, this means that there are too
few buffers compared to the number of CMS calls, i.e. that the
number of buffer management tables should be increased. If the
maximum number of buffer management tables is already being
used, the PVS can be subdivided into smaller pubsets. The desired
number of buffer management tables can be specified at system
setup using the BMTNUM parameter.
232
SER. QU
Average number of requests waiting for a serialization lock for exclusively searching a suitable buffer management table or currently
using this lock (relevant for system engineers)
BLOCK QU
Average number of requests waiting for an exclusive lock for
processing a block of a partition or currently using this lock (a
partition corresponds to a user ID)
USERID QU
Average number of requests waiting for a partition lock or currently
using this lock. This lock is not normally exclusive.
CE QU
Average number of requests waiting for an exclusive lock for
processing a catalog entry of a block of a partition or currently using
this lock
SFP QU
Average number of requests to the speedcat for single-feature
pubsets
SMP QU
Average number of requests to the catalog index for systemmanaged pubsets
PH-RD/S
Number of physical read accesses per second (one access
operation for each half-page read)
PH-WRT/S
Number of physical write accesses per second (one access
operation for each half-page written)
U3585-J-Z125-8-76
SM2 reports
CMS report
D016ZE04 SM2 CMS
CYCLE:
CAT-ID: 2OSG(MASTER)
120 S
SAMPLES:
293
HIT-RATE: 86.2%
99-03-24
14:30:00
#-BMT:128 (RESIDENT)
-------+--------+---------+---------+-------+-------+-------+--------+--------REQ. QU| SER. QU| BLOCK QU|USERID QU| CE QU | SFP QU| SMP QU| PH-RD/S| PH-WRT/S
-------+--------+---------+---------+-------+-------+-------+--------+--------0.03 |
0.00 |
0.03 |
0.03 | 0.16 | 0.00 | 0.00 |
0.6 |
0.7
-------+--------+---------+---------+-------+-------+-------+--------+--------------------------+-----------+-----------+-----------+-----------+-----------ITEMS
|
READ | READ-LBN |
SCAN | UPD-RENAME| WRITE/CLEAR
------------------+-----------+-----------+-----------+-----------+-----------RESPONSETIME (MS)|
1 |
0 |
2 |
|
40
LOCAL-FILE
(/S)|
0.9 |
0.0 |
2.1 |
0.0 |
0.6
JV
(/S)|
0.0 |
0.0 |
0.0 |
0.0 |
0.0
REMOTE-FILE (/S)|
0.0 |
0.0 |
0.0 |
0.0 |
0.0
JV
(/S)|
0.0 |
0.0 |
0.0 |
0.0 |
0.0
SHARED-FILE (/S)|
0.1 |
0.0 |
0.2 |
0.0 |
0.0
JV
(/S)|
0.0 |
0.0 |
0.0 |
0.0 |
0.0
------------------+-----------+-----------+-----------+-----------+------------
Monitoring information
The table columns contain the following data:
ITEMS
Name of the monitored variable
READ
Number of read accesses to catalog entries without LBN specification
READ-LBN
Number of read accesses to catalog entries with LBN specification
SCAN
Number of SCAN accesses to catalog entries
UPD-RENAME
Number of write accesses to catalog entries merely involving
manipulation of file attributes
WRITE/CLEAR
Number of write or erase accesses to catalog entries
U3585-J-Z125-8-76
233
CMS report
SM2 reports
The individual lines contain the following data:
RESPONSETIME (MS) Global response times for the above data for files and job
variables and for all accesses, regardless of their origin (local or
remote computer).
234
LOCAL-FILE (/S)
File entry accesses originating from the local computer.
JV (/S)
Job variable entry accesses originating from the local computer.
REMOTE-FILE (/S)
File entry accesses originating from a remote computer.
JV (/S)
Job variable entry accesses originating from a remote computer.
SHARED-FILE (/S)
File entry accesses by a slave.
JV (/S)
Job variable entry accesses by a slave.
U3585-J-Z125-8-76
SM2 reports
CPU report
CPU report
The CPU report provides you with an overview of the utilization of the individual processors.
Report output
The REPORT CPU statement is used to request the output of the CPU report.
An overflow screen may be requested for this report.
D016ZE04 SM2 CPU
CYCLE:
120 S
99-03-24
14:30:00
| NORMED TO 100 %
|
| MEASURED
-----+------+------+------+------+------+------+------+------+------+--------LM | TU % | TPR %| SIH %|IDLE %|/390 %|STOP %| TU % | TPR %| SIH %|IDLE %
-----+------+------+------+------+------+------+------+------+------+--------AVG | 22.6 | 22.5 | 10.4 | 44.3 | 0.0 | 0.0 | 21.8 | 21.6 | 10.1 | 42.6
-----+------+------+------+------+------+------+------+------+------+--------0 | 22.3 | 22.3 | 10.4 | 44.7 | 0.0 | 0.0 | 21.5 | 21.5 | 10.1 | 43.1
1 | 22.9 | 22.6 | 10.4 | 43.9 | 0.0 | 0.0 | 22.1 | 21.7 | 10.0 | 42.2
-----+------+------+------+------+------+------+------+------+------+---------
Monitoring information
LM
Logical machine number.
Percentage of time during which the processor was in the following
states:
TU
(user programs)
TPR
(processing of program interrupts)
SIH
(analysis of program interrupts)
IDLE
(inactive)
/390 %
This value is only supplied on SR2000 machines. It indicates the
relative proportion of TU that has elapsed in /390 mode.
STOP %
Percentage of time during which the processor was not operable
U3585-J-Z125-8-76
235
CPU report
SM2 reports
NORMED
In the NORMED TO 100 % section, the sum of the percentage values for
TU, TPR, SIH and IDLE is 100 %.
MEASURED
The percentage values measured for TU, TPR, SIH and IDLE are output in
the MEASURED section.
When using VM2000, there may be discrepancies between the NORMED
value and the MEASURED value (see also section “SM2 together with
VM2000” on page 347). In particular, you should remember that the times
specified refer to the assigned CPUs of the VM and not to the system as a
whole. The average values across all processors are output in the AVG row.
SR2000:
Under VM2000/SR, the real CPUs are assigned exclusively to guest
systems, i.e. the values under MEASURED are the same as those under
NORMED.
Notes
While SM2 records the sum of the TU and TPR times precisely, this total is divided into
TU and TPR times on the basis of the proportion of the samples that fall to TU and TPR.
This causes statistical inaccuracies in the calculation of TU and TPR times, which can
be noticeable in the case of small TU and TPR values (i.e. when a small number of
samples fall to TU and TPR). TU or TPR values of 0.0 % (online reports) or 0.0 milliseconds (TIME_IO buffer of the C interface), in particular, should therefore be interpreted with caution. The monitored data on CPU utilization is based on native CPU time
(see “CPU time and CPU service units on SR2000” on page 446 of the glossary).
236
U3585-J-Z125-8-76
SM2 reports
DAB reports
DAB reports
These reports provide information on DAB (Disk Access Buffer) activity (for an explanation
of the DAB function, please refer to the “DAB” manual [1]).
The DAB report outputs access statistics for each DAB cache. The DAB CACHE report
contains detailed information on the subareas and files served by a particular DAB cache.
The figure below illustrates the hierarchy of reports and shows the statements used to
request them:
DAB report
SELECT-DAB-CACHE
DAB CACHE report
U3585-J-Z125-8-76
237
DAB report
SM2 reports
DAB report
This report supplies monitored data on the various DAB caches.
Report output
The REPORT DAB statement is used to request the output of the DAB report.
The report can only be output if the SM2 administrator has started the monitoring process
using the statement START-MEASUREMENT-PROGRAM TYPE=*DAB statement.
The monitored data output is sorted under the categories READ and WRITE.
Overflow screens may be requested for this report.
D017ZE03 SM2 DAB
CYCLE:
60 S
99-03-24
11:11:02
|
CACHE-ID
| SIZE
| READ |RD HIT| WRITE |WR HIT| OVER |
|
|
| (1/S) | (%) | (1/S) | (%) | (1/S)|
+----------------------------+---------+--------+------+--------+------+------+
| BUFFER#001
(DAB13V23) | 12.0 MB | 117.2 | 99.4 | 113.7 | 0.0 | 0.0 |
+----------------------------+---------+--------+------+--------+------+------+
Monitoring information
Each line of the report contains data on the different DAB caches created by the BS2000
system administrator using the /START-DAB-CACHING command.
The individual columns contain the following data:
238
CACHE-ID
Name of the DAB cache defined by the user in the CACHE-ID
operand of the /START-DAB-CACHING command or assigned internally by DAB. If the DAB cache is located in GS (global storage), the
name of the partition is also output in brackets.
SIZE
Size of the DAB cache in KB, MB or GB.
READ (1/S)
Number of read operations per second in all subareas or files
served by the DAB cache.
U3585-J-Z125-8-76
SM2 reports
DAB report
RD HIT (%)
Percentage of read operations without disk access.
SM2 compares the number of read operations for which disk access
was not required (as the data to be read was already in the cache)
with the total number of read operations in all subareas or files
served by the DAB cache.
WRITE (1/S)
Number of write operations per second to all subareas or files
served by the DAB cache
WR HIT (%)
Percentage of write operations in which data was written to the
cache in relation to the total number of write operations to all
subareas or files served by the DAB cache
OVER (1/S)
Number of failed attempts to use the DAB cache per second due to
an overload
Note
While the SM2 DAB report contains the data of the last monitoring cycle, the BS2000
command /SHOW-DAB-CACHING supplies the READ, WRITE and HIT values since
the DAB buffer was set up. The values of the DAB report and those of the SHOW-DABCACHING command cannot therefore be compared directly.
U3585-J-Z125-8-76
239
DAB CACHE report
SM2 reports
DAB CACHE report
This report supplies information on the subareas or files served by a DAB cache.
Report output
The DAB CACHE report is output only at the explicit request of the SM2 user by means of
the SELECT-DAB-CACHE statement (see page 173). After this statement has been
entered, the user receives during the next monitoring cycle not only the DAB report, but also
the DAB CACHE report for the DAB caches he or she has selected.
The DAB CACHE report provides detailed information on the subareas or files served by
DAB. It can only be output if the SM2 administrator has activated the monitoring process
using the statement START-MEASUREMENT-PROGRAM TYPE=*DAB statement.
Overflow screens may be requested for this report.
The monitored data output is sorted under the categories READ and WRITE.
It is possible to output information on up to 16 DAB caches.
D017ZE03 SM2 DAB CACHE
ID: BUFFER#001
CYCLE:
(DAB13V23)
60 S
MOD: R
99-03-24
MED:GS SIZE(FIX):
11:11:02
12.0 MB
|
VSN / FILE
|FIRST-HP,LAST-HP |S| READ |RD-HIT| WRITE |WR-HIT|OVER |
|
|
| | (1/S) | (%) | (1/S) | (%) |(1/S)|
+---------------------+-----------------+-+-------+------+-------+------+-----+
|*SUMMARY
|
11| | 117.2 | 99.4 | 113.7 | 0.0 | 0.0 |
+---------------------+-----------------+-+-------+------+-------+------+-----+
240
U3585-J-Z125-8-76
SM2 reports
DAB CACHE report
Monitoring information
ID
Name of the appropriate DAB cache as selected via the ADD-CACHEID operand of the SELECT-DAB-CACHE statement. If the DAB cache
is located in GS (global storage), the name of the partition is also
output in brackets.
MOD
R:
The cache is used as a read cache.
W:
The cache is used as a write cache.
W/R:
The cache is used as a read/write cache.
PFA:
The cache is used as a PFA cache.
In the case of the R/W, W and PFA modes, the Force Out parameter is also specified. This
indicates whether and at what fill level data written to the cache should be written back to
the external data volumes.
MED
SIZE(FIX)
SIZE(VAR)
U3585-J-Z125-8-76
N
Data is not written back (No)
L
Low fill level
H
High fill level
Cache medium
MM:
Main memory
ES:
Expanded storage
GS:
Global storage
Size of the DAB cache. This can be fixed (FIX) or variable (VAR).
In the case of (VAR), the size at the time of data acquisition is output.
241
DAB CACHE report
SM2 reports
DD017ZE03 SM2 DAB CACHE
ID: BUFFER#001
CYCLE:
(DAB13V23)
60 S
MOD: R
99-03-24
MED:GS SIZE(FIX):
11:11:02
12.0 MB
|
VSN / FILE
|FIRST-HP,LAST-HP |S| READ |RD-HIT| WRITE |WR-HIT|OVER |
|
|
| | (1/S) | (%) | (1/S) | (%) |(1/S)|
+---------------------+-----------------+-+-------+------+-------+------+-----+
|*SUMMARY
|
11| | 117.2 | 99.4 | 113.7 | 0.0 | 0.0 |
+---------------------+-----------------+-+-------+------+-------+------+-----+
Monitoring information
Each line in this report contains data on the different subareas or files served by the cache
with the specified CACHE-ID.
The individual columns contain the following data:
VSN / FILE
VSN of the volume containing the subarea or, if DAB supports a file,
the name of the file containing the subarea. If there is more than one
subarea on the same volume or in the same file, these subareas are
listed in successive lines. The relevant VSN or file name can be
found only in the first line of this list. If the file name is longer than
21 characters, it is truncated on the right.
FIRST-HP,LAST-HP
First and last physical block numbers of the subarea, if a volume is
listed in column 1.
First and last logical block numbers of the subarea, if a file name is
listed in column 1.
S
Any subarea which was not served during the last monitoring cycle
is marked with an asterisk (*) in this column (S = served). No data
is output for this subarea.
The columns READ, RD-HIT, WRITE, WR-HIT and OVER have the same meaning as in the
DAB report. However, the information they contain refers to individual subareas or files and
not to the DAB cache as a whole.
242
U3585-J-Z125-8-76
SM2 reports
DAB CACHE report
Note
In order to limit the data recorded, the following modification has been introduced in
DAB V6.0A for the DAB-CACHE report:
If the cache is created with AREA=*BY-SYSTEM(ADM-PFA) or with CACHEDFILES=*BY-SYSTEM(USER-PFA), the output does not include a list of the files served.
Instead, it contains a summary of the entire cache. The (VSN/FILE=*SUMMARY) row
of the DAB CACHE report thus contains the same data as the DAB report. As a result,
the information in the FIRST-HP, LAST-HP column is irrelevant.
Monitored data on the files served by the cache can be output using the DAB statement
SHOW-DAB-CACHING CACHE-ID=*ALL, INF=*SYSTEM-CACHED-FILES
(CACHING=*ACTIVE).
U3585-J-Z125-8-76
243
DEVICE report
SM2 reports
DEVICE report
This report contains data on the I/O operations performed with peripheral devices during
one monitoring cycle.
It counts the number of EXCP calls per second (see glossary, page 448).
The user can specify up to eight devices in the DEVICE statement for which the data is to
be output separately. If more than 8 devices were active in the monitoring cycle, the
mnemonic device names of other devices are displayed in the ACTIVE line. The number of
further devices depends on the length of the mnemonic names of the devices which have
been output.
Report output
The REPORT DEVICE statement is used to request the output of the DEVICE report. The
devices defined using the DEVICE statement are output first, followed by all other devices.
These are sorted in accordance with their load.
The activities of the communication controllers (CTCCs, TRANSDATA 960s, 8170
controllers, LAN adapters, HNCs) and of GS are not monitored.
Notes
244
–
Following successful reconfiguration in the multiprocessor systems, all I/O counts for
the last monitoring cycle are represented by ***** as they may be incorrect.
–
SM2 is not notified of device management commands (see the “Commands” manual
[15]). In the monitoring cycle in which such commands are entered, incorrect data may
be produced for the affected devices.
U3585-J-Z125-8-76
SM2 reports
DEVICE report
D016ZE04 SM2 DEVICE
CYCLE:
120 S
SAMPLES:
293
99-03-24
14:30:00
----------+--------+--------+--------+--------+--------+----------------------| TOTAL |
DISK |
PAGE |
TAPE | PRINT | OTHER
IO(/S) | 402.7 | 210.5 |
0.0 |
0.2 |
0.0 | 192.0
----------+--------+--------+--------+--------+--------+-------------------------------------------+-----------------+--------------------------------------DEVICE
|
ACTIVITY
|
UTILIZATION
MN
| TYPE | VOLUME | IO(/S) | Q-LGTH | IO% | PG% 0
20
40
60
80 100%
-----+------+--------+--------+--------+-----+-----I----I----I----I----I----I
431C | DISK | 2OSC.1 | 50.5 |
0.3 | 25 |
|-----4354 | DISK | 2OSC.4 | 23.7 |
0.3 | 17 |
|---4350 | DISK | 2OSL.0 | 26.7 |
0.1 | 16 |
|---4310 | DISK | 2OSL.0 | 26.4 |
0.1 | 14 |
|---4361 | DISK | 2OSG.0 |
9.6 |
3.6 |
8 |
|-4342 | DISK | WORK01 |
9.4 |
0.0 |
8 |
|-4343 | DISK | QVS2.0 |
2.3 |
0.0 |
5 |
|4338 | DISK | 2OWI.1 |
1.3 |
0.0 |
5 |
|-----+------+--------+--------+--------+-----+-----I----I----I----I----I----I
ACTIVE: EV 435C 436B 4303 4335 4356 4313 434C 4378 4304 431A 4344 4312
Monitoring information
IO(/S)
Number of I/O operations (EXCP calls) per second (for information
on paging operations, counting I/O operations and their duration,
refer to page 445 of the glossary)
TOTAL
Total number of input/output operations per second, i.e. the sum of
all following columns
DISK
Number of disk I/O operations of the Data Management System
(without paging I/Os)
PAGE
Number of I/O operations with paging devices in response to paging
requests; all types of paging operations are counted.
TAPE
Number of tape I/O operations
PRINT
Number of output operations on all printers
OTHER
Number of I/O operations of all other active devices
U3585-J-Z125-8-76
245
DEVICE report
SM2 reports
D016ZE04 SM2 DEVICE
CYCLE:
120 S
SAMPLES:
293
99-03-24
14:30:00
----------+--------+--------+--------+--------+--------+----------------------| TOTAL |
DISK |
PAGE |
TAPE | PRINT | OTHER
IO(/S) | 402.7 | 210.5 |
0.0 |
0.2 |
0.0 | 192.0
----------+--------+--------+--------+--------+--------+-------------------------------------------+-----------------+--------------------------------------DEVICE
|
ACTIVITY
|
UTILIZATION
MN
| TYPE | VOLUME | IO(/S) | Q-LGTH | IO% | PG% 0
20
40
60
80 100%
-----+------+--------+--------+--------+-----+-----I----I----I----I----I----I
431C | DISK | 2OSC.1 | 50.5 |
0.3 | 25 |
|-----4354 | DISK | 2OSC.4 | 23.7 |
0.3 | 17 |
|---4350 | DISK | 2OSL.0 | 26.7 |
0.1 | 16 |
|---4310 | DISK | 2OSL.0 | 26.4 |
0.1 | 14 |
|---4361 | DISK | 2OSG.0 |
9.6 |
3.6 |
8 |
|-4342 | DISK | WORK01 |
9.4 |
0.0 |
8 |
|-4343 | DISK | QVS2.0 |
2.3 |
0.0 |
5 |
|4338 | DISK | 2OWI.1 |
1.3 |
0.0 |
5 |
|-----+------+--------+--------+--------+-----+-----I----I----I----I----I----I
ACTIVE: EV 435C 436B 4303 4335 4356 4313 434C 4378 4304 431A 4344 4312
Monitoring information
DEVICE
MN
Mnemonic device names of the eight most active devices or of the
devices specified in the DEVICE statement
TYPE
Device type code
VOLUME
Designation of the volumes installed for the entire duration of the
last monitoring cycle. If no volume has been specified, either the
volume was changed during the last monitoring cycle, or access to
the volume table was not possible at the time the query was made,
due to internal system-related reasons.
ACTIVITY
246
IO(/S)
Number of input/output operations per second for the corresponding
device
Q-LGTH
Average length of the device queue, including jobs currently being
serviced
U3585-J-Z125-8-76
SM2 reports
DEVICE report
D016ZE04 SM2 DEVICE
CYCLE:
120 S
SAMPLES:
293
99-03-24
14:30:00
----------+--------+--------+--------+--------+--------+----------------------| TOTAL |
DISK |
PAGE |
TAPE | PRINT | OTHER
IO(/S) | 402.7 | 210.5 |
0.0 |
0.2 |
0.0 | 192.0
----------+--------+--------+--------+--------+--------+-------------------------------------------+-----------------+--------------------------------------DEVICE
|
ACTIVITY
|
UTILIZATION
MN
| TYPE | VOLUME | IO(/S) | Q-LGTH | IO% | PG% 0
20
40
60
80 100%
-----+------+--------+--------+--------+-----+-----I----I----I----I----I----I
431C | DISK | 2OSC.1 | 50.5 |
0.3 | 25 |
|-----4354 | DISK | 2OSC.4 | 23.7 |
0.3 | 17 |
|---4350 | DISK | 2OSL.0 | 26.7 |
0.1 | 16 |
|---4310 | DISK | 2OSL.0 | 26.4 |
0.1 | 14 |
|---4361 | DISK | 2OSG.0 |
9.6 |
3.6 |
8 |
|-4342 | DISK | WORK01 |
9.4 |
0.0 |
8 |
|-4343 | DISK | QVS2.0 |
2.3 |
0.0 |
5 |
|4338 | DISK | 2OWI.1 |
1.3 |
0.0 |
5 |
|-----+------+--------+--------+--------+-----+-----I----I----I----I----I----I
ACTIVE: EV 435C 436B 4303 4335 4356 4313 434C 4378 4304 431A 4344 4312
Monitoring information
UTILIZATION
IO% PG%
Percentage of time during which the device was active during the
monitoring cycle due to DMS input/output operations (IO) or paging
input/output operations (PG)
One dash represents 4%.
The time data of the most active devices or of the devices specified in the DEVICE
statement is given (for the mnemonic devices names, see “DEVICE Select devices with
monitored data” on page 160).
In the case of disk devices, the character "P" represents the share of monitoring cycle time
of the paging I/O operations.
ACTIVE
U3585-J-Z125-8-76
Mnemonic device names of further active devices, including active
devices whose individual output priority has been withdrawn. The
devices are sorted according to their activity in the monitoring cycle.
The maximum number of devices which can be output depends on
the length (MN value of 2 or 4 bytes).
247
DISK FILE report
SM2 reports
DISK FILE report
This report contains information on the input/output operations on all files of selected disk
devices.
Report output
The REPORT DISK_FILE statement is used to request the output of the DISK FILE report.
The report can only be output if the SM2 administrator has
– defines the disk devices to be monitored using the SET-DISK-FILE-PARAMETER
statement
– started the monitoring process using the statement START-MEASUREMENTPROGRAM TYPE=*DISK-FILE
The statistics for each disk devices are output in a separate screen. Overflow screens may
also be requested for this report. The monitored data output is sorted under the categories
READ and WRITE.
.
D016ZE04 SM2 DISK FILE
CYCLE:
120 S
99-03-24
14:30:00
READ | WRITE | FILENAME
(MN: 4310, VSN: 2OSL.0)
---------+---------+------------------------------------------------------0.0 |
0.0 | *OVERRUNS
28.4 |
2.5 | :2OSL:$TSOS.TSOSCAT
14.1 |
0.0 | :2OSL:$TSOS.SINLIB.POSIX-BC.040.SHELL
3.8 |
0.0 | :2OSL:$TSOS.SYS.AIDIT0
1.3 |
0.0 | :2OSL:$TSOS.SYS.SDF.LOGON.SYSPROC
0.0 |
0.8 | :2OSL:$TSOS.SYSSRPM
0.5 |
0.0 | :2OSL:$TSOS.PLAMLIB
0.3 |
0.1 | :2OSL:$SYSSPOOL.PRFILE
0.3 |
0.0 | :2OSL:$TSOS.SYSLNK.SM2.130.SM2
0.3 |
0.0 | :2OSL:$TSOS.SYSLNK.CRTE
0.2 |
0.0 | :2OSL:$TSOS.SYSPRG.BCAM.150
0.2 |
0.0 | :2OSL:$TSOS.SYSLNK.EDT.166
0.1 |
0.0 | :2OSL:$TSOS.SYSSDF.LMS.032.112
0.1 |
0.0 | :2OSL:$TSOS.LMS
0.0 |
0.0 | :2OSL:$TSOS.SYSSDF.COBOL85-R.023
0.0 |
0.0 | :2OSL:$TSOS.SYSMES.EDT.166
0.0 |
0.0 | :2OSL:$TSOS.EDT
0.0 |
0.0 | :2OSL:$TSOS.EDOR
248
U3585-J-Z125-8-76
SM2 reports
DISK FILE report
Monitoring information
READ
Number of read operations per second
WRITE
Number of write operations per second
FILENAME
Name of the monitored file.
The first row always contains the value *OVERRUNS. This entry
includes all input/output operations that could not be assigned to a
file entry because the internal SM2 table was full during the
monitoring cycle. It is generally set to zero or to a low value.
In the FILENAME column, not all names are in the format:
<catid>:<$userid>.<filename>. In the case of special disk accesses
(e.g. by DAB), this format is not applied.
MN
Mnemonic device name of the monitored disk device
VSN
VSN of the monitored disk device
U3585-J-Z125-8-76
249
DLM report
SM2 reports
DLM report
This report contains monitored data from the DLM (Distributed Lock Manager).
Report output
The REPORT DLM statement is used to request the output of the DLM report.
The report can only be output if the SM2 administrator has activated the monitoring process
using the statement START-MEASUREMENT-PROGRAM TYPE=*DLM.
D016ZE04 SM2 DLM
CYCLE:
120 S
99-03-24
14:30:00
+------------------------------+--------------+--------------+--------------+
|
|
TU
|
TPR
|
NSM
|
+------------------------------+--------------+--------------+--------------+
| NUMBER ENQUEUE
(1/S) |
0.0
|
1.5
|
1.4
|
| NUMBER CONVERT
(1/S) |
0.0
|
40.6
|
40.6
|
| NUMBER DEQUEUE
(1/S) |
0.0
|
1.5
|
1.4
|
| NUMBER INFORMATION
(1/S) |
0.0
|
0.2
|
0.0
|
| NUMBER GRANT EVENTS
(1/S) |
0.0
|
0.0
|
1.4
|
| NUMBER RELEASE EVENTS (1/S) |
0.0
|
0.0
|
0.0
|
+------------------------------+--------------+--------------+--------------+
Monitoring information
The individual entries have the following meanings:
NUMBER ENQUEUE (1/S)
Number of enqueue lock requests per second
from TU, TPR or NSM
NUMBER CONVERT (1/S)
Number of convert lock requests per second
from TU, TPR or NSM
NUMBER DEQUEUE (1/S)
Number of dequeue lock requests per second
from TU, TPR or NSM
250
U3585-J-Z125-8-76
SM2 reports
DLM report
NUMBER INFORMATION (1/S)
Number of information lock requests per second
from TU or TPR. The "NSM" column always contains the value 0.
NUMBER GRANT EVENTS (1/S)
Number of grant events (information about lock allocations)
per second
via TU contingency,
via bourse (or user eventing),
from NSM (information about lock allocations on the local host).
NUMBER RELEASE EVENTS (1/S)
Number of release events (requests for lock releases)
per second
via TU contingency,
via bourse (or user eventing),
from NSM (requests for lock release from remote hosts).
U3585-J-Z125-8-76
251
FILE reports
SM2 reports
FILE reports
The FILE reports contain monitored data on access to a file.
Report output
The REPORT FILE statement is used to request the output of the FILE reports.
The FILE report consists of the following sections:
– the USER FILE report for files included in the monitoring process by specific users
– the PRIVILEGED FILE report for privileged users
The USER FILE report can only be output if the SM2 administrator has
– permitted file monitoring using the statement MODIFY-USER-ADMISSION
FILE=*ALLOW
– included files in the monitoring process using the FILE statement
The PRIVILEGED FILE report can only be output if the SM2 administrator has
– defined files using the ADD-FILE statement
– permitted file monitoring using the statement START-MEASUREMENT-PROGRAM
TYPE=*FILE
Outputting monitored data in the FILE reports
In the USER FILE report, the nonprivileged user obtains precisely those values for the files
he or she included in the monitoring process within the nonprivileged file statistics.
In the PRIVILIGED FILE report, the privileged user is shown the values for all the files
included in the monitoring process by an SM2 administrator for the monitoring program.
These values are also written to the SM2 output file.
The layout of the FILE reports for nonprivileged and privileged users is identical, except for
the headers (the former are entitled SM2 USER FILE REPORT, the latter are entitled SM2
PRIVILEGED FILE REPORT).
252
U3585-J-Z125-8-76
SM2 reports
FILE reports
D016ZE04 SM2 PRIVILEGED FILE
CYCLE:
120 S
99-03-24
14:30:00
-----+-----+-----+-----+-----+------------------------------------------------WAIT |CHECK|READ |WRITE|TIME |
FILENAME
-----+-----+-----+-----+-----+------------------------------------------------0.0| 0.0| 0.0| 0.0|
*|:2OSX:$TSOS.TSOSCAT
0.0| 0.0| 0.0| 0.0|
*|:2OSW:$TSOS.TSOSCAT
0.0| 0.0| 0.0| 0.0|
*|:2OS2:$TSOS.TSOSCAT
0.0| 0.0| 0.0| 0.0|
*|:2SO6:$TSOS.TSOSCAT
0.0| 0.0| 0.0| 0.0|
*|:2OS7:$TSOS.TSOSCAT
0.0| 0.0| 0.0| 0.0| 16.3|:2ORZ:$TSOS.TSOSCAT
0.5| 0.0| 0.5| 0.0| 2.4|:2OSQ:$TSOS.TSOSCAT
0.0| 0.0| 0.0| 0.0| 21.2|:2OSL:$TSOS.EQUISAMQ
0.0| 0.0| 0.0| 0.0|
*|:2OS6:$TSOS.SYSEAM
0.0| 0.0| 0.0| 0.0|
*|:2OSX:$TSOS.SYSEAM
0.0| 0.0| 0.0| 0.0|
*|:2OS2:$TSOS.SYSEAM
0.0| 0.0| 0.0| 0.0|
*|:2OS7:$TSOS.SYSEAM
0.0| 0.0| 0.0| 0.0| 13.6|:2OS6:$NEI.SM2.SAM.MANUAL.V13.0
-----+-----+-----+-----+-----+-------------------------------------------------
Monitoring information
WAIT
The number of WAIT operations per second is incremented if:
– reading from the file to main memory was initiated and the task
is waiting for the end of the read operation, or
– writing from main memory to the file was initiated and the task
is waiting for the end of the write operation.
WAIT operations not combined with read or write operations are
ignored.
CHECK
The number of CHECK operations per second is incremented
whenever a check is made to see whether the preceding write
operation was performed properly (read-after-write check). Only
those read-after-write checks are counted which were initiated
together with a write operation.
READ
Number of READ operations per second
WRITE
Number of WRITE operations per second
U3585-J-Z125-8-76
253
FILE reports
TIME
SM2 reports
Average duration of an input/output operation in milliseconds; *
means that no input/output operation has taken place.
Note
The value shown here represents the logical duration of the input/
output operation from initiation to completion of the job from the
point of view of the software. In the case of asynchronous input/
output operations, this may be considerably greater than the
hardware time.
The < sign indicates that the value cannot be fully accommodated
in the field.
FILENAME
Name of the monitored file
In the case of composite PAM operations such as Read and Wait for Termination, both
values are incremented (READ and WAIT).
254
U3585-J-Z125-8-76
SM2 reports
GLOBAL report
GLOBAL report
The GLOBAL report contains data on a host network. It provides the user with an overview
of the most important system activities (CPU utilization, I/O rates, size of pageable memory)
for each host.
Report output
The REPORT GLOBAL statement is used to request the output of the GLOBAL report.
Overflow screens may also be requested for this report.
The SM2 administrator can use the SELECT-HOSTS statement to select the hosts to be
displayed in the GLOBAL report. If these include the local host, this is output in the first line,
followed by the remaining hosts in the order specified in the SELECT-HOSTS statement.
The header contains information on the first host for which valid data is found. If valid
information cannot be found on a particular host, the string “**” appears in place of the
monitored data.
For further information, please refer to the description of the SELECT-HOSTS statement on
page 110.
D016ZE04 SM2 GLOBAL
CYCLE:
120 S
99-03-24
14:30:00
|
|
CPU UTILIZATION (%)
| MEMORY |
IO'S
(1/S)
---------+----+-------+-------+-------+-------+--------+-------+-------+------HOST
| LM |
TU | TPR | SIH | IDLE | NPP
| TOTAL | DISK | PAGE
---------+----+-------+-------+-------+-------+--------+-------+-------+------D016ZE04 | 2 | 22.6 | 22.5 | 10.4 | 44.3 | 480617 | 402.7 | 210.5 |
0.0
D016ZE02 | 5 |
0.6 |
0.6 |
1.8 | 96.8 | 182773 | 79.5 | 53.2 |
0.0
D016ZE07 | 3 | 33.3 | 26.4 | 12.4 | 27.7 | 122570 | 555.5 | 321.5 |
4.3
Monitoring information
The monitored data displayed here is the same as that of the ACTIVITY report.
U3585-J-Z125-8-76
255
GS report
SM2 reports
GS report
This report supplies partition-specific monitored data on the utilization of global storage.
Report output
The REPORT GS statement is used to request the output of the GS report.
The report can only be output if the SM2 administrator has activated the monitoring process
using the statement START-MEASUREMENT-PROGRAM TYPE=*GS.
Overflow screens may also be requested for this report.
The monitored data output is sorted in accordance with the total number of READ and
WRITE operations.
D017ZE03 SM2 GS
CYCLE:
60 S
99-03-24
11:11:02
| PARTITION | UNIT |
READ
|
WRITE
|
|
|
|
(1/S)
|
(KB/S)
|
(1/S)
|
(KB/S)
|
+-----------+--------+------------+------------+------------+------------+
| DAB13V23 |
1
|
146.0
|
239.8
|
163.3
|
300.3
|
| GSV0300
|
1
|
0.0
|
0.0
|
0.0
|
0.0
|
| GSV0301
|
1
|
0.0
|
0.0
|
0.0
|
0.0
|
| GSV0302
|
1
|
0.0
|
0.0
|
0.0
|
0.0
|
Monitoring information
256
PARTITION
Name of the partition in global storage
UNIT
Unit on which the partition lies.
A dual partition consists of a contiguous address space on both GS
units, whose start addresses are differentiated by the HW constant
“DUPLICATION-BOUNDARY”.
READ
Number of read operations per second and
number of KB transferred per second
WRITE
Number of write operations per second and
number of KB transferred per second
U3585-J-Z125-8-76
SM2 reports
GSVOL report
GSVOL report
This report provides monitored data on emulated volumes in global storage.
Report output
The REPORT GSVOL statement is used to request the output of the GSVOL reports. This
report can only be output if the SM2 administrator has activated the monitoring process
using the statement START-MEASUREMENT-PROGRAM TYPE=*GSVOL.
Overflow screens may also be requested for this report.
The monitored data output is sorted under the categories READ and WRITE.
D017ZE03 SM2 GSVOL
CYCLE:
60 S
99-03-20
11:11:02
| DEVICE-MN
|
UNIT
|
READ (1/S) | WRITE (1/S) |
+----------------+-------------+---------------+---------------+
|
0381
|
1
|
822.2
|
355.2
|
|
0380
|
1
|
765.2
|
336.4
|
|
0382
|
1
|
787.3
|
290.3
|
|
0383
|
1
|
0.2
|
0.1
|
Monitoring information
DEVICE-MN
Mnemonic device name of the emulated volume
UNIT
GS unit on which the volume was created
A dual partition consists of a contiguous address space on both GS
units, whose start addresses are differentiated by the HW constant
“DUPLICATION-BOUNDARY”.
READ (1/S)
Number of read I/O operations
WRITE (1/S)
Number of write I/O operations
When comparing with the values of the GS report, note that in the GSVOL report the I/O
operations refer to the emulated volumes. One I/O operation can hide several GS accesses
(additional key, block length).
U3585-J-Z125-8-76
257
ISAM reports
SM2 reports
ISAM reports
These reports provide performance data on ISAM buffer management.
Report output
The REPORT ISAM statement is used to request the output of the ISAM report.
The ISAM report consists of the following sections:
– the USER ISAM report for ISAM pools included in the monitoring process by specific
users
– the PRIVILEGED ISAM report for privileged users
The USER ISAM report can only be output if the SM2 administrator has
– permitted ISAM pool monitoring using the MODIFY-USER-ADMISSION
ISAM=*ALLOW statement
– included ISAM pools in the monitoring process using the START-/CHANGE-ISAMSTATISTICS statement
The PRIVILEGED ISAM report can only be output if the SM2 administrator has
– defined ISAM pools using the ADD-ISAM-POOL statement
– permitted ISAM pool monitoring using the START-MEASUREMENT-PROGRAM
TYPE=*ISAM statement
Outputting monitored data in the ISAM reports
In the USER ISAM report, the nonprivileged user obtains exactly those values for the ISAM
pools he/she has included in the monitoring process, provided that ISAM pool monitoring is
permitted.
In the PRIVILEGED ISAM report, the privileged user is shown the values for all the ISAM
pools included in the monitoring process by an SM2 administrator for the ISAM monitoring
program. These values are also written to the SM2 output file.
The layout of the ISAM reports for nonprivileged users and for privileged users is identical,
except for the header (report entitled SM2 USER ISAM REPORT for nonprivileged users,
and SM2 PRIVILEGED ISAM REPORT for privileged users).
258
U3585-J-Z125-8-76
SM2 reports
ISAM reports
D016ZE04 SM2 PRIVILEGED ISAM
CYCLE:
120 S
99-03-24
14:30:00
--------+--+------+----------+--------+-------+--------+--------+-------+-----POOLNAME|SC|CAT-ID| UID/TSN | FIX-OP |FIX-HIT|FIX-WAIT|SLT-WAIT|FXD PGS| SIZE
--------+--+------+----------+--------+-------+--------+--------+-------+-----$SYS01 |HS| 2OSL |
|
0.3 | 92.1%|
0.0% |
0.0% |
1.2%|
82
SRPMPOOL|TA| 2OSL | RP01
|
0.0 | 99.9%|
0.0% |
0.0% |
0.7%|
138
SESFPOOL|HS| 2OSL |
|
0.0 | 99.4%|
0.0% |
0.0% |
0.3%|
524
SDFPOOLN|TA| 2OSL | 7IY4
|
|
|
|
|
|
--------+--+------+----------+--------+-------+--------+--------+-------+------
Monitoring information
POOLNAME
Name of the monitored ISAM pool
SC
Identifies the relevant ISAM pool as global (HOST-SYSTEM, HS),
task-specific (TASK, TA) or user-specific (USER-ID, UI)
CAT-ID
Catalog ID (PVS ID) of the public volume set specified for the
monitored ISAM pool
UID/TSN
Task sequence number (TSN) of the task under which a taskspecific ISAM pool was created or user ID (USER-ID) under which
a user-specific ISAM pool was created. This column remains empty
for global ISAM pools.
FIX-OP
Number of FIX operations per second (number of FIX hits + number
of FIX IOs)
FIX-HIT
Percentage of FIX operations where the desired buffer page is
already in the ISAM pool (i.e. no read operation from disk is
required) relative to the total number of all FIX operations
FIX-WAIT
Percentage of FIX operations requiring a waiting period until one or
more buffer pages are released relative to the total number of all FIX
operations
SLT-WAIT
Percentage of RESERVE-SLOT operations leading to a wait state
for the requested task due to a slot bottleneck relative to the total
number of all RESERVE-SLOT operations
U3585-J-Z125-8-76
259
ISAM reports
SM2 reports
FXD PGS
Mean percentage of fixed pages relative to the number of all ISAM
pool pages used for buffering in the last monitoring cycle
SIZE
Size of the ISAM pool in 4-KB pages (excluding some administration
data)
If an ISAM pool is never addressed during a monitoring cycle, the last five columns contain
blanks.
260
U3585-J-Z125-8-76
SM2 reports
MEMORY report
MEMORY report
This report provides an overview of main memory and virtual address space utilization.
Report output
The REPORT MEMORY statement is used to request the output of the MEMORY report.
D016ZE04 SM2 MEMORY (SYS)
CYCLE:
120 S
SAMPLES:
293
MAIN MEMORY FRAMES
+--------+---------+--------+--------+----------+----------+
| TOTAL |PAGEABLE |R-ONLY-Q|RD-WR-Q | SYS-GLOB | TASK-LOC |
+--------+---------+--------+--------+----------+----------+
| 499713 | 480617 | 37969 | 56452 |
386164 |
0 |
+--------+---------+--------+--------+----------+----------+
99-03-24
14:30:00
WORK. SET (PPC)
+-------+-------+
| ALL | ACT |
+-------+-------+
| 53579 | 8915 |
+-------+-------+
PAGING AREA FRAMES
+--------+--------+--------+
| TOTAL |
GS | USED |
+--------+--------+--------+
|1536363 |
0 | 692412 |
+--------+--------+--------+
# PAGES IN VIRTUAL MEMORY
+-----+-----+-----+-----+-----+
| CL1 | CL2 | CL3 | CL4 |CL4-S|
+-----+-----+-----+-----+-----+
| 721| 2076|14533|32301| 584|
+-----+-----+-----+-----+-----+
PAGE FAULTS
+--------+----------+---------+
| TOTAL | 1ST-READ |RECLAIMS |
+--------+----------+---------+
| 1168.9 | 1157.2 |
11.6 |
+--------+----------+---------+
PAGE TRANSFERS
+----------+----------+
|
READ
| WRITE
|
+----------+----------+
|
0.0 |
0.0 |
+----------+----------+
USED PAGES
+----------+
|
ACT
|
+----------+
|
62377 |
+----------+
PAGE TRANSFERS (GS)
+----------+----------+
|
READ
| WRITE
|
+----------+----------+
|
0.0 |
0.0 |
+----------+----------+
Monitoring information
The type of main memory management specified at system generation is displayed in the
first line of the MEMORY report and is enclosed in parentheses.
SM2 MEMORY REPORT (SYS)
For system-global management
SM2 MEMORY REPORT (SEL)
For selective management
SM2 MEMORY REPORT (***)
Type of main memory management (modified during the last cycle)
U3585-J-Z125-8-76
261
MEMORY report
SM2 reports
MAIN MEMORY FRAMES
TOTAL
Total number of 4-Kb pages in main memory
PAGEABLE
Number of pageable 4-Kb pages in main memory
R-ONLY-Q
Average number of 4-Kb read-only pages in the free pool (read-only
queue)
R-WR-Q
Average number of 4-Kb read/write pages in the free pool (read/
write queue)
SYS-GLOB
Average number of system-globally managed 4-Kb page frames
TASK-LOC
Average number of task-locally managed 4-Kb page frames
WORK. SET (PPC)
262
ALL
Sum of planned page counts (PPCs) of all tasks in the system
ACT
Sum of planned page counts of all active tasks in the system
(including the SM2 tasks)
(Task queues 0-4)
U3585-J-Z125-8-76
SM2 reports
MEMORY report
D016ZE04 SM2 MEMORY (SYS)
CYCLE:
120 S
SAMPLES:
293
MAIN MEMORY FRAMES
+--------+---------+--------+--------+----------+----------+
| TOTAL |PAGEABLE |R-ONLY-Q|RD-WR-Q | SYS-GLOB | TASK-LOC |
+--------+---------+--------+--------+----------+----------+
| 499713 | 480617 | 37969 | 56452 |
386164 |
0 |
+--------+---------+--------+--------+----------+----------+
99-03-24
14:30:00
WORK. SET (PPC)
+-------+-------+
| ALL | ACT |
+-------+-------+
| 53579 | 8915 |
+-------+-------+
PAGING AREA FRAMES
+--------+--------+--------+
| TOTAL |
GS | USED |
+--------+--------+--------+
|1536363 |
0 | 692412 |
+--------+--------+--------+
# PAGES IN VIRTUAL MEMORY
+-----+-----+-----+-----+-----+
| CL1 | CL2 | CL3 | CL4 |CL4-S|
+-----+-----+-----+-----+-----+
| 721| 2076|14533|32301| 584|
+-----+-----+-----+-----+-----+
PAGE FAULTS
+--------+----------+---------+
| TOTAL | 1ST-READ |RECLAIMS |
+--------+----------+---------+
| 1168.9 | 1157.2 |
11.6 |
+--------+----------+---------+
PAGE TRANSFERS
+----------+----------+
|
READ
| WRITE
|
+----------+----------+
|
0.0 |
0.0 |
+----------+----------+
USED PAGES
+----------+
|
ACT
|
+----------+
|
62377 |
+----------+
PAGE TRANSFERS (GS)
+----------+----------+
|
READ
| WRITE
|
+----------+----------+
|
0.0 |
0.0 |
+----------+----------+
Monitoring information
PAGING AREA FRAMES
TOTAL
Maximum number of pageable 4-Kb pages in all paging devices
GS
Number of 4-Kb pages used for paging in global storage (GS)
USED
Number of pageable 4-Kb pages used in all paging devices
Note
The TOTAL value includes the pages on disk as well as those in global storage, if any
is provided.
# PAGES IN VIRTUAL MEMORY
CL1
Number of class 1 pages (4 Kb) in the virtual address space
CL2
Number of class 2 pages (4 Kb) in the virtual address space
CL3
Number of class 3 pages (4 Kb) in the virtual address space
CL4
Number of all class 4 pages (4 Kb) in the virtual address space
CL4-S
Number of class 4 pages (4 Kb) for shareable modules in the virtual
address space; CL4-S is included in CL4
USED PAGES
ACT
U3585-J-Z125-8-76
Sum of used page counts (UPG) of all active tasks in the system
263
MEMORY report
SM2 reports
D016ZE04 SM2 MEMORY (SYS)
CYCLE:
120 S
SAMPLES:
293
MAIN MEMORY FRAMES
+--------+---------+--------+--------+----------+----------+
| TOTAL |PAGEABLE |R-ONLY-Q|RD-WR-Q | SYS-GLOB | TASK-LOC |
+--------+---------+--------+--------+----------+----------+
| 499713 | 480617 | 37969 | 56452 |
386164 |
0 |
+--------+---------+--------+--------+----------+----------+
99-03-24
14:30:00
WORK. SET (PPC)
+-------+-------+
| ALL | ACT |
+-------+-------+
| 53579 | 8915 |
+-------+-------+
PAGING AREA FRAMES
+--------+--------+--------+
| TOTAL |
GS | USED |
+--------+--------+--------+
|1536363 |
0 | 692412 |
+--------+--------+--------+
# PAGES IN VIRTUAL MEMORY
+-----+-----+-----+-----+-----+
| CL1 | CL2 | CL3 | CL4 |CL4-S|
+-----+-----+-----+-----+-----+
| 721| 2076|14533|32301| 584|
+-----+-----+-----+-----+-----+
PAGE FAULTS
+--------+----------+---------+
| TOTAL | 1ST-READ |RECLAIMS |
+--------+----------+---------+
| 1168.9 | 1157.2 |
11.6 |
+--------+----------+---------+
PAGE TRANSFERS
+----------+----------+
|
READ
| WRITE
|
+----------+----------+
|
0.0 |
0.0 |
+----------+----------+
USED PAGES
+----------+
|
ACT
|
+----------+
|
62377 |
+----------+
PAGE TRANSFERS (GS)
+----------+----------+
|
READ
| WRITE
|
+----------+----------+
|
0.0 |
0.0 |
+----------+----------+
Monitoring information
PAGE FAULTS
TOTAL
Number of page fault interrupts per second (without "genuine"
paging errors)
1ST-READ
Number of page fault interrupts per second caused by the first
access to a 4-Kb page
RECLAIMS
Number of page fault interrupts per second for which the addressed
4-Kb page is still in main memory
Note
The TOTAL value also contains the number of page fault interrupts leading to transfer
from/to global storage, if any.
264
U3585-J-Z125-8-76
SM2 reports
MEMORY report
PAGE TRANSFERS
READ
Number of 4-Kb pages read per second
WRITE
Number of 4-Kb pages written per second
Note
The sum of read and written pages does not match the IO’S PER SEC PAGE value of
the ACTIVITY report. Memory management tries to group up to eight 4-Kb page-out
pages (WRITE) for one input/output operation (SDV or START-SUCHANNEL). Each
READ causes one 4-Kb page to be transferred, i.e. causes one input/output operation
(SDV or START-SUBCHANNEL) (see also section “page fault” on page 451 of the
glossary).
The READ and WRITE values do not include transfers from/to global storage, if any.
PAGE TRANSFERS (GS)
READ
Number of 4-Kb pages read per second from global storage (GS)
WRITE
Number of 4-Kb pages written per second to global storage (GS)
U3585-J-Z125-8-76
265
MSCF report
SM2 reports
MSCF report
This report contains monitored data from the MSCF subsystem.
Report output
The REPORT MSCF statement is used to request the output of the MSCF reports. The
report can only be output if the SM2 administrator has activated the monitoring process
using the statement START-MEASUREMENT-PROGRAM TYPE=*MSCF.
D016ZE04 SM2 MSCF
CYCLE:
+-----------+-----------+
| CALLS
|
39.8 /S |
+-----------+-----------+
| SHORTAGES |
0.2 /S |
+-----------+-----------+
| HOSTS
|
6
|
+-----------+-----------+
120 S
99-03-24
# SERVER TASKS
+----------+------+
| ORIGINAL |
4 |
+----------+------+
| ACTUAL
|
5 |
+----------+------+
| OCCUPIED |
0 |
+----------+------+
REQUEST WITH REPLY
+------------+---------------+
| AVG TIME
|
17
MS |
+------------+---------------+
| AVG WAIT
|
16
MS |
+------------+---------------+
| # REQUESTS |
2.6 /S |
+------------+---------------+
14:30:00
TASK LIMITS
+--------------+------+
| MAXIMAL
|
20 |
+--------------+------+
| FLOW SET
|
15 |
+--------------+------+
| FLOW RESET
|
10 |
+--------------+------+
FLOW STATE
+--------------+---------------+
| AVG TIME
| ********
MS |
+--------------+---------------+
| # FLOWS
|
0.0 /S |
+--------------+---------------+
| ACTUAL STATE |
NO FLOW
|
+--------------+---------------+
Monitoring information
The entries have the following meanings:
266
CALLS
Number of send jobs per second
SHORTAGES
Number of send jobs rejected per second due to line overload
HOSTS
Number of hosts entered in MSCF with which the local host
maintains a connection (excluding the local host)
U3585-J-Z125-8-76
SM2 reports
MSCF report
# SERVER TASKS
ORIGINAL
Number of server tasks originally requested
ACTUAL
Number of current server tasks
OCCUPIED
Number of current server tasks which could cause a bottleneck
These values merely indicate the status at the end of the monitoring cycle and do not
represent the mean value over the entire monitoring cycle.
TASK LIMITS
MAXIMUM
Maximum number of server tasks
FLOW SET
Limit value for the number of occupied server tasks as of which the
FLOW state is set
FLOW RESET
Limit value for the number of occupied server tasks as of which the
FLOW state is reset
The MSCF subsystem sets its own FLOW or NO FLOW state, depending on the number
of occupied server tasks. If the FLOW state is set, the maximum number of server tasks
can be exceeded.
For further information on server tasks and their limit values, see the “HIPLEX MSCF”
manual [4].
U3585-J-Z125-8-76
267
MSCF report
SM2 reports
D016ZE04 SM2 MSCF
CYCLE:
+-----------+-----------+
| CALLS
|
39.8 /S |
+-----------+-----------+
| SHORTAGES |
0.2 /S |
+-----------+-----------+
| HOSTS
|
6
|
+-----------+-----------+
120 S
99-03-24
# SERVER TASKS
+----------+------+
| ORIGINAL |
4 |
+----------+------+
| ACTUAL
|
5 |
+----------+------+
| OCCUPIED |
0 |
+----------+------+
REQUEST WITH REPLY
+------------+---------------+
| AVG TIME
|
17
MS |
+------------+---------------+
| AVG WAIT
|
16
MS |
+------------+---------------+
| # REQUESTS |
2.6 /S |
+------------+---------------+
14:30:00
TASK LIMITS
+--------------+------+
| MAXIMAL
|
20 |
+--------------+------+
| FLOW SET
|
15 |
+--------------+------+
| FLOW RESET
|
10 |
+--------------+------+
FLOW STATE
+--------------+---------------+
| AVG TIME
| ********
MS |
+--------------+---------------+
| # FLOWS
|
0.0 /S |
+--------------+---------------+
| ACTUAL STATE |
NO FLOW
|
+--------------+---------------+
Monitoring information
REQUEST WITH REPLY
AVG TIME
Average total time of REQUEST WITH REPLY jobs from the
beginning of the job to the first reply, in milliseconds
AVG WAIT
Average wait time with REQUEST WITH REPLY jobs for the first
reply from the receiving host, in milliseconds
# REQUESTS
Number of REQUEST WITH REPLY jobs per second
FLOW STATE
AVG TIME
Average dwell time in the FLOW state; only the transitions from
FLOW to NO FLOW are recorded
# FLOWS
Number of changes from the FLOW state to the NO FLOW state per
second
ACTUAL STATE
Current state: FLOW or NO FLOW
For the average times, “********” is output if no events have occurred.
268
U3585-J-Z125-8-76
SM2 reports
NET DEVICE report
NET DEVICE report
This report provides data on I/O operations of the network devices.
The data is recorded for each port, i.e. according to the respective mnemonic device
names.
Report output
The REPORT NET_DEVICE statement is used to request the output of the NET DEVICE
report. The report can only be output if the SM2 administrator has activated the monitoring
process using the statement START-MEASUREMENT-PROGRAM TYPE=*NET-DEVICE.
Overflow screens may also be requested for this report.
The monitored data output is sorted under the categories READ and WRITE.
D016ZE04 SM2 NET DEVICE
CYCLE:
120 S
99-03-24
14:30:00
| MN | DEVICE TYPE | READ (1/S) | WRITE (1/S) | # BYTES (1/IO) |
+------+-------------+-------------+-------------+-----------------+
| P5
|
ZAS-LAN
|
64.7
|
0.0
|
398
|
| P4
|
ZAS-LAN
|
0.0
|
54.8
|
456
|
| U4
|
ZAS-LAN
|
0.0
|
35.5
|
219
|
| U5
|
ZAS-LAN
|
35.2
|
0.0
|
69
|
| UH
|
ZAS-LAN
|
0.6
|
0.0
|
164
|
| Y3
|
ZAS-BCAM |
0.0
|
0.4
|
414
|
| Y4
|
ZAS-BCAM |
0.3
|
0.0
|
29
|
| CH
|
SKP2
|
0.2
|
0.0
|
0
|
| RP
|
ZAS-LAN
|
0.1
|
0.0
|
107
|
| CI
|
SKP2
|
0.1
|
0.0
|
0
|
| Y6
|
ZAS-BCAM |
0.0
|
0.0
|
2
|
| Y7
|
ZAS-BCAM |
0.0
|
0.0
|
2
|
| UG
|
ZAS-LAN
|
0.0
|
0.0
|
22
|
| RO
|
ZAS-LAN
|
0.0
|
0.0
|
20
|
| Y5
|
ZAS-DUMP |
0.0
|
0.0
|
0
|
| Y8
|
ZAS-DUMP |
0.0
|
0.0
|
0
|
| YL
|
ZAS-BCAM |
0.0
|
0.0
|
0
|
| YM
|
ZAS-BCAM |
0.0
|
0.0
|
0
|
Monitoring information
The columns contain the following data:
MN
Mnemonic name of the port of the network device
DEVICE TYPE
Alias of the device type
READ (1/S)
Number of read operations in the last monitoring cycle
WRITE (1/S)
Number of write operations in the last monitoring cycle
#BYTES (1/IO)
Number of transferred bytes per I/O operation
U3585-J-Z125-8-76
269
NSM report
SM2 reports
NSM report
This report provides data from the NSM (Node Serialization Manager) subsystem for a
computer network.
Report output
The REPORT NSM statement is used to request the output of the NSM report.
The report can only be output if the SM2 administrator has activated the monitoring process
using the statement START-MEASUREMENT-PROGRAM TYPE=*NSM.
Overflow screens may also be requested for this report.
The SM2 administrator can use the SELECT-HOSTS statement to select the hosts to be
displayed in the NSM report. If these include the local host, this is output in the first line,
followed by the remaining hosts in the order specified in the SELECT-HOSTS statement.
The header contains information on the first host for which valid data is found. If valid
information cannot be found on a particular host, the string “**” appears in place of the
monitored data.
For further information, please refer to the description of the SELECT-HOSTS statement on
page 110.
D016ZE04 SM2 NSM
CYCLE:
120 S
99-03-24
14:30:00
+-----------------------------+-------------------------+
| MAX MSG LENGTH:
5 KB | USED MSG LENGTH: 1.0 % |
+-----------------------------+-------------------------+
| CIRC TIME:
166.5 MS
|
+-------------------------------------------------------+
+----------+-----------+-----------+-----------+-----------+-----------+
|
HOST
| DURATION |
#WAIT
| # LOCK| TOTAL REQ | LOCAL REQ |
|
| TIME (MS) |
MSG
|
SERVER |
(1/S)
|
(%)
|
+----------+-----------+-----------+-----------+-----------+-----------+
| D016ZE04 |
1.0 |
0.0 |
107 |
43.4 |
96.7 |
| D016ZE02 |
1.0 |
0.0 |
7 |
0.1 |
100.0 |
| D016ZE07 |
1.0 |
0.0 |
32 |
13.4 |
87.0 |
+----------+-----------+-----------+-----------+-----------+-----------+
270
U3585-J-Z125-8-76
SM2 reports
NSM report
Monitoring information
MAX MSG LENGTH
Length of the NSM message buffer in the token in KB
USED MSG LENGTH Percentage of the NSM message buffer used
CIRC TIME
Circulation time of the token in milliseconds
This data is output by the first host.
HOST
Name of the host on which the data is collected
DURATION
TIME (MS)
Dwell time of the token in the host in milliseconds
#WAIT MSG
Number of messages waiting for space in the token
#LOCKSERVER
Number of lock servers.
Each lock server represents a resource. It is created at the first
enqueue and released at the last dequeue.
TOTAL REQ (1/S)
Total number of requests (enqueue, dequeue, convert, cancel)
per second
LOCAL REQ (%)
Percentage of all requests that are local requests.
A local request is a request in which the lock server already exists
and is located on the local host.
U3585-J-Z125-8-76
271
PCA reports
SM2 reports
PCA reports
SM2 collects monitored data on 3419/21 controllers with a cache which are managed by
the PCA subsystem. Unlike other SM2 monitoring programs, this information is not hostspecific, rather refers globally to a controller. This must be taken into account particularly
when interpreting the data.
The PCA CONTROLLER report supplies summary information for all installed 3419/21
controllers. If you require detailed information (cache and device data), you can also
request a PCA CACHE and PCA DEVICE report.
Notes
Only the PCA values of devices assigned a cache area are counted.
In the case of access values, I/O operations are counted.
Only the value #PEND.BLOCKS is counted in PAM blocks or 4K blocks, depending on
the disk type (K/NK2 or NK4). The disks for which caching is carried out under a
CACHE-ID must have a homogeneous format: either all disks must have the K/NK2
format or they must all have the NK4 format; i.e. the #PEND.BLOCKS can be counted
either in 2Kb or 4Kb blocks for each CACHE-ID. When this monitoring value is interpreted, the block size must be taken into account.
The summary information for #PEND.BLOCKS in the PCA-CONTROLLER report does
not supply a usable value for different block sizes.
Information on formatting disks can be found in the SM2R1 CONFIGURATION-TABLE
(see Volume 2).
SM2 does not output any PCA-SSD values, since SSDs (solid state disks of type 3409)
are handled as normal devices by SM2.
In "write mode", 100% is output for READ H-RATE if there are any read hits. If this is
not the case, 0% is output.
In the case of a purely read cache, "fast writes" are counted, provided the blocks to be
written are already in the cache (as a result of a previous read operation), but input/
output is executed quickly.
272
U3585-J-Z125-8-76
SM2 reports
PCA reports
The figure below illustrates the hierarchy of reports and the statements used to request
them:
PCA CONTROLLER report
SELECT-PCA-CONTROLLER
PCA CACHE report
SELECT-PCA-CACHE
PCA DEVICE report
U3585-J-Z125-8-76
273
PCA CACHE report
SM2 reports
PCA CACHE report
This report provides monitored data on the caches of selected controllers.
Report output
The PCA CACHE report is output only at the explicit request of the SM2 user with the help
of the SELECT-PCA-CONTROLLER statement (see page 176). This statement is used to
output a PCA CONTROLLER report together with a PCA CACHE report for the selected
controllers. The PCA CACHE report supplies detailed information on the controller caches.
The report can only be output if the SM2 administrator has activated the monitoring process
using the statement START-MEASUREMENT-PROGRAM TYPE=*PCA.
Overflow screens may be requested for this report.
The monitored data output is sorted in accordance with the size of the cache (CACHE
SIZE). It is possible to output data on up to 32 controllers.
D017ZE03 SM2 PCA CACHE
CYCLE:
60 S
99-03-24
11:11:02
CTL-DEV-MN: A93F
----+-----+-------+--------+--------+--------+------+--------+--------+-------CACH|CACHE| PREF. | #PEND. | READ
| C-READ |READ- | WRITE |FAST W. | C-OVER
ID |SIZE | LEN. | BLOCKS | (1/S) | (1/S) |H-R. %| (1/S) | (1/S) | (1/S)
----+-----+-------+--------+--------+--------+------+--------+--------+-------5 | 20 |
0 |
594 | 324.8 | 324.8 |100.0 | 178.0 | 178.0 |
0.0
4 |
4 |
16 |
0 |
0.0 |
0.0 | 0.0 |
0.0 |
0.0 |
0.0
----+-----+-------+--------+--------+--------+------+--------+--------+--------
Monitoring information
274
CTL-DEV-MN
Mnemonic name of the controller’s CONTROL DEVICE
CACH ID
Cache ID
CACHE SIZE
Size of the cache in MB
PREF. LEN.
Prefetch length for high-speed caching reads in input/output operations
#PEND. BLOCKS
Number of blocks (2Kb/4Kb, depending on the disk format) still to be
relocated to disk
READ (1/S)
Total number of read operations (in I/Os per second)
C-READ (1/S)
Total number of read operations to be executed as fast reads
(caching reads) (in I/Os per second)
U3585-J-Z125-8-76
SM2 reports
PCA CACHE report
READ H-R. (%)
Percentage of hits based on the total number of read operations to
be executed as fast reads
WRITE (1/S)
Total number of write operations (in I/Os per second)
FAST W. (1/S)
Total number of high-speed write operations (in I/Os per second)
C-OVER (1/S)
Number of unsuccessful attempts to use the cache due to a cache
overrun (in I/Os per second)
Notes
If a miss occurs during a caching read operation ("fast read"), the data is read from disk
and (in contrast to a read operation) stored in the cache. Cache overruns can only occur
in write operations. In the event of an overrun, the write operation bypasses the cache
and is performed directly on the disk.
U3585-J-Z125-8-76
275
PCA CONTROLLER report
SM2 reports
PCA CONTROLLER report
This report provides global monitored data on the individual 3419/21 controllers. One line
is output for each controller.
Report output
The REPORT PCA statement is used to request the output of the PCA CONTROLLER
report. The report can only be output if the SM2 administrator has activated the monitoring
process using the statement START-MEASUREMENT-PROGRAM TYPE=*PCA.
Overflow screens may also be requested for this report.
The monitored data output is sorted in accordance with the size of the cache (CACHE
SIZE).
D017ZE03 SM2 PCA CONTROLLER
CYCLE:
60 S
99-03-24
11:11:02
-----+-------+----+--------+--------+--------+------+--------+--------+-------CTL | CACHE | # | #PEND. | READ | C-READ | READ | WRITE | FAST W.| C-OVER
DEV | SIZE |CACH| BLOCKS | (1/S) | (1/S) |H-R. %| (1/S) | (1/S) | (1/S)
-----+-------+----+--------+--------+--------+------+--------+--------+-------453F |
128 | 1 |
0 |
0.0 |
0.0 | 0.0 |
0.0 |
0.0 |
0.0
9A3F |
80 | 2 |
0 |
0.0 |
0.0 | 0.0 |
0.0 |
0.0 |
0.0
A93F |
24 | 2 |
594 | 324.8 | 324.8 |100.0 | 178.0 | 178.0 |
0.0
463F |
10 | 1 |
0 |
0.1 |
0.0 | 0.0 |
0.0 |
0.0 |
0.0
-----+-------+----+--------+--------+--------+------+--------+--------+--------
Monitoring information
The individual entries have the following meanings:
276
CTL DEV
Mnemonic name of the controller’s CONTROL DEVICE
CACHE SIZE
Amount of memory reserved for caching in MB
#CACH
Number of caches
#PEND. BLOCKS
Number of blocks (2K/4K, depending on the disk format) still to be
relocated to disk
READ (1/S)
Total number of read operations to disks for which caching is
performed (in I/Os per second)
C-READ (1/S)
Total number of read operations to be executed as fast reads
(caching reads) (in I/Os per second)
U3585-J-Z125-8-76
SM2 reports
PCA CONTROLLER report
READ H-R (%)
Percentage of hits based on the total number of read operations to
be executed as fast reads
WRITE (1/S)
Total number of write operations to disks for which caching is
performed (in I/Os per second)
FAST W. (1/S)
Total number of fast write operations executed (in I/Os per second)
C-OVER (1/S)
Number of unsuccessful attempts to use the cache due to a cache
overrun (in I/Os per second)
Notes
If a miss occurs during a caching read operation ("fast read"), the data is read from disk
and (in contrast to a read operation) stored in the cache. Cache overruns can only occur
in write operations. In the event of an overrun, the write operation bypasses the cache
and is performed directly on the disk.
U3585-J-Z125-8-76
277
PCA DEVICE report
SM2 reports
PCA DEVICE report
This report provides monitored data on the devices of a 3419/21 controller which have been
allocated a cache.
Report output
The PCA DEVICE report is output only at the explicit request of the SM2 user with the help
of the SELECT-PCA-CACHE statement (see page 174). This statement is used to output a
PCA CONTROLLER report together with a PCA DEVICE report for the selected cache of
a controller. The PCA DEVICE report supplies detailed information on the devices of a
3419/21 controller which have been allocated a cache.
The report can only be output if the SM2 administrator has activated the monitoring process
using the statement START-MEASUREMENT-PROGRAM TYPE=*PCA.
Overflow screens may be requested for this report.
The monitored data output is sorted in accordance with the total number of access operations.
It is possible to output data on up to 32 pairs of controllers and caches.
D017ZE03 SM2 PCA DEVICE
CYCLE:
60 S
99-03-24
11:11:02
CTL-DEV-MN: A93F
CACHE-ID: 5
CACHE-SIZE: 20 MB
------+--------+----+-------+-------+--------+-------+-------+--------+-------DEVICE
| # |#PEND. | READ | C-READ | READ- | WRITE |FAST W. |C-OVER
MN | VSN
|SHAR|BLOCKS | (1/S) | (1/S) |H-RATE%| (1/S) | (1/S) | (1/S)
------+--------+----+-------+-------+--------+-------+-------+--------+-------A90A | A90A.0 | 1 |
594 | 324.8 | 324.8 | 100.0 | 178.0 | 178.0 |
0.0
------+--------+----+-------+-------+--------+-------+-------+--------+--------
Monitoring information
278
CTL-DEV-MN
Mnemonic name of the controller’s CONTROL DEVICE
CACHE-ID
Cache ID
CACHE SIZE
Size of the cache MB
DEVICE MN
Mnemonic name of the device supported by the cache
DEVICE VSN
VSN of the device supported by the cache
#SHAR
Number of systems which service the device via the cache
#PEND. BLOCKS
Number of blocks (2K/4K blocks, depending on the disk format) yet
to be relocated to disk
U3585-J-Z125-8-76
SM2 reports
PCA DEVICE report
READ (1/S)
Total number of read operations (in I/Os per second)
C-READ (1/S)
Total number of read operations to be executed as fast reads
(caching reads) (in I/Os per second)
READ H-RATE %
Percentage of hits based on the total number of read operations to
be executed as fast reads
WRITE (1/S)
Total number of write operations (in I/Os per second)
FAST W. (1/S)
Total number of all fast write operations performed (in I/Os per
second)
C-OVER (1/S)
Number of unsuccessful attempts to use the cache due to a cache
overrun (in I/Os per second)
Notes
If a miss occurs during a caching read operation ("fast read"), the data is read from disk
and (in contrast to a read operation) stored in the cache. Cache overruns can only occur
in write operations. In the event of an overrun, the write operation bypasses the cache
and is performed directly on the disk.
U3585-J-Z125-8-76
279
PCS report
SM2 reports
PCS report
This report provides an overview of the activities of the Performance Control Subsystem.
Report output
The REPORT PCS statement is used to request the output of the PCS report.
The report can only be output if PCS was active during the last monitoring cycle.
D016ZE04 SM2 PCS
CYCLE:
120 S
SAMPLES:
293
99-03-24
14:30:00
|CATEGORY |
SRACT (1/SEC)
| SQPLN | SQACT | RDACT | DUR-RO |DUR-RO-P|
| NAME
| TOTAL |
IO |
CPU | (%) | (%) |
|(1/SEC) |(1/SEC) |
+---------+-------+-------+-------+-------+-------+--------+--------+--------+
| SUM
| 42739|
5765| 30845|
| 100.0 |
1.0 | 0.657 | 0.000 |
| SYS
|
5442|
1659|
3688|
0.0 | 12.7 |
1.0 | 0.000 | 0.000 |
| DIALOG |
57|
0|
57|
1.0 |
0.1 |
1.2 | 0.000 | 0.000 |
| BATCH
|
520|
29|
472|
2.3 |
1.2 |
1.1 | 0.000 | 0.000 |
| TP
|
447|
8|
392|
5.1 |
1.0 |
1.6 | 0.000 | 0.000 |
| TP1
|
63|
4|
55| 21.2 |
0.1 |
1.0 | 0.000 | 0.000 |
| BATCHDB |
0|
0|
0| 11.7 |
0.0 |
** | 0.000 | 0.000 |
| BATCHF |
818|
720|
94|
1.1 |
1.9 |
1.0 | 0.000 | 0.000 |
| DIALOG1 | 12227|
2352|
7888| 20.7 | 28.6 |
1.0 | 0.491 | 0.000 |
| DIALOG2 |
7002|
564|
5395| 20.0 | 16.3 |
1.0 | 0.166 | 0.000 |
| DIALOG3 | 16163|
429| 12805| 16.4 | 37.8 |
1.1 | 0.000 | 0.000 |
Monitoring information
This report contains the totals (SUM column) for all categories (except for the SQPLN and
RDACT values) in the first line below the table header. The data for the individual categories
(up to 16) is output in the following lines.
280
CATEGORY NAME
Name of a category
SRACT (1/SEC)
Service rate used by this category, specified as TOTAL, IO and CPU
TOTAL
Total number of all service rates used by this category (sum of IO,
CPU and memory service rates)
IO
IO service rates used by this category
CPU
CPU service rates used by this category
U3585-J-Z125-8-76
SM2 reports
PCS report
SQPLN (%)
System performance percentage planned for this category.
(This variable is irrelevant for the SUM category and is therefore
replaced by blanks.)
SQACT(%)
Current percentage of system performance for this category
RDACT
Current delay of all jobs in this category.
If no dilation was sensed, ’**’ is output (see section on “dilation
factor” on page 447 of the glossary).
(A system-global value is given in the SUM line.)
DUR-RO (1/SEC)
Number of DURATION time slice runouts for tasks in this category.
(The given service rate has been used up, the task is placed in the
defined continuation category.)
DUR-RO-P (1/SEC)
Number of DURATION time slice runouts with preemption for tasks
or jobs in this category. (Meaning as above; since the defined
continuation category is not permitted because of overloading, the
task is entered in task queue 6.)
Note on SR2000
The monitored data on service units is based on native CPU time (see “CPU time and CPU
service units on SR2000” on page 446 of the glossary).
U3585-J-Z125-8-76
281
PERIODIC TASK report
SM2 reports
PERIODIC TASK report
This report provides information on the most important consumption statistics of all tasks.
Report output
The REPORT PERIODIC statement (synonymous with REPORT TASK) is used to request
the output of the PERIODIC TASK report. The report can only be output if the SM2
administrator has
– defined the tasks whose monitored data is to be written to the SM2 output file using the
SET-PERIODIC-TASK-PARAMETER statement
– activated the monitoring process using the statement START-MEASUREMENTPROGRAM TYPE=*PERIODIC-TASK
Privileged users receive monitored data on all tasks. Nonprivileged users receive monitored
data only on the tasks belonging to their user ID.
The monitored data output is sorted in accordance with the sort criterion defined in the
SELECT-PERIODIC-TASK-PARAMETER statement (see page 177). By default, it is sorted
in accordance with the service units.
Overflow screens may also be requested for this report.
D016ZE04 SM2 PERIODIC TASK (S-U)
TU + TPR=
45.2 %
SIH= 10.5 %
CYCLE: 120 S
IDLE= 44.3 %
99-03-24
IO(/S)= 402.8
14:30:00
( 2 LM'S)
TSN | USERID | TYP |SERV-RATE|CPU-TIME| IO(/S)| UPG
| PAG READ|
-----+----------+-----+---------+--------+--------+--------+---------+--------9PF9 | CCC
| DIA | 7089.3 |
6.6% |
0.1 | 14457 |
0.0 |
9XJM | LKLK
| DIA | 5637.3 |
6.3% |
7.5 |
5423 |
0.0 |
9XI6 | LKLK
| DIA | 2929.8 |
3.9% |
0.3 |
743 |
0.0 |
9RBI | DRR
| DIA | 2677.7 |
3.0% |
18.5 |
2433 |
0.0 |
9XIW | LKLK
| DIA | 2575.5 |
3.3% |
2.3 |
743 |
0.0 |
9XJA | SD222222 | DIA | 1527.7 |
1.6% |
8.9 |
506 |
0.0 |
BCAM |
| SYS | 1356.2 |
0.2% | 191.7 |
818 |
0.0 |
9UYY | GRR
| DIA | 1108.8 |
1.4% |
7.3 |
347 |
0.0 |
9XJN | SD222222 | DIA | 1062.2 |
1.1% |
8.9 |
506 |
0.0 |
9XIF | SD222222 | DIA |
916.5 |
0.9% |
8.9 |
506 |
0.0 |
SM2G |
| SYS |
880.7 |
1.2% |
0.1 |
539 |
0.0 |
9XII | SD222222 | DIA |
808.4 |
0.8% |
8.9 |
496 |
0.0 |
9UMB | WBB
| DIA |
750.5 |
0.9% |
0.7 |
1686 |
0.0 |
9XIZ | SD222222 | DIA |
748.7 |
0.7% |
8.9 |
506 |
0.0 |
9XJS | SD222222 | DIA |
734.1 |
0.7% |
9.8 |
515 |
0.0 |
9WJ7 | TSOS
| BAT |
724.0 |
0.0% |
7.0 |
207 |
0.0 |
282
U3585-J-Z125-8-76
SM2 reports
PERIODIC TASK report
Monitoring information
The first header line shows the report name and the sort criterion used (CPU, IO, UPG or
S-U for service units).
The second header line displays the following global system values:
TU+TPR
Percentage of the (TU+TPR+SIH+IDLE) time accounted for by the
(TU+TPR) time
SIH
Percentage of the (TU+TPR+SIH+IDLE) time accounted for by the
SIH time
IDLE
Percentage of the (TU+TPR+SIH+IDLE) time accounted for by the
IDLE time
IO(/S)
Total number of I/Os per second in the last cycle
(2 LM’S)
Number of logical machines which were active
The PERIODIC TASK report contains data for the tasks selected with the SELECTPERIODIC-TASK-PARAMETER statement (see page 177). By default, the data of all tasks
is output.
D016ZE04 SM2 PERIODIC TASK (S-U)
TU + TPR=
45.2 %
SIH= 10.5 %
CYCLE: 120 S
IDLE= 44.3 %
99-03-24
IO(/S)= 402.8
14:30:00
( 2 LM'S)
TSN | USERID | TYP |SERV-RATE|CPU-TIME| IO(/S)| UPG
| PAG READ|
-----+----------+-----+---------+--------+--------+--------+---------+--------9PF9 | CCC
| DIA | 7089.3 |
6.6% |
0.1 | 14457 |
0.0 |
9XJM | LKLK
| DIA | 5637.3 |
6.3% |
7.5 |
5423 |
0.0 |
9XI6 | LKLK
| DIA | 2929.8 |
3.9% |
0.3 |
743 |
0.0 |
9RBI | DRR
| DIA | 2677.7 |
3.0% |
18.5 |
2433 |
0.0 |
9XIW | LKLK
| DIA | 2575.5 |
3.3% |
2.3 |
743 |
0.0 |
9XJA | SD222222 | DIA | 1527.7 |
1.6% |
8.9 |
506 |
0.0 |
BCAM |
| SYS | 1356.2 |
0.2% | 191.7 |
818 |
0.0 |
9UYY | GRR
| DIA | 1108.8 |
1.4% |
7.3 |
347 |
0.0 |
9XJN | SD222222 | DIA | 1062.2 |
1.1% |
8.9 |
506 |
0.0 |
9XIF | SD222222 | DIA |
916.5 |
0.9% |
8.9 |
506 |
0.0 |
SM2G |
| SYS |
880.7 |
1.2% |
0.1 |
539 |
0.0 |
9XII | SD222222 | DIA |
808.4 |
0.8% |
8.9 |
496 |
0.0 |
9UMB | WBB
| DIA |
750.5 |
0.9% |
0.7 |
1686 |
0.0 |
9XIZ | SD222222 | DIA |
748.7 |
0.7% |
8.9 |
506 |
0.0 |
9XJS | SD222222 | DIA |
734.1 |
0.7% |
9.8 |
515 |
0.0 |
9WJ7 | TSOS
| BAT |
724.0 |
0.0% |
7.0 |
207 |
0.0 |
U3585-J-Z125-8-76
283
PERIODIC TASK report
SM2 reports
Monitoring information
TSN
TSN of the task
Depending on whether the output value USER-ID or JOB-NAME was selected in the
SELECT-PERIODIC-TASK-PARAMETER statement, the second column contains either
USERID
User ID of the task
or
JOB-NAME
Job name of the task
TYP
Current task type at the end of the monitoring cycle
SERV-RATE
Elapsed service units of the task per second
CPU-TIME
Task’s percentage of the (TU+TPR+SIH+IDLE) time (without the
share of the hypervisor under VM)
IO(/S)
Number of I/Os for the task per second
UPG
Mean UPG of the task
PAG READ
Number of page reads per second for the task
Notes
284
–
Physical writing of pages to the paging disk is assigned to the system task with the TSN
"PGE" for the purposes of consumption statistics.
–
The monitored data on CPU utilization is based on native CPU time (see “CPU time and
CPU service units on SR2000” on page 446 of the glossary).
U3585-J-Z125-8-76
SM2 reports
PFA reports
PFA reports
The PFA monitoring program enables SM2 to record monitored data on the use of various
caches. These caches can be served by the products DAB and PCA.
DAB supports the caches in main memory, expanded storage and global storage. PCA
supports the caches in the 3419, 3421, 3860 and SYMMETRIX controllers.
If PFA serves the cache via DAB and the DAB monitoring program is activated, DAB
monitored data will be supplied in addition to PFA monitored data and output in the DAB
reports. If PFA serves the caches of 3419/21 controllers via PCA and the PCA monitoring
program is activated, PCA monitored data will be supplied and output in the PCA reports.
When serving the caches of SYMMETRIX controllers, you need only activate the PFA
monitoring program in order to output monitored data in the SYMMETRIX reports.
Unlike other SM2 monitoring programs, the information recorded by PCA is not hostspecific, rather refers globally to a controller. This must be taken into account particularly
when interpreting the data.
The PFA CACHE report provides a non-product-specific overview of the use of all caches.
The PFA CONTROLLER report supplies controller-specific monitored data on a PFA cache
served by PCA and whose devices can be assigned to different controllers.
The figure below illustrates the hierarchy of reports and the statement used to request them:
PFA CACHE report
SELECT-PFA-CACHE
PFA CONTROLLER report
U3585-J-Z125-8-76
285
PFA CACHE report
SM2 reports
PFA CACHE report
This report provides an overview of the use of all PFA caches for the products DAB and
PCA. The PFA CACHE report only contains data supplied in the same manner from the
different products.
Report output
The REPORT PFA statement is used to request the output of the PFA CACHE report. The
report can only be output if the SM2 administrator has activated the monitoring process
using the statement START-MEASUREMENT-PROGRAM TYPE=*PFA.
Overflow screens may be requested for this report.
The monitored data output is sorted under the categories READ and WRITE.
D016ZE04 SM2 PFA CACHE
CYCLE:
60 S
99-04-11
15:08:00
| CACHE |CACHE| BLK |
SIZE
| READ | RD HIT| WRITE | WR HIT|OVERRUNS|
| ID
| MED | SIZE|
| (1/S) | (%) | (1/S) | (%) | (1/S) |
+--------+-----+-----+----------+--------+-------+--------+-------+--------+
| 1MD3 | *CTL| 2 K |
254 MB | 317.8 | 99.7 | 106.9 | 99.3 |
0.5 |
| 1MD4 | *CTL| 2 K |
254 MB | 317.4 | 99.8 | 107.2 | 98.8 |
0.9 |
+--------+-----+-----+----------+--------+-------+--------+-------+--------+
Monitoring information
CACHE ID
Cache ID. This is identical to the PVS ID of the pubset served.
CACHE MED
Cache medium MM: Main memory
ES: Expanded storage
GS: Global storage
CTL: Disk controller unit
If the medium is marked with an asterisk (*XX), this means that a
second, more detailed report (PFA CONTROLLER report) can be
output for this cache.
286
U3585-J-Z125-8-76
SM2 reports
PFA CACHE report
BLK SIZE
Block size of the cache
SIZE
Size of the cache
READ
Number of read operations to hiperfiles (in I/Os per second)
RD HIT
Percentage of hits in the total number of read operations to hiperfiles
WRITE
Number of write operations to hiperfiles (in I/Os per second)
WR HIT
Percentage of fast write operations in the total number of write
operations to hiperfiles
OVERRUNS
Number of unsuccessful attempts to use the cache due to overload
(per second)
Notes
–
The number of read and write accesses is output to one decimal place. Read and write
rates less than 0.05 per second are rounded down to 0.0 per second and hit rates are
calculated.
–
In SYMMETRIX controllers, all write operations are executed via the cache as fast
writes. An exception are delayed fast writes: if the cache is filled with unsaved write
data, these may be forced to wait temporarily for a cache slot to become available. A
WR HIT is one write operation that need not be delayed. Only very high write loads will
cause the WR HIT rate to fall below 100%. If this occurs, delayed fast writes will be
output under OVERRUNS.
U3585-J-Z125-8-76
287
PFA CONTROLLER report
SM2 reports
PFA CONTROLLER report
This report provides detailed monitored data on a single PFA cache served by PCA and
whose pubset disks can be assigned to various controllers.
Report output
The PFA CONTROLLER report is output only at the explicit request of the SM2 user with
the help of the SELECT-PFA-CACHE statement (see page 179). The PFA CACHE report
indicates the caches for which subreports can be selected. In addition to the PFA CACHE
report, this statement is used to output a PFA CONTROLLER report for the selected
caches. The PFA CONTROLLER report supplies detailed information on the cache
controllers.
The report can only be output if the SM2 administrator has activated the monitoring process
using the statement START-MEASUREMENT-PROGRAM TYPE=*PFA.
Overflow screens may be requested for this report.
The monitored data output is sorted under the categories READ and WRITE.
It is possible to output data on up to 16 caches.
D016ZE04 SM2 PFA CONTROLLER
CACHE-ID: 1MD3
CYCLE:
60 S
CONTROLLER-TYPE: 3860
99-04-11
15:08:00
PREFETCH LENGTH: NONE
| CTL | #DEV | SEC |
SIZE
| READ | RD HIT| WRITE | WR HIT|OVERRUNS|
| MN |
| NR |
| (1/S) | (%) | (1/S) | (%) | (1/S) |
+------+------+-----+----------+--------+-------+--------+-------+--------+
|
00 |
8 |
0 |
0 MB | 317.8 | 99.7 | 106.9 | 99.3 |
0.5 |
+------+------+-----+----------+--------+-------+--------+-------+--------+
Monitoring information
CACHE ID
Cache ID. This is identical with the PVS ID of the pubset served.
CONTROLLER TYPE 3419
3421
3860
SYMMETRIX
288
U3585-J-Z125-8-76
SM2 reports
PFA CONTROLLER report
PREFETCH LENGTH Information on the prefetching strategy (only supported for 3419/21)
NONE: No prefetching
LOW: A small number of blocks are prefetched
HIGH: A large number of blocks are prefetched
CTL MN
Mnemonic name of the controller or of the CONTROL DEVICE
(3419/21)
#DEV
Number of disk devices supported by the cache
SEC NR
Cache sector number on this controller (3419/21 only)
SIZE
Size of the cache sector in this controller in MB (3419/21 only)
READ
Number of read operations to hiperfiles (in I/Os per second)
RD HIT
Percentage of hits in the total number of read operations to hiperfiles
WRITE
Total number of write operations (in the case of 3860, the number of
fast write operations) to hiperfiles (in I/Os per second)
WR HIT
Percentage of fast write operations in the total number of write
operations to hiperfiles
OVERRUNS
Number of unsuccessful attempts to use the cache due to overload
(per second)
Note
The PFA controller screens are output in the order in which the caches occur in the PFA
CACHE report.
If PFA serves the cache via DAB and the DAB monitoring program is activated, DAB
monitored data will be supplied in addition to PFA monitored data. If PFA serves the
caches of 3419/21 controllers via PCA and the PCA monitoring program is activated,
PCA monitored data will be supplied.
U3585-J-Z125-8-76
289
POSIX report
SM2 reports
POSIX report
Report output
The REPORT POSIX statement is used to request the output of the POSIX report. The
report can only be output if the SM2 administrator has activated the monitoring process
using the statement START-MEASUREMENT-PROGRAM TYPE=*POSIX.
D016ZE04 SM2 POSIX
CYCLE:
-------- OPTION A -------IGET/S
NAMEI/S
7.9
133.9
120 S
99-03-24
14:30:00
-------- OPTION M -------MSG/S
SEMA/S
0.0
1.8
-------------------------------- OPTION B -------------------------------BREAD/S
BWRITE/S
LREAD/S
LWRITE/S
RCACHE %
WCACHE %
0.4
1.2
44.1
30.8
99.1
96.1
PREAD/S
0.0
PWRITE/S
0.0
-------------------------------- OPTION C -------------------------------SCALL/S
SREAD/S
SWRITE/S
FORK/S
EXEC/S
RCHAR/S
490.7
115.0
5.3
0.4
0.7
592915.6
WCHAR/S
79299.5
Monitoring information
The individual entries have the following meanings (see the description of the sar command
in the manual “Reliant Unix V5.44, Volume 4” [19]:
OPTION A provides information on the use of system routines for file access:
IGET/S
Number of files determined by means of the Inode entry in the UFS
(Berkeley "fast file system") file system
NAMEI/S
Number of times per second a path name is searched for in the file
system
OPTION M provides information on message and semaphore activities:
290
MSG/S
Number of accesses to messages per second
SEMA/S
Number of semaphore activities per second
U3585-J-Z125-8-76
SM2 reports
POSIX report
OPTION B provides information on buffer utilization:
BREAD/S, BWRITE/S Number of data transmissions per second between the system
buffer and the hard disk or other block-oriented devices
LREAD/S, LWRITE/S Accesses to the system buffer per second
RCACHE, WCACHE
Cache-memory hit percentage, i.e.
RCACHE 1-BREAD/LREAD (in percent)
WCACHE 1-BWRITE/LWRITE (in percent)
PREAD/S, PWRITE/S Number of physical data transmissions per second
(raw device)
OPTION C provides information on system calls:
SCALL/S
All types of system call per second
SREAD/S, SWRITE/S, FORK/S, EXEC/S
Specific system calls
RCHAR/S, WCHAR/S Characters transmitted by means of read( ) and write( ) system calls
U3585-J-Z125-8-76
291
RESPONSETIME report
SM2 reports
RESPONSETIME report
This report contains data on response times, think times, transaction times and wait times
for messages in the BCAM pool.
Report output
The REPORT RESPONSE statement is used to request the output of the
RESPONSETIME report.
The report can only be output if the SM2 administrator has
– defined the monitoring parameters for response time statistics using the SETRESPONSETIME-PARAMETER statement
– specified the connection sets to be monitored using the ADD-CONNECTION-SET
statement
– activated the monitoring process using the statement START-MEASUREMENTPROGRAM TYPE=*RESPONSETIME
Depending on the definition of the SCOPE operand in the SET-RESPONSETIMEPARAMETER or MODIFY-RESPONSETIME-PARAMETER statement, SM2 output bucketspecific or category-specific screens.
In the case of SCOPE=*BUCKET, the user receives a separate screen for each of the
connection sets to be monitored (up to 16, including global statistics) with bucket-specific
values. Global statistics are output first.
292
U3585-J-Z125-8-76
SM2 reports
RESPONSETIME report
Example
Bucket-specific screen for the selected connection set ($DIALOG,*ALL,*ALL)
D016ZE04 SM2 RESPONSETIME (BUCKETS)
CYCLE:
120 S
99-03-24
14:30:00
DIALOG
APPLICATION: $DIALOG
PARTNER:
*ALL
CONN-TYPE:REMOTE PROCESSOR:
*ALL
---------------------------+----------------+----------------+----------------+
| RESP. TIME (1) |
THINK TIME
| TRANS. TIME
|
WAIT TIME
|
+----------------+----------------+----------------+----------------+
| BUCKET
COUNT | BUCKET
COUNT | BUCKET
COUNT | BUCKET
COUNT |
+----------------+----------------+----------------+----------------+
|
0.5
243 |
5.0
150 |
0.5
217 |
0.1
0 |
|
1.0
8 |
15.0
68 |
1.0
16 |
0.2
0 |
|
2.0
3 |
30.0
15 |
2.0
8 |
0.5
0 |
|
5.0
5 |
60.0
9 |
5.0
11 |
1.0
0 |
|
10.0
3 | 120.0
7 |
10.0
3 |
2.0
0 |
|> 10.0
1 |> 120.0
12 |> 10.0
5 |>
2.0
0 |
----------+----------------+----------------+----------------+----------------+
AVG SEC
|
0.2
|
9.0
|
0.4
|
0.0
|
NR. INTER |
262
|
249
|
255
|
0
|
RATE 1/SEC|
2.2
|
2.1
|
2.1
|
0.0
|
----------+----------------+----------------+----------------+----------------+
INPUT-LEN: 77.5
OUTPUT-LEN: 1004
In the case of SCOPE=*CATEGORY, the user receives a separate screen for each of the
connection sets to be monitored (up to 16, including global statistics) with category-specific
values. Global statistics are output first.
If both SCOPE=*CATEGORY and SCOPE=*BUCKET are specified, a screen is output for
bucket-specific values first, followed by one for category-specific values.
U3585-J-Z125-8-76
293
RESPONSETIME report
SM2 reports
Example
Category-specific screen for the selected connection set ($DIALOG,*ALL,*ALL)
D016ZE04 SM2 RESPONSETIME (CATEGORY) CYCLE:
DIALOG
CONN-TYPE:REMOTE
120 S
99-03-24
14:30:00
APPLICATION: $DIALOG
PARTNER:
*ALL
PROCESSOR:
*ALL
CATGORY| RESPONSE TIME |
THINK TIME
|TRANSACTION TIME |
WAIT TIME
NAME | AVG #INT RATE| AVG #INT RATE| AVG #INT RATE| AVG #INT RATE
-------+-----------------+-----------------+-----------------+----------------SUM
| 0.2
262
2.2| 9.0
249
2.1| 0.4
255
2.1| 0.0
0
0.0
SYS
| 0.0
21
0.2| 13.1
21
0.2| 0.3
22
0.2| 0.0
0
0.0
DIALOG | 0.0
1
0.0| 78.5
1
0.0| 1.6
1
0.0| 0.0
0
0.0
TP1
| 0.0
15
0.1| 2.0
14
0.1| 0.3
15
0.1| 0.0
0
0.0
DIALOG1| 0.2
219
1.8| 8.7
208
1.7| 0.4
217
1.8| 0.0
0
0.0
DIALOG2| 1.5
3
0.0| 7.9
2
0.0| 0.0
0
0.0| 0.0
0
0.0
DIALOG3| 6.2
3
0.0| 4.9
3
0.0| 0.0
0
0.0| 0.0
0
0.0
Categories for which no values have been specified are not output. If values are specified
for more than 13 categories, the screen is scrolled upwards by the corresponding number
of lines so that the topmost lines of the report are not visible on the screen.
294
U3585-J-Z125-8-76
SM2 reports
RESPONSETIME report
Bucket-specific screen
D016ZE04 SM2 RESPONSETIME (BUCKETS)
CYCLE:
120 S
99-03-24
14:30:00
*GLOBAL
APPLICATION: *ALL
PARTNER:
*ALL
CONN-TYPE:REMOTE PROCESSOR:
*ALL
---------------------------+----------------+----------------+----------------+
| RESP. TIME (1) |
THINK TIME
| TRANS. TIME
|
WAIT TIME
|
+----------------+----------------+----------------+----------------+
| BUCKET
COUNT | BUCKET
COUNT | BUCKET
COUNT | BUCKET
COUNT |
+----------------+----------------+----------------+----------------+
|
0.5
4523 |
5.0
4461 |
0.5
4482 |
0.1
71 |
|
1.0
9 |
15.0
80 |
1.0
18 |
0.2
0 |
|
2.0
10 |
30.0
19 |
2.0
16 |
0.5
0 |
|
5.0
27 |
60.0
14 |
5.0
35 |
1.0
0 |
|
10.0
14 | 120.0
7 |
10.0
12 |
2.0
0 |
|> 10.0
19 |> 120.0
15 |> 10.0
28 |>
2.0
0 |
----------+----------------+----------------+----------------+----------------+
AVG SEC
|
0.1
|
0.6
|
0.1
|
0.0
|
NR. INTER |
4583
|
4581
|
4563
|
71
|
RATE 1/SEC|
38.2
|
38.2
|
38.0
|
0.6
|
----------+----------------+----------------+----------------+----------------+
INPUT-LEN:472.8
OUTPUT-LEN:551.8
Monitoring information
For each screen, the associated connections or connection groups are output above the
monitoring data, as well as the connection set name ("GLOBAL" is the name given in the
example), when the ADD-CONNECTION-SET statement is defined).
CONN-TYPE
Types of connections taken into account during monitoring:
REMOTE:
Remote connections only
LOCAL:
Local connections only
BOTH:
Local and remote connections
RESP. TIME (1)
Response time data; the type of response time monitored (as
specified via the DEFINITION operand of the SET- and MODIFYRESPONSETIME-PARAMETER statements) is output
(1):
Response time as per definition 1
(2):
Response time as per definition 2
THINK TIME
Think time data
TRANS. TIME
Transaction time data
WAIT TIME
Wait time data (in the BCAM pool)
AVG SEC
Average duration of an interaction in seconds (without overflow
data)
U3585-J-Z125-8-76
295
RESPONSETIME report
SM2 reports
NR. INTER
Total number of interactions in the monitoring cycle (without
overflow data)
RATE 1/SEC
Number of monitored interactions per second (without overflow
data)
BUCKET
Corresponds to the bucket limits in seconds in which monitored data
is arranged in accordance with duration. The last line of the columns
(>) contains the overflow data. Data displayed there is not is not
used for computing AVG SEC, NR. INTER and RATE 1/SEC.
COUNT
Corresponds to the number of interactive operations in the
individual buckets
The SM2 administrators can modify the bucket limits and the number of buckets by means
of the SET- and MODIFY-RESPONSETIME-PARAMETER statements if the default options
are not suitable. If no interactions were recorded in the last monitoring cycle, the message
NOTE: SOME INTERACTIONS MISSED:<number> is displayed in the bottom line of each
of the RESPONSE TIME screens. This may be the case, for example, if the number of
active connections is greater than that defined in the CONNECTION-NUMBER parameter
of the SET- or MODIFY-RESPONSETIME-PARAMETER statement.
INPUT-LEN
OUTPUT-LEN
296
The average lengths in bytes of the input or
output messages
U3585-J-Z125-8-76
SM2 reports
RESPONSETIME report
Category-specific screen
D016ZE04 SM2 RESPONSETIME (CATEGORY) CYCLE:
*GLOBAL
CONN-TYPE:REMOTE
120 S
99-03-24
14:30:00
APPLICATION: *ALL
PARTNER:
*ALL
PROCESSOR:
*ALL
CATGORY| RESPONSE TIME |
THINK TIME
|TRANSACTION TIME |
WAIT TIME
NAME | AVG #INT RATE| AVG #INT RATE| AVG #INT RATE| AVG #INT RATE
-------+-----------------+-----------------+-----------------+----------------SUM
| 0.1 4583 38.2| 0.6 4581 38.2| 0.1 4563 38.0| 0.0
71
0.6
SYS
| 0.1 4255 35.5| 0.1 4252 35.4| 0.1 4288 35.7| 0.0
56
0.5
DIALOG | 0.0
1
0.0| 78.5
1
0.0| 1.6
1
0.0| 0.0
0
0.0
TP
| 1.7
42
0.4| 7.0
50
0.4| 1.8
41
0.3| 0.0
5
0.0
TP1
| 0.5
17
0.1| 2.5
18
0.2| 0.5
16
0.1| 0.0
10
0.1
DIALOG1| 0.4
259
2.2| 7.2
252
2.1| 0.4
217
1.8| 0.0
0
0.0
DIALOG2| 1.1
4
0.0| 5.3
3
0.0| 0.0
0
0.0| 0.0
0
0.0
DIALOG3| 6.1
5
0.0| 2.9
5
0.0| 0.0
0
0.0| 0.0
0
0.0
Monitoring information
For each screen the associated connections or connection groups are output over the
monitoring values; the connection set name (in the example it is *GLOBAL) is output, too.
(A connection set with the name *GLOBAL, in which all connections are monitored
(CONNECTION (*ALL,*ALL,*ALL)), is automatically defined using the SETRESPONSETIME-PARAMETER statement.)
CONN-TYPE:
Types of connections taken into account during monitoring:
REMOTE: Remote connections only
LOCAL:
Local connections only
BOTH:
Local and remote connections
CATGORY NAME
Name of the category
RESPONSETIME
Monitoring data for the response time
THINK TIME
Monitoring data for the think time
TRANSACTION TIME Monitoring data for the transaction time
WAIT TIME
Monitoring data for the wait times (in the BCAM pool)
AVG
Average duration of the transaction (in seconds) (without overflow
values)
U3585-J-Z125-8-76
297
RESPONSETIME report
298
SM2 reports
#INT
Total number of transactions during the monitoring cycle (without
overflow values)
RATE
Number of interactions monitored per second (without overflow
values)
U3585-J-Z125-8-76
SM2 reports
SHARED PVS report
SHARED PVS report
This report contains monitored data on I/O operations on shared pubsets for a host
network.
Report output
The REPORT SHARED_PVS statement is used to request the output of the SHARED PVS
report.
The SM2 administrator can use the SELECT-HOSTS statement (see page 110) to select
the hosts whose monitored data is to be displayed in the report.
The header contains information on the local host (if this is selected) or on first host for
which valid data is found. If valid information cannot be found on a particular host, the string
“SOME DATA MISSED” appears in the second line.
Overflow screens may be requested for this report.
The monitored data output is sorted in accordance with the number of I/O operations.
D016ZE04 SM2 SHARED PVS
CYCLE:
120 S
99-03-24
14:30:00
|
MN
| VOLUME | IO (1/S) | Q-LGTH
|
+--------+----------+-----------+-----------+
| 437A | 2OSG.8 |
173.0 |
6.6 |
| 4343 | QVS2.0 |
102.6 |
20.1 |
| 4303 | QCV1.0 |
56.5 |
1.1 |
| 431C | 2OSC.1 |
50.5 |
0.3 |
| 4354 | 2OSC.4 |
23.7 |
0.3 |
| 4361 | 2OSG.0 |
9.8 |
3.6 |
| 435C | 2OSC.5 |
7.0 |
0.0 |
| 4313 | 2RZV.2 |
5.9 |
0.0 |
| 431A | 2RZV.1 |
5.7 |
0.0 |
| 4304 | QVS4.0 |
4.0 |
0.0 |
| 430B | QVS1.0 |
2.6 |
0.0 |
| 4324 | 1DQM.6 |
2.2 |
0.0 |
| 4344 | 6VS2.0 |
1.7 |
0.0 |
| A800 | 1OSY.0 |
1.7 |
0.0 |
| 4312 | 2RZV.0 |
1.6 |
0.0 |
| 4356 | 2OSC.C |
1.6 |
0.0 |
| 4314 | 2OSC.0 |
1.5 |
0.0 |
| 434C | 6VS3.0 |
1.1 |
0.0 |
U3585-J-Z125-8-76
299
SHARED PVS report
SM2 reports
Monitoring information
The values correspond to those of the DEVICE report and form the sum of the values from
the individual hosts.
SM2 cannot automatically determine the percentage utilization of the disks (as in the
DEVICE report).
Each host recognizes only its own accesses to the disk. The disk is already considered
active when the I/O chaining starts, even if the system still has to wait until another host has
completed its access. This can cause a dilation of the local utilization, which depends on
the level of the local or remote loads and their distribution over time.
300
U3585-J-Z125-8-76
SM2 reports
SVC report
SVC report
This report provides an overview of the SVC calls.
Report output
The REPORT SVC statement is used to request the output of the SVC report.
The report can only be output if the SM2 administrator has activated the monitoring process
using the statement START-MEASUREMENT-PROGRAM TYPE=*SVC.
The monitored data output is sorted in accordance with the total number of calls from TU
and TPR. The maximum number of entries that can be output is the number that will fit on
the screen. In addition, the sum is output for all SVCs and, if necessary, a value for SVCs
that do not appear on this page. Only one screen is output.
D016ZE04 SM2 SVC
CYCLE:
60 S
99-03-26
16:30:00
SVC
TU
TPR|SVC
TU
TPR|SVC
TU
TPR|SVC
TU
TPR
-------------------+-------------------+-------------------+------------------SUM 2306.4 1856.3|250
0.0
762.4|135
549.6
0.0|146
234.4
220.5
183
236.9
0.0|168
0.1
225.9|125
225.4
0.0|191
220.1
0.0
235
0.0
219.8| 1
144.0
0.4|234
0.0
117.1| 39
2.0
110.8
145
110.6
0.0| 49
109.9
0.6| 14
109.8
0.0|185
109.8
0.0
246
0.0
87.8| 47
52.4
23.6| 44
63.6
0.0|128
45.8
0.0
170
21.0
19.1|215
0.0
33.9|187
26.7
0.0|214
0.0
12.4
188
10.9
0.9|123
5.8
0.0|149
5.4
0.0|241
0.0
4.6
89
1.2
2.9| 73
3.1
0.0|229
0.0
2.9|186
0.2
2.6
87
2.7
0.0|124
2.6
0.0| 85
2.6
0.0| 7
1.7
0.3
144
1.4
0.5|172
1.2
0.3|161
0.1
1.4|228
0.0
1.3
52
1.2
0.0|236
0.0
1.0| 58
0.9
0.0| 76
0.0
0.9
51
0.7
0.0| 70
0.4
0.3|222
0.0
0.7| 83
0.6
0.0
213
0.0
0.3|233
0.0
0.3| 96
0.1
0.1| 45
0.2
0.0
9
0.2
0.0|237
0.0
0.2| 28
0.0
0.1| 42
0.1
0.0
72
0.1
0.0| 32
0.0
0.1| 67
0.1
0.0| 68
0.1
0.0
108
0.0
0.1| 38
0.0
0.0| 66
0.1
0.0| 88
0.1
0.0
56
0.0
0.0| 86
0.0
0.0|158
0.0
0.0| 75
0.0
0.0
80
0.0
0.0| 16
0.0
0.0| 33
0.0
0.0|RST
0.0
0.0
Monitoring information
SVC
TU
TPR
SUM
TU
TPR
RST
TU
TPR
U3585-J-Z125-8-76
SVC number
Number of SVC calls in TU per second
Number of SVC calls in TPR per second
Sum of all SVCs per second from TU
Sum of all SVCs per second from TPR
Remaining SVCs per second from TU
Remaining SVCs per second from TPR
301
SYMMETRIX reports
SM2 reports
SYMMETRIX reports
SM2 collects monitored data on the use of SYMMETRIX controllers.
– The SYMMETRIX CONTROLLER report provides summary data on all installed
SYMMETRIX controllers.
– The SYMMETRIX DEVICE report provides monitored data on the devices of selected
controllers.
The acquisition of monitored data is controlled by the PFA monitoring program.
Unlike other SM2 monitoring programs, the information recorded on SYMMETRIX
controllers is not host-specific, rather refers globally to a particular controller. This must be
taken into account particularly when interpreting the data.
The figure below illustrates the hierarchy of reports and the statement used to request them:
SYMMETRIX CONTROLLER report
SELECT-SYMMETRIX-CONTROLLER
SYMMETRIX DEVICE report
302
U3585-J-Z125-8-76
SM2 reports
SYMMETRIX CONTROLLER report
SYMMETRIX CONTROLLER report
This report provides an overview of the use of caches in the individual emulated 3860
controllers of a SYMMETRIX subsystem.
Report output
The REPORT SYMMETRIX statement is used to request the output of the SYMMETRIX
CONTROLLER report. The report can only be output if the SM2 administrator has activated
the monitoring process using the statement START-MEASUREMENT-PROGRAM
TYPE=*PFA.
Overflow screens may be requested for this report.
The monitored data output is sorted under the categories READ and WRITE.
017ZE03 SM2 SYMMETRIX CONTROLLER CYCLE:
60 S
99-03-24
11:11:02
| CONTROLLER |
SIZE
| READ
|RD HIT | WRITE |WR HIT |TOT HIT|
|
MN
|
| (1/S) | (%) | (1/S) | (%) | (%) |
+-------------+----------+---------+-------+---------+-------+-------+
| S6 /S7
| 1628 MB | 420.3 | 100.0 | 229.6 | 100.0 | 100.0 |
+-------------+----------+---------+-------+---------+-------+-------+
Monitoring information
CONTROLLER MN
Mnemonic name of an emulated 3860 controller.
In all SM2 output, two controller mnemonics are always output
(separated by a slash) for an emulated 3860 controller. The
following two variants are provided:
– alphanum-name 2..2
– x-text 4..4
SIZE
Size of the usable cache in the SYMMETRIX subsystem
READ
Number of read operations per emulated 3860 controller and per
second
RD HIT
Percentage of read operations completed by the cache in relation to
the total number of read operations
WRITE
Number of write operations per emulated 3860 controller and per
second
U3585-J-Z125-8-76
303
SYMMETRIX CONTROLLER report
SM2 reports
WR HIT
Percentage of write operations that did not need to be delayed (see
notes)
TOT HIT
Percentage of read and write operations completed by the cache in
relation to the total number of access operations executed
Notes
The monitored data output here refers to the controller as a whole, i.e. it includes access
operations from other hosts.
WR HIT:
All write operations are executed via the cache as fast writes. An exception are delayed
fast writes: if the cache is filled with unsaved write data, these may be forced to wait
temporarily for a cache slot to become available. A WR HIT is one write operation that
need not be delayed. Only very high write loads will cause the WR HIT rate to fall below
100%.
304
U3585-J-Z125-8-76
SM2 reports
SYMMETRIX DEVICE report
SYMMETRIX DEVICE report
This report provides monitored data on the use of caches in the devices of a SYMMETRIX
subsystem.
Report output
The SYMMETRIX DEVICE report is output only at the explicit request of the SM2 user with
the help of the SELECT-SYMMETRIX-CONTROLLER statement (see page 180). This
statement is used to output a SYMMETRIX CONTROLLER report together with a
SYMMETRIX DEVICE report for the selected controllers. The SYMMETRIX DEVICE report
supplies detailed information on the devices of a controller. It is possible to output data on
up to 16 controllers.
The report can only be output if the SM2 administrator has activated the monitoring process
using the statement START-MEASUREMENT-PROGRAM TYPE=*PCA.
Overflow screens may be requested for this report.
The monitored data output is sorted under the categories READ and WRITE.
D017ZE03 SM2 SYMMETRIX DEVICE
CYCLE:
60 S
CONTROLLER-MN: S6
99-03-24
11:11:02
/S7
| DEVICE | READ | RD HIT | WRITE | WR HIT |TOT HIT |
|
MN
| (1/S) | (%)
| (1/S) | (%)
| (%)
|
+--------+--------+--------+--------+--------+--------+
| 500D | 420.3 | 100.0 | 229.6 | 100.0 | 100.0 |
| 5001 |
0.0 |
0.0 |
0.0 |
0.0 |
0.0 |
| 5002 |
0.0 |
0.0 |
0.0 |
0.0 |
0.0 |
| 5003 |
0.0 |
0.0 |
0.0 |
0.0 |
0.0 |
| 5004 |
0.0 |
0.0 |
0.0 |
0.0 |
0.0 |
| 5005 |
0.0 |
0.0 |
0.0 |
0.0 |
0.0 |
| 5006 |
0.0 |
0.0 |
0.0 |
0.0 |
0.0 |
| 5007 |
0.0 |
0.0 |
0.0 |
0.0 |
0.0 |
| 5008 |
0.0 |
0.0 |
0.0 |
0.0 |
0.0 |
| 5009 |
0.0 |
0.0 |
0.0 |
0.0 |
0.0 |
| 500A |
0.0 |
0.0 |
0.0 |
0.0 |
0.0 |
| 500B |
0.0 |
0.0 |
0.0 |
0.0 |
0.0 |
| 500C |
0.0 |
0.0 |
0.0 |
0.0 |
0.0 |
| 5000 |
0.0 |
0.0 |
0.0 |
0.0 |
0.0 |
+--------+--------+--------+--------+--------+--------+
U3585-J-Z125-8-76
305
SYMMETRIX DEVICE report
SM2 reports
Monitoring information
CONTROLLER MN
Mnemonic name of an emulated 3860 controller.
In all SM2 output, two controller mnemonics are always output
(separated by a slash) for an emulated 3860 controller. The
following two variants are provided:
– alphanum-name 2..2
– x-text 4..4
DEVICE MN
Mnemonic name of the device
READ
Number of read operations per device and per second
RD HIT
Percentage of read operations completed by the cache in relation to
the total number of read operations
WRITE
Number of write operations per device and per second
WR HIT
Percentage of write operations that did not need to be delayed (see
notes)
TOT HIT
Percentage of read and write operations completed by the cache in
relation to the total number of access operations executed
Notes
The monitored data output here refers to the controller as a whole, i.e. it includes access
operations from other hosts.
WR HIT:
All write operations are executed via the cache as fast writes. An exception are delayed
fast writes: if the cache is filled with unsaved write data, these may be forced to wait
temporarily for a cache slot to become available. A WR HIT is one write operation that
need not be delayed. Only very high write loads will cause the WR HIT rate to fall below
100%.
306
U3585-J-Z125-8-76
SM2 reports
TCP/IP report
TCP/IP report
This report provides the IP and port numbers as well as data on input and output for each
TCP/IP connection.
Report output
The REPORT TCP statement is used to request the output of the TCP/IP report. The report
can only be output if the SM2 administrator has activated the monitoring process using the
statement START-MEASUREMENT-PROGRAM TYPE=*TCP-IP.
Overflow screens may be requested for this report.
The monitored data output is sorted in accordance with the total number of bytes sent and
received.
D016ZE04 SM2 TCP/IP
CYCLE:
LOCAL IP :139. 22. 16.164
1. REMOTE IP :139. 25.114. 14
REMOTE PORT: 1057
2.
:139. 25.113.253
REMOTE PORT: 1074
3.
:139. 25.105. 6
REMOTE PORT: 1054
4.
:139. 25.105.157
REMOTE PORT: 1092
5.
:139. 25.112.114
REMOTE PORT: 1120
1.
2.
3.
4.
5.
U3585-J-Z125-8-76
120 S
99-03-24
14:30:00
LOCAL PORT:
1400
LOCAL PORT:
1110
LOCAL PORT:
1110
LOCAL PORT:
1110
LOCAL PORT:
1110
INPUT
|
OUTPUT
TSDU(/S)| (KB/S) |BUF (KB)|WIN (KB)|TSDU(/S)| (KB/S) |BUF (KB)|WIN (KB)
--------+--------+--------+--------+--------+--------+--------+-------0.0 |
0.0 |
0.0 |
2.4 |
12.0 |
1.5 |
0.0 |
7.4
0.0 |
0.0 |
0.0 |
2.0 |
0.5 |
1.0 |
0.0 |
8.3
0.3 |
0.0 |
0.0 |
5.3 |
3.7 |
0.3 |
0.0 |
7.2
0.1 |
0.0 |
0.0 |
2.6 |
0.1 |
0.3 |
0.0 |
7.5
0.1 |
0.0 |
0.0 |
2.1 |
0.1 |
0.2 |
0.0 |
8.3
307
TCP/IP report
SM2 reports
Monitoring information
The individual entries have the following meanings:
LOCAL IP
IP address of the local host
REMOTE IP
IP address of the remote host
REMOTE PORT
Port number via which the application on the remote host communicates
LOCAL PORT
Port number via which the application on the local host communicates
INPUT
TSDU (/S)
Number of TSDUs received.
TSDUs (Transport Service Data Units) correspond to jobs of the
application on BCAM.
(KB/S)
Number of KB received
BUF (KB)
Cache space occupied by messages which have not yet been
retrieved
WIN (KB)
Last window size received from the partner
OUTPUT
TSDU (/S)
Number of TSDUs sent
TSDUs (Transport Service Data Units) correspond to jobs of the
application on BCAM.
(KB/S)
Number of KB sent
BUF (KB)
Cache space occupied by messages which have not yet been sent
or acknowledged
WIN (KB)
Last window size sent to the partner
Notes
308
–
The values for sent and received window sizes only apply for remote connections.
–
The values BUF and WIN merely reflect the status at the end of the monitoring cycle,
and do not represent mean values over the entire monitoring cycle.
U3585-J-Z125-8-76
SM2 reports
TLM report
TLM report
This report provides monitored data on the occupation of locks managed by the Task Lock
Manager (TLM).
Report output
The REPORT TLM statement is used to request the output of the TLM report.
The report can only be output if the SM2 administrator has activated the monitoring process
using the statement START-MEASUREMENT-PROGRAM TYPE=*TLM.
The monitored data output is sorted in accordance with OCCUPATIONS.
Only one screen is output.
D016ZE04 SM2 TLM
CYCLE:
120 S
SAMPLES:
293
99-03-24
14:30:00
+----------+---------------+---------------+
|
NAME
| WAITING TASKS | OCCUPATIONS |
+----------+---------------+---------------+
| LKSI089A |
0.00
|
100.0
|
| LKSI000G |
0.00
|
100.0
|
| LKSI000F |
0.00
|
100.0
|
| LKAL0174 |
0.00
|
6.1
|
| LKFT
|
0.00
|
5.8
|
| LKBV0174 |
0.00
|
4.7
|
| LKSDFSF |
0.00
|
2.7
|
| LKCMB091 |
0.00
|
2.3
|
| LKCMB060 |
0.00
|
2.3
|
| LKCMB009 |
0.00
|
1.3
|
| LKCMB031 |
0.00
|
1.3
|
| LKCMB025 |
0.00
|
1.0
|
| LKCMB013 |
0.00
|
0.6
|
| LKCMB065 |
0.00
|
0.6
|
| LKCMB074 |
0.00
|
0.6
|
| LKCMB004 |
0.00
|
0.6
|
+----------+---------------+---------------+
Monitoring information
NAME
Name of the monitored task lock (non-printable characters are
represented as blanks)
WAITING TASK
Mean number of tasks in the queue of the lock
OCCUPATIONS
Relative frequency with which the task lock is occupied (in percent)
U3585-J-Z125-8-76
309
UTM reports
SM2 reports
UTM reports
These reports output application-specific data to the screen. In the following description,
you should note that the terms used are the same as those used in UTM. This results in
some discrepancies compared with the terms used in the RESPONSETIME reports (e.g.
"transaction"). Please refer to the UTM manuals for an explanation of the terms used in
UTM.
The UTM report provides an overview of all UTM applications which supply data to SM2.
The decision as to whether a UTM application supplies data to SM2 is taken when the
application is generated and/or by means of a statement from the UTM administrator.
For further information, please refer to “UTM Monitored data on UTM applications” on
page 53 and the UTM manual “Generating and Administering Applications” [10].
The UTM APPLICATION report provides detailed information on a UTM application.
The figure below illustrates the hierarchy of reports and the statement used to request them:
UTM report
SELECT-UTM-APPLICATION
UTM APPLICATION report
310
U3585-J-Z125-8-76
SM2 reports
UTM report
UTM REPORT
This report provides monitored data on UTM applications.
Report output
The REPORT UTM statement is used to request the output of the UTM report.
The report can only be output if the SM2 administrator has activated the monitoring process
using the statement START-MEASUREMENT-PROGRAM TYPE=*UTM.
The UTM report contains only dialog-oriented monitored data. The data relating to
database calls and distributed processing (DDP) is averaged out for all the steps in a dialog,
even for those steps which contain no DB calls or distributed processing calls.
Overflow screens may also be requested for this report.
The monitored data output is sorted in accordance with the number of dialog steps
performed (#DS).
D016ZE04 SM2 UTM
CYCLE:
60 S
96-04-11
15:08:00
| APPLI- | M | TIME | DB |TAC-CL| DDP | # DS |#DB-CALL| # |
#
|
|
NAME
|
| (S/DS) | (%) | (%) | (%) | (1/S) | (1/DS) | TSK | USER |
+----------+---+--------+------+------+------+--------+--------+-----+-------+
| F2POOL
| S |
0.1 | 0.0 | 0.0 | 0.0 |
0.0 |
0.0 |
3 |
1 |
| PAHT
| S |
0.2 | 0.0 | 0.0 | 0.0 |
0.0 |
0.0 |
1 |
1 |
+----------+---+--------+------+------+------+--------+--------+-----+-------+
Monitoring information
APPLI-NAME
Name of the UTM application
M
Mode of the UTM application
S: UTM-S application
F: UTM-F application
TIME
Average total dwell time in seconds for a dialog step (DS) measured
by UTM as the time elapsed between UTM accepting a message
and sending a message
U3585-J-Z125-8-76
311
UTM report
SM2 reports
The following three values indicate average percentages of the total time shown under
TIME:
312
DB
Wait time in UTM for execution of database calls by database systems
TAC-CL
Wait time as a result of TAC class bottlenecks
DDP
Wait time in UTM for messages from remote applications (DDP = distributed data processing)
# DS
Number of dialog steps executed per second
#DB-CALL
Number of database calls executed per dialog step
# TSK
Number of tasks currently running for the application
# USER
Number of users currently signed on to the application
U3585-J-Z125-8-76
SM2 reports
UTM APPLICATION report
UTM APPLICATION report
This report provides detailed information on a UTM application.
Report output
The UTM APPLICATION report is output only at the explicit request of the SM2 user with
the help of the SELECT-UTM-APPLICATION statement (see page 182). This statement is
used to output a UTM report together with a UTM APPLICATION report for the selected
applications. The UTM APPLICATION report supplies detailed information on the UTM
applications.
It is possible to output data on up to 16 applications.
The report can only be output if the SM2 administrator has activated the monitoring process
using the statement START-MEASUREMENT-PROGRAM TYPE=*UTM.
Overflow screens may be requested for this report.
D016ZE04 SM2 UTM APPLICATION
APPL: F2POOL
JOBN: JOBUTM01
CYCLE:
60 S
99-04-11
UTM-VERS: V03.3A10
+-------------------------+--------+--------+
|
MEAN VALUE FOR | DIALOG | ASYNCH |
+-------------------------+--------+--------+
| TOTAL TIME
(S/RQ)|
0.1 |
0.0 |
| TOT TIME WITH DB (S/RQ)|
0.0 |
0.0 |
| STEPS WITH DB
(1/S)|
0.0 |
0.0 |
| TIME IN DB
(S/RQ)|
0.0 |
0.0 |
| # DB CALLS
(1/RQ)|
0.0 |
0.0 |
| CPU TIME IN DB
(MS/RQ)|
0.0 |
0.0 |
| # IO IN DB
(1/RQ)|
0.0 |
0.0 |
| TOT TIME WITH DDP (S/RQ)|
0.0 |
0.0 |
| STEPS WITH DDP
(1/S)|
0.0 |
0.0 |
| TIME IN DDP
(S/RQ)|
0.0 |
0.0 |
| CPU TIME
(MS/RQ)|
22.5 |
0.0 |
| # IO
(1/RQ)|
5.5 |
0.0 |
+-------------------------+--------+--------+
MODE: UTM-F
15:08:00
# DB‘S: 2
+--------------------+--------+
| # DIAL STEPS (1/S)|
0.0 |
| # DIAL TA‘S
(1/S)|
0.0 |
| # ASYN TA‘S
(1/S)|
0.0 |
| # ASYN CONV
(1/S)|
0.0 |
+--------------------+--------+
| # TASKS
|
3 |
| # MAX ASYN TASKS
|
2 |
| # CONNECTED USERS |
1 |
| # WAITING PRINTS
|
1 |
| # WAITING ATACS
|
0 |
| # WAITING DPUTS
|
14 |
| # DIALOG CURR CONV |
1 |
| # ASYN CURR CONV
|
0 |
| CACHE HIT RATE (%)|
86 |
| FREE PAGE POOL (%)|
4 |
| BOURSE WAIT T (MS)|
0 |
+--------------------+--------+
Monitoring information
APPL
Name of the UTM application
JOBN
BS2000 job name for the first task started for the UTM application
UTM-VERS
UTM version
MODE
UTM-S or UTM-F mode
U3585-J-Z125-8-76
313
UTM APPLICATION report
# DB’S
SM2 reports
Number of database systems the application works with
The following entries are all average values which refer to dialog steps (DIALOG) and
asynchronous conversations (ASYNCH). The descriptions of the entries use the term "step"
as a general term for both these items.
314
TOTAL TIME
For dialog steps: the total time for each dialog step from acceptance
of the entry by UTM to the sending of a dialog message by UTM
For asynchronous conversations: the total time for each
asynchronous conversation from the start of processing to the end
of processing (not including the wait time before the start of
processing)
TOT TIME WITH DB
Value analogous to TOTAL TIME, but only for steps with database
calls (*)
STEPS WITH DB
Number of steps per second with database calls
TIME IN DB
Time per step UTM waits for the execution of database calls (*)
# DB CALLS
Number of database calls per step (*)
CPU TIME IN DB
CPU time in milliseconds consumed per step in database systems
(*)(***)
# IO IN DB
Number of I/Os per step in the called database systems (*)(***)
TOT TIME WITH
DDP
Value analogous to TOTAL TIME, but only for steps with distributed
processing calls (**)
STEPS WITH DDP
Number of steps per second with distributed processing calls
TIME IN DDP
Time per step UTM waits for the arrival of a message from a remote
application (**)
CPU TIME
CPU time consumed by UTM for processing the step, including user
subroutines
# IO
Number of I/Os to/from UTM tasks which occur during processing
of the step, including user subroutines
(*)
Only those steps are included where database calls occur
(**)
Only those requests are included where distributed processing calls
occur
(***)
Not all database systems which coordinate with UTM supply these
values. Some database systems allow the database administrator
to activate the provision of monitoring data by issuing a statement.
For further details see the UTM manual “Concepts and Functions”
[11] and the relevant database system manuals.
U3585-J-Z125-8-76
SM2 reports
UTM APPLICATION report
The monitored data is set to zero for database systems which do not
supply any values. If several database systems are being used, and
only some of these provide monitoring data, this should be taken
into account when interpreting the average values.
The next four values show the application’s throughput (performance data).
# DIAL STEPS
Number of completed dialog steps per second
# DIAL TA’S
Number of completed dialog transactions per second
ASYN TA’S
Number of completed asynchronous transactions per second
ASYN CONV
Number of completed asynchronous conversations per second
The remaining values indicate the current status of the application.
# TASKS
Number of tasks running for the application
# MAX ASYN TASKS Maximum number of tasks available for asynchronous processing
# CONNECTED USERS
Number of users signed on to the application
# WAITING PRINTS
Number of print jobs waiting for execution
# WAITING ATACS
Number of jobs for asynchronous programs waiting for processing
# WAITING DPUTS
Number of time-driven jobs waiting (ATAC and output jobs)
# DIAL CURR CONV Number of open dialog conversations
# ASYN CURR CONV Number of open asynchronous conversations
CACHE HIT RATE
Hit rate in % when searching for a UTM page in the UTM cache
FREE PAGE POOL
Percentage of free pages in the UTM page pool
BOURSE WAIT T
Time in milliseconds a request waits in the job queue for a UTM
application. This value is approximated by generating an internal
test message.
Note
Asterisks (***) are output in place of invalid or unavailable monitoring data.
U3585-J-Z125-8-76
315
VM2000 report
SM2 reports
VM2000 report
This report provides monitored data for the individual virtual machines of a VM2000 system.
Report output
The REPORT VM statement is used to request the output of the VM2000 report. The report
can only be output if the SM2 administrator has activated the monitoring process using the
statement START-MEASUREMENT-PROGRAM TYPE=*V . The values for all VMs are only
output if SM2 is running on the monitor machine VM1. If this is not the case, only the values
for the VM on which SM2 is running are output
D016ZE04 SM2 VM
CYCLE:
120 S
99-03-29
11:14:01
HYPERVISOR:
IDLE: 33.2%
ACTIVE: 8.1%
NUMBER OF PHYS. CPU'S: 2
+-------+----------+-------------+-----------------------+------------+
| INDEX | NAME
| MAIN MEMORY |
CPU (%)
|
NUMBER
|
|
|
| SIZE (MB) | MAX
PLAN
MEAS | OF CPU'S |
+-------+----------+-------------+-------+-------+-------+------------+
|
2 | D016ZE04 |
1952 | 100.0 | 31.0 | 46.2 |
2 |
+-------+----------+-------------+-------+-------+-------+------------+
316
U3585-J-Z125-8-76
SM2 reports
VM2000 report
Monitoring information
On SR2000 (VM2000/SR V1.0A or later), some monitored data has a special significance
in the context of VM2000. This is indicated below with “SR2000”.
HYPERVISOR
IDLE
Percentage of ELAPSED TIME accounted for by IDLE time
SR2000:
Percentage of physically available CPUs which have been identified
as unused.
Unused CPUs are not assigned to any VM, are in the “detached”
state, or belong to an inactive VM.
ACTIVE
Percentage of ELAPSED TIME spent by the hypervisor in active
time
SR2000:
Percentage of active time of the hypervisor averaged out over all
CPUs
NUMBER OF PHYS. CPU’S
Number of physically available CPUs
INDEX
Index of the virtual machine
NAME
Name of the virtual machine
MAIN MEMORY SIZE (MB)
Main memory size of the virtual machine in megabytes
CPU MAX
Maximum percentage of CPU performance that can be accounted
for by individual virtual machines
SR2000:
Percentage of physically available CPUs that have been assigned
(NUMBER OF CPUs / NUMBER OF PHYS. CPUs)
CPU PLAN
Planned percentage of CPU performance that can be accounted for
by individual virtual machines
SR2000:
Percentage of physically available CPUs that have been assigned
(NUMBER OF CPUs / NUMBER OF PHYS. CPUs)
U3585-J-Z125-8-76
317
VM2000 report
SM2 reports
CPU MEAS
Percentage of ELAPSED TIME that can be accounted for by the
CPU time of the individual virtual machines. This value represents
the share of the entire system. Virtual machines which have not
used any CPU time during the monitoring cycle are not listed. Newly
started virtual machines are not recorded until the subsequent
monitoring cycle is completed.
SR2000:
The value output here must not exceed that output under “CPU
PLAN”, as the CPUs are assigned to guest systems.
NUMBER OF CPU’S
Number of CPUs assigned to the virtual machine
Note
ELAPSED TIME is the length of the SM2 monitoring cycle.
318
U3585-J-Z125-8-76
SM2 information screens
ACTIVE PARAMETER
5.2 SM2 information screens
ACTIVE PARAMETER
This screen displays the parameters set for the active monitoring programs. As many
screens as are necessary are output. If sufficient space is available, all the parameters for
one monitoring program are displayed on a single screen. It is only possible to request
output from the administration section using the SHOW-ACTIVE-PARAMETER statement.
D016ZE04 SM2 ACTIVE PARAMETER
99-03-24
14:20:59
BCAM CONNECTION PARAMETER
------------------------INWAIT-BUCKETS
: 5, 10, 100, 1000
REACT-BUCKETS
: 500, 1000, 2000, 4000
INPROC-BUCKETS
: 5, 10, 100, 1000
OUTPROC-BUCKETS
: 5, 10, 100, 1000
BCAM CONNECTION SET
SET-NAME
:
CONNECTION-TYPE
:
HOST-SELECTION
:
(LOCAL
/ PARTNER )
CONNECTION-SELECTION :
(LOCAL
/ PARTNER )
DIALOG
REMOTE
(*ANY
/ *ANY
*BY-NEA-NAME
($DIALOG / *ANY
PORT1110
REMOTE
)
)
(*ANY
/ *ANY
*BY-PORT-NUMBER
(
1110 / *ANY
)
)
CHANNEL-IO PARAMETER
-------------------CHANNELS
: *ALL
Monitoring information
BCAM-CONNECTION-PARAMETER
INWAIT-BUCKETS
Definition of the upper limits of up to four ranges in which the
INWAIT times are listed by order of magnitude
REACT-BUCKETS
Definition of the upper limits of up to four ranges in which the
REACT times are listed by order of magnitude
INPROC-BUCKETS
Definition of the upper limits of up to four ranges in which the
INPROC times are listed by order of magnitude
OUTPROCBUCKETS
U3585-J-Z125-8-76
Definition of the upper limits of up to four ranges in which the
OUTPROC times are listed by order of magnitude
319
ACTIVE PARAMETER
SM2 information screens
BCAM-CONNECTION-SET
SET-NAME
Name of the selected connection set
CONNECTION-TYPE Type of connected to be monitored (REMOTE, LOCAL or BOTH)
HOST-SELECTION
CONNECTIONSELECTION
Hosts between which the connections are established
Type of connection set (*BY-PORT-NUMBER or *BY-NEA-NAME)
and the selected port numbers or application names
CHANNEL-IO PARAMETER
CHANNELS
Channel addresses for the channels monitored
D016ZE04 SM2 ACTIVE PARAMETER
COSMOS PARAMETER
----------------TITLE
BUFFER-SIZE
NUMBER-OF-BUFFERS
ADDITIONAL-INFO
OUTPUT
99-03-24
14:20:59
: COSMOS
:
:
:
:
:
2
2
*CONFIGURATION
*DISK
:2OS6:$NNN.COSMOS.TEST
TASK-SELECTION
TSN
USER-ID
JOB-NAME
CATEGORY
TYPE
:
:
:
:
:
*NONE
*NONE
*NONE
*NONE
SYSTEM, BATCH, DIALOG, TP
EVENT-SELECTION
EIA-INTERRUPT-CLASS
: *ANY
Monitoring information
COSMOS PARAMETER
320
TITLE
Title of the COSMOS monitoring process
BUFFER-SIZE
Number of 4K pages per buffer
U3585-J-Z125-8-76
SM2 information screens
ACTIVE PARAMETER
NUMBER-OF-BUFFERS
Number of buffers
ADDITIONAL-INFO
Additional data to be included
OUTPUT
Way in which the COSMOS output files are to be written
TASK-SELECTION
Conditions on the basis of which the tasks are to be monitored
TSN
Selection by TSN
USER-ID
Selection by user ID
JOB-NAME
Selection by job name
CATEGORY
Selection by category
TYPE
Selection by task type
EVENT-SELECTION
Conditions on the basis of which the events are selected
EIA-INTERRUPT-CLASS
Selection of EIA events on the basis of the interrupt code
D016ZE04 SM2 ACTIVE PARAMETER
99-03-24
EIA-SVC-NUMBER
IO-DEVICE
DAB-CACHE-ID
MEMORY-CLASS
SLOT-MEMORY-CLASS
PEND-CODES
LOCK-ID
TLT-DESCRIPTOR
TSKI-SWITCH
TSVC-SVC-NUMBER
:
:
:
:
:
:
:
:
:
:
UNLOAD
MEASUREMENT-TIME
: AT-MEASUREMENT-PROGRAM-STOP
: *NOT-SPECIFIED
OPENED EVENT
: INIT, STAT, PTSK, CREA, DEST, MMRC, LGON
DISK PARAMETER
-------------DEVICES
: 430D, 4310, 4312, 4314, 434C, 4350
U3585-J-Z125-8-76
14:20:59
*ANY
*ANY
*ANY
*ANY
*ANY
*ANY
*ANY
*ANY
*ANY
*ANY
321
ACTIVE PARAMETER
SM2 information screens
Monitoring information
EIA-SVC-NUMBER
Selection of EIA events on the basis of the SVC number
IO-DEVICE
Selection of PMIO, SDV, CHTM and IONQ events on the basis of the
mnemonic device name
DAB-CACHE-ID
Selection of DAB events on the basis of the device VSN
MEMORY-CLASS
Selection of the REQM and RELM event on the basis of the memory
class
SLOT-MEMORY-CLASS
Selection of the SLOT event on the basis of the memory class
PEND-CODE
Selection of the PEND event on the basis of the pend code
LOCK-ID
Selection of the LOCK event on the basis of the lock ID
TLT-DESCRIPTOR
Selection of the TLT event on the basis of the TLT descriptor
TSKI-SWITCH
Selection of the TSKI event
TSVC-SVC-NUMBER
Selection of the TSVC events on the basis of the SVC numbers
UNLOAD
Time at which the COSMOS subsystem is to be unloaded
MEASUREMENTTIME
Timing of the monitoring process
OPENED EVENTS
Events opened for recording
DISK PARAMETER
DEVICES
322
Mnemonic device names of the monitored disk devices
U3585-J-Z125-8-76
SM2 information screens
ACTIVE PARAMETER
D016ZE04 SM2 ACTIVE PARAMETER
DISK-FILE PARAMETER
------------------DEVICES
FILE PARAMETER
-------------FILENAME
99-03-24
14:20:59
: 430D, 4310, 4312, 4314, 434C, 4350
: :2OSX:$TSOS.TSOSCAT
:2OSW:$TSOS.TSOSCAT
:2OS2:$TSOS.TSOSCAT
:2SO6:$TSOS.TSOSCAT
:2OS7:$TSOS.TSOSCAT
:2ORZ:$TSOS.TSOSCAT
:2OSQ:$TSOS.TSOSCAT
:2OSL:$TSOS.EQUISAMQ
:2OS6:$TSOS.SYSEAM
:2OSX:$TSOS.SYSEAM
:2OS2:$TSOS.SYSEAM
:2OS7:$TSOS.SYSEAM
:2OS6:$NNN.SM2.SAM.MANUAL.V13.0
Monitoring information
DISK-FILE PARAMETER
DEVICES
Mnemonic device names of the monitored disk devices
FILE PARAMETER
FILENAME
Name of the file whose access values are monitored
D016ZE04 SM2 ACTIVE PARAMETER
ISAM PARAMETER
-------------POOL-NAME (SCOPE)
: :2OSL:$SYS01 (*HOST
:2OSL:SESFPOOL(*HOST
99-03-24
14:20:59
),:2OSL:SRPMPOOL(TA=RP01
),:2OSL:SDFPOOLN(TA=7IY4
),
)
PERIODIC-TASK PARAMETER
----------------------USER-ID
: NNN, SD222222, TSOS, ZZZ
JOB-NAME
: *NONE
RESPONSETIME PARAMETER
---------------------SCOPE
:
DEFINITION
:
CONNECTION-NUMBER
:
RESPONSE-BUCKETS
:
THINKTIME-BUCKETS
:
TRANSACT-BUCKETS
:
WAITTIME-BUCKETS
:
U3585-J-Z125-8-76
(BUCKET,CATEGORY)
1
1024
5, 10, 20, 50, 100
50, 150, 300, 600, 1200
5, 10, 20, 50, 100
1, 2, 5, 10, 20
323
ACTIVE PARAMETER
SM2 information screens
Monitoring information
ISAM PARAMETER
POOL-NAME
Name of the monitored ISAM pool with the catalog ID of the public
volume set to which the ISAM pool is assigned
(SCOPE)
Defined type of the ISAM pool:
*HOST or UI=user-id or TA=tsn
PERIODIC-TASK PARAMETER
LOG TASKS
Tasks whose monitored data is to be written to the SM2 output file
Selected tasks are specified under the selection criteria
USER-ID
and
JOB-NAME
RESPONSETIME PARAMETER
SCOPE
Indicates whether the response time data has been recorded
according to buckets (BUCKET) or categories (CATEGORY)
DEFINITION
Definition of the type of response time monitored
CONNECTION-NUMBER
Maximum number of connections monitored
RESPONSE-BUCKETS
Definition of the upper limits of up to five ranges in which the
response times are stored by order of magnitude
THINKTIME-BUCKETS
Definition of the upper limits of up to five ranges in which the think
times are stored by order of magnitude
TRANSACT-BUCKETS
Definition of the upper limits of up to five ranges in which the transaction times are stored by order of magnitude
WAITTIME-BUCKETS
Definition of the upper limits of up to five ranges in which wait times
in the BCAM pool are stored by order of magnitude
324
U3585-J-Z125-8-76
SM2 information screens
ACTIVE PARAMETER
D016ZE04 SM2 ACTIVE PARAMETER
99-03-24
CONNECTION SET
SET-NAME
SET-DEFINITION
CONNECTION-TYPE
CONNECTION
(APPL,PARTNER,PROC)
:
:
:
:
*GLOBAL
BY-CONNECTION
REMOTE
(*ALL
,*ALL
,*ALL
DIALOG
BY-CONNECTION
REMOTE
)($DIALOG ,*ALL
CONNECTION SET
SET-NAME
SET-DEFINITION
CONNECTION-TYPE
CONNECTION
(APPL,PARTNER,PROC)
:
:
:
:
OMNIS
BY-CONNECTION
REMOTE
($OMNIS ,*ALL
,*ALL
)
14:20:59
,*ALL
)
SERVICETIME PARAMETER
--------------------DEVICES
: 430D, 4310, 4312, 4314, 434C, 4350
Monitoring information
CONNECTION-SET
SET-NAME
Name of the selected connection set
SET-DEFINITION
Type of connection set monitored (BY or EXCEPT)
CONNECTION-TYPE Type of connection monitored (REMOTE, LOCAL or BOTH)
CONNECTION
Selection of up to five connection groups
APPL
Name of the selected application
PARTNER
Name of the selected partner
PROC
Name of the selected partner computer
SERVICETIME PARAMETER
DEVICES
U3585-J-Z125-8-76
Mnemonic device names of the monitored devices
325
ACTIVE PARAMETER
SM2 information screens
D016ZE04 SM2 ACTIVE PARAMETER
SYSSTAT PARAMETER
----------------DEVICES
TASK PARAMETER
-------------TASK SELECTION
DEVICES
99-03-24
14:20:59
: 431C, 4310, 4330, 434B, 434C, 4350, 4354, 4361, 4363,
4370, 4379
: *ALL
: 430D, 4310, 4312, 4314, 434C, 4350
Monitoring information
SYSSTAT PARAMETER
DEVICES
Mnemonic device names of the monitored devices or *NONE, *ALL,
*TAPE or *DISK
TASK PARAMETER
TASK SELECTION
*ALL: All tasks are monitored.
Tasks whose monitored data is to be written to the SM2 output file.
Selected tasks are specified under the selection criterion TSN,
USER-ID, JOB-NAME, JOB-CLASS or TYPE.
DEVICES
Mnemonic device names monitored by the task monitoring program
for each task or *NONE, *ALL or *DISK
Note
If a selected monitoring program is not active, the message "MEASUREMENT NOT
ACTIVE" is displayed in place of the parameters.
326
U3585-J-Z125-8-76
SM2 information screens
DEFINED PARAMETER
DEFINED PARAMETER
This screen displays the parameters set for the defined monitoring programs. As many
screens as are necessary are output. If sufficient space is available, all the parameters for
one monitoring program are displayed on a single screen. It is only possible to request
output from the administration section using the SHOW-DEFINED-PARAMETER
statement. The layout of the screen is the same as the ACTIVE PARAMETER screen, with
the difference that the first line contains the header DEFINED PARAMETER.
Note
If no parameters are defined for a selected monitoring program, the message "NO
PARAMETERS DEFINED" is displayed in place of the parameters.
U3585-J-Z125-8-76
327
MEASUREMENT STATUS
SM2 information screens
MEASUREMENT STATUS
This screen provides the user with information on the current status of the measurement at
any time. Output to the terminal comprises three parts. The first two parts contain general
administration data and the third part provides information on the functions permitted and
on monitoring programs which have been defined and which are running.
In the analysis subinterval, output of the MEASUREMENT STATUS screen is requested by
means of the STATUS statement, and in the administration facility it is requested by means
of the SHOW-MEASUREMENT-STATUS statement.
D016ZE04 SM2 MEASUREMENT STATUS
99-03-24
14:25:00
TSN OF SM2 PRIMARY ADMINISTRATOR : 9V43
NUMBER OF PRIVILEGED SM2 USERS.. :
3
NUMBER OF NONPRIVILEGED SM2 USERS:
2
SM2 GATHERING TASK CREATED AT...
OFFLINE PERIOD..................
ONLINE PERIOD...................
SAMPLING PERIOD.................
SM2 LOGGING FILE................
: 99-03-17 13:42:03
:
240 S
:
120 S
:
400 MS
: :2OS6:$NNN.SM2.SAM.MANUAL.V13.0
SECONDARY ADMINISTRATOR ALLOWED.
USER MEASUREMENTS ALLOWED.......
USER MEASURED OBJECTS...........
PRIVILEGED MEASUREMENTS DEFINED.
FILE
ISAM
PERTSK RTIME
PRIVILEGED MEASUREMENTS ACTIVE..
D-FILE DLM
FILE
HSMS
PERTSK PFA
POSIX
RTIME
TLM
:
:
:
:
YES
FILE
FILES (
BCAM
SVTIME
: BCAM
ISAM
SVC
ISAM
TASK
0)
ISAM-POOLS
CHA-IO COSM+
SYSTEM TASK
CHA-IO CMS
MSCF
NDV
SVTIME SYSTEM
( 0)
DISK
DAB
NSM
TASK
TASKS ( 0)
D-FILE
DISK
PCA
TCPIP
General administration data
TSN OF SM2 PRIMARY ADMINISTRATOR
Task sequence number (TSN) of the SM2 primary administrator or,
if none exists yet, *NONE.
Note
In a host network, it is possible to perform administration from a
remote host. In this case, the host name is output after the TSN.
NUMBER OF PRIVILEGED SM2 USERS
Number of privileged users currently working with SM2 (including
the primary administrator)
328
U3585-J-Z125-8-76
SM2 information screens
MEASUREMENT STATUS
NUMBER OF NONPRIVILEGED SM2 USERS
Number of nonprivileged users currently working with SM2
Either
SM2 GATHERING TASK CREATED AT
Date (using the ISO format) and time the monitoring task was
created (provided the SM2 monitoring task is active)
or
SUBSYSTEM SM2 IN DELETE !!!
Subsystem SM2 in the DELETE state.
With this status, no further users are allowed to log on. Permission
for user-specific task monitoring is withdrawn. The SM2 output file
and user-specific SM2 output files are closed automatically.
Repeated attempts to open the file are rejected. Subsystem SM2
then terminates operations, after which the SM2 program also
terminates.
or
SM2 GATHERING TASK TERMINATED !!!
SM2 monitoring task terminated (due to error)
OFFLINE PERIOD
Length of the monitoring cycle for background monitoring (in
seconds).
ONLINE PERIOD
Length of the monitoring cycle for online analysis (in seconds). or
SAME AS OFFLINE: no separate monitoring cycle for online
analysis exists.
SAMPLING PERIOD Length of the sampling period in milliseconds.
SM2 LOGGING FILE
*NONE if no SM2 output file is defined
or
*OPEN if an SM2 output file is open
(output for nonprivileged users)
or
name of the open SM2 output file
(output for privileged users)
U3585-J-Z125-8-76
329
MEASUREMENT STATUS
SM2 information screens
Status data on additional functions
SECONDARY ADMINISTRATOR ALLOWED:
YES: The primary administrator has permitted other SM2 administrators
NO: Parallel SM2 administration is not permitted
USER MEASUREMENTS ALLOWED
List of the user monitoring programs permitted. Each user sees
precisely those user monitoring programs he/she is allowed to use.
The following entries are possible: FILE, ISAM, TASK.
USER MEASURED OBJECTS
The total number of monitored objects is output for each permitted
user monitoring program. If this number is zero, the corresponding
user monitoring program is permitted (for some or all users), but
nobody has yet activated an object.
The following entries are possible: FILES, ISAM-POOLS, TASKS.
PRIVILEGED MEASUREMENTS DEFINED
List of monitoring programs defined.
The following entries are possible: BCAM, CHA-IO, COSM, DISK,
D-FILE, FILE, ISAM, PERTSK, RTIME, SVTIME, SYSTEM, TASK.
PRIVILEGED MEASUREMENTS ACTIVE
List of active monitoring programs.
The following entries are possible: BCAM, CHA-IO, CMS, COSM,
DAB, DISK, D-FILE, DLM, FILE, GS, GSVOL, HSMS, ISAM, MSCF,
NDV, NSM, PCA, PERTSK, PFA, POSIX, RTIME, SVC, SVTIME,
SYSTEM, TASK, TCPIP, TLM, UTM, VM.
330
U3585-J-Z125-8-76
SM2 information screens
MEASUREMENT STATUS
Meaning of abbreviations for the monitoring programs:
BCAM
CHA-IO
CMS
COSM+
DAB
D-FILE
DISK
DLM
FILE
GS
GSVOL
HSMS
ISAM
MSCF
NDV
NSM
PCA
PERTSK
PFA
POSIX
RTIME
SVC
SVTIME
SYSTEM
TASK
TCPIP
TLM
UTM
VM
BCAM-CONNECTION monitoring program
CHANNEL-IO monitoring program
CMS monitoring program
COSMOS (“+” means that COSMOS has been initialized but not
started)
DAB monitoring program
DISK-FILE monitoring program
DISK monitoring program
DLM monitoring program
FILE monitoring program (privileged users)
GS monitoring program
GSVOL monitoring program
HSMS monitoring program
ISAM monitoring program (privileged users)
MSCF monitoring program
NET-DEVICE monitoring program
NSM monitoring program
PCA monitoring program
PERIODIC-TASK monitoring program
PFA monitoring program
POSIX monitoring program
RESPONSETIME monitoring program
SVC monitoring program
SERVICETIME monitoring program
SYSSTAT monitoring program
TASK monitoring program
TCP-IP monitoring program
TLM monitoring program
UTM monitoring program
VM2000 monitoring program
Table 8: Abbreviations for monitoring programs
If a monitoring program is followed by an asterisk (e.g. PCA*), this means that the
monitoring program is active as far as SM2 is concerned, but that the corresponding
subsystem is currently not supplying any data (e.g. because it has not been started).
U3585-J-Z125-8-76
331
SELECTED HOSTS
SM2 information screens
SELECTED HOSTS
This screen displays the hosts which were selected by means of the SELECT-HOSTS
statement.
The output can only be requested in the administration facility using the
SHOW-SELECTED-HOSTS statement.
D016ZE04 SM2 SELECTED HOSTS
99-03-24
HOST-NAME
PROCESSOR-NAME
LAST BUFFER
*LOCAL
D016ZE02
D016ZE07
D016ZE04
D016ZE02
D016ZE07
14:28:00
14:29:00
14:29:00
14:29:30
Information on the selected hosts
HOST-NAME
Name of the host
PROCESSOR-NAME Processor name from the point of view of the local host
(for information on host and processor names, see the note in the
description of the SELECT-HOSTS statement on page 110)
LAST BUFFER
Time stamp of the last monitoring data called; this time stamp is
identical to the time in the top right-hand corner of the reports
RSLT NOT VALID means that no (up-to-date) data is available.
Possible reasons:
– No data has been requested.
– Data has been requested but not transferred because the
monitoring cycle on the addressed host was not yet terminated
or the transfer was unsuccessful.
332
U3585-J-Z125-8-76
SM2 information screens
STATUS TABLE
STATUS TABLE
No monitoring data is output in the STATUS TABLE.
Output to the terminal comprises two parts. The first part provides the user with information
on which SM2 tasks exist and on the status of the subsystems used by SM2. The line
containing "MISSED RECORDS" is only output if unwritten records exist.
The second part outputs as many of the most recent trace entries as can be accommodated
on one screen.
The SHOW-SM2-STATUS statement is used to request the output of the STATUS TABLE.
This statement is only available to privileged users in the administration facility.
D016ZE07 SM2 STATUS TABLE
TASK / SS
99-03-24
START
TIME
STATUS
GATHERER
WRITE-TASK
USER-WRITE-TASK
1999-03-24
1999-03-24
1999-03-24
07:25:00
07:25:07
07:25:18
RUNNING
RUNNING
RUNNING
BCAM-SM2
MSCF
DLM
NSM
1999-03-24
1999-03-24
1999-03-24
1999-03-24
07:25:19
07:25:19
07:25:19
07:25:19
IN
IN
IN
IN
LAST TRACED EVENTS
CUR#
TIME
8
7
6
5
4
3
2
07:25:19
07:25:19
07:25:19
07:25:19
07:25:18
07:25:07
07:25:00
END
19:02:55
TIME
USE
USE
USE
USE
TSN
REASON
TYPE
MODUL
ID
CODE
SM2G
SM2G
SM2G
SM2G
SM2U
SM2W
SM2G
NSM-STA
DLM-STA
MSC-STA
BCM-STA
CREATE
CREATE
CREATE
SS
SS
SS
SS
TASK
TASK
TASK
NSM
DLM
MSCF
DSSM
UDM
GDM
GAT4
0000
0100
0100
0000
0000
0000
0000
00000000
00000000
00000000
00000000
00000000
00000000
00000000
Monitoring information
TASK / SS
Name of the task or subsystem
START TIME
Date (in ISO4 format) and time at which the task or subsystem was
created
STATUS
Status of the task or subsystem
U3585-J-Z125-8-76
333
STATUS TABLE
SM2 information screens
Meanings of the entries for tasks:
RUNNING:
Task running normally
ENDED:
Task terminated normally
ABENDED:
Task terminated abnormally
Meanings of the entries for subsystems:
IN USE:
SM2 is working with the subsystem
UNAVAIL:
SM2 requires data from the subsystem, but the subsystem is not
running
UNUSED:
SM2 is no longer working with the subsystem (of its own accord)
ABENDED:
SM2 is no longer working with the subsystem because the
subsystem is no longer running
STOPPED:
SM2 has unloaded the subsystem
END TIME
Date (in ISO4 format) and time at which the task was terminated or
at which the subsystem stopped being used
MISSED RECORDS
This information is omitted if SUM = 0.
SUM:
Total number of unwritten records (in the current SM2 output file)
LAST INTERVAL:
Unwritten records in the last cycle
LAST TRACED EVENTS
334
CUR#
Number of the trace entry (descending)
TIME
Time of the trace entry
TSN
TSN of the task in which a trace entry was written. The SM2 system
tasks have the following default TSNs:
GATHERER:
SM2G
WRITE-TASK:
SM2W
USER-WRITE-TASK: SM2U
U3585-J-Z125-8-76
SM2 information screens
STATUS TABLE
REASON
Reason for the trace entry. In many cases (with TYPE=S-ER) this is
the name of the system function which reported an error.
CREATE:
Creation of task
TERM:
Termination of task
Subsystem-STA:
Start of subsystem use
Subsystem-STO: End of subsystem use
Subsystem-NLD: Subsystem not loaded
TYPE
I-ER:
Internal error
(internal error during execution of SM2)
S-ER:
System error
(error calling a BS2000 system function)
TASK:
Task event
(start/end/crash of an SM2 task)
SS:
Subsystem event (start/end of subsystem use by SM2)
MODUL
Abbreviated name of the SM2 module writing the trace entry
(without "NPS", "NPFS")
ID
Identifies the location at which the error occurred. In many cases
this is the offset within the module. If the error is unique within the
module, this field contains no entry.
CODE
Return code of the system function called (for TYPE=S-ER) or
additional information (for TYPE=I-ER) or zero
Note
The trace entries (particularly those with TYPE=I-ER,S-ER) are only relevant for SM2.
U3585-J-Z125-8-76
335
USER MEASURED OBJECTS
SM2 information screens
USER MEASURED OBJECTS
This screen displays the parameters set for the monitoring programs defined by the user.
As many screens as are necessary are output. If sufficient space is available, all the parameters for one monitoring program are displayed on a single screen. In the analysis section,
only the parameters for the user task statistics are displayed, together with the objects users
have activated for themselves.
The SHOW-USER-MEASURED-OBJECTS statement is used to request the output of this
screen.
D016ZE04 SM2 USER MEASURED OBJECTS
FILE PARAMETER
-------------FILENAME
BY TASK
: :2OS6:$NNN.LIB.TOPAS.130
: 9S37
ISAM PARAMETER
-------------POOL
BY TASK
: :2OSL:SDFPOOLN(TA=9S37
: 9S37
TASK PARAMETER
-------------MEASURED TSN
MEASURED USER-ID
MEASURING TSN
MEASURING USER-ID
PC-INTERVAL
SVC-STATISTICS
:
:
:
:
:
:
99-03-24
19:10:57
)
9S37
NNN
9S37
NNN
10
ON
Monitoring information
FILE PARAMETER
FILENAME
Name of the file for which access values are to be monitored
BY TASK
Task sequence number of the tasks monitoring the file
ISAM PARAMETER
336
POOL
Name of the ISAM pool being monitored
BY TASK
Task sequence number of the tasks monitoring the ISAM pool
U3585-J-Z125-8-76
SM2 information screens
USER MEASURED OBJECTS
TASK PARAMETER
MEASURED TSN
TSN of the task being monitored
MEASURED USER-ID
User ID of the task being monitored
MEASURING TSN
TSN of the task which initiated monitoring
MEASURING USER-ID
User ID of the task which initiated monitoring
PC-INTERVAL
Sampling cycle for program counter statistics in milliseconds, or 0 if
the program counter statistics are not activated.
SVC-STATISTICS
Indicates whether SVC statistics are activated (ON) or deactivated
(OFF).
Note
If no objects have been defined for a selected monitoring program, the message "NO
OBJECTS DEFINED" is issued in place of the parameters. If the user is not authorized
for monitoring or if the monitoring is not permitted for this user, the message
"MEASUREMENT NOT ALLOWED" is issued in place of the parameters.
U3585-J-Z125-8-76
337
Eine Dokuschablone von Frank Flachenecker
by f.f. 1992
6 Notes on SM2 operation
6.1 System resource utilization by SM2
To perform monitoring, SM2 must use the resources of the system to be monitored. This
section provides an overview of SM2 resources requirements and information on assessing
and restricting the induced system utilization.
With regard to system utilization, only the following basic resources are considered:
–
–
–
external storage
CPU
main memory
During monitoring, only the resources utilized by the monitoring task are analyzed (i.e.
without considering any parallel SM2 user programs), this being the way SM2 is most
usually operated.
6.1.1 External storage utilization
The disk storage space requirements for SM2 output files can be restricted by:
–
appropriate organizational measures (e.g. transfer of old SM2 output files to tape and
creation of a new SM2 output file for each monitoring task)
–
modifying SM2 parameters (e.g. specification of the monitoring cycle with the
OFFLINE-PERIOD operand)
–
specifying the monitoring programs to be activated
–
compressing the output files with the SM2U1 statement SET-COMPRESSION
U3585-J-Z125-8-76
339
System resource utilization
Notes on SM2 operation
6.1.2 CPU utilization
To facilitate understanding of the factors affecting CPU utilization, readers should be familiar
with the monitoring methods (see section “Acquisition of monitored data” on page 15).
Method based on monitoring cycle
At the end of the monitoring cycle, the measured values of the previous monitoring cycle
are calculated for all monitoring programs (with the exception of DISK and TASK). In
contrast to the sample cycle, the monitoring cycle is so much longer that system utilization
by this method based can be disregarded.
Method based on samples
A monitoring task routine is activated at specific intervals (see the SAMPLING-PERIOD
operand of the MODIFY-MEASUREMENT-PERIODS statement) to take samples.
For each activation of the sampling routine, a basic load has to be processed, regardless
of the variables (devices and tasks) to be monitored.
In addition to this basic load, further instructions are processed which depend on the
number of objects to be monitored (devices, channels, tasks).
If this number remains constant in the monitoring cycle, CPU utilization is almost directly
proportional to the sampling rate (i.e. halving the sampling cycle, for example, causes the
induced system load to be doubled).
Lengthening the sampling cycle should be balanced by lengthening the monitoring cycle to
prevent a deterioration in sampling precision.
The sample-driven method is used for device and channel utilization, the length of queues,
and the monitoring programs CMS and TLM.
Method based on events
When this method is used, the monitor is the “passive” component in contrast to the other
system components, which are “active”. When specific events occur in the system (e.g.
starting of an I/O operation), specific monitoring programs are activated which collect the
relevant data (e.g. which device, which task, etc.).
While the monitor is inactive, no system utilization is induced.
If, however, events occur which are to be monitored, utilization increases in proportion to
the load (i.e. to the number of calls).
When this monitoring method is used, the system load can be reduced only by reducing the
number of objects to be monitored.
340
U3585-J-Z125-8-76
Notes on SM2 operation
System resource utilization
The event-driven method is used by the monitoring programs CHANNEL-IO, DISK, DISKFILE, ISAM, NET-DEVICE, PERIODIC-TASK, RESPONSETIME, SERVICETIME,
SYSSTAT and TASK, as well as for user task statistics.
UTM monitoring program
If UTM applications are running on the system and these applications provide data for SM2,
the following additional load occurs in each UTM task: an additional 500 instructions
(approx.) are required at the end of each dialog step and each asynchronous conversation
in order to provide this data. For a typical application, this amounts to considerably less than
1% of the entire processing volume.
The resulting additional load on the system thus depends on the throughput in the applications, but can generally be ignored.
If values are also provided from the database systems, an additional load arises in these
database systems in order to capture the monitored data. This load depends on the
database system itself and the version used. For this reason, no general rule can be given.
Write task and I/O buffer
SM2 creates a write task (system task with TSN=SM2W) for writing to the SM2 output file.
This task exists only from OPEN to CLOSE and is activated only when an I/O buffer is full.
The input/output operation is controlled by the write task, and the CPU is required for task
execution (CPU time for TPR and SIH states). The CPU time required for writing to the I/O
buffer is assigned not to the write task but to the initiating task (system task or SIH
processor state).
The data rate for writing to the I/O buffer depends on whether the record is written
–
–
–
by the monitoring task at the end of a monitoring cycle,
by another task, or
in the SIH processor state
In the first case, the data rate depends on the number of active monitoring programs (data
records) and monitored objects, as well as the duration of the monitoring cycle (OFFLINEPERIOD operand in the MODIFY-MEASUREMENT-PERIODS statement). If the same data
records remain active during monitoring, the workload is inversely proportional to the
duration of the monitoring cycle. The second and third cases only apply to the monitoring
programs TASK and DISK.
U3585-J-Z125-8-76
341
System resource utilization
Notes on SM2 operation
User task statistics
The system load caused by the activation of user task statistics by the BS2000 user with
the aid of the /START-TASK-MEASUREMENT command is mainly the result of program
counter statistics and SVC statistics.
Program counter statistics
The system load caused by program counter statistics depends on the following factors:
–
–
the sampling cycle selected
the number of tasks monitored
6.1.3 Main memory utilization
SM2 requires storage space for its code and for tables and I/O buffers.
The subsystems for the monitoring programs RESPONSETIME and UTM are loaded
subsequently if required.
Some system modules are resident, others are paging modules. The size of the tables
depends on the number of objects to be monitored.
342
U3585-J-Z125-8-76
Notes on SM2 operation
Accuracy of the SM2 data
6.2 Accuracy of the SM2 data
This section indicates the major factors affecting the accuracy of the data supplied by SM2
or SM2R1. The accuracy of some particularly important variables is also discussed.
Inaccuracies resulting from rounding problems are not considered here.
6.2.1 Causes of inaccuracies
Like all software monitors, SM2 runs under the system to be monitored and thus requires
certain resources for its own operation; therefore, strictly speaking, it modifies the system
to be monitored. However, this influence is small and can generally be disregarded. For a
description of system utilization, see section 7.1.
Inaccuracies resulting from marginal problems
Ideally, the SM2 activities during monitoring activation and deactivation, during the taking
of samples and at the end of a monitoring cycle operand, should take no time at all. This
being impossible, certain inaccuracies result. However, this effect is minimal and decreases
in direct proportion to the number of actions that have to be performed at any given time
(small number of tasks, devices etc. to be monitored).
Inaccuracies resulting from classification
Some SM2 values are gathered on a system-global basis, on a category-specific basis,
and/or on a task-specific basis. For category-specific data, SM2 uses the category
assignment that is valid at the time the data is collected (sample or event). However, SM2
does not recognize category switches for the TASK monitoring program. This is why
comparisons between task data accumulated by category and category-specific SM2 data
may lead to interpretation errors.
U3585-J-Z125-8-76
343
Accuracy of the SM2 data
Notes on SM2 operation
Monitoring method inaccuracies
Different inaccuracies can occur depending on the monitoring method used:
1. Event-driven monitoring method
This method supplies very precise data at the cost of increased system workload.
Problems can occur only when the duration of events is monitored.
Monitoring cycle
Monitoring cycle
....
Duration
As shown above, the duration of an event (and, if applicable, an activity count) is
assigned to the second monitoring cycle even though part of it should be assigned to
the first cycle. The relative magnitude of the monitoring error decreases in inverse
proportion to the length of the monitoring cycle.
2. Sample-driven monitoring method
The accuracy of this monitoring method is subject to the laws of statistics.
A requirement for the validity of the monitored data is that the samples are independent
of the monitored events. SM2 uses the system timers to control sampling by having
itself activated at regular intervals.
Hardware interrupts are used for this purpose. However, such an interrupt is not
permitted whenever the CPU is in a non-interruptible state. This results in a sampling
delay and thus in a certain dependency on system events.
Certain unavoidable system activities cause further delays between interrupt acceptance and sampling by SM2. If statistical independence of the samples is assumed, the
accuracy of the monitored data depends on the number of samples.
An assessment of the accuracy can be obtained by using confidence intervals (e.g.
deviation of not more than 1% in 99% of all cases).
It should be noted that a high sampling rate increases the system workload. Therefore,
a long monitoring cycle is preferable to excessively frequent sampling.
344
U3585-J-Z125-8-76
Notes on SM2 operation
Accuracy of the SM2 data
6.2.2 Notes on particular variables
CPU utilization
The term “percentage deviation” used in the following always denotes the absolute
deviation, in other words:
X and Y have a deviation of P if abs (X-Y) ≤ P.
TU/TPR/SIH time, IDLE time, or /390 time with SR2000.
The operating system uses timers to determine three time components: the total for TU and
TPR times, the SIH time and the IDLE time. In the case of SR2000, the /390 time is also
determined as a fourth time component. Consequently, falsifications due to the non-interruptible SIH code cannot occur. Investigations have shown that this timer is sufficiently
precise for realistic monitoring cycles. As a rule, comparative measurements made with
hardware monitors under typical load conditions have shown deviations of less than 1%.
SM2 divides the total for TU and TPR times into separate values for the TU time and the
TPR time on the basis of samples taken during the sampling period. The accuracy of this
procedure depends on the number of samples, which means that large deviations are
possible if few samples are taken. The /390 time is also affected by this inaccuracy, because
it is output as a relative proportion of TU.
Device utilization
As regards the hardware, the device is busy from the time an I/O request is received until
data transfer terminates. As regards the software, the device is busy from the time an I/O
request arrives in the I/O system module until channel termination.
The values determined by the software monitor should therefore always be higher than the
actual device utilization. However, this systematic monitoring error is virtually balanced out
by the sampling delays caused primarily by the non-interruptible system states.
Comparative measurements with hardware monitors for typical load conditions and about
6000 samples have shown that the maximum deviation is ± 2%.
Channel utilization
SM2 uses a special machine instruction to determine whether a channel is active or not.
Thus there are no deviations between hardware and software monitors in the interpretation
of this condition (see also restrictions on the ability of monitoring the channel load,
description of the CHANNEL report). The sampling delays caused primarily by non-interruptible system states result in the values determined by SM2 always being smaller than
the actual values. Comparative measurements with a hardware monitor for typical load
conditions and about 6000 samples have shown that the deviation is less than 2%.
U3585-J-Z125-8-76
345
Accuracy of the SM2 data
Notes on SM2 operation
6.2.3 Measures for reducing the error sources
From the above explanations, the following recommendations can be deduced; they should
be observed if high importance is placed on the accuracy of the data.
1. Minimization of marginal problems
The monitoring cycles should be long but not too long. Short-term peak loads will not
be detected if the monitoring cycles are too long because SM2R1 only supplies the total
activity or the average value for the whole monitoring cycle.
All desired monitoring functions should be activated before (not during) the monitoring
cycle.
Similarly, the desired monitoring functions should be kept active somewhat longer than
the monitoring cycle. For later analysis with SM2R1 the desired monitoring cycle should
be specified as the analysis period.
2. Reduction of the number of objects to be monitored
This reduces the induced system workload, which results in less falsification of the
monitored system.
3. Sufficiently large number of samples
As a rule, this should be implemented not by increasing the sampling rate but by lengthening the monitoring cycle. The sampling rate should be increased only if the system
workload permits or if it is not possible to lengthen the monitoring cycle.
346
U3585-J-Z125-8-76
Notes on SM2 operation
Special applications (VM2000)
6.3 Special applications
6.3.1 SM2 together with VM2000
If monitoring is executed under VM2000 control within BS2000 systems, the following
special considerations are applicable for the implementation of the SM2 program and for
the interpretation of the monitored data:
–
Generally speaking, SM2 is executable under any guest system and provides
monitored data relevant to the respective local guest system.
–
The sum TU + TPR + SIH + IDLE is relativized in every guest system to 100% in the
ACTIVITY report, PERIODIC-TASK report, CPU report (NORMED column), and
SM2R1 report 1.
The result of this relativation is the manual formation of the sums of the percentage load
for all guest systems, not the total CPU utilization.
–
In the SM2R1 report 2 and the CPU report (MEASURED column), the non-relativized
values for TU, TPR, SIH and IDLE are shown, i.e. the real load values determined by
the relevant guest systems.
Under VM2000/SR, the real CPUs are assigned exclusively to the guest system, i.e. the
non-relativized values for TU, TRP, SIH, and IDLE correspond to the relativized values.
The time components of CPU utilization in the CPU report (MEASURED column)
cannot be compared with the data in the VM2000 report (CPU MEAS). The data in the
CPU report relate to the assigned CPUs of the VM, while the utilization values in the
VM2000 report relate to the physically available CPUs.
–
The values in SM2R1 reports 62 and 60 are also not relativized! In this case the real
CPU times (TU + TPR) or the time equivalent of the CPU time will be listed for the local
guest system and for each category.
–
The CPU time given in the task statistics report is likewise the real CPU time consumed
by a task in processor states TU + TPR.
–
A summary of the overall CPU utilization, distribution of the CPU capacity among the
individual guest systems, and the CPU time used by the individual guest systems is
represented for the SM2 which is brought to execution on the privileged machine (VM1).
(See also VM2000 report or SM2R1 report 98 and 99.)
–
If SM2 is running on a normal guest system, only the values relevant to this guest
system are identified in the VM2000 report or SM2R1 report 98.
The channel utilization is an exception, as the overall utilization is always output here.
–
For information on the accuracy of the TU and TPR times, see “Notes on particular
variables” on page 345.
U3585-J-Z125-8-76
347
Special applications (VM2000)
Notes on SM2 operation
Note
The corresponding values can also be output by using the VM2000 command SHOWVM-STATUS (see the “VM2000” manual [9]).
VM2000 operation on /390 architecture
The overall CPU utilization is determined by taking the HYPERVISOR-IDLE value and
extrapolating the difference to 100%.
The IDLE value given by the SM2 monitoring program loses its original meaning, in which
case it merely acts as an indicator of the percentage for a given time period, one during
which the respective guest system was inactive of its own volition.
Example:
–
2 guest systems, VM1 and VM2
Each guest system is to be active for 50 s within the time period of 100 s.
Ideal situation: No idling occurs
VM1
SM2-Idle=50 %
Hypervisor-Idle=0 %
VM2
–
SM2-Idle=50 %
Realistic case: idling does occur for half of the required active period (***)
VM1
*****
SM2-Idle=33 %
Hypervisor-Idle=0 %
VM2
*****
SM2-Idle=33 %
The SM2 idle value of 33% is explained by the fact that SM2 precisely monitors the active
time (50 s), adds the voluntary inactive time (reduced to 25 s as the result of idling), and
relativizes it to 100%.
348
U3585-J-Z125-8-76
Notes on SM2 operation
Special applications (VM2000)
Even if system utilization is 100% (Hypervisor-Idle=0%), it makes sense for SM2 to provide
an IDLE value for the following reasons:
Full utilization of system load can be the result of a low-priority guest system which has
highly intense CPU time (in the extreme case: CPU loop), the system always obtaining
control as soon as the other guest systems voluntarily revert to IDLE mode.
The SM2 IDLE value permits the operator of a high-priority guest system to estimate the
extent to which additional load can be utilized. In this case the lower-priority system is idle
to the appropriate degree specified.
The general rule is: dilation resulting from other guest systems is always included in all SM2
monitoring values formed by the difference between two time values. This includes the
following monitoring information:
–
–
–
–
–
all I/O times for the monitoring programs DISK, TASK, SYSSTAT and FILE
response times for the monitoring program RESPONSETIME
catalog access times for the monitoring program CMS
QUEUE values in the task statistics
QUEUE values for queues Q1 to Q13 for the QUEUE-TRANSITION operand
Q0 (CPU-QUEUE) is without dilation, as the real CPU requirements from the product TU +
TPR are output!
The monitoring values supplied by the SERVICETIME monitoring program for systems
which use DCS, namely the values
–
–
–
DEVICE DISCONNECT TIME
DEVICE CONNECT TIME
FUNCTION PENDING TIME
represent the real hardware times (determined by DMS) without dilation by other guest
systems. Dilation of I/O times is reflected in the (REMAINING) SERVICETIME value.
All SM2 monitored data with “per second” (1/s) units refers to the elapsed time, and not to
the time assigned by the hypervisor for a guest system. As a result, the values determined
are less than those which actually occur during the time the guest system was active (for
example I/Os/sec. per disk, paging rate).
Disk utilization is determined by the sampling method while the corresponding guest
system is still active, in other words the values are not corrupted by other guest systems (in
contrast, the number of I/O operations does not refer to the active time per second, rather
to the seconds elapsed, and therefore the value appears to be lower).
In the case of the channel utilization values, the overall utilization per channel is output. The
percentage load caused by any one guest system cannot be determined here; as a consequence the NON OVERLAP value (CPU and CHANNEL simultaneously active) has no
significance when an individual guest system is involved.
U3585-J-Z125-8-76
349
Special applications (VM2000)
Notes on SM2 operation
In the case of the CHANNEL-IO monitoring program, the values supplied (e.g. the I/O
operations per channel) always refer to the respective guest system. Correlation of these
values on channel utilization is not possible, due to the above-mentioned restriction.
For CPUs with DCS, the SERVICETIME monitoring program can only be started by one
guest system. Any attempt to activate this function from a second guest system is accepted
without an error message, but no DCS-specific monitored data will be supplied.
The VM2000 command /SHOW-VM-RESOURCES INFORMATION=*STD/*ALL can be
used to check whether SERVICETIME monitoring is already active in a guest system. If it
is, message VMS2035 is output. In the case of SHARED-DEVICES under VM2000
(TYPE=*STD), DCS-specific monitoring values are generally not supplied by any guest
system (see also the “VM2000” manual [9]).
VM2000 operation on RISC architecture (VM2000/SR)
The real CPUs are assigned exclusively to the guest systems under VM2000/SR.
The CPU MAX and CPU PLAN values output in the VM2000 report therefore correspond
with the relationship of the assigned CPUs to the total number of physical CPUs in the
VM2000/SR system (NUMBER OF CPU’S / NUMBER OF PHYS. CPU’S).
Due to the exclusive assignment of CPUs, the CPU MEAS value corresponds to the utilization of the guest system, apart from the active times of the hypervisor and the
asynchronous firmware activities.
The active times of the hypervisor are contained in the HYPERVISOR ACTIVE value, while
the times for asynchronous firmware activities are contained in the CPU MEAS value.
The IDLE value corresponds to the relationship of unused CPUs to physically available
CPUs.
The HYPERVISOR ACTIVE value corresponds to the average value of active times of the
hypervisor over all CPUs.
In contrast to the VM2000 report, the active times of the hypervisor in the CPU/ACTIVITY
report are contained in the respective interrupted processor states (TU, TPR, SIH or IDLE).
The asynchronous firmware activities are likewise contained in the interrupted processor
states (TU, TPR, SIH or IDLE).
Asynchronous firmware or hypervisor activities may have been caused by a remote guest
system (e.g. when processing asynchronous I/O events of shared disks).
In the case of SM2 monitoring values formed by the difference between two time values,
there is no direct dilation by other guest systems under VM2000/SR. However, minimal
dilation by the hypervisor activities and asynchronous firmware activities is unavoidable.
350
U3585-J-Z125-8-76
Notes on SM2 operation
Special applications (VM2000)
6.3.2 VOLUME load with installed DRV
The product DRV (Dual Recording by Volume) can be used to keep double copies of disk
drives in the form of mirror images. This increases the availability factor for data stored on
the disks. Each write request made by DMS is sent to both disks, and each read request is
executed on the disk with the shortest access time available (shortest positioning path,
lowest queue length prior to the disk drive).
The duplicate of the disk has its own mnemonic device address, yet the same VSN as the
original disk. When interpreting the monitoring values, the consequences of this are the
following ones:
–
The VSN is duplicated in the CONFIGURATION table (with different mnemonic name
values), provided that DRV was in operation before SM2 started.
–
In the DEVICE report as well, a VSN can appear in duplicate (with monitoring values).
–
In Report 12 (percentage of device utilization per VSN), SM2R1 lists the monitored data
of both drives; in extreme cases utilization values of up to 200% may be the case.
6.3.3 Channel load with BUS peripherals
It is not possible to determine load values for bus channels. On SR2000 systems, channels
0-F are always bus channels (see information on the CHANNEL report, page 227).
6.3.4 SERVICETIME monitoring values with SYMMETRIX control
–
When the remote copy function SRDF (Symmetrix Remote Date Facility, see manual
SHC-OSD [22]) is used, the resulting remote copy times are counted with remaining
service time in the case of synchronous or semi-synchronous processing.
–
If the total hit rate is 100%, the device discount time is zero.
U3585-J-Z125-8-76
351
Sample procedures
Notes on SM2 operation
6.4 Sample procedures
The following procedures serve as examples for automating frequently recurring operations
when the SM2 is used in normal computer center operation. They can also be found in the
SYSLIB.SM2.130 library.
The first procedure starts short-term monitoring with output to a separate file, defining and
starting monitoring programs.
The second procedure presupposes that the preceding monitoring operation has already
been in progress for some time (e.g. 30 minutes). It terminates monitoring and closes the
SM2 output file.
The third procedure makes the preparations for analysis with SM2R1 and updates the
master output file. In the example it is assumed that the master output file is on disk. If it is
on tape, the procedure has to be modified.
Input files
Old master output file and the SM2 output file that was just closed.
Output file
New master output file.
The fourth procedure causes the SM2 output file just closed to be analyzed.
1) Start short-term monitoring (SM2.START.MEASUREMENT)
/BEGIN-PROCEDURE LOGGING=C,PARAMETERS=YES(PROCEDURE-PARAMETERS=(
/
&CYCLE=300,&SAMPLE=500,&TSN=‘(BCAM,BCAT)‘,&DEVICE=
/
‘(F00A,F00B)‘),ESCAPE-CHARACTER=C'&')
/ASSIGN-SYSDTA TO-FILE=*SYSCMD
/REMARK
/REMARK
/REMARK
/REMARK
/REMARK
-
====================================================
*** EXAMPLE 1
***
*** DEFAULT FOR MONITORING CYCLE
= 300 S AND ***
*** FOR SAMPLING CYCLE
= 500 MS
***
====================================================
/REMARK ====================================================
/REMARK *** DEFINE SM2 OUTPUT FILE AND LOAD SM2
***
/REMARK ====================================================
/DELETE-FILE FILE-NAME=SM2.OUTPUT
/SET-JOB-STEP
/CREATE-FILE FILE-NAME=SM2.OUTPUT,SUPPORT=PUBLIC-DISK(SPACE=RELATIVE( /
PRIMARY-ALLOCATION=200,SECONDARY-ALLOCATION=100))
/ADD-FILE-LINK LINK-NAME=SMLINK,FILE-NAME=SM2.OUTPUT,ACCESS-METHOD=SAM,/
OPEN-MODE=OUTPUT
352
U3585-J-Z125-8-76
Notes on SM2 operation
Sample procedures
/START-SM2
REMARK
REMARK
REMARK
=============================================================
****
BRANCH TO ADMINISTRATION PART
****
=============================================================
CALL-ADMINISTRATION-PART
REMARK
REMARK
REMARK
REMARK
=============================================================
****
DEFINE SYSSTAT MONITORING PROGRAM
****
****
MONITOR ALL DISKS AND TAPES
****
=============================================================
SET-SYSSTAT-PARAMETER USED-DEVICES=(*DISK,*TAPE)
REMARK
REMARK
REMARK
REMARK
REMARK
REMARK
=============================================================
****
DEFINE TASK MONITORING PROGRAM
****
****
MONITOR TASKS WITH TSNS 1111 AND 1112 AND
****
****
WITH THE JOB NAME TEST
****
****
MONITOR DISK F00B ONLY
****
=============================================================
SET-TASK-PARAMETER TASK-SELECTION=*SPECIFIED(TSN=&TSN,JOBNAME=
TEST),DEVICES=&DEVICE
REMARK
REMARK
REMARK
REMARK
-
=============================================================
****
DEFINE DISK MONITORING PROGRAM
****
****
MONITOR DISK F00H
****
=============================================================
SET-DISK-PARAMETER DEVICES=&DEVICE
REMARK
REMARK
REMARK
=============================================================
****
DEFINE FILE MONITORING PROGRAM
****
=============================================================
ADD-FILE FILE-NAME=:A:$TSOS.TSOSCAT
REMARK
REMARK
REMARK
REMARK
U3585-J-Z125-8-76
=============================================================
****
DEFINE RESPONSETIME MONITORING PROGRAM
***
****
DEFINE CONNECTIONS TO BE MONITORED
***
=============================================================
353
Sample procedures
Notes on SM2 operation
SET-RESPONSETIME-PARAMETER
ADD-CONNECTION-SET SET-NAME=CONN1,SET-DEFINITION=*BY-CONNECTION,
CONNECTION-SET=*CONNECTION(APPLICATION=$DIALOG,PARTNER=*ALL,
PROCESSOR=*ALL)
ADD-CONNECTION-SET SET-NAME=CONN2,SET-DEFINITION=*BY-CONNECTION,
CONNECTION-SET=*CONNECTION(APPLICATION=UTM1,PARTNER=*ALL,
PROCESSOR=*ALL)
REMARK
REMARK
REMARK
REMARK
-
=============================================================
****
OPEN SM2 FILE, SPECIFY MONITORING CYCLE AND
****
****
SAMPLING CYCLE
****
=============================================================
MODIFY-MEASUREMENT-PERIODS OFFLINE-PERIOD=&CYCLE,SAMPLING-PERIOD=&SAMPLE
OPEN-LOG-FILE FILE=*BY-LINK-NAME
REMARK
REMARK
REMARK
=============================================================
****
START MONITORING PROGRAMS
****
=============================================================
START-MEASUREMENT-PROGRAM TYPE=(*SYSSTAT,*TASK,*DISK,*FILE,*RESPONSETIME)
REMARK
REMARK
REMARK
REMARK
=============================================================
****
TERMINATE SM2 USER PROGRAM
****
****
MONITORING CONTINUES IN THE BACKGROUND !!!
****
=============================================================
END
/END-PROCEDURE
354
U3585-J-Z125-8-76
Notes on SM2 operation
Sample procedures
2) Terminate short-term monitoring and resume former monitoring operations
(SM2.STOP.MEASUREMENT)
It is assumed that SM2 was started with the preceding procedure.
/BEGIN-PROCEDURE LOGGING=C,PARAMETERS=YES(PROCEDURE-PARAMETERS=(
/
&CYCLE=300,$SAMPLE=500),ESCAPE-CHARACTER=C'&')
/ASSIGN-SYSDTA TO-FILE=*SYSCMD
/REMARK
/REMARK
/REMARK
/REMARK
/REMARK
-
==========================================================
***
EXAMPLE 2
***
***
DEFAULT FOR MONITORING CYCLE
= 300 S AND
***
***
FOR SAMPLING CYCLE
= 500 MS
***
==========================================================
/REMARK ==========================================================
/REMARK ***
DELETE NON-CATALOGED FILE
***
/REMARK ==========================================================
/DELETE-FILE FILE-NAME=SM2.CHANGE
/SET-JOB-STEP
/REMARK ==========================================================
/REMARK ***
LOAD SM2 USER PROGRAM
***
/REMARK ==========================================================
/START-SM2
REMARK
REMARK
REMARK
REMARK
==========================================================
***
BRANCH TO ADMINISTRATION PART AND TERMINATE
***
***
ALL ACTIVE MONITORING PROGRAMS
***
==========================================================
CALL-ADMINISTRATION-PART
STOP-MEASUREMENT-PROGRAM TYPE=(*SYSSTAT,*TASK,*DISK,*FILE,*RESPONSETIME)
REMARK ===========================================================
REMARK ***
CLOSE SM2 FILE
***
REMARK ===========================================================
CLOSE-LOG-FILE
REMARK
REMARK
REMARK
REMARK
U3585-J-Z125-8-76
===========================================================
***
THE MONITORING PROGRAM DEFINITIONS ARE
***
***
STILL VALID
***
===========================================================
355
Sample procedures
REMARK
REMARK
REMARK
REMARK
Notes on SM2 operation
===========================================================
***
TERMINATE SM2 USER PROGRAM
***
***
RENAME CLOSED FILE
***
===========================================================
END
/MODIFY-FILE-ATTRIBUTES FILE-NAME=SM2.OUTPUT,NEW-NAME=SM2.CHANGE,
/
SUPPORT=PUBLIC-DISK(SPACE=RELEASE(100))
-
/END-PROCEDURE
356
U3585-J-Z125-8-76
Notes on SM2 operation
Sample procedures
3) Prepare for SM2R1 analysis with the SM2U1 utility (SM2U1.PREPARE)
Update the master output file with all the records with the exception of those for the TASK
and DISK monitoring programs.
/BEGIN-PROCEDURE LOGGING=C,PARAMETERS=YES(PROCEDURE-PARAMETERS=(
/
&SM2UIN=SM2.CHANGE,&SM2UTASK=SM2.SAM.TASK,&SM2MASTER=SM2.MASTER),/
ESCAPE-CHARACTER=C'&')
/ASSIGN-SYSDTA TO-FILE=*SYSCMD
/REMARK ==========================================================
/REMARK ***
ASSIGN INPUT FILE
***
/REMARK ==========================================================
/ADD-FILE-LINK LINK-NAME=SM2UI1,FILE-NAME=&SM2UIN
/REMARK ==========================================================
/REMARK ***
ASSIGN OUTPUT FILE (SM2 MASTER FILE)
***
/REMARK ==========================================================
/ADD-FILE-LINK LINK-NAME=SM2UO,FILE-NAME=&SM2MASTER
/REMARK
/REMARK
/REMARK
/REMARK
/REMARK
==========================================================
***
LOAD SM2U1, UPDATE SM2 MASTER FILE AND ALL
***
***
RECORDS EXCEPT THOSE FOR THE TASK AND DISK
***
***
MONITORING PROGRAMS
***
==========================================================
/START-SM2U1
SELECT-MEASUREMENT-GROUPS SELECTION=*ALL(EXCEPT=(*DISK-STATISTICS,
*TASK-STATISTICS))
END
-
/REMARK ==========================================================
/REMARK ***
ASSIGN INPUT FILE
***
/REMARK ==========================================================
/ADD-FILE-LINK LINK-NAME=SM2UI1,FILE-NAME=&SM2UIN
/REMARK ==========================================================
/REMARK ***
ASSIGN OUTPUT FILE FOR TASK RECORDS
***
/REMARK ==========================================================
/DELETE-FILE FILE-NAME=&SM2UTASK
/SET-JOB-STEP
/ADD-FILE-LINK LINK-NAME=SM2UO,FILE-NAME=&SM2UTASK
U3585-J-Z125-8-76
357
Sample procedures
/REMARK
/REMARK
/REMARK
/REMARK
Notes on SM2 operation
==========================================================
***
LOAD SM2U1, CREATE SM2 FILE FOR TASK
***
***
ANALYSIS.
***
==========================================================
/START-SM2U1
SELECT-MEASUREMENT-GROUPS SELECTION=*TASK-STATISTICS
END
/END-PROCEDURE
358
U3585-J-Z125-8-76
Notes on SM2 operation
Sample procedures
4) Perform analysis with SM2R1 (SM2R1.EVALUATION)
This procedure analyzes the SM2 output file just closed.
/BEGIN-PROCEDURE LOGGING=C,PARAMETERS=YES(PROCEDURE-PARAMETERS=(
/
&SM2OUT=SM2.CHANGE,&SM2R1OUT=SM2R1.OUT,&SM2UTASK=SM2.SAM.TASK,
/
&SM2R1OTASK=SM2R1.OUT.TASK),ESCAPE-CHARACTER=C'&')
/MODIFY-TERMINAL-OPTIONS OVERFLOW-CONTROL=NO-CONTROL
/ASSIGN-SYSDTA TO-FILE=*SYSCMD
-
/DELETE-FILE FILE-NAME=&SM2R1OUT
/SET-JOB-STEP
/REMARK ==========================================================
/REMARK ***
LOAD SM2R1 AND ANALYZE SM2 FILE
***
/REMARK ==========================================================
/START-SM2R1 MONITOR-FILE-NAME=&SM2OUT,LIST-FILE-NAME=&SM2R1OUT
PRINT-CONFIGURATION
SET-TITLE TEXT='*** STANDARD-STATISTIKEN ***'
PRINT-REPORTS REPORT-LIST=(*STD,*FILE)
PRINT-DISK-STATISTICS
PRINT-QUEUE-TRANSITION
END
/REMARK ==========================================================
/REMARK ***
PRINT SM2R1 OUTPUT FILE
***
/REMARK ==========================================================
/PRINT-DOCUMENT FROM-FILE=&SM2R1OUT,DELETE-AFTER-PRINT=*YES,DOCUMENT/
FORMAT=*TEXT(LINE-SPACING=*BY-EBCDIC-CONTROL)
-
/REMARK ==========================================================
/REMARK ***
ANALYZE TASK
***
/REMARK ==========================================================
/DELETE-FILE FILE-NAME=&SM2R1OTASK
/SET-JOB-STEP
/REMARK
/REMARK
/REMARK
/REMARK
==========================================================
***
LOAD SM2R1 AND ANALYZE SM2 FILE
***
***
(TASK RECORDS)
***
==========================================================
/START-SM2R1 MONITOR-FILE-NAME=&SM2UTASK,LIST-FILE-NAME=&SM2R1OTASK
SET-TITLE TEXT='*** TASKSTATISTIK ***'
PRINT-TASK-STATISTICS INFORMATION=*HIGH
END
U3585-J-Z125-8-76
359
Sample procedures
Notes on SM2 operation
/REMARK ==========================================================
/REMARK ***
PRINT SM2R1 OUTPUT FILE
***
/REMARK ==========================================================
/PRINT-DOCUMENT FROM-FILE=&SM2R1OTASK,DELETE-AFTER-PRINT=*YES,
/
DOCUMENT-FORMAT=*TEXT(LINE-SPACING=*BY-EBCDIC-CONTROL)
-
/MODIFY-TERMINAL-OPTIONS OVERFLOW-CONTROL=USER-ACKNOWLEDGE
/END-PROCEDURE
360
U3585-J-Z125-8-76
7 Variables reports
7.1 Table of monitored variables
In the following table, the SM2 monitored variables are shown in relation to the monitoring
program, ONLINE report, and SM2R1 report group.
Monitored variable
Monitoring
program
ONLINE
report
SM2R1
report group
Accesses and hit rates for DAB caches
DAB
DAB
DAB
Accesses to ISAM pools
ISAM
ISAM
ISAM
Accesses and hit rates for hiperfiles
PFA
PFA
PFA
CONTROLLER
Accesses and hit rates for controllers (3419/
342)1 with cache
PCA
PCA
CONTROLLER/
CACHE/
DEVICE
Accesses and hit rates for SYMMETRIX
controllers
PFA
SYMMETRIXSYMMETRIX
CONTROLLER/ CONTROLLER/
DEVICE
DEVICE
CPU utilization
1)
ACTIVITY, CPU CPU
Number of system calls
1),
Cache
PCACONTROLLER/
CACHE/
DEVICE
CPU
SVC
ACTIVITY, SVC CPU, SVC
Files
Catalog accesses
CMS
CMS
CATALOGMANAGEMENT
File accesses
FILE
FILE
FILE
File access times
FILE
FILE
FILE
File accesses for selected disks
DISK-FILE
DISK FILE
U3585-J-Z125-8-76
361
Monitored variables
Monitored variable
Reports on monitored variables
Monitoring
program
ONLINE
report
SM2R1
report group
Number of I/O operations
1)
ACTIVITY,
DEVICE
DISK, IO,
DEVICE
Number of paging I/O operations
1)
ACTIVITY, ME- IO
MORY
IOs
, DISK
Channel utilization and channel data transfer CHANNEL-IO
rates
CHANNEL
CHANNEL
Device utilization and data transfer rates
1)
DEVICE
DISK
Length of device queues
1)
DEVICE
DISK
Duration of I/O operations
DISK
(DISKSTATISTICS)2)
Hardware service times
SERVICETIME
DEVICE
Access distribution to cylinder by disks
DISK
(DISKSTATISTICS)2)
Communication
Response times, transaction times,
think times, transaction rates,
message lengths of transactions
RESPONSETIME
RESPONSETIME
RESPONSETIME
Number of I/Os by network devices
NET-DEVICE
NET DEVICE
NET-DEVICE
Network data transfer rates
BCAMBCAM
CONNECTION CONNECTION
BCAMCONNECTION
Data transfer rates for TCP-IP connection
TCP-IP
TCP/IP
TCP-IP
Allocation of main memory
1)
ACTIVITY,
MEMORY
MEMORY
Allocation of paging area
1)
ACTIVITY,
MEMORY
MEMORY
Allocation of virtual address space
1)
ACTIVITY,
MEMORY
MEMORY
Page fault rate
1)
MEMORY
MEMORY
Accesses to global memory
GS, GSVOL
GS, GSVOL
GS, GSVOL
Memory
362
U3585-J-Z125-8-76
Reports on monitored variables
Monitored variable
Monitored variables
Monitoring
program
ONLINE
report
SM2R1
report group
PCS data
1)
PCS
PCS
UTM response times and transaction rates
UTM
UTM/
APPLICATION
UTM
Number and duration of send requests via
MSCF
MSCF
MSCF
MSCF
Data to POSIX
POSIX
POSIX
POSIX
Subsystems
Lock requests to the DLM
DLM
DLM
DLM
Data to synchronization functions in
HIPLEX
NSM
NSM
NSM
Data to HSMS
HSMS
(HSMSSTATISTICS)2)
Task
Number of tasks
1)
Length of task queues
1),
Delay times in task queues
SYSSTAT
SYSSTAT
ACTIVITY
TASK
CATEGORY
QUEUE
CATEGORYQUEUE
(QUEUE
TRANSITION)2)
Frequency of task activation and deactivation 1)
ACF
PRIOR-ACF
Task-specific resource utilization
PERIODICTASK
PERIODIC
TASK
PERIODICTASKJOBNAME/
TSN/USERID
Allocation and queues of task locks
TLM
TLM
TLM
VM2000
VM2000
VM2000
VM2000
Hypervisor activities,
guest system activities
1) The
2) The
U3585-J-Z125-8-76
monitored values are recorded permanently (default monitoring method).
items in brackets refer to SM2R1 statistics, not report groups.
363
Eine Dokuschablone von Frank Flachenecker
by f.f. 1992
8 Messages
NPC0050
ERROR IN COSMOS-PARAMS
Meaning
Invalid values in COSMOS-params.
The statement has been rejected.
NPC0051
NO MEMORY SPACE ALLOCATED FOR FILE: (&00)
Meaning
Possible reasons:
- No memory space has been allocated for the file.
- The value of the primary allocation is smaller than the block size.
Response
Allocate the memory space by means of the command /MODIFY-FILE-ATTRIBUTES
NPC0052
REQUESTED FILE ’(&00)’ NOT CATALOGED IN PUBSET
Meaning
The requested file is not cataloged in the requested pubset.
Response
Create the file by means of the command /CREATE-FILE.
NPC0053
ERROR IN IC-LIST OF EIA-EVENT
Meaning
Invalid values in interruptcode-list of EIA-event.
The statement has been rejected.
NPC0054
ERROR IN STATEMENT ’//ADD-/REMOVE-COSMOS-EVENT’
Meaning
Invalid values in eventlist of command ADD-/REMOVE-COSMOS-EVENT.
The statement has been rejected.
U3585-J-Z125-8-76
365
NPC0055
NPC0055
Messages
’//SET-COSMOS-PARAMETER’ STATEMENT NOT SPECIFIED
Meaning
The statement //ADD-COSMOS-EVENT, //REMOVE-COSMOS-EVENT,
//MODIFY-COSMOS-PARAMETER, //INIT-COSMOS or
//START-MEASUREMENT-PROGRAM COSMOS cannot be specified unless
//SET-COSMOS-PARAMETER statement
is specified.
The statement has been rejected.
Response
Enter the statement //SET-COSMOS-PARAMETER and repeat your original entry.
NPC0056
STATEMENT ’(&00)’ NOT ALLOWED
Meaning
The statement //SET-COSMOS-PARAMETER, //MODIFY-COSMOS-PARAMETER,
//ADD-COSMOS-EVENT or //REMOVE-COSMOS-EVENT are not allowed between the
statements //INIT-COSMOS and //START-MEASUREMENT-PROGRAM COSMOS.
The statement has been rejected.
NPC0057
SYSTEM ERROR DURING CREATE OF SUBSYSTEM COSMOS.
Meaning
Error in starting of the subsystem COSMOSduring //INIT-COSMOS or
//START-MEASUREMENT-PROGRAM COSMOS.
You can determine the detailed error cause using the trace entries of the //SHOW-SM2STATUS function.
NPC0058
SYSTEM ERROR IN COSMOS-MODULES
Meaning
A system error has occured in COSMOS during program execution.
You can determine the detailed error cause using the trace entries of the
//SHOW-SM2-STATUS function.
NPC0059
WARNING : ’(&00)’ NOT FOUND IN SYSTEM
Meaning
When defining the monitoring program COSMOS, an value (JOBNAME,CATEGORY,
TSN,USERID) for the parameter TASK-SELECTION was specified that could not be found
in the system at the time of the measurement initialization or the measurement start.
NPC0060
WARNING : MACRO-ERROR DURING COSMOS EXECUTION
Meaning
During COSMOS-execution a macro returned an error.
For more infos you can determine the detailed error cause using the trace entries of the //
SHOW-SM2-STATUS function.
366
U3585-J-Z125-8-76
Messages
NPC0061
NPC0061
ERROR IN COSMOS-WRITETASK
Meaning
The buffer task for the file with linkname ’(&00)’ returns an error.
You can determine the detailed error cause using the trace entries of the //SHOW-SM2STATUS function.
NPC0062
MONITORING PROGRAM COSMOS ALREADY INITIALIZE. STATEMENT REJECTED
Meaning
An attempt was made to initialize the monitoring program COSMOS that has already been
initialize or start.
NPC0063
ERROR DURING START OF UTM MEASUREMENT. MEASUREMENT PROGRAM COSMOS NOT STARTED.
Meaning
Event UTM cannot be opened, because the subsystem UTM is not created.
Statement //INIT-COSMOS or //START-MEASURMENT-PROGRAM COSMOS rejected.
Response
Create subsystem UTM first and then start the COSMOS measurement.
NPC0064
ERROR DURING PROCESSING OF COSMOS MEASUREMENT FILE: ’(&00)’
Meaning
You can determine the detailed error cause using the trace entries of the //SHOW-SM2STATUS function.
NPC0065
INVALID FCBTYPE OF COSMOS MEASUREMENTFILE
Meaning
The indicated file exists already and does not have the FCBTYP PAM.
Response
Create a new file or access a file with correct FCBTYP PAM.
NPC0066
DMS-ERROR IN COSMOS-MEASUREMENTFILE ’(&01)’. DMS-CODE ’(&00)’. /HELP-MSG
DMS(&00).
Meaning
For more detailed information about the DMS error code enter /HELP-MSG or see the
BS2000 manual ’System messages’.
NPC0067
ERROR DURING MACROPROCESSING ’DCAMPNSM’.
U3585-J-Z125-8-76
367
NPC0068
NPC0068
Messages
FILE WITH LINKNAME ’COSFIL’ NOT FOUND.
Meaning
Possible reasons:
- The COSMOS measurement file assigned by LINK=COSFIL is not in the
COSMOS parameter list.
- The COSMOS measurement file assigned by LINK=COSFIL does not exist.
Response
Enter the statement //SET-COSMOS-PARAMETER with the COSMOS measurement file
assigned by LINK=COSFIL as parameter or create a COSMOS measurement file with
LINK=COSFIL.
NPC0069
ERROR DURING RDTFT-MACROPROCESSING.
NPC0070
SUBSYSTEM COSMOS NOT FOUND.
NPC0071
TO MANY MEASUREMENT FILES SPECIFIED.
Meaning
More than one measurement file for OUTPUT=*WRAP-AROUND(...) was specified.
Response
Enter the statement //SET-COSMOS-PARAMETER with only one measurement file for
WRAP-AROUND.
NPC0072
WRONG MEASUREMENT FILE SPECIFIED
Meaning
For VM2000- and COSMOS-Events the same measurement file was specified.
Response
Correct the statement and try again.
NPC0073
MEASUREMENT FILE FOR VM2000-EVENTS NOT SPECIFIED
Meaning
Measurement file for VM2000-Events was not specified in statement
//SET-/MODIFY-COSMOS-PARAMETER.
Response
Correct statement and try again or close the VM2000-Events.
368
U3585-J-Z125-8-76
Messages
NPC0074
NPC0074
ERROR DURING START OF SUBSYSTEM BCAM-COS. MEASUREMENT PROGRAM COSMOS NOT
STARTED.
Meaning
The event BCAM resp. BCPT cannot be opened, because the subsystem BCAM-COS
could not be loaded.
The instruction //INIT-COSMOS resp. //START-MEASUENT-PROGRAM COSMOS was
rejected.
BCAM-COS is not installed or has wrong version.
Response
Install subsystem BCAM-COS first and then start the COSMOS measurement.
NPC0075
ERROR DURING START OF SUBSYSTEM DCAM-COS. MEASUREMENT PROGRAM COSMOS NOT
STARTED.
Meaning
The event DCAM cannot be opened, because the subsystem DCAM-COS could not
be loaded. Statement //INIT-COSMOS or //START-MEASURMENT-PROGRAM COSMOS
rejected.
DCAM-COS is not installed or has wrong version.
Response
Install subsystem DCAM-COS first and then start the COSMOS measurement.
NPECOPY
Copyright (C) ’(&00)’ ’(&01)’ All Rights Reserved
NPELOAD
Program ’(&00)’, Version ’(&01)’ of ’(&02)’ loaded from file ’(&03)’
NPESTRT
Procedure ’(&00)’, Version ’(&01)’ of ’(&02)’ started from file ’(&03)’
NPSCOPY
Copyright (C) ’(&00)’ ’(&01)’ All Rights Reserved
NPSLOAD
Program ’(&00)’, Version ’(&01)’ of ’(&02)’ loaded from file ’(&03)’
NPSSTRT
Procedure ’(&00)’, Version ’(&01)’ of ’(&02)’ started from file ’(&03)’
NPS0001
PRIVILEGE ERROR. STATEMENT REJECTED
(B) Routing code: R Weight: 99
Meaning
Possible reasons:
- A user without privilege "Software Monitor Administration" tried to enter a privileged
SM2 statement.
- A user who is not the primary SM2 administrator tried to enter a privileged
SM2 statement, which is reserved to the primary administrator.
- A privileged user, who is not SM2 administrator tried to enter a SM2 statement, which
is reserved to the administrators.
U3585-J-Z125-8-76
369
NPS0002
NPS0002
Messages
NO MORE FILES PERMITTED FOR FILE MONITORING
(B) Routing code: R Weight: 99
Meaning
SM2 is already monitoring 16 files.
NPS0003
USER NOT AUTHORIZED TO MONITOR FILES. STATEMENT REJECTED
(B) Routing code: R Weight: 99
Meaning
The SM2 administrator has not (yet) permitted file monitoring for this user.
NPS0005
SM2 SYSTEM CODE LOCKED. SM2 RUN ABORTED. TRY AGAIN LATER
(B) Routing code: R Weight: 99
Meaning
A serialization lock in the SM2 system code was not released after a certain time.
NPS0006
MEASUREMENT DATA MAY BE INCONSISTENT. no data for output
(B) Routing code: R Weight: 99
Meaning
The data collected during the last monitoring cycle may be inconsistent because of
bottlenecks.
NPS0009
USER NOT AUTHORIZED TO SUBMIT OR WITHDRAW SPECIFIED FILE
(B) Routing code: R Weight: 99
NPS0010
FILE NOT SUBMITTED
(B) Routing code: R Weight: 50
Meaning
A user tried to withdraw a file from monitoring which had not been submitted in the first
place.
NPS0011
SYNTAX ERROR. STATEMENT CONTAINS INVALID OPERAND(S)
(B) Routing code: R Weight: 99
Meaning
The statement has been rejected.
NPS0012
SYNTAX ERROR. OUTPUT CYCLE NOT IN PERMITTED RANGE
(B) Routing code: R Weight: 99
Meaning
The specified output cycle is not in the permitted range from 10 to 3600 seconds.
The statement has been rejected.
NPS0014
STATEMENT UNKNOWN
(B) Routing code: R Weight: 99
370
U3585-J-Z125-8-76
Messages
NPS0015
NPS0015
SYNTAX ERROR. STATEMENT CONTAINS INVALID OPERAND(S) ’(&00)’
(B) Routing code: R Weight: 99
Meaning
The statement has been rejected.
NPS0016
NO REPORTS SELECTED FOR OUTPUT
(B) Routing code: R Weight: 99
Meaning
Report output cannot be started until the appropriate reports have been selected.
NPS0018
SYNTAX ERROR. OPERAND MISSING
(B) Routing code: R Weight: 99
Meaning
A statement has been entered without an essential operand.
The statement has been rejected.
NPS0020
SYNTAX ERROR. INVALID LIST FORMAT
(B) Routing code: R Weight: 99
Meaning
A list was specified in a statement which does not have the expected format
(e.g. ’)’ missing).
The statement has been rejected.
NPS0021
SYNTAX ERROR. PERMITTED NUMBER OF LIST ELEMENTS EXCEEDED FROM ’(&00)’ OPERAND
ONWARDS
(B) Routing code: R Weight: 99
Meaning
The statement has been rejected.
NPS0022
SYNTAX ERROR IN ’(&00)’ OPERAND
(B) Routing code: R Weight: 99
Meaning
The statement has been rejected.
NPS0023
SYNTAX ERROR. ’(&00)’ OPERAND TOO LONG
(B) Routing code: R Weight: 99
Meaning
The statement has been rejected.
NPS0024
SYNTAX ERROR. TOO MANY LIST ELEMENTS
(B) Routing code: R Weight: 99
Meaning
Too many list elements were specified in a statement.
The statement has been rejected.
U3585-J-Z125-8-76
371
NPS0025
NPS0025
Messages
SYNTAX ERROR. ’(&00)’ OPERAND TERMINATED INCORRECTLY
(B) Routing code: R Weight: 99
Meaning
An improperly terminated operand (e.g. comment) was entered in a statement.
The statement has been rejected.
NPS0026
SYNTAX ERROR. INVALID KEYWORD ’(&00)’
(B) Routing code: R Weight: 99
Meaning
The statement has been rejected.
NPS0027
DUPLICATE OR INCOMPATIBLE KEYWORD(S) ’(&00)’
(B) Routing code: R Weight: 99
Meaning
Possible reasons:
- a keyword was entered several times in the same statement,
- mutually exclusive keywords were specified.
The statement has been rejected.
NPS0028
MAXIMUM WAITTIME IS REACHED. TRY AGAIN LATER.
Meaning
Because of bottlenecks some instructions couldn’t be executed within timelimit.
NPS0031
SYNTAX ERROR. STATEMENT TOO LONG
(B) Routing code: R Weight: 99
Meaning
A statement is not allowed to have more than 1536 characters inclusive all continuation
lines.
Strings of blanks are counted as one character.
The statement has been rejected.
NPS0032
SYNTAX ERROR. INPUT LINE LONGER THAN 256 CHARACTERS
(B) Routing code: R Weight: 99
Meaning
The statement has been rejected.
372
U3585-J-Z125-8-76
Messages
NPS0033
NPS0033
UNEXPECTED END OF INPUT FILE
(B) Routing code: R Weight: 99
Meaning
Possible reasons:
- An end-of-file condition was encountered in batch mode.
- In interactive mode with statement input from a file, an end-of-file
condition was encountered when attempting to read a continuation line.
If the end-of-file condition is encountered while reading the first line of a statement, SYSDTA
is set to (PRIMARY) without this message being displayed.
NPS0035
INVALID BS2000 COMMAND
(B) Routing code: R Weight: 99
Meaning
An invalid BS2000 command has been issued as an SM2 statement in batch mode.
NPS0036
’(&00)’ MACRO ERROR. RETURN CODE ’(&01)’
(B) Routing code: R Weight: 99
Meaning
An error has occurred during execution of the specified macro.
Depending on the error, SM2 either continues program execution, i.e. requests a corrected
statement via ENTER COMMAND, or terminates.
(&01): return code of the macro (cf. the ’Executive Macros’ manual).
NPS0037
SM2 TERMINATED NORMALLY
(B) Routing code: R Weight: 50
NPS0038
SM2 TERMINATED ABNORMALLY
(B) Routing code: R Weight: 99
Meaning
A serious program error has occurred, leading to immediate program termination.
NPS0039
FORMATTED OUTPUT ONLY POSSIBLE TO SYSLST
(B) Routing code: R Weight: 99
Meaning
Terminal output is not possible because:
- SM2 is running in batch mode, or
- the terminal has less than 80 columns, or
- the terminal has less than 24 lines.
Screen and status diagrams are put out to SYSLST.
U3585-J-Z125-8-76
373
NPS0040
NPS0040
Messages
SM2 STXIT: CLASS=(&00), CODE=(&01), LOCATION=(&02). PROGRAM RUN ABORTED
(B) Routing code: R Weight: 99
Meaning
An error has occurred in the unprivileged program part of SM2.
CLASS:
event class.
CODE:
error weight.
LOCATION: program counter of the location at which the error occurred.
For further information on the STXIT routine see the ’Executive Macros’ manual.
NPS0041
TOO MUCH USERS WANT TO MONITOR THE SAME FILE
Meaning
Maximal 64 users can monitor the same file at the same time.
NPS0044
USER NOT AUTHORIZED TO MONITOR TASK. COMMAND REJECTED
(B) Routing code: R Weight: 99
Meaning
The SM2 administrator has not permitted task monitoring. As a result, monitoring of the
user task either cannot be started or can no longer be stopped by the user.
If the user himself started the monitoring of his task by means of a
/START-TASK-MEASUREMENT command, monitoring has already been terminated by the
SM2 administrator.
NPS0045
TASK ALREADY BEING MONITORED BY SM2
(B) Routing code: R Weight: 50
Meaning
Monitoring of the task has already been started either by the user via
the /START-TASK-MEASUREMENT command or by the SM2 administrator.
NPS0046
TASK MONITORING NOT INITIATED BY ’/START-TASK-MEASUREMENT’. COMMAND REJECTED
(B) Routing code: R Weight: 99
Meaning
Task monitoring cannot be terminated, either because it was not started by the
/START-TASK-MEASUREMENT command or because it has already been terminated in
the meantime (e.g. due to withdrawal of permission to monitor the task or to SM2
shutdown).
NPS0047
SPECIFIED TASK DOES NOT EXIST
Meaning
A TSN was specified for which no task exists.
374
U3585-J-Z125-8-76
Messages
NPS0048
NPS0048
COMMAND EXECUTED. TASK MONITORING STARTED ON (&00)
(B) Routing code: R Weight: 50
Meaning
(&00): time stamp for the start of monitoring, in the format
YYYY-MM-DD HH:MM:SS.
Note:
Precisely this time stamp will be put out in the task analysis conducted by the SM2-PA
analysis routine.
NPS0049
COMMAND EXECUTED. TASK MONITORING TERMINATED ON (&00)
(B) Routing code: R Weight: 50
Meaning
(&00): time stamp for the end of monitoring, in the format
YYYY-MM-DD HH:MM:SS.
Note:
Precisely this time stamp will be put out in the task analysis conducted by the SM2R1
analysis routine.
NPS0050
SYSTEM ERROR IN SM2 MODULES. COMMAND REJECTED
(B) Routing code: R Weight: 99
Meaning
A system error has occurred in SM2 during program execution. As a result, task monitoring
cannot be started after the /START-TASK-MEASUREMENT command or no task record 27
can be written to the userspecific SM2 logging file after the /STOP-TASK-MEASUREMENT
command.
Response
Contact the SM2 administrator. He can determine the detailed error cause using the trace
entries of the //SHOW-SM2-STATUS function.
In that case he is able to clear away the difficulties or he can produce detailed diagnostic
material.
NPS0051
SPECIFIED TASK MUST NOT BE MONITORED BY USER
Meaning
The specified TSN belongs to a task under a foreign user id.
Start and termination of monitoring foreign tasks is only permitted for users with privilege
SW-MONITOR-ADMINISTRATION.
NPS0052
TOO MANY OBJECTS SPECIFIED FOR MONITORING. STATEMENT REJECTED
(B) Routing code: R Weight: 99
Meaning
An ADD statement with an object list has been specified. Together with the preceding ADD
statements of the same kind the total number of objects is greater than the maximum
number of objects that may be specified.
U3585-J-Z125-8-76
375
NPS0053
NPS0053
Messages
TOO MANY POOLS SUBMITTED FOR ISAM POOL MONITORING. STATEMENT REJECTED
(B) Routing code: R Weight: 99
Meaning
ISAM monitoring is limited to a total of 16 ISAM pools.
NPS0054
ISAM POOL NOT SUBMITTED. STATEMENT REJECTED
(B) Routing code: R Weight: 50
Meaning
A user tried to withdraw an ISAM POOL from monitoring which had not been submitted
before.
NPS0055
USER NOT AUTHORIZED TO MONITOR ISAM BUFFERS. STATEMENT REJECTED
(B) Routing code: R Weight: 99
Meaning
The SM2 administrator has not permitted ISAM buffer monitoring. As a result, monitoring of
the ISAM buffers either cannot be started or can no longer be terminated by the user.
NPS0056
SYNTAX ERROR. LIST CONTAINS DOUBLE ELEMENTS. STATEMENT REJECTED
Response
Correct the statement and try again.
NPS0057
SYNTAX ERROR. LIST ELEMENTS NOT DEFINED IN ASCENDING ORDER. STATEMENT REJECTED
Response
Correct the statement and try again.
NPS0058
SYNTAX ERROR. AT LEAST ONE OPERAND MUST BE SPECIFIED. STATEMENT REJECTED
Response
Correct the statement and try again.
NPS0059
ONLY ’*’ AT END OF EXPRESSION PERMITTED AS WILDCARD HERE. STATEMENT REJECTED
Response
Correct the statement and try again.
NPS0060
SYSTEM ERROR DURING PROCESSING OF SDF STATEMENTS. SDF RETURN CODE ’(&00)’
NPS0061
SDF SYNTAX FILE DEFECTIVE OR INCORRECTLY ACCESSED. CONTACT SYSTEM ADMINISTRATOR
Meaning
Either no SDF syntax file has been assigned or the one assigned is invalid or cannot be
accessed.
376
U3585-J-Z125-8-76
Messages
NPS0065
NPS0065
NO MORE TASKS CAN BE MONITORED
Meaning
The maximum possible number of tasks which can be monitored by SM2 has been
exceeded.
Response
Either withdraw other tasks from monitoring or wait until some have terminated, and then
try the command again.
NPS0066
INVALID FILE ATTRIBUTES SPECIFIED FOR USERSPECIFIC SM2 LOGGING FILE
Meaning
Invalid file attributes have been specified for the userspecific SM2 logging file regarding the
block size, record format, FCB type or open type.
NPS0067
DMS CODE ’(&00)’ WITH MACRO CALL ’(&01)’ FOR USERSPECIFIC SM2 LOGGING FILE
Meaning
The userspecific SM2 logging file assigned either by LINK=PALINK or by default
(SM2.TASKSTATISTIK.<tsn>) cannot be processed correctly.
For more detailed information about the DMS error code enter /HELP-MSG or see the
BS2000 manual ’System Messages’.
Response
Check the SM2 logging file, and assign another one if necessary.
NPS0400
WARNING: ERROR DURING RESTART OF MONITORING PROGRAMS ’(&00)’
Meaning
The monitoring programs ’(&00)’ couldn’t be restarted after reopen of measurement file.
Response
Check monitoring program definitions and start monitoring programs with
//START-MEASUREMENT-PROGRAM statement.
NPS0501
ERROR DURING PROCESSING OF SM2 LOGGING FILE: DMS CODE ’(&00)’
(B) Routing code: R Weight: 99
Meaning
For more detailed information about the DMS error code enter /HELP-MSG in system mode
or see the BS2000 manual ’System Messages’.
U3585-J-Z125-8-76
377
NPS0502
NPS0502
Messages
SYSTEM ERROR ON CALLING SM2
(B) Routing code: R Weight: 99
Meaning
A serious error has occured when calling SM2
Possible reasons:
- an unexpected return code was delivered when calling an internal BS2000 system
function.
- SM2 itself detected an inconsistency in its own logic.
The statement has been rejected.
Response
Contact the SM2 administrator. He can determine the detailed error cause using the trace
entries of the //SHOW-SM2-STATUS function.
In that case he is able to clear away the difficulties or he can produce detailed diagnostic
material.
NPS0504
SYSTEM ERROR DURING SM2 RUN: CODE=(&00), SUBCODE=(&01)
(B) Routing code: R Weight: 99
Meaning
This message is only put out during test phase of SM2.
NPS0507
SYNTAX ERROR. CYCLE NOT IN PERMITTED RANGE
(B) Routing code: R Weight: 99
Meaning
Possible reasons:
- The specified monitoring cycle is not in the permitted range from 10 to 3600 seconds.
- The specified sampling cycle is not in the permitted range from 200 to 10000
milliseconds.
The statement has been rejected.
NPS0514
SM2 LOGGING FILE SPECIFIED VIA LINK NAME AND NO CORRESPONDING /SET-FILE-LINK
COMMAND ENTERED
(B) Routing code: R Weight: 99
Meaning
The SM2 administrator has failed to define a /SET-FILE-LINK command for the file
attributes of the SM2 logging file.
Response
Enter a /SET-FILE-LINK command with LINK-NAME=SMLINK and try again.
378
U3585-J-Z125-8-76
Messages
NPS0515
NPS0515
SM2 SUBSYSTEM NOT AVAILABLE
(B) Routing code: R Weight: 99
Meaning
A non-privileged user has tried to start SM2 before the system administrator or a SM2
administrator had started the subsystem SM2 or subsystem SM2 was terminated during
connection of user.
NPS0516
REQUIRED MODULES COULD NOT BE LOADED
(B) Routing code: R Weight: 99
Meaning
Certain monitoring program modules could not be loaded.
The return code of the loader function can be obtained by the SM2 administrator using the
trace entries of the //SHOW-SM2-STATUS statement.
NPS0517
VERSION OF SM2 TU PART NOT SUPPORTED BY THE VERSION OF SM2 MODULE LIBARY. SM2
TERMINATES ABNORMALLY.
Meaning
It was tried to start a newer SM2 TU part with an older version of SM2 module library, which
doesn’t support the version of SM2 TU part.
Response
Check the version number, if necessary unload subsystem SM2 and start it new.
NPS0518
CONFIGURATION RECORD COULD NOT BE WRITTEN
(B) Routing code: R Weight: 99
Meaning
This message is for diagnostic purposes only.
The configuration record could not be written either because certain resources were
missing or because of a system error.
NPS0520
ONLY ’RECORD-FORMAT=VARIABLE’ PERMITTED FOR SM2 LOGGING FILE. STATEMENT
REJECTED
Meaning
The value of the RECORD-FORMAT operand in the /SET-FILE-LINK command for a
non-standard SM2 logging file is invalid.
U3585-J-Z125-8-76
379
NPS0521
NPS0521
Messages
ONLY ’BUFFER-LENGTH=*STD(SIZE=16)’ PERMITTED FOR SM2 LOGGING FILE. STATEMENT
REJECTED
Meaning
SM2 logging files are only permitted with ’BUFFER-LENGTH=*STD(16)’.
The value of the BUFFER-LENGTH operand in the /ADD-FILE-LINK command for a nonstandard SM2 logging file is invalid or the existing non-standard SM2 logging file has wrong
BUFFER-LENGTH.
Response
Retry the /ADD-FILE-LIND command without the BUFFER-LENGTH operand and then
retry OPEN-LOG-FILE statement.
If you want to open extend a non-standard SM2 logging file of an older SM2 version, you
first have to convert the file with SM2U1.
NPS0522
SM2 LOGGING FILE NOT OPENED. STATEMENT REJECTED
(B) Routing code: R Weight: 99
Meaning
An attempt was made to start a monitoring program while the SM2 logging file was not
opened.
NPS0523
MONITORING PROGRAM ’(&00)’ NOT DEFINED. STATEMENT REJECTED
(B) Routing code: R Weight: 99
Meaning
An attempt was made to start a non-defined monitoring program.
NPS0524
MONITORING PROGRAM ’(&00)’ ALREADY ACTIVE. STATEMENT REJECTED
(B) Routing code: R Weight: 50
Meaning
An attempt was made to start a monitoring program that has already been started.
NPS0526
TSN ’(&00)’ NOT IN SYSTEM. STATEMENT REJECTED
(B) Routing code: R Weight: 99
Meaning
An attempt was made to start a monitoring program for task statistics by specifying a TSN,
but the corresponding task could not be found in the system at the time.
NPS0527
SYNTAX ERROR. UNKNOWN MONITORING PROGRAM SPECIFIED
(B) Routing code: R Weight: 99
Meaning
The statement has been rejected.
380
U3585-J-Z125-8-76
Messages
NPS0528
NPS0528
INVALID DEVICE DEFINITION SPECIFIED FOR DEVICE ’(&00)’
(B) Routing code: R Weight: 99
Meaning
When defining a monitoring program, an attempt was made to specify a device that is not
valid for this program.
The statement has been rejected.
Possible reasons:
- device is unknown
- device is not a disk
- device is not attached
- device is a GS volume
NPS0529
INVALID CHANNEL DEFINITION SPECIFIED FOR CHANNEL NUMBER ’(&00)’
(B) Routing code: R Weight: 99
Meaning
When defining a monitoring program, an attempt was made to specify an invalid channel
number.
The statement has been rejected.
NPS0530
MONITORING PROGRAM ’(&00)’ INVALID DEFINED. STATEMENT REJECTED
Meaning
It was attempted to start a monitoring program with invalid devices.
Invalid devices are:
- Devices, which are not any more in the configuration
- Devices, which are not in the status ’ATTACHED’ (only for measurement program DISK)
- GS-Volumes
Response
Check and correct monitoring program definition.
NPS0531
WARNING: MONITORING PROGRAM ’(&00)’ PARTLY INVALIDLY DEFINED. INVALID DEVICES
IGNORED
Meaning
While starting a monitoring program, it was found that some invalid devices were selected.
The monitoring program is only started with the valid devices; the invalid devices are not
monitored.
Invalid devices are:
- Devices, which are not any more in the configuration
- Devices, which are not in the status ’ATTACHED’ (only for measurement program DISK)
- GS-Volumes
U3585-J-Z125-8-76
381
NPS0533
NPS0533
Messages
SYSTEM ERROR IN ’/START-TASK-MEASUREMENT’ OR ’/STOP-TASK-MEASUREMENT’ COMMAND:
CODE=(&00)
Meaning
This message is for diagnostic purposes only.
NPS0534
MONITORING PROGRAM ’(&00)’ NOT COMPLETELY DEFINED. STATEMENT REJECTED.
Meaning
An attempt was made to start a not completely defined monitoring program.
Response
Define montoring program completely and repeat statement.
NPS0535
’//SET-BCAM-CONNECTION-PARAMETERS’ STATEMENT NOT SPECIFIED. STATEMENT REJECTED.
Meaning
The //ADD-BCAM-CONNECTION-SET statement cannot be specified unless
//SET-BCAM-CONNECTION-PARAMETERS statement is specified first.
Response
Enter the //SET-BCAM-CONNECTION-SET-PARAMETERS statement and repeat your
original entry.
NPS0536
MORE THAN 32 CONNECTION SETS DEFINED. STATEMENT REJECTED.
Meaning
Maximal 32 connection sets can be monitored by measurement program
BCAM-CONNECTION. Statement rejected.
Response
Use the //REMOVE-BCAM-CONNECTION-SET statement to terminate monitoring of
superfluous connection sets and repeat your original entry.
NPS0537
NAME OF CONNECTION SET INVALID. STATEMENT REJECTED.
Meaning
Possible reasons:
- The specified name in the //ADD-BCAM-CONNECTION-SET statement is already
defined.
- The specified name in the //REMOVE-BCAM-CONNECTION-SET statement does
not exist.
NPS0538
CONNECTION SET DEFINITION IS ALREADY EXISTING. STATEMENT REJECTED.
Meaning
There is already a connection set defined that monitors the same connections.
NPS0539
WARNING: NO CONNECTION SET REMOVED
Meaning
The specified connection set does not exist.
382
U3585-J-Z125-8-76
Messages
NPS0540
NPS0540
VERSIONS OF SM2 AND VM2000 ARE INCOMPATIBLE. STATEMENT REJECTED
Meaning
The measurement program VM cannot fetch any VM data.
NPS0541
INVALID TASK DEFINITION SPECIFIED FOR TSN ’(&00)’
(B) Routing code: R Weight: 99
Meaning
When defining a monitoring program, an attempt was made to specify a task that is not valid
for this program.
The statement has been rejected.
NPS0542
WRONG BUCKET VALUES. STATEMENT REJECTED.
Meaning
Only 1-4 buckets values may be specified in a list.
The values must be in ascending order.
Permissible value range: 1 to 999999.
The statement has been rejected.
NPS0543
SM2 MONITORING TASK NOT WORKING CORRECTLY
(B) Routing code: R Weight: 99
Meaning
Possible reasons:
- The SM2 monitoring task failed to answer a user request within a given time.
- The SM2 monitoring task has already been terminated due to an unrecoverable internal
error.
Response
A non-privileged user can check the SM2 status using the SM2 STATUS statement, and
should then contact the SM2 administrator if this is necessary.
The SM2 administrator can check the status of the SM2 using the //SHOW-SM2-STATUS
statement, and can then terminate and restart the subsystem if this is necessary.
NPS0544
SM2 VERSION (&00) AND BS2000 VERSION (&01) ARE INCOMPATIBLE. SM2 CANNOT BE
LOADED
(B) Routing code: R Weight: 99
Meaning
The version number (&00) of modules in the SM2 module library and the version number
(&01) of the operating system do not match.
U3585-J-Z125-8-76
383
NPS0545
NPS0545
Messages
VERSIONS OF SM2 TU PART (&00) AND SM2 MODULE LIBRARY (&01) ARE INCOMPATIBLE.
SM2 TERMINATED ABNORMALLY
(B) Routing code: R Weight: 99
Meaning
The version number (&00) of the TU part of SM2 and the version number (&01) of modules
in the SM2 module library do not match.
NPS0546
WRONG BCAM-VERSION. STATEMENT REJECTED.
Meaning
The measurement program BCAM-CONNECTION cannot fetch any data by this
BCAM-Version.
NPS0547
MONITORING PROGRAM ’(&00)’ WAS NOT ACTIVE
(B) Routing code: R Weight: 50
Meaning
The SM2 administrator has tried to deactivate or modify a monitoring program that has not
been activated.
The statement has been rejected.
NPS0548
WARNING: MONITORING PROGRAM ’(&00)’ STARTED, BUT ACCORDING SUBSYSTEM NOT LOADED
IN SYSTEM
Meaning
SM2 gets not the measurement data from the specified subsystem. As far as this is not
available, SM2 cannot deliver any measurement data.
Response
Contact the system administrator, so that he can start the required subsystem, or stop the
monitoring program to save resources.
NPS0549
START OF SERVICE TIME STATISTICS NOT POSSIBLE. TRY START STATEMENT AGAIN LATER
(B) Routing code: R Weight: 99
Meaning
It is not possible to start collection of service time statistics at the moment as the previous
service time statistics run has not yet been completed.
Response
The statement //START-MEASUREMENT-PROGRAM TYPE=SERVICETIME may be
repeated later.
NPS0550
WARNING: TASK STATISTICS STARTED WITHOUT RESPONSE TIME VALUES
(B) Routing code: R Weight: 50
Meaning
No response time values can be recorded for task statistics as subsystem BCAM-SM2
could not be loaded or initiated.
384
U3585-J-Z125-8-76
Messages
NPS0551
NPS0551
WARNING: 64 DEVICES SELECTED FOR TASK STATISTICS. SURPLUS DEVICES IGNORED
(B) Routing code: R Weight: 50
Meaning
More than 64 devices were selected by the DEVICE definition in the //SET-TASKPARAMETER statement. As the number of devices that can be monitored is limited to 64,
collection of task statistics begins with exactly 64 devices and any surplus devices are not
monitored.
The criteria for selecting these 64 devices are described in the BS2000 manual ’SM2’.
NPS0552
’/HOLD-SUBSYSTEM’ NOT SUPPORTED BY SM2. REASON FOR FOLLOWING DSSM MESSAGES
Response
Instead of /HOLD-SUBSYSTEM command use /STOP-SUBSYSTEM command.
NPS0553
START OF SM2 SUBSYSTEM NOT POSSIBLE
(B) Routing code: R Weight: 50
Meaning
Possible reasons:
- SM2 has not been declared in the subsystem catalog.
- The installed SM2 version is not compatible with the BS2000 version.
- A required file (e.g. the SM2 module library) is missing.
NPS0554
FUNCTION NOT EXECUTED BECAUSE SUBSYSTEM SM2 IN STATE ’IN HOLD’, ’IN DELETE’ OR
ALREADY DELETED
Meaning
The system administrator has held or stopped the SM2 subsystem.
As a result, a number of SM2 functions can no longer be executed.
Response
Repeat the function as soon as SM2 is available again.
NPS0555
VERSION OF SM2 MODULE LIBRARY IS (&00)
(B) Routing code: R Weight: 50
NPS0558
SM2 LOGGING FILE ALREADY OPEN. STATEMENT REJECTED
Meaning
A non-standard SM2 logging file with the specified name has already been opened.
U3585-J-Z125-8-76
385
NPS0559
NPS0559
Messages
WARNING: 256 DEVICES SELECTED AND INVALID DEVICES IN WILDCARD LIST. SURPLUS AND
INVALID DEVICES IGNORED
Meaning
- More than 256 devices were selected by the DEVICE definition in the
- //SET-DISK-PARAMETER or //SET-SERVICETIME-PARAMETER statement.
- As the number of devices that can be monitored is limited to 256, collection of
- corresponding statistics begins with exactly 256 devices and
- any surplus devices are not monitored.
- The criteria for selecting these 256 devices are described in the BS2000 manual ’SM2’.
- Moreover there were invalid devices in the wildcard list.
- Invalid devices are:
- devices which are not attached
- GS volumes
- Invalid devices are not monitored.
NPS0560
MONITORING PROGRAM RECORD COULD NOT BE WRITTEN. TRY AGAIN LATER
Meaning
Collection of statistics has not been activated.
NPS0561
WARNING: 256 DEVICES SELECTED. SURPLUS DEVICES IGNORED
Meaning
- More than 256 devices were selected by the DEVICE definition in the
- //SET-DISK-PARAMETER or //SET-SERVICETIME-PARAMETER statement.
- As the number of devices that can be monitored is limited to 256, collection of
- corresponding statistics begins with exactly 256 devices and any surplus devices are
- not monitored.
- The criteria for selecting these 256 devices are described in the BS2000 manual ’SM2’.
NPS0562
OPERATING SYSTEM RUNNING IN NATIVE MODE. VM STATISTICS NOT AVAILABLE. STATEMENT
REJECTED
Meaning
Collection of VM statistics cannot be activated as no VM2000 system is currently being
used.
NPS0563
OPERATING SYSTEM EMBEDDED IN VM2000 SYSTEM AS NON-PRIVILEGED GUEST SYSTEM. VM
STATISTICS NOT PERMITTED. STATEMENT REJECTED
Meaning
Collection of VM statistics can only be activated on the privileged machine VM1 of a
VM2000 system.
386
U3585-J-Z125-8-76
Messages
NPS0564
NPS0564
WARNING: INVALID DEVICES IN WILDCARD LIST. INVALID DEVICES IGNORED.
Meaning
In the specified wildcard list some invalid devices were found.
Invalid devices are:
- devices which are not attached
- GS volumes
The invalid devices are not monitored.
NPS0565
SYNTAX ERROR. INVALID BUCKET VALUES
Meaning
Only 1-5 bucket values may be specified in a list.
The values must be in ascending order.
Permissible value range: 1 to 99999.
The statement has been rejected.
NPS0566
NAME OF CONNECTION SET INVALID
Meaning
Possible reasons:
The specified name has not been defined in the statement
//REMOVE-CONNECTION-SET.
- The specified name has already been defined in the statement
//ADD-CONNECTION-SET.
The statement has been rejected.
NPS0567
’//SET-RESPONSETIME-PARAMETER’ STATEMENT NOT SPECIFIED. STATEMENT REJECTED
Meaning
The //MODIFY-RESPONSETIME-PARAMETER or //ADD-CONNECTION-SET statement
cannot be specified unless //SET-RESPONSETIME-PARAMETER statement
is specified first.
The statement has been rejected.
Response
Enter the //SET-RESPONSETIME-PARAMETER statement and repeat your original entry.
NPS0568
MORE THAN 15 CONNECTION SETS DEFINED
Meaning
The connection set ’*GLOBAL=(*ALL, *ALL, *ALL)’ is always defined additionally.
The statement has been rejected.
Response
Use the //REMOVE-CONNECTION-SET statement to terminate monitoring of superfluous
connection sets and repeat your original entry.
U3585-J-Z125-8-76
387
NPS0569
NPS0569
Messages
MORE THAN 15 CONNECTION GROUPS DEFINED
Meaning
’(*ALL, *ALL, *ALL)’ is always defined additionally as a connection group.
The statement has been rejected.
Response
Use the //REMOVE-CONNECTION-SET statement to terminate monitoring of superfluous
connection groups and repeat your original entry.
NPS0570
SYSTEM ERROR WHEN STARTING MONITORING PROGRAM FOR DISK STATISTICS. DISK
STATISTICS NOT STARTED
Meaning
The number of cylinders per volume could not be determined.
NPS0571
SYNTAX ERROR. INVALID SORT CRITERION IN ’//SET-PERIODIC-TASK-PARAMETER
STATEMENT’
Meaning
The statement has been rejected.
NPS0572
WARNING: USER TASK STATISTICS STARTED WITHOUT MEASUREMENT OF RESPONSE TIME
VALUES
Meaning
No response time values can be recorded for the user task statistics as the subsystem
BCAM-SM2 could not be loaded or initiated.
NPS0573
INCONSISTENT OPERAND VALUES FOR ISAM POOL DEFINITION
Meaning
The statement has been rejected.
NPS0574
FILE ALREADY SUBMITTED FOR MONITORING
Meaning
The statement has been rejected.
NPS0575
SM2 TERMINATED BY ’/STOP-SUBSYSTEM SUBSYSTEM-NAME=SM2,FORCED=YES’
Meaning
The system administrator has deleted the SM2 subsystem, thereby automatically terminating all tasks still connected to SM2.
NPS0576
ISAM POOL ALREADY BEING MONITORED. STATEMENT REJECTED
Meaning
The ISAM pool submitted by the user for ISAM pool monitoring is already being monitored.
388
U3585-J-Z125-8-76
Messages
NPS0577
NPS0577
TOO MUCH USERS MONITOR THE SAME ISAM POOL
Meaning
Maximal 64 users can monitor the same ISAM POOL at the same time.
Statement rejected.
NPS0578
INVALID CACHE-ID. PERMISSIBLE VALUE RANGE: 0 TO 62
Meaning
The statement has been rejected.
NPS0579
INVALID OBJECT SPECIFICATION IN ’//SET-PERIODIC-TASK-PARAMETER’ STATEMENT
Meaning
The statement has been rejected.
NPS0580
INVALID FILENAME
Meaning
Possible reasons: The filename is invalid, because
- the specified USER ID doesn’t exist,
- the filename is too long,
- the complete filename with CAT ID and USER ID is too long,
- the filename with relative FGG is not cataloged.
NPS0581
USER ID(S) ’(&00)’ DO NOT EXIST.
Meaning
An attempt was made to enable a user monitoring run for not existing USER ID(S). The
statement has been rejected.
NPS0590
MONITORING PROGRAM ’(&00)’ INVALID DEFINED. STATEMENT REJECTED
Meaning
It was attempted to start a monitoring program with invalid channels.
Invalid channels are:
- Channels, which are not any more in the configuration
Response
Check and correct monitoring program definition.
NPS0591
WARNING: MONITORING PROGRAM ’(&00)’ PARTLY INVALIDLY DEFINED. INVALID CHANNELS
IGNORED
Meaning
While starting a monitoring program, it was found that some invalid channels were selected.
The monitoring program is only started with the valid channels; the invalid channels are not
monitored.
Invalid channels are:
- Channels, which are not any more in the configuration
U3585-J-Z125-8-76
389
NPS0600
NPS0600
Messages
UNRECOVERABLE ERROR IN SM2 MODULES
(B) Routing code: R Weight: 99
Meaning
With this message number a SERSLOG record is written.
NPS0603
UNKNOWN DATA PASSED THROUGH BOURSE
Meaning
The contents of bourse parameter RDATA is unknown to the gatherer task.
A SERSLOG record is written.
NPS0700
Host: ’(&00)’
Meaning
This host sends the following SM2 message.
NPS0701
SELECTED HOST NOT AVAILABLE. STATEMENT REJECTED
Meaning
The selected host is not available.
Possible reasons are:
- host name syntactically incorrect
- host not connected
- subsystem MSCF not available
- no host information in MSCF configuration
- SM2 version of remote host does not match
parameters of //SELECT-HOST compete with one another
- connection to remote host interrupted
- subsystem SM2 on remote host not available
NPS0710
’(&01)’ MACRO ERROR: ’(&00)’
Meaning
(&01) macro returns (&00).
NPS3003
TIME STAMP ’(&00)’ OF INPUT FILE ’(&02)’ IS EARLIER THAN LAST TIME STAMP ’(&01)’
OF OUTPUT FILE
(B) Routing code: R Weight: 99
Meaning
The time stamps of a SM2 logging file must be in ascending order.
The statement has been rejected.
390
U3585-J-Z125-8-76
Messages
NPS3004
NPS3004
INVALID INPUT FILE ’(&00)’
(B) Routing code: R Weight: 99
Meaning
The specified input file is not
- a SM2 logging file although SM2 logging files are assumed to be handled
- a user logging file although user logging files are assumed to be handled.
The statement has been rejected.
NPS3006
/SET-FILE-LINK COMMAND WITH ’LINK-NAME=SM2UI1’ MISSING FOR INPUT FILE
(B) Routing code: R Weight: 99
NPS3007
’SM2U1’ UTILITY ROUTINE TERMINATED NORMALLY
(B) Routing code: R Weight: 50
Meaning
The SM2U1 utility routine has terminated without errors.
NPS3008
’SM2U1’ UTILITY ROUTINE TERMINATED ABNORMALLY
(B) Routing code: R Weight: 99
Meaning
A previously reported error caused the SM2U1 utility routine to be terminated abnormally
(TERMJ).
NPS3009
WARNING: CLOSE RECORD ADDED TO FILE ’(&00)’
(B) Routing code: R Weight: 50
Meaning
The last record in the specified file is not a CLOSE record (record 22 with CLOSE indicator).
Possible reason:
system crash during creation of the SM2 logging file.
To ensure that the monitored data are consistent, the last (possibly incomplete) monitoring
cycle of the input file is not written to the output file. Instead, a CLOSE record with the
indicator ’system crash’ is written.
NPS3010
FILE ’(&00)’ ADDED
(B) Routing code: R Weight: 50
Meaning
The file with the specified name (&00) has been added to the output file.
NPS3011
START TIME=(&00), END TIME=(&01)
(B) Routing code: R Weight: 50
NPS3012
NUMBER OF RECORDS WRITTEN = (&00)
(B) Routing code: R Weight: 50
Meaning
The last input file has been processed. Before the program terminates, the user is informed
of how many records have been written to the output file.
U3585-J-Z125-8-76
391
NPS3013
NPS3013
Messages
NUMBER OF MISSING RECORDS = (&00)
(B) Routing code: R Weight: 50
Meaning
During processing of the input file, the total number of records which SM2 could not put out
is added up. This number is put out when processing has been completed, unless it is zero.
NPS3014
NAME OF OUTPUT FILE: ’(&00)’
(B) Routing code: R Weight: 50
NPS3015
INTERNAL SYSTEM ERROR DURING PROCESSING OF BS2000 MACRO ’(&00)’, RETURN CODE
’(&01)’
(B) Routing code: R Weight: 99
Meaning
This message is for diagnostic purposes only.
NPS3016
/SET-FILE-LINK COMMAND WITH ’LINK-NAME=SM2UO’ MISSING FOR OUTPUT FILE
(B) Routing code: R Weight: 99
NPS3017
OUTPUT FILE ’(&00)’ IS NOT SM2 LOGGING FILE
(B) Routing code: R Weight: 99
Meaning
This message can occur only when an existing output file is to be extended
(OPEN-MODE=EXTEND).
NPS3018
DMS ERROR IN OUTPUT FILE. DMS CODE ’(&00)’. /HELP-MSG DMS(&00)
(B) Routing code: R Weight: 99
Meaning
For more detailed information about the DMS error code enter /HELP-MSG or see the
BS2000 manual ’System Messages’.
NPS3019
DMS ERROR IN INPUT FILE ’(&01)’. DMS CODE ’(&00)’. /HELP-MSG DMS(&00)
(B) Routing code: R Weight: 99
Meaning
For more detailed information about the DMS error code enter /HELP-MSG or see the
BS2000 manual ’System Messages’.
NPS3020
INVALID RECORD IN INPUT FILE ’(&00)’
(B) Routing code: R Weight: 99
Meaning
The specified input file contains an incorrect record, e.g. a record with record length 0.
392
U3585-J-Z125-8-76
Messages
NPS3021
NPS3021
SM2U1 HANDLES SM2 LOGGING FILES
NPS3022
FILE(S) ’(&00)’ TRANSFERED TO OUTPUT FILE
NPS3023
SM2U1 HANDLES USER LOGGING FILES
NPS3024
SPECIFIED ’LAST-INDEX=(&00)’ GREATER THAN HIGHEST FILE INDEX ’(&01)’. OPERAND
’*LAST’ ASSUMED
Meaning
The specified LAST-INDEX value in the //SEPARATE-FILES statement is greater than the
highest file index (&01) in the input file. All the data up to the end of the input file will be
transferred to the output file.
NPS3025
SPECIFIED ’FIRST-INDEX=(&00)’ GREATER THAN HIGHEST FILE INDEX ’(&01)’ IN INPUT
FILE
Meaning
The specified FIRST-INDEX value in the //SEPARATE-FILES statement is greater than the
highest file index (&01) in the input file.
No files have been transferred to the output file.
NPS3026
OUTPUT FILE ’(&00)’ IS NOT USER LOGGING FILE
Meaning
This message can occur only when an existing output file is to be extended
(OPEN-MODE=EXTEND).
NPS3027
/SET-FILE-LINK COMMAND WITH ’LINK-NAME=(&00)’ MISSING FOR OUTPUT FILE
NPS3028
/SET-FILE-LINK COMMAND WITH ’LINK=(&00)’ MISSING FOR INPUT FILE
NPS3029
VALUE FOR ’LAST-INDEX’ SMALLER THAN VALUE FOR ’FIRST-INDEX’
NPS3030
FILE INDEX VALUES OF BLOCKS ARE NOT IN ASCENDING ORDER
NPS3031
ONLY ’BUFFER-LENGTH=*STD(SIZE=16)’ PERMITTED FOR OUTPUT FILE ’(&00)’.
Meaning
Output files are only permitted with ’BUFFER-LENGTH=*STD(SIZE=16)’.
The value of the BUFFER-LENGTH operand in the /ADD-FILE-LINK command for the
output file is invalid or the existing output file (OPEN-MODE=EXTEND) has a wrong
BUFFER-LENGTH.
Response
Retry the /ADD-FILE-LINK command without operand BUFFER-LENGTH or convert the
existing output file with SM2U1.
NPS4102
SPECIFIED TIMES IN DEFINITION OF ANALYSIS INTERVAL NOT IN ASCENDING ORDER
(B) Routing code: R Weight: 99
Meaning
The start time output for the analysis interval is greater than the corresponding end time.
U3585-J-Z125-8-76
393
NPS4139
NPS4139
Messages
SPECIFIED TIMES IN DEFINITION OF TIME WINDOW NOT IN ASCENDING ORDER
(B) Routing code: R Weight: 99
Meaning
The specified start time of a time window is greater than the corresponding end time.
NPS4140
TIME WINDOWS OVERLAPPING OR NOT IN ASCENDING ORDER
(B) Routing code: R Weight: 99
NPS4145
’24:00’ NOT PERMITTED AS START TIME FOR TIME WINDOW
(B) Routing code: R Weight: 99
NPS4146
ILLEGAL TIME SPECIFICATION (LATER THAN 24:00)
(B) Routing code: R Weight: 99
NPS4147
INVALID YEAR SPECIFIED
Meaning
Year-specifications are only allowed from 0-99 and 1960-2059.
NPS4154
’*SUMMARY’ ONLY PERMITTED AS FIRST ELEMENT IN LIST
(B) Routing code: R Weight: 99
Meaning
Possible reasons:
- *SUMMARY was specified more than once for disk analysis.
- *SUMMARY was not specified as the first element in a list.
NPS4162
INCONSISTENT VALUES WHEN SELECTING CYLINDER AREA
(B) Routing code: R Weight: 99
Meaning
When selecting a cylinder area either the number selected for the last cylinder is smaller
than the number of the first cylinder, or the subinterval specified by *BY is larger than the
selected cylinder area.
NPS4163
NUMBER OF LINES GREATER THAN 32766. NO ANALYSIS IS POSSIBLE
Meaning
The number of table lines requested implicitly via the *BY operand is greater than 32766.
NPS4200
BLOCK SIZE OF TRANSFER FILE TOO SHORT. PROCESSING ABORTED.
Meaning
The buffer length of the transfer file is too short for the DATA record.
Response
- create the transfer file without specifying a buffer length.
BUFFER-LENGTH=STD(SIZE=16) will be defined automatically.
- reduce the number of analysis subintervals.
394
U3585-J-Z125-8-76
Messages
NPS4310
NPS4310
STATEMENT REJECTED
(B) Routing code: R Weight: 99
Meaning
The statement is invalid and must be reentered corrected.
NPS4311
ERROR DURING STATEMENT ENTRY. SM2R1 TERMINATED ABNORMALLY
(B) Routing code: R Weight: 99
Meaning
Errors in statement input could not be recovered in procedure or in batch mode.
No analysis is possible.
NPS4312
’CONNECTION-SET (&00)’ NOT DEFINED
(B) Routing code: R Weight: 99
Meaning
The name of the connection set is invalid or has not been defined.
NPS4313
’USERID-SET (&00)’ NOT DEFINED
(B) Routing code: R Weight: 99
Meaning
The name of the USER ID set is invalid or has not been defined.
USER ID sets must be defined by means of the //CREATE-USERID-SET statement.
NPS4314
’TSN-SET (&00)’ NOT DEFINED
(B) Routing code: R Weight: 99
Meaning
The name of the task set is invalid or has not been defined.
Task sets must be defined by means of the //CREATE-TSN-SET statement.
NPS4315
’JOBNAME-SET (&00)’ NOT DEFINED
Meaning
The name of the job name set is invalid or has not been defined.
Job name sets must be defined by means of the //CREATE-JOBNAME-SET statement.
NPS4316
’JOBCLASS-SET (&00)’ NOT DEFINED
Meaning
The name of the job class set is invalid or has not been defined.
Job class sets must be defined by means of the //CREATE JOBCLASS-SET statement.
U3585-J-Z125-8-76
395
NPS4317
Messages
NPS4317
MORE THAN MAXIMUM PERMITTED NUMBER OF ’(&00)’ DEFINED
NPS4318
SDF SYNTAX FILE DEFECTIVE OR INCORRECTLY ACCESSED. CONTACT THE SYSTEM
ADMINISTRATOR
Meaning
Either no SDF syntax file has been assigned or the one assigned is invalid or cannot be
accessed.
NPS4319
SYSTEM ERROR WHEN PROCESSING SDF STATEMENTS. SDF RETURN CODE ’(&00)’
Response
Contact the system administrator.
NPS4320
NUMBER OF ANALYSIS PART-INTERVALS TOO HIGH
Meaning
The analysis interval is divided in too many part-intervals. The maximal number of intervals
is 8000.
Response
Choose longer part-intervals.
NPS4321
WRONG ITEM NUMBER (&01) FOR REPORT (&00)
Meaning
An item number (&01) which does not exist for report (&00) was given.
NPS4322
SYNTAX ERROR. ’LOWER-LIMIT’ GREATER THAN ’UPPER-LIMIT’. STATEMENT REJECTED
Response
Correct the statement and try again.
NPS4350
SM2 LOGGING FILE INCORRECTLY. ANALYSIS NOT POSSIBLE.
Meaning
Possible reasons:
- the assigned SM2 logging file is empty
- the assigned file is not a SM2 logging file
- the assigned file does not have SAM format
- the version of SM2 logging file is lower than V9.5A
NPS4351
SM2 LOGGING FILE CONTAINS NO VALID TIME STAMP RECORD. ANALYSIS NOT POSSIBLE
(B) Routing code: R Weight: 99
396
U3585-J-Z125-8-76
Messages
NPS4354
NPS4354
SM2 LOGGING FILE CONTAINS NO CLOSE RECORD. ANALYSIS NOT COMPLETELY
Meaning
The SM2 logging file was not correctly closed.
Possible reasons are
- SM2 system task has abnormally terminated
- system crash
during creation of SM2 logging file.
Response
The file can be repaired by issuing the command
//REPAIR-DISK-FILES FILE-STATUS=*ANY (FILE-NAME=dateiname).
Subsequently, a CLOSE record should be attached with SM2U1.
NPS4451
TIME STAMP OF CURRENT RECORD ’(&00)’ EARLIER THAN LAST TIME STAMP ’(&01)’
(B) Routing code: R Weight: 99
Meaning
The time stamps in the SM2 logging file are not in ascending order.
NPS4452
SPECIFIED END TIME OF ANALYSIS INTERVAL SMALLER THAN FIRST TIME STAMP OF SM2
LOGGING FILE ’(&00)’
(B) Routing code: R Weight: 99
NPS4453
NPS4503
SPECIFIED START TIME OF ANALYSIS INTERVAL GREATER THAN LAST TIME STAMP OF SM2
LOGGING FILE ’(&00)’
(&00) ACCESSES TO CYLINDER NUMBERS WITH UNKNOWN ADDRESS
(B) Routing code: R Weight: 99
Meaning
(&00): Number of disk accesses for which SM2 could not determine the cylinder number.
NPS4504
(&00) ACCESSES TO BLOCK NUMBERS WITH UNKNOWN ADDRESS
Meaning
(&00): Number of disk accesses for which SM2 could not determine the block number.
NPS4551
NO MEASUREMENTS FOUND FOR TASK ANALYSIS
(B) Routing code: R Weight: 50
Meaning
Task analysis was requested but the SM2 logging file does not contain any task records in
the specified analysis interval.
NPS4552
NO MEASUREMENTS FOUND FOR SPECIFIED ’TSN-SET (&00)’
(B) Routing code: R Weight: 50
Meaning
The SM2 logging file contains no TSNs of the specified TSN set in the given analysis period.
U3585-J-Z125-8-76
397
NPS4553
NPS4553
Messages
NO MEASUREMENTS FOUND FOR SPECIFIED ’USERID-SET (&00)’
(B) Routing code: R Weight: 50
Meaning
The SM2 logging file contains no USER IDs of the specified USER ID set in the given
analysis period.
NPS4555
NO MEASUREMENTS FOUND FOR QUEUE TRANSITION
(B) Routing code: R Weight: 50
Meaning
Task queue analysis was requested but the SM2 logging file does not contain any queue
records in the given analysis interval.
NPS4556
NO MEASUREMENTS FOUND FOR DISK STATISTICS
(B) Routing code: R Weight: 50
Meaning
Disk statistics were requested but the SM2 logging file contains no disk access records in
the given analysis interval.
NPS4557
NO MEASUREMENTS FOUND FOR SPECIFIED ’JOBNAME-SET (&00)’
Meaning
The SM2 logging file contains no job names of the specified job name set in the given
analysis period.
NPS4558
NO MEASUREMENTS FOUND FOR SPECIFIED ’JOBCLASS-SET (&00)’
Meaning
The SM2 logging file contains no job classes of the specified job class set in the given
analysis period.
NPS4559
NO MEASUREMENTS FOUND FOR HSMS STATISTICS
Meaning
Hsms statistics were requested but the SM2 logging file contains no hsms records in the
given analysis interval.
NPS4601
INTERNAL EAM MACRO ERROR. CODE=(&00)
(B) Routing code: R Weight: 99
Meaning
An EAM call returns the specified error information.
NPS4651
NO MEASUREMENTS FOUND FOR DISTRIBUTION OF HEAD MOVEMENTS FOR ’(&00)’
(B) Routing code: R Weight: 50
Meaning
The disk (&00) for which analysis was requested was not active in the analysis period or
was not monitored.
398
U3585-J-Z125-8-76
Messages
NPS4652
NPS4652
NO MEASUREMENTS FOUND FOR DISTRIBUTION OF SERVICE TIMES FOR ’(&00)’
(B) Routing code: R Weight: 50
Meaning
The disk (&00) for which analysis was requested was not active in the analysis period or
was not monitored.
NPS4653
NO MEASUREMENTS FOUND FOR DISTRIBUTION OF I/O REQUESTS FOR ’(&00)’
(B) Routing code: R Weight: 50
Meaning
The disk (&00) for which analysis was requested was not active in the analysis period or
was not monitored.
NPS4654
NO MEASUREMENTS FOUND FOR SUMMARY OF I/O REQUESTS
(B) Routing code: R Weight: 50
Meaning
In the analysis period either no disk was monitored by SM2 or none of the monitored disks
was active.
NPS4655
NO MEASUREMENTS FOUND FOR SUMMARY OF HEAD MOVEMENTS
(B) Routing code: R Weight: 50
Meaning
In the analysis period either no disk was monitored by SM2 or none of the monitored disks
was active.
NPS4656
NO MEASUREMENTS FOUND FOR SUMMARY OF SERVICE TIMES
(B) Routing code: R Weight: 50
Meaning
In the analysis period either no disk was monitored by SM2 or none of the monitored disks
was active.
NPS4657
NO DATA FOUND FOR OUTPUT OF CONFIGURATION
Meaning
The SM2 logging file contains no configuration data for the selected analysis period.
NPS4658
DATA FOR OUTPUT OF CONFIGURATION IS INCOMPLETE
Meaning
The SM2 logging file does not contain all configuration data.
No output of configuration data.
NPS4751
INPUT CONTROL FILE ’MTFILE’ HAS VERSION (&00)
(B) Routing code: R Weight: 50
U3585-J-Z125-8-76
399
NPS4801
NPS4801
Messages
INSUFFICIENT VIRTUAL ADRESS SPACE FOR ANALYSIS
(B) Routing code: R Weight: 99
Meaning
The storage space requested by the program could not be made available.
The analysis run can be restarted using fewer reports.
NPS4853
NO MEASUREMENTS FOUND DURING ANALYSIS INTERVAL FOR ’(&00)’
Meaning
SM2 did not monitor the variable (&00) in the specified analysis interval.
NPS4854
(&00) SUPPRESSED DUE TO REPORT CONDITION
Meaning
Report (&00) suppressed because measurements are in given range.
NPS4901
VERSIONS OF ’SM2R1’ AND ’MTFILE’ INCOMPATIBLE
(B) Routing code: R Weight: 99
NPS4951
NO PERFORMANCE DATA AVAILABLE FOR CPU TYPE ’(&00)’. CONTACT SYSTEM ADMINISTRATOR
(B) Routing code: R Weight: 99
Meaning
Automatic analysis is not possible without limit values for the specified CPU type.
NPS4953
MONITORED DATA FOR ’(&00)’ REQUIRED TO COMPLETE AUTOMATIC ANALYSIS
(B) Routing code: R Weight: 99
Meaning
Automatic analysis should be conducted using all the required data (cf. the BS2000 manual
’SM2’), otherwise it is possible that bottlenecks will remain undetected.
NPS4954
NO VM2000 RECORD FOUND. NO RELATIVATION OF PERFORMANCE DATA
Meaning
Automatic analysis needs the CPU QUOTA of VM2000 record for relativation of performance data.
NPS5000
UNKNOWN ERROR CODE ’(&00)’ OR SUBCODE ’(&01)’ DELIVERED FROM SM2
(B) Routing code: R Weight: 99
Meaning
SM2 delivered an error code (&00) or a subcode (&01) referring to a non-existent message.
NPUCOPY
Copyright (C) ’(&00)’ ’(&01)’ All Rights Reserved
NPULOAD
Program ’(&00)’, Version ’(&01)’ of ’(&02)’ loaded from file ’(&03)’
NPUSTRT
Procedure ’(&00)’, Version ’(&01)’ of ’(&02)’ started from file ’(&03)’
400
U3585-J-Z125-8-76
9 Installation
The SM2 software monitor system is supplied on a product tape with the files required for
the SM2 monitoring program and the SM2R1 and SM2U1 utility routines. The following
individual files are included:
SM2
SM2U1
SM2R1
SYSLNK.SM2.130
SRMLNK.SM2.130
SYSLNK.SM2.130.SM2
SYSLNK.SM2.130.SM2U1
SYSLNK.SM2.130.SM2R1
SYSRMS.SM2.130
SYSNRF.SM2.130
SYSSII.SM2.130
SYSLIB.SM2.130
Prephases for loading and starting the corresponding
phases from the libraries listed below
SYSDAT.SM2.130.MTFILE
SYSMSP.SM2.130.D
SYSMSP.SM2.130.E
SYSSPR.SM2.130.SM2R1
Control file for SM2R1
PLI1 text file for SM2R1 (German)
PLI1 text file for SM2R1 (English)
Procedure for the START-SM2R1 command
SYSSDF.SM2.130
Syntax file with all statements and commands
(SM2, SM2U1, SM2R1)
SYSMES.SM2.130
SYSSSC.SM2.130
SIPLIB.SM2.130
SYSFGM.SM2.130.D
SYSFGM.SM2.130.E
Message file for SM2,SM2U1,SM2R1
DSSM declarations for SM2 (for /390 systems only)
Contains the “restricted macros” of SM2
Release notice (German)
Release notice (English)
U3585-J-Z125-8-76
Loadable parts of SM2 (for /390 systems only)
Loadable parts of SM2 (for SR2000 systems only)
Loadable parts of SM2
Loadable parts of SM2U1
Loadable parts of SM2R1
Loader package for SM2
Auxiliary file for REP processing
Declaration file for IMON
C header files for program interface, sample procedures
401
Installation
Installation procedure
Standard installation of the SM2 monitoring program is via the product IMON. The following
basic steps must be performed when installing without IMON:
1. Read in the product tape. It is recommended that the default user ID (defined using the
system parameter DEFLUID) be used as the installation ID for SM2. Alternatively, you
can use an ID which has been assigned the monitoring privilege SW-MONITORADMINISTRATION (TSOS has been assigned this privilege by default).
The SYSREP.SM2.130 file must be created from the loader package
SYSRMS.SM2.130 using the product RMS.
The system expects to find the following files in the default user ID. They are specified
in the supplied subsystem declaration. If they are installed under a different ID, the
subsystem declaration must be modified accordingly.
–
–
–
SYSLNK.SM2.130
SYSREP.SM2.130
SYSNRF.SM2.130
2. The SYSMES.SM2.130 message file is activated with the aid of the BS2000 command
MODIFY-MSG-FILE-ASSIGNMENT.
3. No changes can be made in the SM2 subsystem declaration except for the ID under
which the objects to be loaded dynamically are stored.
4. For the monitoring programs RESPONSETIME and UTM, SM2 requires the
subsystems BCAM-SM2 and UTM-SM2. The files belonging to these subsystems are
supplied with DCM and UTM themselves.
Activating the syntax file
All statements (START-SM2, START-SM2U1, START-SM2R1) together with the BS2000
commands START-/STOP-TASK-MEASUREMENT are contained in the SYSSDF.SM2.130
syntax file. In order to make these statements available to each user, this syntax file must
be activated.
The following command is used to activate the syntax file:
/MODIFY-SDF-PARAMETER SCOPE=*PERMANENT,
SYNTAX-FILE-TYPE=*SUBSYSTEM(NAME=SYSSDF.SM2.130,SUBSYSTEM-NAME=SM2)
402
U3585-J-Z125-8-76
Installation
Creating a new DSSM catalog
The SM2 monitoring program is loaded and unloaded by the DSSM subsystem
management facility. This requires the SM2 declarations in the valid DSSM catalog. These
declarations are contained in the file SYSSSC.SM2.130, which is supplied along with the
SM2 product tape.
The SM2 declarations of file SYSSSC.SM2.130 must not be modified, with the exception
of the user ID under which the objects to be dynamically loaded are stored. Also, the
address space specification CLASS=3/4 must not be modified. SM2 itself handles the
relocation of modules to class 5 memory, so that the load on the system address space is
kept as low as possible.
To create a new subsystem catalog, it is advisable to update the DSSM configuration file
(sample name SYSSSC.KONF.130) with the following SSCM statements:
Example
Writing to the DSSM configuration file
/START-SSCM
//START-CATALOG-MODIFICATION CATALOG-NAME=SYSSSC.KONF.130
:
:
//MODIFY-SUBSYSTEM-ATTRIBUTES
Statements for other subsystems
:
:
//ADD-CATALOG-ENTRY FROM-FILE=SYSSSC.SM2.130
//CHECK-CATALOG
//SAVE-CATALOG
//END
The new subsystem catalog is automatically generated or modified using the SSCM
statement SAVE-CATALOG. However, this catalog does not become valid until the system
is restarted, in which case it must be explicitly specified. Alternatively, the catalog can be
added during the system run using the command /ADD-SUBSYSTEM
CATALOG=SYSSSC.KONF.130, TYPE=EXTENDED-ACTIVE-CONFIGURATION.
For notes and further information see the manuals “System Installation” [7] and “Introductory Guide to Systems Support” [6].
U3585-J-Z125-8-76
403
Installation
Loading and unloading the subsystem
The SM2 subsystem is generated and started for the first time under an ID which has been
assigned the privilege SW-MONITOR-ADMINISTRATION. This loads the SM2 modules.
The BCAM-SM2 subsystem required for the RESPONSETIME monitoring program is only
loaded when it is required. The required subsystem UTM-SM2 is not started by SM2 (see
the UTM manual “Generating and Administering Applications” [10] and “UTM Monitored
data on UTM applications” on page 53 in the present manual).
The SM2 subsystem can also be loaded via the DSSM command /START-SUBSYSTEM
SUBSYSTEM-NAME=SM2. SM2 can then be started (/START-SM2) under any user ID.
The SM2 subsystem exists until it is unloaded via the DSSM command /STOPSUBSYSTEM SUBSYSTEM-NAME=SM2. The SM2 output file is implicitly closed when
/STOP-SUBSYSTEM SUBSYSTEM-NAME=SM2 is specified. Likewise, permission for
task monitoring by the user is retracted. Authorization beyond that granted by the
monitoring privilege SW-MONITOR-ADMINISTRATION is required to execute the DSSM
commands (SUBSYSTEM-MANAGEMENT). Unconditional unloading with /STOPSUBSYSTEM SUBSYSTEM-NAME=SM2,FORCED=*YES is possible, but it should only
be applied in the event of problems.
The system administrator can obtain information on the current status of the SM2
subsystem by issuing the command /SHOW-SUBSYSTEM-STATUS SUBSYSTEMNAME=SM2.
404
U3585-J-Z125-8-76
10 Appendix
10.1 SDF syntax description
This syntax description is based on SDF Version 4.1A. The syntax of the SDF command/
statement language is explained below in three tables.
Table 9: Metasyntax
Command and statement formats use certain characters and forms of representation; their
meanings are described in Table 9.
Table 10: Data types
Variable operand values are represented in SDF by means of data types. Each data type
represents a certain set of values. The number of data types is limited to the data types
described in Table 10.
The description of data types is valid for all commands and statements, and operand
descriptions describe only the deviations from Table 10.
U3585-J-Z125-8-76
405
SDF syntax description
Appendix
Table 11: Suffixes for data types
Data type suffixes define additional rules for data type input. They contain a length or
interval specification and can be used to limit the set of values (suffix begins with without),
extend it (suffix begins with with), or declare a particular task mandatory (suffix begins with
mandatory). The following short forms are used in this manual for data type suffixes:
cat-id
completion
correction-state
generation
lower-case
manual-release
odd-possible
path-completion
separators
temporary-file
under-score
user-id
version
wildcard-constr
wildcards
cat
compl
corr
gen
low
man
odd
path-compl
sep
temp-file
under
user
vers
wild-constr
wild
For the data type “integer”, Table 11 also contains units in italics; they are not part of the
syntax and serve simply to make it easier to read.
For special data types that are checked by the implementation, Table 11 contains suffixes
in italics (see suffix special), which are not part of the syntax.
The description of data type suffixes is valid for all commands and statements, and operand
descriptions describe only the deviations from Table 11.
406
U3585-J-Z125-8-76
Appendix
SDF syntax description
Metasyntax
Representation
Meaning
Examples
UPPERCASE
LETTERS
Uppercase letters denote keywords
(command, statement and operand
names, keyword values) and
constant operand values.
Keywords begin with *
HELP-SDF
UPPERCASE
LETTERS
in boldface
Uppercase letters printed in
boldface denote guaranteed or
suggested abbreviations of
keywords.
GUIDANCE-MODE = *YES
=
The equals sign connects an
operand name with the associated
operand values.
GUIDANCE-MODE = *NO
< >
Angle brackets denote variables
whose range of values is described
by data types and suffixes (see
Tables 10 and 11).
SYNTAX-FILE = <filename 1..54>
Underscoring
Underscoring denotes the default
value of an operand.
GUIDANCE-MODE = *NO
/
A slash serves to separate
alternative operand values.
NEXT-FIELD = *NO / *YES
(…)
Parentheses denote operand
values that initiate a structure.
,UNGUIDED-DIALOG = *YES (...) / *NO
[ ]
Square brackets denote operand
values which introduce a structure
and are optional. The subsequent
structure can be specified without
the initiating operand value.
SELECT = [*BY-ATTRIBUTES](...)
Indentation
Indentation indicates that the
operand is dependent on a higherranking operand.
,GUIDED-DIALOG = *YES (...)
SCREEN-STEPS = *NO
*YES(...)
SCREEN-STEPS = *NO /
*YES
Table 9: Metasyntax (part 1 of 2)
U3585-J-Z125-8-76
407
SDF syntax description
Representation
,
list-poss(n):
Alias:
Appendix
Meaning
Examples
A vertical bar identifies related
operands within a structure. Its
length marks the beginning and
end of a structure. A structure may
contain further structures. The
number of vertical bars preceding
an operand corresponds to the
depth of the structure.
SUPPORT = *TAPE(...)
A comma precedes further
operands at the same structure
level.
*TAPE(...)
VOLUME = *ANY(...)
*ANY(...)
...
GUIDANCE-MODE = *NO / *YES
,SDF-COMMANDS = *NO / *YES
The entry “list-poss” signifies that a
list of operand values can be given
at this point. If (n) is present, it
means that the list must not have
more than n elements. A list of
more than one element must be
enclosed in parentheses.
list-poss: *SAM / *ISAM
The name that follows represents a
guaranteed alias for the command
or statement name.
HELP-SDF
list-poss(40): <structured-name 1..30>
list-poss(256): *OMF / *SYSLST(...) /
<filename 1..54>
Alias: HPSDF
Table 9: Metasyntax (part 2 of 2)
408
U3585-J-Z125-8-76
Appendix
Data types
Data types
Data type
Character set
Special rules
alphanum-name A…Z
0…9
$, #, @
cat-id
A…Z
0…9
command-rest
freely selectable
Not more than 4 characters;
must not begin with the string PUB
composed-name A…Z
0…9
$, #, @
hyphen
period
catalog ID
Alphanumeric string that can be split into
multiple substrings by means of a period or
hyphen.
If a file name can also be specified, the string
may begin with a catalog ID in the form :cat: (see
data type filename).
c-string
EBCDIC character
Must be enclosed within single quotes;
the letter C may be prefixed; any single quotes
occurring within the string must be entered
twice.
date
0…9
Structure identifier:
hyphen
Input format: yyyy-mm-dd
device
A…Z
0…9
hyphen
Character string, max. 8 characters in length,
corresponding to a device available in the
system. In interactive prompting, SDF displays
the valid operand values. For notes on possible
devices, see the relevant operand description.
fixed
+, 0…9
period
Input format: [sign][digits].[digits]
yyyy:
mm:
dd:
[sign]:
[digits]:
year; optionally 2 or 4 digits
month
day
+ or 0...9
must contain at least one digit, but may
contain up to 10 characters (0...9, period) apart
from the sign.
Table 10: Data types (part 1 of 6)
U3585-J-Z125-8-76
409
Data types
Appendix
Data type
Character set
Special rules
filename
A…Z
0…9
$, #, @
hyphen
period
Input format:
file
file(no)
group
[:cat:][$user.]
(*abs)
group (+rel)
(-rel)
:cat:
optional entry of the catalog identifier;
character set limited to A...Z and 0...9;
maximum of 4 characters; must be enclosed
in colons; default value is the catalog
identifier assigned to the user ID, as
specified in the user catalog.
$user.
optional entry of the user ID;
character set is A…Z, 0…9, $, #, @;
maximum of 8 characters; first character
cannot be a digit; $ and period are
mandatory;
default value is the user' s own ID.
$. (special case)
system default ID
file
file or job variable name;
may be split into a number of partial names
using a period as a delimiter:
name1[.name2[...]]
namei does not contain a period and must
not begin or end with a hyphen;
file can have a max. length of 41 characters;
it must not begin with a $ and must include
at least one character from the range A...Z.
Table 10: Data types (part 2 of 6)
410
U3585-J-Z125-8-76
Appendix
Data types
Data type
Character set
filename
(continued)
Special rules
#file
(special case)
@file (special case)
# or @ used as the first character indicates
temporary files or job variables, depending
on the system parameter.
file(no)
tape file name
no: version number;
character set is A...Z, 0...9, $, #, @.
Parentheses must be specified.
group
name of a file generation group
(character set: as for “file”)
(*abs)
group (+rel)
(-rel)
(*abs)
absolute generation number (1-9999);
* and parentheses must be specified.
(+rel)
(-rel)
relative generation number (0-99);
sign and parentheses must be specified.
integer
0…9, +, -
+ or -, if specified, must be the first character.
name
A…Z
0…9
$, #, @
Must not begin with 0...9.
Table 10: Data types (part 3 of 6)
U3585-J-Z125-8-76
411
Data types
Appendix
Data type
Character set
Special rules
partial-filename
A…Z
0…9
$, #, @
hyphen
period
Input format: [:cat:][$user.][partname.]
:cat:
see filename
$user. see filename
partname
optional entry of the initial part of a name
common to a number of files or file
generation groups in the form:
name1.[name2.[...]]
namei (see filename).
The final character of “partname” must be a
period.
At least one of the parts :cat:, $user. or
partname must be specified.
posix-filename
A...Z
0...9
special characters
String with a length of up to 255 characters;
consists of either one or two periods or of alphanumeric characters and special characters.
The special characters must be escaped with a
preceding \ (backslash); the / is not allowed.
Must be enclosed within single quotes if alternative data types are permitted, separators are
used, or the first character is a ? or !
A distinction is made between uppercase and
lowercase.
posix-pathname A...Z
0...9
special characters
structure identifier:
slash
Input format: [/]part1/.../partn
where parti is a posix-filename;
max. 1023 characters;
must be enclosed within single quotes if alternative data types are permitted, separators are
used, or the first character is a ? or !
Table 10: Data types (part 4 of 6)
412
U3585-J-Z125-8-76
Appendix
Data types
Data type
Character set
Special rules
product-version
A…Z
0…9
period
single quote
Input format:
[[C]' ][V][n]n.nann[' ]
correction status
release status
where n is a digit and a is a letter.
Whether the release and/or correction status
may/must be specified depends on the suffixes
to the data type (see suffixes without-corr,
without-man, mandatory-man and mandatorycorr in Table 11).
product-version may be enclosed within single
quotes (possibly with a preceding C).
The specification of the version may begin with
the letter V.
structured-name A…Z
0…9
$, #, @
hyphen
Alphanumeric string which may comprise a
number of substrings separated by a hyphen.
First character: A...Z or $, #, @
text
freely selectable
For the input format, see the relevant operand
descriptions.
time
0…9
structure identifier:
colon
Time-of-day entry:
hh:mm:ss
Input format:
hh:mm
hh
hh:
hours
Leading zeros may be
mm: minutes
omitted
ss:
seconds
vsn
a) A…Z
0…9
a) Input format: pvsid.sequence-no
max. 6 characters
pvsid:
2-4 characters; PUB
must not be entered
sequence-no: 1-3 characters
b) A…Z
0…9
$, #, @
b) Max. 6 characters;
PUB may be prefixed, but must not be
followed by $, # or @.
Table 10: Data types (part 5 of 6)
U3585-J-Z125-8-76
413
Data types
Appendix
Data type
Character set
Special rules
x-string
Hexadecimal:
00…FF
Must be enclosed in single quotes; must be
prefixed by the letter X. There may be an odd
number of characters.
x-text
Hexadecimal:
00…FF
Must not be enclosed in single quotes;
the letter X must not be prefixed.
There may be an odd number of characters.
Table 10: Data types (part 6 of 6)
414
U3585-J-Z125-8-76
Appendix
Suffixes for data types
Suffixes for data types
Suffix
Meaning
x..y unit
a) with data type integer: interval specification
x
minimum value permitted for “integer”.
x is an (optionally signed) integer.
y
maximum value permitted for “integer”.
y is an (optionally signed) integer.
unit
with “integer” only: additional units.
The following units may be specified:
days
hours
minutes
seconds
byte
2Kbyte
4Kbyte
Mbyte
b) with the other data types: length specification
x
minimum length for the operand value; x is an integer.
y
maximum length for the operand value; y is an integer.
x=y
the length of the operand value must be precisely x.
Exception: for data types catid, date, device, product-version, time and
vsn the length specification is not displayed.
with
-compl
Extends the specification options for a data type.
When specifying the data type “date”, SDF expands two-digit
year specifications in the form yy-mm-dd to:
20yy-mm-dd
19yy-mm-dd
if yy < 60
if yy ≥ 60
-low
Uppercase and lowercase letters are differentiated.
-pathcompl
For specifications for the data type “filename”, SDF adds the catalog and/or
user ID if these have not been specified.
-under
Permits underscores “_” for the data type “name”.
Table 11: Data type suffixes (part 1 of 7)
U3585-J-Z125-8-76
415
Suffixes for data types
Suffix
Appendix
Meaning
with (contd.)
-wild(n)
Parts of names may be replaced by the following wildcards.
n denotes the maximum input length when using wildcards.
Due to the introduction of the data types posix-filename and posixpathname, SDF now accepts wildcards from the UNIX world (referred to
below as POSIX wildcards) in addition to the usual BS2000 wildcards.
However, as not all commands support POSIX wildcards, their use for data
types other than posix-filename and posix-pathname can lead to semantic
errors.
Only POSIX wildcards or only BS2000 wildcards should be used within a
search pattern. Only POSIX wildcards are allowed for the data types posixfilename and posix-pathname. If a pattern can be matched more than once
in a string, the first match is used.
BS2000
wildcards
Meaning
*
Replaces an arbitrary (even empty) character string. If the
string concerned starts with *, then the * must be entered twice
in succession if it is followed by other characters and if the
character string entered does not contain at least one other
wildcard.
TerminaPartially-qualified entry of a name.
ting period Corresponds implicitly to the string “.*”, i.e. at least one other
character follows the period.
/
Replaces any single character.
<sx:sy>
Replaces a string that meets the following conditions:
– It is at least as long as the shortest string (sx or sy)
– It is not longer than the longest string (sx or sy)
– It les between sx and sy in the alphabetic collating
sequence; numbers are sorted after letters (A...Z 0...9)
– sx can also be an empty string (which is in the first position
in the alphabetic collating sequence)
– sy can also be an empty string, which in this position stands
for the string with the highest possible code (contains only
the characters X'FF')
<s1,…>
Replaces all strings that match any of the character combinations specified by s. s may also be an empty string. Any such
string may also be a range specification “sx:sy” (see above).
Table 11: Data type suffixes (part 2 of 7)
416
U3585-J-Z125-8-76
Appendix
Suffixes for data types
Suffix
Meaning
with-wild(n)
(continued)
<s1,…>
Replaces all strings that match any of the character combinations specified by s. s may also be an empty string. Any such
string may also be a range specification “sx:sy” (see above).
-s
Replaces all strings that do not match the specified string s.
The minus sign may only appear at the beginning of string s.
Within the data types filename or partial-filename the negated
string -s can be used exactly once, i.e. -s can replace one of
the three name components: cat, user or file.
Wildcards are not permitted in generation and version specifications for file
names. Only the system administration may use wildcards in user IDs.
Wildcards cannot be used to replace the delimiters in name components cat
(colon) and user ($ and period).
POSIX
wildcards
Meaning
*
Replaces any single string (including an empty string). An *
appearing at the first position must be duplicated if it is followed
by other characters and if the entered string does not include
at least one further wildcard.
?
Replaces any single character; not permitted as the first
character outside single quotes.
[cx-cy]
Replaces any single character from the range defined by cx
and cy, including the limits of the range. cx and cy must be
normal characters.
[s]
Replaces exactly one character from string s.
The expressions [cx-cy] and [s] can be combined into
[s1cx-cys2]
[!cx-cy]
Replaces exactly one character not in the range defined by cx
and cy, including the limits of the range. cx and cy must be
normal characters.
The expressions [!cx-cy] and [!s] can be combined into
[!s1cx-cys2]
[!s]
Replaces exactly one character not contained in string s. The
expressions [!s] and [!cx-cy] can be combined into [!s1cx-cys2]
Table 11: Data type suffixes (part 3 of 7)
U3585-J-Z125-8-76
417
Suffixes for data types
Suffix
Appendix
Meaning
with (contd.)
-wildconstr(n)
Specification of a constructor (string) that defines how new names are to be
constructed from a previously specified selector (i.e. a selection string with
wildcards). See also with-wild. n denotes the maximum input length when
using wildcards.
The constructor may consist of constant strings and patterns. A pattern
(character) is replaced by the string that was selected by the corresponding
pattern in the selector.
The following wildcards may be used in constructors:
Wildcard
Meaning
*
Corresponds to the string selected by the wildcard * in the
selector.
TerminaCorresponds to the partially-qualified specification of a name in
ting period the selector;
corresponds to the string selected by the terminating period in
the selector.
/ or ?
Corresponds to the character selected by the / or ? wildcard in
the selector.
<n>
Corresponds to the string selected by the n-th wildcard in the
selector, where n is an integer.
Allocation of wildcards to corresponding wildcards in the selector:
All wildcards in the selector are numbered from left to right in ascending
order (global index).
Identical wildcards in the selector are additionally numbered from left to right
in ascending order (wildcard-specific index).
Wildcards can be specified in the constructor by one of two mutually
exclusive methods:
1. Wildcards can be specified via the global index: <n>
2. The same wildcard may be specified as in the selector; substitution
occurs on the basis of the wildcard-specific index. For example:
the second “/” corresponds to the string selected by the second “/” in the
selector
Table 11: Data type suffixes (part 4 of 7)
418
U3585-J-Z125-8-76
Appendix
Suffixes for data types
Suffix
Meaning
with-wildconstr
(continued)
The following rules must be observed when specifying a constructor:
–
The constructor must include at least one wildcard of the selector.
–
If the number of identical wildcards exceeds those in the selector, the
index notation must be used.
–
If the string selected by the wildcard <...> or [...] is to be used in the
constructor, the index notation must be selected.
–
The index notation must be selected if the string identified by the
wildcard “*” is to be duplicated. For example:
“<n><n>” must be specified instead of “**”.
–
The wildcard * can also be an empty string. Note that if multiple asterisks
appear in sequence (even with further wildcards), only the last asterisk
can be a non-empty string, e.g. for “****” or “*//*”.
–
Valid names must be produced by the constructor. This must be taken
into account when specifying both the constructor and the selector.
–
Depending on the constructor, identical names may be constructed from
different names selected by the selector. For example:
“A/*” selects the names “A1” and “A2”; the constructor “B*” generates
the same new name “B” in both cases.
To prevent this from occurring, all wildcards of the selector should be
used at least once in the constructor.
–
If the selector ends with a period, the constructor must also end with a
period (and vice versa).
Table 11: Data type suffixes (part 5 of 7)
U3585-J-Z125-8-76
419
Suffixes for data types
Appendix
Suffix
Meaning
with-wildconstr
(continued)
Examples:
Selector
Selection Constructor
New name
A//*
AB1
AB2
A.B.C
D<3><2>
D1
D2
D.CB
C.<A:C>/<D,F>
C.AAD
C.ABD
C.BAF
C.BBF
G.<1>.<3>.XY<2>
G.A.D.XYA
G.A.D.XYB
G.B.F.XYA
G.B.F.XYB
C.<A:C>/<D,F>
C.AAD
C.ABD
C.BAF
C.BBF
G.<1>.<2>.XY<2>
G.A.A.XYA
G.A.B.XYB
G.B.A.XYA
G.B.B.XYB
A//B
ACDB
ACEB
AC.B
A.CB
G/XY/
GCXYD
GCXYE
GCXY.
G.XYC
1)
1) The period at the end of the name may violate naming conventions (e.g. for fully-qualified
file names).
without
Restricts the specification options for a data type.
-cat
Specification of a catalog ID is not permitted.
-corr
Input format: [[C]' ][V][n]n.na[' ]
Specifications for the data type product-version must not include the
correction status.
-gen
Specification of a file generation or file generation group is not permitted.
-man
Input format: [[C]' ][V][n]n.n[' ]
Specifications for the data type product-version must not include either
release or correction status.
-odd
The data type x-text permits only an even number of characters.
-sep
With the data type “text”, specification of the following separators is not
permitted: ; = ( ) < > ? (i.e. semicolon, equals sign, left and right parentheses, greater than, less than, and blank).
-tempfile
Specification of a temporary file is not permitted (see #file or @file under
filename).
Table 11: Data type suffixes (part 6 of 7)
420
U3585-J-Z125-8-76
Appendix
Suffixes for data types
Suffix
Meaning
without
(contd.)
-user
Specification of a user ID is not permitted.
-vers
Specification of the version (see “file(no)”) is not permitted for tape files.
-wild
The file types posix-filename and posix-pathname must not contain a
pattern (character).
mandatory
Certain specifications are necessary for a data type.
-corr
Input format: [[C]' ][V][n]n.nann[' ]
Specifications for the data type product-version must include the correction
status and therefore also the release status.
-man
Input format: [[C]' ][V][n]n.na[nn][' ]
Specifications for the data type product-version must include the release
status. Specification of the correction status is optional if this is not
prohibited by the use of the suffix without-corr.
-quotes
Specifications for the data types posix-filename and posix-pathname must
be enclosed in single quotes.
Table 11: Data type suffixes (part 7 of 7)
U3585-J-Z125-8-76
421
ISP syntax description
Appendix
10.2 ISP syntax description
Format description
The statements issued to SM2 by nonprivileged users comprise the statement names and,
in some statements, additional operands. The statement names and operands must be
separated by at least one blank. Depending on the statement concerned, either positional
or keyword operands can be used. Keyword operands can be entered in any order. If a
statement only contains keyword operands, the comma shown in front of the first operand
in the syntax is omitted. In the statement descriptions, certain metacharacters are used.
These are described in the table below:
Format
notation
Meaning
UPPERCASE
Uppercase letters indicate constants which must NAME=
be entered by the user in precisely this form.
lowercase
Lowercase letters indicate variables for which the NAME=filename
user must substitute appropriate values upon
input, i.e. their contents can vary from case to
case.
{ }
Braces are used to indicate alternatives,
i.e. one entry can or must be selected from the
enclosed values.
[ ]
422
Example
TERMINAL
TER
Square brackets indicate that the enclosed
entries are optional, i.e. may be omitted.
(Parentheses must be entered.)
[,STATS=
Underscoring
Underscoring (underlining) indicates the default
value, i.e. the value used by the system when
none has been explicitly specified.
ON
DISP= OFF
NO
...
Dots indicate repetition, i.e. the preceding
+
syntactical unit may be repeated several times in [
chn-no]...
succession.
-
ON
]
OFF
U3585-J-Z125-8-76
Appendix
ISP syntax description
Length of the statements
A statement issued to SM2 can extend over more than one line. Continuation lines must be
indicated as such by means of a hyphen (continuation character).
When statements are entered via a data display terminal, the continuation character must
be the last character in the line, i.e. the character immediately preceding the ETX character.
When SM2 recognizes a continuation character during interactive data input, it requests the
next input line using the ENTER command.
When statements are entered from a file, the continuation character must be in column 72
of the input line. Characters in column 73 and beyond are ignored in all lines.
The maximum permissible length of an input line is 256 characters. The maximum permissible length of a statement is 512 characters, a string of blanks being counted as a single
blank. SM2 acknowledges the entry of a line or statement that is too long with the message
LINE TRUNCATED or COMMAND OVERLENGTH.
U3585-J-Z125-8-76
423
SM2 statements (overview)
Appendix
10.3 Overview of SM2 statements
The overview is split up in the same way as the descriptions of the statements, separating
the statements for the SM2 administrator and those for the nonprivileged user.
Overview of statements for the SM2 administrator
ADD-BCAM-CONNECTION-SET Add connection set for BCAM-CONNECTION monitoring
SET-NAME = <alphanum-name 1..16>
,CONNECTION-SELECTION = *BY-NEA-NAME(...) / *BY-PORT-NUMBER(...)
*BY-NEA-NAME(...)
CONNECTION-NAME = list-poss(16): *SPECIFIED(...)
*SPECIFIED(...)
LOCAL-APPLICATION = *ANY / <alphanum-name 1..16 with wild>
,PARTNER-APPLICATION = *ANY / <alphanum-name 1..16 with wild>
*BY-PORT-NUMBER(...)
PORT-NUMBER = list-poss(16): *SPECIFIED(...)
*SPECIFIED(...)
LOCAL-PORT-NUMBER = *ANY / <integer 1..65535>
,PARTNER-PORT-NUMBER = *ANY / <integer 1..65535>
,CONNECTION-TYPE = *REMOTE / *LOCAL / *BOTH
,HOST-SELECTION = *ANY / *SPECIFIED(...)
*SPECIFIED(...)
424
LOCAL-HOST-NAME = *LOCAL / <alphanum-name 1..8 with-wild>
,PARTNER-HOST-NAME = *ANY / <alphanum-name 1..8 with-wild>
U3585-J-Z125-8-76
Appendix
SM2 statements (overview)
ADD-CONNECTION-SET - Add connection set for RESPONSETIME monitoring
SET-NAME = <alphanum-name 1..16>
,SET-DEFINITION = *BY-CONNECTION / *EXCEPT-CONNECTION
,CONNECTION-SET = list-poss(5): *CONNECTION(...)
*CONNECTION(...)
APPLICATION = *ALL / <alphanum-name 1..8 with-wild>
,PARTNER = *ALL / <alphanum-name 1..8 with-wild>
,PROCESSOR = *ALL / <alphanum-name 1..8 with-wild>
,CONNECTION-TYPE = *REMOTE / *LOCAL / *BOTH
ADD-COSMOS-EVENT - Define events for monitored data acquisition
EVENT-NAME = *STANDARD-EVENTS / list-poss(67): *STANDARD-EVENTS / *ACF / *BCAM / *BCPT /
*BLS / *BOUR / *CHTM / *CMD / *CMS / *DAB / *DCAM / *DLM / *EIA / *EIA2 / *EIA3 /
*FITC / *GSAC / *HAL / *IDLE / *INTR / *IONQ / *ISEV / *ISPL / *KAI / *LOCK / *MSG / *NSM / *PAGE /
*PAM / *PCCC / *PCTC / *PDEA / *PEND / *PIO / *PMIO / *PRGS / *PRGT / *PRTY / *RELM /
*REQM / *SDV / *SLOT / *SNAP / *STD1 / *STDI / *STDN / *SVC / *TGMA / *TGMP / *TGMT /
*TIC / *TINF / *TLM / *TLT / *TSKI / *TSVC / *UTM / *VMCH / *VMH / *VMI / *VMLK / *VMPD /
*VMPR / *VMS / *VM2 / *WSCT / *XEIA
ADD-FILE - Define file to be monitored
FILE-NAME = <filename 1..54>
U3585-J-Z125-8-76
425
SM2 statements (overview)
Appendix
ADD-ISAM-POOL - Define ISAM pool to be monitored
POOL-NAME = <alphanum-name 1..8>
,SCOPE = *HOST-SYSTEM / *TASK(...) / *USER(...)
*TASK(...)
TSN = <alphanum-name 1..4>
*USER(...)
USER-ID = <alphanum-name 1..8>
,CAT-ID = *HOME-PVS / <catid 1..4>
CALL-ADMINISTRATION-PART - Switch from evaluation part to administration facility
CALL-EVALUATION-PART - Switch from administration facility to evaluation part
CHANGE-MEASUREMENT-PROGRAM - Stop current monitoring program run and restart it with new
monitored objects/monitoring parameters
TYPE = list-poss(12): *BCAM-CONNECTION / *CHANNEL-IO / *COSMOS / *DISK / *DISK-FILE / *FILE /
*ISAM / *PERIODIC-TASK / *RESPONSETIME / *SERVICETIME / *SYSSTAT / *TASK
CLOSE-LOG-FILE - Close SM2 output file
426
U3585-J-Z125-8-76
Appendix
SM2 statements (overview)
END - Terminate SM2 run
INITIATE-COSMOS - Prepare COSMOS monitoring program
MODIFY-ADMINISTRATOR-ADMISSION - Admit additional SM2 administrators
CONCURRENCY = *NO / *YES
(part 1 of 2)
MODIFY-COSMOS-PARAMETER - Modify parameters for COSMOS monitoring
TITLE = *UNCHANGED / <c-string 1..80>
,BUFFER-SIZE = *UNCHANGED / <integer 1..7>
,NUMBER-OF-BUFFERS = *UNCHANGED / <integer 2..128>
,ADDITIONAL-INFO = *UNCHANGED / *NONE / list-poss(2): *CONFIGURATION / *VM2000(...)
*VM2000(...)
FILE-NAME = <filename 1..54 without-gen-vers>
,OUTPUT = *UNCHANGED / *DISK(...) / *WRAP-AROUND(...) / *TAPE(...) / *STREAM-TAPE(...)
*DISK(...)
FILE-NAME = list-poss(16): <filename 1..54 without-gen-vers>
*WRAP-AROUND(...)
FILE-NAME = <filename 1..54 without-gen-vers>
*TAPE(...)
FILE-NAME = list-poss(16): <filename 1..54 without-gen-vers>
Continued ➠
U3585-J-Z125-8-76
427
SM2 statements (overview)
Appendix
(part 2 of 2)
*STREAM-TAPE(...)
FILE-NAME = list-poss(16): <filename 1..54 without-gen-vers>
,TASK-SELECTION = *UNCHANGED / *ALL / *SPECIFIED(...)
*SPECIFIED(...)
,JOB-NAME = *NOT-SPECIFIED / list-poss(8): <alphanum-name 1..8 with-wild>
,CATEGORY = *NOT-SPECIFIED / list-poss(8): <alphanum-name 1..7 with-wild>
,USER-ID = *NOT-SPECIFIED / list-poss(8): <alphanum-name 1..8 with-wild>
TSN = *NOT-SPECIFIED / list-poss(16): <alphanum-name 1..4 with-wild>
,TYPE = *NOT-SPECIFIED / list-poss(4): *SYSTEM / *DIALOG / *BATCH / *TP
,EVENT-SELECTION = *UNCHANGED / *ALL-BY-ADD-COSMOS-EVENT / *SPECIFIED(...)
*SPECIFIED(...)
EIA-INTERRUPT-CLASS = *UNCHANGED / *ANY / list-poss(5): *SVC / *PROGRAM /
*MACHINE-CHECK / *IO / *EXTERNAL
,EIA-SVC-NUMBER = *UNCHANGED / *ANY / list-poss(8): <integer 1..255>
,IO-DEVICE = *UNCHANGED / *ANY / list-poss(8): <alphanum-name 2..4>
,DAB-CACHE-ID = *UNCHANGED / *ANY / list-poss(8): <alphanum-name 1..32>
,MEMORY-CLASS = *UNCHANGED / *ANY / list-poss(4): *3 / *4 / *5 / *6
,SLOT-MEMORY-CLASS = *UNCHANGED / *ANY / list-poss(4): *3 / *4 / *5 / *6
,PEND-CODE = *UNCHANGED / *ANY / list-poss(16): <integer 1..22>
,
,LOCK-ID = *UNCHANGED / *ANY / list-poss(4): <alphanum-name 1..2>
,TLT-DESCRIPTOR = *UNCHANGED / *ANY / list-poss(8): <alphanum-name 1..3>
,TSKI-SWITCH = *UNCHANGED / *ANY / *TASK
,TSVC-SVC-NUMBER = *UNCHANGED / *ANY / list-poss(8): <integer 1..255>
,UNLOAD = *UNCHANGED / *AT-MEASUREMENT-PROGRAM-STOP / *AT-SM2-STOP
,MEASUREMENT-TIME = *UNCHANGED / *NOT-SPECIFIED / <integer 1..60>
428
U3585-J-Z125-8-76
Appendix
SM2 statements (overview)
MODIFY-MEASUREMENT-PERIODS - Modify SM2 monitoring cycle
OFFLINE-PERIOD = *UNCHANGED / <integer 10..3600>
,ONLINE-PERIOD = *UNCHANGED / *SAME-AS-OFFLINE / <integer 10..3600>
,SAMPLING-PERIOD = *UNCHANGED / <integer 200..10000>
MODIFY-RESPONSETIME-PARAMETER Modify parameters for RESPONSETIME monitoring
SCOPE = *UNCHANGED / list-poss(2): *BUCKET / *CATEGORY
,DEFINITION = *UNCHANGED / *1 / *2
,CONNECTION-NUMBER = *UNCHANGED / <integer 1..8187>
,RESPONSETIME-BUCKETS = *UNCHANGED / *STD-LIMITS / list-poss(5): <integer 1..99999>
,THINKTIME-BUCKETS = *UNCHANGED / *STD-LIMITS / list-poss(5): <integer 1..99999>
,TRANSACTTIME-BUCKETS = *UNCHANGED / *STD-LIMITS / list-poss(5): <integer 1..99999>
,WAITTIME-BUCKETS = *UNCHANGED / *STD-LIMITS / list-poss(5): <integer 1..99999>
MODIFY-USER-ADMISSION - Define authorizations for nonprivileged users
TASK = *UNCHANGED / *ALLOW(...) / *INHIBIT
*ALLOW(...)
USER-ID = *ALL / list-poss(16): <alphanum-name 1..8>
,FILE = *UNCHANGED / *ALLOW(...) / *INHIBIT
*ALLOW(...)
USER-ID = *ALL / list-poss(16): <alphanum-name 1..8>
,ISAM = *UNCHANGED / *ALLOW(...) / *INHIBIT
*ALLOW(...)
U3585-J-Z125-8-76
USER-ID = *ALL / list-poss(16): <alphanum-name 1..8>
429
SM2 statements (overview)
Appendix
OPEN-LOG-FILE - Open SM2 output file
FILE = *STD / *BY-LINK-NAME
,BUFFER-OUTPUT = *NORMAL / *IMMEDIATE
REMOVE-BCAM-CONNECTION-SET Exclude connection set from BCAM-CONNECTION monitoring
SET-NAME = *ALL / <alphanum-name 1..16>
REMOVE-CONNECTION-SET Exclude connection set from RESPONSETIME monitoring
SET-NAME = *ALL / <alphanum-name 1..16>
REMOVE-COSMOS-EVENT Remove events from COSMOS monitoring parameters
EVENT-NAME = *STANDARD-EVENTS / *ALL / list-poss(67): *STANDARD-EVENTS / *ACF / *BCAM /
*BCPT / *BLS / *BOUR / *CHTM / *CMD / *CMS / *DAB / *DCAM / *DLM / *EIA / *EIA2 /
*EIA3 / *FITC / *GSAC / *HAL / *IDLE / *INTR / *IONQ / *ISEV / *ISPL / *KAI / *LOCK / *MSG / *NSM /
*PAGE / *PAM / *PCCC / *PCTC / *PDEA / *PEND / *PIO / *PMIO / *PRGS / *PRGT /
*PRTY / *RELM / *REQM / *SDV / *SLOT / *SNAP / *STD1 / *STDI / *STDN / *SVC /
*TGMA / *TGMP / *TGMT / *TIC / *TINF / *TLM / *TLT / *TSKI / *TSVC / *UTM / *VMCH / *VMH /
*VMI / *VMLK / *VMPD / *VMPR / *VMS / *VM2 / *WSCT / *XEIA
REMOVE-FILE - Remove file(s) from FILE monitoring parameters
FILE-NAME = *ALL / <filename 1..54>
430
U3585-J-Z125-8-76
Appendix
SM2 statements (overview)
REMOVE-ISAM-POOL- Remove ISAM pool(s) from ISAM monitoring parameters
POOL-NAME = *ALL / <alphanum-name 1..8>
,SCOPE = *ANY / *HOST-SYSTEM / *TASK(...) / *USER(...)
*TASK(...)
TSN = <alphanum-name 1..4>
*USER(...)
USER-ID = <alphanum-name 1..8>
,CAT-ID = *ANY / *HOME-PVS / <catid 1..4>
SELECT-HOSTS - Define hosts for SM2 statements and screen output
HOST-NAME = *ALL / *LOCAL / list-poss(16): <alphanum-name 1..8>
,PARTNER-TYPE = *XCS / *CCS
SET-BCAM-CONNECTION-PARAMETER - Define BCAM-CONNECTION monitoring parameters
INWAIT-BUCKETS = *STD-LIMITS / *UNCHANGED / list-poss(4):<integer 1..999999>
,REACT-BUCKETS = *STD-LIMITS / *UNCHANGED / list-poss(4):<integer 1..999999>
,INPROC-BUCKETS = *STD-LIMITS / *UNCHANGED / list-poss(4):<integer 1..999999>
,OUTPROC-BUCKETS = *STD-LIMITS / *UNCHANGED / list-poss(4):<integer 1..999999>
SET-CHANNEL-IO-PARAMETER - Define CHANNEL-IO monitoring parameters
CHANNELS = *ALL / list-poss(64): <x-string 1..4>
U3585-J-Z125-8-76
431
SM2 statements (overview)
Appendix
(part 1 of 2)
SET-COSMOS-PARAMETER - Define COSMOS monitoring parameters
TITLE = C ’COSMOS’ / <c-string 1..80>
,BUFFER-SIZE = 2 / <integer 1..7>
,NUMBER-OF-BUFFERS = 2 / <integer 2..128>
,ADDITIONAL-INFO = *CONFIGURATION / *NONE / list-poss(2): *CONFIGURATION / *VM2000(...)
*VM2000(...)
FILE-NAME = <filename 1..54 without-gen-vers>
,OUTPUT = *DISK (...) / *WRAP-AROUND(...) / *TAPE(...) / *STREAM-TAPE(...)
*DISK(...)
FILE-NAME = list-poss(16): <filename 1..54 without-gen-vers>
*WRAP-AROUND(...)
FILE-NAME = <filename 1..54 without-gen-vers>
*TAPE(...)
FILE-NAME = list-poss(16): <filename 1..54 without-gen-vers>
*STREAM-TAPE(...)
FILE-NAME = list-poss(16): <filename 1..54 without-gen-vers>
,TASK-SELECTION = *ALL / *SPECIFIED(...)
*SPECIFIED(...)
JOB-NAME = *NOT-SPECIFIED / list-poss(8): <alphanum-name 1..8 with-wild>
,CATEGORY = *NOT-SPECIFIED / list-poss(8): <alphanum-name 1..7 with-wild>
,USER-ID = *NOT-SPECIFIED / list-poss(8): <alphanum-name 1..8 with-wild>
,TSN = *NOT-SPECIFIED / list-poss(16): <alphanum-name 1..4 with-wild>
,TYPE = *NOT-SPECIFIED / list-poss(4): *SYSTEM / *BATCH / *DIALOG / *TP
Continued ➠
432
U3585-J-Z125-8-76
Appendix
SM2 statements (overview)
(part 2 of 2)
,EVENT-SELECTION = *ALL-BY-ADD-COSMOS-EVENT / *SPECIFIED(...)
*SPECIFIED(...)
EIA-INTERRUPT-CLASS = *ANY / list-poss(5): *SVC / *PROGRAM / *MACHINE-CHECK /
*IO / *EXTERNAL
,EIA-SVC-NUMBER = *ANY / list-poss(8): <integer 1..255>
,IO-DEVICE = *ANY / list-poss(8): <alphanum-name 2..4>
,DAB-CACHE-ID = *ANY / list-poss(8): <alphanum-name 1..32>
,MEMORY-CLASS = *ANY / list-poss(4): *3 / *4 / *5 / *6
,SLOT-MEMORY-CLASS = *ANY / list-poss(4): *3 / *4 / *5 / *6
,PEND-CODE = *ANY / list-poss(16): <integer 1..22>
,LOCK-ID = *ANY / list-poss(4): <alphanum-name 1..2>
,TLT-DESCRIPTOR = *ANY / list-poss(8): <alphanum-name 1..3>
,TSKI-SWITCH = *ANY / *TASK
,TSVC-SVC-NUMBER = *ANY / list-poss(8): <integer 1..255>
,UNLOAD = *AT-MEASUREMENT-PROGRAM-STOP / *AT-SM2-STOP
,MEASUREMENT-TIME = *NOT-SPECIFIED / <integer 1..60>
SET-DISK-PARAMETER - Define DISK monitoring parameters
DEVICES = list-poss(256): <alphanum-name 2..4 with-wild>
SET-DISK-FILE-PARAMETER - Define DISK-FILE monitoring parameters
DEVICES = list-poss(8): <alphanum-name 2..4>
U3585-J-Z125-8-76
433
SM2 statements (overview)
Appendix
SET-PERIODIC-TASK-PARAMETER - Define PERIODIC-TASK monitoring parameters
LOG-TASKS = *NONE / *ALL / *SPECIFIED(...)
*SPECIFIED(...)
USER-ID = *NOT-SPECIFIED / list-poss(64): <alphanum-name 1..8>
,JOB-NAME = *NOT-SPECIFIED / list-poss(64): <alphanum-name 1..8>
SET-RESPONSETIME-PARAMETER - Define RESPONSETIME monitoring parameters
SCOPE = *BUCKET / list-poss(2): *BUCKET / *CATEGORY
,DEFINITION = *1 / *2
,CONNECTION-NUMBER = 1024 / <integer 1..8187>
,RESPONSETIME-BUCKETS = *STD-LIMITS / list-poss(5): <integer 1..99999>
,THINKTIME-BUCKETS = *STD-LIMITS / list-poss(5): <integer 1..99999>
,TRANSACTTIME-BUCKETS = *STD-LIMITS / list-poss(5): <integer 1..99999>
,WAITTIME-BUCKETS = *STD-LIMITS / list-poss(5): <integer 1..99999>
SET-SERVICETIME-PARAMETER - Define SERVICETIME monitoring parameters
DEVICES = list-poss(256): <alphanum-name 2..4 with-wild>
SET-SYSSTAT-PARAMETER - Define SYSSTAT monitoring parameters
USED-DEVICES = *NONE / *ALL / list-poss(64): *DISK / *TAPE / <alphanum-name 2..4 with-wild>
434
U3585-J-Z125-8-76
Appendix
SM2 statements (overview)
SET-TASK-PARAMETER - Define TASK monitoring parameters
TASK-SELECTION = *ALL / *SPECIFIED(...)
*SPECIFIED(...)
TSN = *NOT-SPECIFIED / list-poss(64): <alphanum-name 1..4>
,USER-ID = *NOT-SPECIFIED / list-poss(32): <alphanum-name 1..8 with-wild>
,JOB-NAME = *NOT-SPECIFIED / list-poss(32): <alphanum-name 1..8 with-wild>
,JOB-CLASS = *NOT-SPECIFIED / list-poss(32): <alphanum-name 1..8 with-wild>
,TYPE = *NOT-SPECIFIED / list-poss(4): *SYSTEM / *BATCH / *DIALOG / *TP
,DEVICES = *NONE / *ALL / list-poss(64): *DISK / <alphanum-name 2..4 with-wild>
SHOW-ACTIVE-PARAMETER - Output active monitoring parameters
TYPE = *ALL / list-poss(12): *BCAM-CONNECTION / *CHANNEL-IO / *COSMOS / *DISK / *DISK-FILE /
*FILE / *ISAM / *PERIODIC-TASK / *RESPONSETIME / *SERVICETIME / *SYSSTAT / *TASK
SHOW-DEFINED-PARAMETER - Output defined monitoring parameters
TYPE = *ALL / list-poss(12): *BCAM-CONNECTION / *CHANNEL-IO / *COSMOS / *DISK / *DISK-FILE /
*FILE /*ISAM / *PERIODIC-TASK / *RESPONSETIME / *SERVICETIME / *SYSSTAT / *TASK
SHOW-MEASUREMENT-STATUS - Output monitoring status
SHOW-SELECTED-HOSTS - Output selected hosts
U3585-J-Z125-8-76
435
SM2 statements (overview)
Appendix
SHOW-SM2-STATUS - Output status of SM2 system tasks
INFORMATION = *STD / *TASK / *EVENT-TRACE(...)
*EVENT-TRACE(...)
FROM = *ACTUAL / <integer 1..32767>
SHOW-USER-MEASURED-OBJECTS - Output monitored objects and associated users
TYPE = *ALL / list-poss(3): *FILE / *ISAM / *TASK
START-MEASUREMENT-PROGRAM - Start monitoring program run
TYPE = list-poss(31): *BCAM-CONNECTION / *CHANNEL-IO / *CMS / *COSMOS / *DAB / *DISK /
*DISK-FILE / *DLM / *FILE / *GS / *GSVOL / *HSMS / *ISAM / *MSCF / *NET-DEVICE /
*NSM / *PCA /*PERIODIC-TASK / *PFA / *POSIX / *RESPONSETIME / *SERVICETIME /
*SVC / *SYSSTAT / *TASK / *TCP-IP /*TLM / *UTM / *VM
STOP-MEASUREMENT-PROGRAM - Terminate monitoring program run
TYPE = *ALL / list-poss(31): *BCAM-CONNECTION / *CHANNEL-IO / *CMS / *COSMOS / *DAB / *DISK /
*DISK-FILE / *DLM / *FILE / *GS / *GSVOL / *HSMS / *ISAM / *MSCF / *NET-DEVICE /
*NSM / *PCA / *PERIODIC-TASK / *PFA / *POSIX / *RESPONSETIME / *SERVICETIME /
*SVC / *SYSSTAT / *TASK / *TCP-IP / *TLM / *UTM / *VM
436
U3585-J-Z125-8-76
Appendix
SM2 statements (overview)
Overview of statements for the nonprivileged user
Switch to system mode
Operation
Operands
BREAK
Activate and deactivate ISAM pools
Operation
CHANGE-ISAMSTATISTICS
Operands
*NONE
ADD-POOL =
(*POOL(
POOL-NAME=poolname1
*HOST-SYSTEM
[,SCOPE =
*TASK(TSN=tsn)
*USER
*HOME-PVS
,CAT-ID =
catid
*NONE
,REMOVE-POOL = (*POOL(
*OWN
]
)[,*POOL( )]...)
POOL-NAME=poolname1
*HOST-SYSTEM
[,SCOPE =
*TASK(TSN=tsn)
*USER
*HOME-PVS
,CAT-ID =
catid
]
)[,*POOL( )]...)
Select devices with monitored data
Operation
DEVICE
U3585-J-Z125-8-76
Operands
*DISK
*ALL
+
]dev-name
[
-
+
[
]dev-name
-
437
SM2 statements (overview)
Appendix
Terminate monitoring
Operation
Operands
END
Monitor files
Operation
Operands
FILE
NAME=filename
[ ,STATS = ON ]
[
]
,STATS = OFF
Call user help functions
Operation
Operands
HELP
Define output mode
Operation
OUTPUT
Operands
TERMINAL
Y[ES]
[
=
]
TER
N[O]
HARDCOPY
Y[ES]
[,
= N[O] ]
HC
INTERVAL
[number]
[,
=
]
INT
C[ONTROLLED]
Insert remarks
438
Operation
Operands
REMARK
[any text]
U3585-J-Z125-8-76
Appendix
SM2 statements (overview)
Select reports
Operation
REPORT
Operands
STD
ALL
+
[ - report-type ]
+
[
report-type ]
-
Start output of selected reports
Operation
Operands
RESTART
Select DAB cache area
Operation
SELECT-DAB-CACHE
Operands
cache-id
[ADD-CACHE-ID=
]
(cache-id1[,cache-id2]...)
[,REMOVE-CACHE-ID=
cache-id
(cache-id1[,cache-id2]...)
]
*ALL
Select cache area for PCA DEVICE report
Operation
SELECT-PCA-CACHE
U3585-J-Z125-8-76
Operands
*NONE
*ALL
CACHE=
number1
((CONTROLLER=cont1,CACHE-ID= *ALL
)[,...])
439
SM2 statements (overview)
Appendix
Select controllers for PCA CACHE report
Operation
Operands
SELECT-PCACONTROLLER
*NONE
*ALL
CONTROLLER=
controller
(controller1[,controller2]...)
Select sort criteria and output information of PERIODIC TASK report
Operation
SELECT-PERIODICTASK-PARAMETER
Operands
*ALL
USER-ID
(userid1[,userid2]...)
OUTPUT-INFORMATION =
*ALL
JOB-NAME
(jobname1[,jobname2]...)
[,SORT = [SERVICE-UNITS][,CPU][,IO][,UPG][,PAGING-READ]]
Select PFA cache area
Operation
SELECT-PFA-CACHE
Operands
cache-id
[ADD-CACHE-ID=
]
cache-id1[,cache-id2]...)
cache-id
(cache-id1[,cache-id2]...)
]
[,REMOVE-CACHE-ID=
*ALL
440
U3585-J-Z125-8-76
Appendix
SM2 statements (overview)
Select SYMMETRIX controllers
Operation
SELECT-SYMMETRIXCONTROLLER
Operands
controller-mn
[ADD-CONTROLLER-MN =
]
(controller-mn1[,controller-mn2]...)
[,REMOVE-CONTROLLER-MN =
controller-mn
(controller-mn1[,controller-mn2]...)
]
*ALL
Select UTM applications
Operation
SELECT-UTMAPPLICATION
Operands
name
[ADD-APPLICATION=
]
(name1[,name2]...)
[,REMOVE-APPLICATION=
name
(name1[,name2]...)
]
*ALL
Output monitored objects
Operation
Operands
SHOW-USERMEASURED-OBJECTS
TYPE = TASK
Start report output
Operation
Operands
START
U3585-J-Z125-8-76
441
SM2 statements (overview)
Appendix
Monitor ISAM pools
Operation
START-ISAM-STATISTICS
Operands
POOL-NAME=poolname1
*HOST-SYSTEM
[,SCOPE=
*TASK(TSN=tsn)
POOL=(*POOL(
*USER
*HOME-PVS
[,CAT-ID=
]
catid
]
)[,*POOL()]...)
Determine monitoring status
Operation
Operands
STATUS
Deactivate all activated ISAM pools
Operation
Operands
STOP-ISAM-STATISTICS
442
U3585-J-Z125-8-76
Glossary
The following terms have been used frequently in this manual. They are explained below:
/390 mode
Runtime environment of the /390 processor (processor used in the SIEMENS 7.500
system (CISC)).
Program execution in /390 mode on SR2000 systems under OSD-SVP takes place
under the control of the /390 firmware.
The /390 firmware is the firmware component of SINIX-2000 on SR2000 systems under
OSD-SVP which is used to map /390 code to RISC code. It extends RISC mode and
allows for the object-compatible execution (in /390 mode) of /390 code on RISC
hardware.
activation
Whenever a task issues a request to the system after a period of inactivity (e.g. think
time at a terminal), the system must take two decisions before processing can be
continued:
1. The activation decision
2. The initiation decision
activation decision
This decision gives the task the right to use the CPU and to perform I/O operations.
At activation time, the task is allocated as many main memory pages as it is likely to
need.
Activation delays are possible in cases of resources overloading.
U3585-J-Z125-8-76
443
Glossary
assignment of paging activities to the initiating task
The system initiates all paging I/O operations directly in the SIH state. However, SM2
does not assign all paging I/O operations to the SYSTEM category, but sometimes to
the initiating task.
For SM2, the initiating task is that task which caused a page fault during page access.
Two chains have to be distinguished:
1. Only one page is read.
The full firmware duration of the input operation is assigned to the initiating task and
its category.
The full software duration of the input operation is assigned to the category of the
initiating task.
The task and category counters for the number of paging operations are incremented by 1.
2. Only page output occurs.
The full firmware duration of the output operation is assigned to the PGE task, but
not to the SYSTEM category (although it is registered system-globally for SUM).
The PGE task counter for the number of paging operations is incremented by 1.
background storage
Storage area on peripheral devices which can be accessed by means of virtual
addressing. Programs and data are transferred in pages from background storage to
main memory before processing and returned (if required) to background storage after
processing.
caching
Caching is understood to be the process of buffering data in a fast data medium (the
cache) in an attempt to accelerate subsequent inputs and outputs to the same data
areas.
Data to be written to or read from disk is buffered in the cache to avoid the longer input/
output times involved in accessing the disk.
If the data to be accessed is in the cache at the time of access, this is referred to as a
cache hit, otherwise as a cache miss.
The proportion of hits in the total number of accesses is known as the cache hit rate.
The higher the hit rate, the greater the advantage of using the cache. The hit rate which
can be achieved depends on a range of factors, such as the locality of the accesses,
the size of the cache, the caching method selected (read cache, write cache, read/write
cache) and the appropriate selection of files. Monitoring systems such as SM2 can be
used to identify files and disks suitable for caching.
444
U3585-J-Z125-8-76
Glossary
channels
Channels are used for data interchange between the CPU, main memory and the
peripheral devices.
Multiplexer channel (generic term):
can handle several I/O operations simultaneously.
Byte multiplexer channel (BYMUX):
data is transferred in byte-interleaved fashion between main memory and several simultaneously active I/O devices. This type of channel is used to connect slow devices.
Block multiplexer channel (BLMUX):
data is transferred in block-interleaved fashion between main memory and several
simultaneously active I/O devices. This type of channel is used to connect fast devices
such as disk controllers.
counting of I/O operations and their duration
For SM2, an I/O operation is
–
–
any version of EXCP (EXCP, EXCPW, $EXCP, $EXCPW) or
an I/O request from the memory management system for paging (no SVC call)
addressed to the I/O control module. The I/O control module is the central system
component for handling physical I/O operations.
The I/O control module normally processes the I/O request with one privileged
instruction (Start Device or Start Subchannel). For each instruction a termination
message is issued, upon which the I/O operation is counted.
In rare cases (e.g. disk connected to a channel operated in selector mode), two SDV
instructions are issued. This is called "offline seek". The first SDV prepares the I/O
device and the second initiates the I/O operation proper. Only one I/O operation is
counted in this case too.
The following particularities should be noted:
I/O requests which could not be started properly (SDV with condition code differing from
0) are ignored.
So-called SENSE SDVs, which are generally issued after an I/O request that resulted
in an error and serve to fetch additional diagnostic information, are only included in
report 100.
In SDV fast release mode supported in some systems, a properly initiated I/O operation
can be rejected at a later time by a channel. The rejected SDVs are not counted.
In determining the duration of the I/O operation, the time between the SDV and the
termination message is always counted.
An SDV rejected because of an error is ignored; this results in an increase in waiting
time for the device.
U3585-J-Z125-8-76
445
Glossary
An SDV rejected in SDV fast release mode is ignored; this also results in an increase in
waiting time for the device.
In "offline seek" mode, the time between the first SDV and the termination message for
the second SDV is counted.
CPU time and CPU service units on SR2000
On SR2000 systems, the CPU time consumed depends on whether the code is
executed in /390 mode (compatibility mode) under the /390 firmware or in RISC mode
directly on the RISC CPU. The higher the proportion of code in /390 mode compared to
the proportion of code in RISC mode, the greater the consumption of (native) CPU time.
The following values describe the CPU time and CPU service units on SR2000
systems:
(Native) task CPU
time
As before, this represents the RISC CPU time consumed by the
task. This consists of the /390 CPU time and the time during
which the task is executed directly on the CPU in RISC mode.
/390 CPU time
This is the time during which a task is executed on the RISC
CPU under the control of the /390 firmware (in /390 mode). This
arises only in the TU state. The /390 CPU time of a task is a
subset of the native task CPU time.
(Native) CPU
service units
As before, this specifies the weighted load of the CPU.
Standardized CPU
time
This maps the (native) CPU time consumed on the RISC system
to the task CPU time of a /390 system with the same capacity.
The standardized CPU time is not recorded by SM2.
Standardized CPU
service units
This maps the CPU time consumed on the RISC system to the
CPU service units of a /390 system with the same capacity. The
standardized CPU service units are not recorded by SM2.
deactivation, forced deactivation
When a task is deactivated, it is no longer authorized to use the CPU. In the case of
forced deactivation, the system withdraws the task’s right to use the CPU.
Forced deactivation can occur when resources are extremely overloaded.
446
U3585-J-Z125-8-76
Glossary
dilation factor
Dilation factors can be determined for individual tasks, for specific task classes and on
a system-global basis.
Dwell time
Dilation factor = ƒƒƒƒƒƒƒƒƒƒƒƒƒƒƒ
Productive RST
Productive RST
= productive CPU RST + productive I/O RST
For further information on productive RST, see “time equivalent for the productive
performance” on page 458.
A dilation factor smaller than 1 can occur when a task uses asynchronous I/O. In this
case, the task uses 2 or more resources simultaneously.
The dilation factor output in SM2R1 report 57 is not comparable with the value
"REQUEST DELAY" in the SM2 PCS report and in SM2R1 report 74. This quantity is
designed for optimum response time control by PCS.
DMS I/O operations
All accesses to peripheral devices not performed for paging.
dwell time
The time spent by a task in the system comprises the service times of the physical
resources and all non-voluntary wait times of the task.
It is not always possible to distinguish between voluntary and non-voluntary wait times
without unreasonable outlay.
Example
The BS2000 boursing mechanism can be used to determine both the voluntary wait
times (e.g. wait for user input) and the non-voluntary wait times (wait for a busy
resource).
For simplicity’s sake, SM2 considers all waits times for boursing, for the PASS and
VPASS macros, and for responses to a console message (/PAUSE command or TYPIO
macro with response) as voluntary wait times.
SM2 includes the following times in the dwell time:
1. Time spent in the queue for the CPU(s).
This includes the CPU RST and the time spent in Q1.
2. Wait for paging page transfer (time spent in Q3).
3. Wait for execution of DMS I/O operations (time spent in Q4 and Q12 for I/O).
U3585-J-Z125-8-76
447
Glossary
4. Further time spent in Q4 except for boursing, ITC, PASS/VPASS and waiting for
response to console message.
5. Wait for activation (time spent in Q5).
6. Wait for admission (time spent in queue Q6).
7. Wait in Q7 for hardware error recovery (HERS).
8. Further time spent in Q12 except for boursing and waiting for response to console
message.
9. Hardware duration of I/O operations for paging page transfers.
EXCP
Macro on the physical I/O level which initiates a channel program (see “counting of I/O
operations and their duration” on page 445).
expanded storage (ES)
In BS2000/OSD V3.0 or earlier, expanded storage was a volatile, semiconductor-based
expanded memory which could only be activated on systems of type H120. Support for
this system type is discontinued in versions of BS2000/OSD later than V3.0.
In future extensions, main memory over 2 GBytes must be available for caching on
SR2000 systems. This additional memory will be used in the same way as the previous
expanded storage space. As a result, the definition of expanded storage has been
changed as of BS2000/OSD V4.0:
Expanded storage (ES) is a volatile memory that can be used by DAB as a cache.
As with main memory, the data in expanded storage is lost following a system crash.
Expanded storage is therefore primarily intended for read caching. If it is to be used as
a write or read/write cache, the following files are recommended:
–
files that require enhanced failsafe performance (temporary work files, SYSEAM)
–
files whose write data is backed up by some additional mechanism (e.g. logging)
–
files that can be restored after a system crash with relative ease without loss of data
firmware service time (DCS)
This comprises both the hardware service time and the I/O housekeeping time. It is
caused not only while waiting for I/O initiation at the device (FPT = Function Pending
Time) but also after channel activities have been terminated until the I/O interrupt has
been accepted by the CPU (RST = Remaining Service Time). For DCS systems, this is
therefore the time between "Start subchannel" and "Interrupt accept" (see “service
times definition (DCS, I/O operations)” on page 455).
448
U3585-J-Z125-8-76
Glossary
global storage (GS)
Global storage is a form of semiconductor-based expansion memory which has been
made non-volatile by a number of measures. It has an access granularity of 4K and can
be expanded up to 2x4 Gbyte depending on the system. As with expanded storage,
transfers between global storage and main memory are initiated using machine instructions. This means that an I/O request is processed synchronously if handled from the
cache. There is thus no change of task.
Global storage is not only used as a cache, but can also be used as a paging device as
required.
hardware service time (DCS)
See “service times definition (DCS, I/O operations)” on page 455.
hardware service time (non-DCS)
Time for which devices are busy with I/O operations, also called hardware duration. The
hardware duration is defined as the time between I/O initiation (SDV instruction) and
I/O termination (channel interrupt).
hiperfile concept
Hiperfiles (high-performance file) in BS2000 are a means of accelerating file
processing. This concept is based on the use of particularly fast storage media when
processing a file in order to avoid I/O bottlenecks and thus increase the performance of
the entire system.
These storage media are used to buffer data to be written to or read from disk. This
avoids the longer I/O times associated with disk accesses.
Extended memory (ES, GS) or disk controllers with integrated caches can be used as
storage media.
In this manual, hiperfiles are files with the attribute PERFORMANCE=*HIGH or *VERYHIGH.
initiation
After a task has been activated, the system must reach a decision on initiation. When it
is initiated, the task can use a CPU, i.e. compute.
input/output, logical level
On the logical level, the user uses macro calls (e.g. GET, PUT) to initiate system
functions which control data interchange with the peripheral devices, block and unblock
data, and handle any errors that may occur.
U3585-J-Z125-8-76
449
Glossary
interaction
Generic term for wait, response, think, and transaction processes (RESPONSETIME
monitoring program).
main memory
Memory area which can be addressed directly by the CPU. The program instructions
are read and processed in this area.
overall performance
The productive performance and the dilation, i.e. the relation between the time spent in
the system (dwell time) and the time required for providing the productive performance,
are important criteria for accessing the suitability of a DP system for a given load.
The following definition is used:
Overall performance = productive performance + housekeeping performance
Productive performance is the load handling capacity.
Housekeeping (or overhead) performance is the performance required for system
control by the operating system.
Overall performance is the sum of these two quantities.
The performance is provided by the various system components, e.g. the CPU(s) and
the peripheral devices.
Performance = work done per unit of time. A precise definition of "work done" is not
attempted here. Only the time required for productive or housekeeping performance is
considered.
The time equivalent of the productive performance or of the housekeeping performance
is the (service) time for which resources are being used for productive work or for
housekeeping.
It is also called Resources Service Time (RST).
The dwell time of a task is the sum of the physical resources service times plus all nonvoluntary wait times of the task. The non-voluntary wait time of a task is thus a criteria
for task obstruction by other tasks in the system.
450
U3585-J-Z125-8-76
Glossary
page fault
BS2000 is an operating system with virtual addressing, i.e. it supports several address
spaces simultaneously. The virtual address spaces and the real main memory are
managed in units of 4-Kb pages. The DEMAND PAGING method is used for mapping
virtual pages onto real memory page frames:
When an attempt is made to access a page that is not in main memory, the hardware
detects this condition and uses a page fault interrupt to notify the operating system. If
the addressed page is on disk (paging device), the page is read in (page transfer).
If free page frames are required, the system tries to return modified main memory
pages to disk.
SM2 counts the number of paging I/O operations (number of I/O requests to the central
I/O control module of the system, which corresponds to the EXCP calls). This number
is supplied in the ACTIVITY and DEVICE reports, in the I/O record and in SM2R1
reports 3 and 4.
For each I/O request, SM2 increments this number by 1 when
– a page is read in,
– one or more pages are written (the system tries to group up to 8 pages for one I/O
operation).
The number of pages written is also given in the MEMORY report and in report 55, and
the number of pages read is given in report 56.
SM2 supplies the following additional data:
1. Total number of page fault interrupts. "Real" page faults are not included in this
number.
2. Number of page fault interrupts for which the addressed page was still in main
memory (PAGE RECLAIMS).
3. Number of page fault interrupts for which a page transfer is required. This count is
also incremented when 2 or more tasks try simultaneously to access the same
virtual page and the page is not in main memory.
4. Number of page fault interrupts for the first access to a new page.
U3585-J-Z125-8-76
451
Glossary
paging in BS2000
The number of addressable virtual pages is usually greater than the number of page
frames available in main memory.
For the removal of pages which can no longer be kept in main memory, see “page fault”
on page 451.
The main memory management strategies are based on the assumption that the
programs (or tasks) will only address a limited set of the total number of virtual pages
within a specific period of time, i.e. that the programs are more or less local. This set of
pages, whose size varies dynamically, is the called the working set.
The PPC (planned page count) indicates how local a program or task is. This value is
provided by the memory management system before task activation and - because it is
a measure of the intensity of memory utilization by the task - is used as a task activation
criterion.
The PPC value for the next activation phase depends on program behavior during the
preceding activation phase.
While the task is active, the PPC value can be modified in accordance with program
behavior.
The number of pages used by a task is called UPG (USED PAGE COUNT).
There are three main memory (real memory) management methods:
1. Task-local management
This means that, when there is a shortage of free page frames, the task’s pages are
checked first and pages used by other tasks are removed from main memory only
in exceptional cases.
In determining the pages to be removed, the LRU (LEAST RECENTLY USED)
principle is used, i.e. those task pages are removed first which have not been used
longest.
With this method the UPG is always less than or equal to the PPC because the
number of main memory pages assigned to a task depends on the size of its
working set (PPC). Pages not included in the working set are always removed.
These checks are made very often to ensure high PPC computation precision.
2. System-global management
This means that, when determining the pages which should be removed because
of a shortage of free real-memory page frames, all main memory pages are
checked - in contrast to task-local management (see above).
As in task-local management, the LRU principle is used for determining the pages
to be removed from main memory:
To this end the main memory pages are sorted according to their access times.
452
U3585-J-Z125-8-76
Glossary
The PPC value is again supplied as a measure of how local a task is, but it is less
precise here than with task-local management.
The check is made and working set pages are removed only if free page frames are
required. This is why UPG may become greater than the working set, especially if
the main memory is large. The UPG/PPC relationship which exists in task-local
management thus does not apply to global management.
3. Selective management
A combination of both methods is provided by the selective management method
for main memory pages. In this case all pages of the tasks are globally managed
using the attributes SYSTEM and TP, and all pages of the tasks are managed
locally using the attributes DIALOG and BATCH.
A common feature of both methods is that unassigned page frames are kept in a free
page pool.
The optimum main memory management algorithm is set automatically, after which it
can no longer be influenced by generation parameters or the startup parameter service.
The replacement procedure valid at the start of a BS2000 session is SYS-WS.
paging I/O operations
All I/O operations performed in response to paging requests.
paging memory
The whole main memory area available to all users for paging.
paging rate
Number of required paging I/O operations per second (calls to the I/O control module).
path info
A 3-byte address comprising the channel address (2 bytes) and the device address of
a complete data path between main memory and the device.
PGE task
System task required for restarting after hardware errors during paging I/O.
U3585-J-Z125-8-76
453
Glossary
processor states
Program interrupts are caused by
–
–
–
–
–
input/output requests
calls to the Control System
timers
errors
paging requests
The system distinguishes between the following processor states when handling
programs and interrupts:
TU
TPR
SIH
MEH
Processor
state for
user programs
Processor
state for program
interrupts
Recognition
state for program
interrupts
Recognition
state for
machine errors
Interruptible
Interruptible;
in part
non-interruptible
Interruptible
by MER only
Noninterruptible
Nonprivileged
Privileged processor states
If the CPU is in none of the above states, it is in the IDLE state.
response time
Time required by the system for processing a request. For the user, this is the time
between an input operation and the corresponding system response (see “RESPONSETIME Monitored data on the BCAM pool” on page 45 and “BCAM-CONNECTION
Monitored data on connection sets” on page 35).
RISC mode
Runtime environment of a RISC processor.
454
U3585-J-Z125-8-76
Glossary
SDV (Start Device)
Instruction which initiates an input/output operation.
service times definition (DCS, I/O operations)
Detailed monitoring of service times is possible on XS systems with DCS, the interface
between the operating system, the I/O processor and the physical devices.
I/O chain
D
Q
T
Start subchannel
S
W
F
P
T
F
W
Start I/O
D
D
T
H
W
T
I
M
E
T
I
M
E
T
I
M
E
D
C
T
Channel end
R
S
T
Interrupt accept
U3585-J-Z125-8-76
455
Glossary
DQT
Device Queue Time
HW TIME Hardware service time
FPT
Function Pending Time
FW TIME Firmware service time
DDT
Device Disconnect Time
SW TIME Software service time
DCT
Device Connect Time
RST
Remaining Service Time
software service time (DCS)
See “service times definition (DCS, I/O operations)” on page 455.
software service time (non-DCS)
The software service time (also called software duration) is obtained by adding the
waiting time of an input/output request in the device queue of the system to the
hardware duration (see “hardware service time (non-DCS)” on page 449).
task queues
456
Q0
A task is in this queue when it is using the CPU.
Q1
Tasks in this queue are waiting to use the CPU.
Q2
This is the queue for the SM2 write task.
Q3
Tasks waiting for end of paging.
Q4
Tasks waiting for peripheral I/O termination (disk, tape), for task communication
events (boursing, ITC), or for VPASS where msec is specified.
Q5
Ready tasks waiting to become active again.
Q6
.Ready tasks waiting to be admitted (PCS).
U3585-J-Z125-8-76
Glossary
The task queues described in the following contain tasks waiting for an event that is very
remote in time before they become ready. These tasks are deactivated, i.e. they have
lost the right to use main memory.
Q7
Not used
Q8
Not used
Q9
Not used
Q10 Hold queue for tasks placed in the hold state by the system or the operator in an
emergency or overload situation. Tasks in the device queue or the WHEN queue.
Tasks which cannot be terminated under normal conditions but have not yet been
completed (error).
Newly generated tasks.
Q11 System tasks which are not called on a time basis.
Q12 Tasks waiting for an event remote in time, e.g. time-consuming inter-task communication events (boursing, especially waiting for terminal input in interactive
mode).
Q13 Tasks waiting for VPASS or PASS end.
The task queues are implemented by chaining the TCBs (task control blocks). In the
system, a separate entry refers to the first TCB of each queue.
Task queues Q0 to Q4 exist once for each central processor. Queues Q5 to Q13 are
system-global.
time equivalent for the housekeeping performance
The housekeeping performance of the system is a measure of the operating system
overhead caused by the workload to be processed. Its definition encompasses the
following factors:
1. CPU service time (SIH time) for processing paging requests.
2. Further SIH times for the operating system.
This is for simplification only, because various operations performed in the SIH state
constitute productive work. Part of the productive performance for I/O execution
occurs in the SIH state. System activities for processing SVC calls (SVC frame
processing) are also handled in the SIH state. As far as monitoring is concerned, it
would be very complicated to assign the SIH part of the productive performance to
the individual tasks.
3. Hardware duration of the I/O operation for paging page transfers.
U3585-J-Z125-8-76
457
Glossary
time equivalent for the productive performance
In determining the RST (resources service time), a distinction is made between the
CPU and the peripheral devices as follows:
1. For the CPU the RST is the time in which instructions are processed in the TU and
TPR states. This time is called productive CPU RST (the SIH share of the
productive performance is not counted; see above).
2. For the peripheral equipment, the RST is the firmware service time of the devices
for performing an I/O operation.
The firmware duration is defined as the time from I/O initiation (START-DEVICE or
START-SUBCHANNEL instruction) to I/O termination (channel interrupt). Only I/O
operations initiated by DMS are counted. This share is called productive I/O RST.
In practical operation, the firmware duration is affected by other tasks in the system.
The positioning time during disk access, for example, depends on prior events, i.e.
the current arm position, and on operating system strategies. In BS2000, arm
movement optimization is used, i.e. the operating system tries to start I/O accesses
in such a way that arm movements are minimized.
By adding the waiting time of an I/O request in the device queue of the system to the
firmware duration, the software service time (also called software duration) is obtained.
transaction
Total number of system responses to a user request.
(Please refer to the normal usage in the UTM manuals for the meaning of the term
"transaction" in the UTM reports).
458
U3585-J-Z125-8-76
Glossary
virtual address space subdivision
The virtual address space is subdivided as follows:
1. Class 1 memory
Resident memory for system module code.
The size of this memory segment is specified at system generation time and
remains constant for the session.
2. Class 2 memory
Paging memory for system module code.
The size of this memory segment depends on generation specifications and
remains constant for the session.
3. Class 3 memory
Resident memory requested dynamically for tables, control blocks and overlay
modules.
The size of this memory segment varies during the session.
4. Class 4 memory
Paging memory requested dynamically for tables, control blocks and overlay
modules (also shared modules).
The size of this memory segment varies during the session.
U3585-J-Z125-8-76
459
Eine Dokuschablone von Frank Flachenecker
by f.f. 1992
List of Figures
Figure 1: SM2 configuration . . . . . . . . . . . . . . . . . . . . . . . . . . . . . . . . . . . . . . . . . . . . . . 10
Figure 2: Collecting monitored data . . . . . . . . . . . . . . . . . . . . . . . . . . . . . . . . . . . . . . . . 16
Figure 3: Relationship between the sampling cycle and the monitoring cycle . . . . . . . . 18
U3585-J-Z125-8-76
461
Eine Dokuschablone von Frank Flachenecker
by f.f. 1992
List of Tables
Table 1: Authorization table. . . . . . . . . . . . . . . . . . . . . . . . . . . . . . . . . . . . . . . . . . . . . . . .13
Table 2: SM2 monitored variables. . . . . . . . . . . . . . . . . . . . . . . . . . . . . . . . . . . . . . . . . . .20
Table 3: Monitoring programs used to locate overloaded resources. . . . . . . . . . . . . . . . .28
Table 4: Overview of the SM2 monitoring programs . . . . . . . . . . . . . . . . . . . . . . . . . . . . .34
Table 5: Report identifiers, abbreviations and names . . . . . . . . . . . . . . . . . . . . . . . . . . .170
Table 6: Possible attributes of the SM2 output file . . . . . . . . . . . . . . . . . . . . . . . . . . . . .196
Table 7: Output sequence . . . . . . . . . . . . . . . . . . . . . . . . . . . . . . . . . . . . . . . . . . . . . . . .207
Table 8: Abbreviations for monitoring programs . . . . . . . . . . . . . . . . . . . . . . . . . . . . . . .331
Table 9: Metasyntax . . . . . . . . . . . . . . . . . . . . . . . . . . . . . . . . . . . . . . . . . . . . . . . . . . . .407
Table 10: Data types . . . . . . . . . . . . . . . . . . . . . . . . . . . . . . . . . . . . . . . . . . . . . . . . . . . .409
Table 11: Data type suffixes . . . . . . . . . . . . . . . . . . . . . . . . . . . . . . . . . . . . . . . . . . . . . .415
U3585-J-Z125-8-76
463
Eine Dokuschablone von Frank Flachenecker
by f.f. 1992
Related publications
Please apply to your local office for ordering the manuals.
[1]
DAB V6.1A (BS2000/OSD)
Disk Access Buffer
User Guide
Target group
This manual is addressed to systems support.
Contents
The manual begins with some introductory chapters dealing with DAB caching, the DAB
cache media and the DAB functions, and continues with detailed descriptions of the DAB
commands.
Overview of contents:
– DAB caching, DAB media, DAB functions
– DAB application notes, performance behavior, installation, starting and terminating
DAB
– DAB commands and messages
– DAB error recovery
Order number
U2431-J-Z125-11-76
[2]
BS2000/OSD-BC V3.0
DMS Macros
User Guide
Target group
The manual addresses assembly language programmers.
Contents
The manual describes the DMS macro interface for the BS2000/OSD basic configuration.
There is a brief description of the access method-specific features relevant to programming,
followed by a description of the macros in alphabetical order.
Order number
U4250-J-Z125-6-76
New functionality about BS2000/OSD V4.0 is included in the manual Functional Extensions and
Supplementary Documentation [23].
U3585-J-Z125-8-76
465
Related publications
[3]
BS2000/OSD-BC V2.0A
Executive Macros
User Guide
Target group
The manual addresses all BS2000/OSD assembly language programmers.
Contents
The manual contains a summary of all Executive macros, detailed descriptions of each
macro with notes and examples, including job variable macros, and a comprehensive general training section.
Order Number
U3291-J-Z125-8-76
New functionality about BS2000/OSD V4.0 is included in the manual Functional Extensions and
Supplementary Documentation [23].
[4]
HIPLEX MSCF V2.0A (BS2000/OSD)
Multiprocessor System
User Guide
Target group
This manual is addressed to systems support, operators and nonprivileged users.
Contents
HIPLEX MSCF (BS2000) makes it possible to combine two or more BS2000/OSD mainframes to form an LCS, CCS, SPVS or XCS computer network. The manual describes
HIPLEX MSCF (BS2000), possible applications, prerequisites for use, and commands.
Order number
U3615-J-Z125-7-76
[5]
BS2000/OSD-BC V3.0
Performance Handbook
Target group
Computer center and system support staff
Contents
The manual helps system users to evaluate the performance of their dp system and points
out how to use hardware and software cost-effectively and how to improve system performance. Diagrams, formulas and examples explain the processes in the system and their
influence on overall performance.
Order number
U1794-J-Z125-8-76
466
U3585-J-Z125-8-76
Related publications
[6]
BS2000/OSD-BC V4.0
Introductory Guide to Systems Support
User Guide
Target group
This manual is addressed to BS2000/OSD systems support staff and operators.
Contents
The manual covers the following topics relating to the management and monitoring of the
BS2000/OSD basic configuration: system initialization, parameter service, job and task
control, memory/device/user/file/pubset management, assignment of privileges, accounting and operator functions.
Order number
U2417-J-Z125-13-76
[7]
BS2000/OSD-BC
System Installation
User Guide
Target group
This manual is intended for BS2000/OSD system administration.
Contents
The manual describes the generation of the hardware configuration with UGEN and the following installation services: disk organization with MPVS, the installation of volumes using
the SIR utility routine, and the IOCFCOPY subsystem.
[8]
SM2-PA V2.0A (BS2000/OSD)
SM2 Program Analyzer
User Guide
Target group
This manual is intended for applications programmers, system programmers and systems
support.
Contents
The manual describes the SM2-PA program analyzer for user-specific output files of the
SM2 software monitor. It covers the SM2-PA scope of functions, prerequisites for use, operation, and sample outputs. SM2-PA supplies information on resource utilization by tasks
and on the performance behavior of user programs.
U3585-J-Z125-8-76
467
Related publications
[9]
VM2000 (BS2000/OSD)
Virtual Machine System
User Guide
Target group
System administrators and operators in BS2000, VM2000 and VM administrators
Contents
The manual describes the VM2000 Virtual Machine System for BS2000 guest systems.
It contains:
– an introduction to VM2000
– installation, system initialization and termination
– operation, management and error diagnosis
– a description of the VM2000 commands
[10]
openUTM (BS2000/OSD)
Generating and Handling Applications
User Guide
Target group
This manual is intended for application planners, technical programmers, administrators
and users of UTM applications.
Contents
The manual describes the generation of UTM applications with distributed processing, the
tools available with openUTM for this purpose, and the UTM objects created in the course
of generation. It also contains all the information necessary for structuring, operating and
monitoring a productive UTM application.
[11]
openUTM
Concepts and Functions
User Guide
Target group
Anyone who wants information about the functionality and performance capability of
openUTM.
Contents
The manual contains a general description of all the functions and features of openUTM,
plus introductory information designed to help first-time users of openUTM.
468
U3585-J-Z125-8-76
Related publications
[12]
PDN-GA
(PDN)
Generating a Data Communication System
User Guide
Target group
Generators of data communication systems, network and system administrators
Contents
This manual describes network generation from the DCAM and PDN viewpoints, as well as
the structure and use of KOGS sources, e.g. for ISDN and LAN accesses. It also provides
a detailed description of the KOGS macros and illustrates important implementations by
means of tailor-made generation examples.
[13]
BS2000/OSD-BC V4.0
Commands, Volume 1, A – C
User Guide
Target group
This manual is addressed to nonprivileged users and systems support staff.
Contents
Volume 1 contains the BS2000/OSD commands ADD-... to CREATE-... (basic configuration and selected products) with the functionality for all privileges. The command and operand functions are described in detail, supported by examples to aid understanding. An
introductory overview provides information on all the commands described in Volumes 1
through 5.
The Appendix includes information on command input, conditional job variable expressions,
system files, job switches, and device and volume types.
There is a comprehensive index covering all entries for Volumes 1 through 5.
Order number
U2338-J-Z125-14-76
U3585-J-Z125-8-76
469
Related publications
[14]
BS2000/OSD-BC V4.0
Commands, Volume 2, D – MOD-I
User Guide
Target group
This manual is addressed to nonprivileged users and systems support staff.
Contents
Volume 2 contains the BS2000/OSD commands DECLARE-... to MODIFY-I... (basic configuration and selected products) with the functionality for all privileges. The command and
operand functions are described in detail, supported by examples to aid understanding. An
introductory overview provides information on all the commands described in Volumes 1
through 5.
There is a comprehensive index covering all entries for Volumes 1 through 5.
Order number
U41074-J-Z125-1-76
[15]
BS2000/OSD-BC V4.0
Commands, Volume 3, MOD-J – R
User Guide
Target group
This manual is addressed to nonprivileged users and systems support staff.
Contents
Volume 3 contains the BS2000/OSD commands MODIFY-J... to RUN (basic configuration
and selected products) with the functionality for all privileges. The command and operand
functions are described in detail, supported by examples to aid understanding. An introductory overview provides information on all the commands described in Volumes 1 through 5.
There is a comprehensive index covering all entries for Volumes 1 through 5.
Order number
U21070-J-Z125-4-76
470
U3585-J-Z125-8-76
Related publications
[16]
BS2000/OSD-BC V4.0
Commands, Volume 4, S – SH-O
User Guide
Target group
This manual is addressed to nonprivileged users and systems support staff.
Contents
Volume 4 contains the BS2000/OSD commands SAVE... to SHOW-O... (basic configuration
and selected products) with the functionality for all privileges. The command and operand
functions are described in detail, supported by examples to aid understanding. An introductory overview provides information on all the commands described in Volumes 1 through 5.
The Appendix contains an overview of the output columns of the SHOW commands of the
component NDM.
There is a comprehensive index covering all entries for Volumes 1 through 5.
Order number
U41075-J-Z125-1-76
[17]
BS2000/OSD-BC V4.0
Commands, Volume 5, SH-P – Z
User Guide
Target group
This manual is addressed to nonprivileged users and systems support staff.
Contents
Volume 5 contains the BS2000/OSD commands SHOW-P... to WRITE-... (basic configuration and selected products) with the functionality for all privileges. The command and operand functions are described in detail, supported by examples to aid understanding. An
introductory overview provides information on all the commands described in Volumes 1
through 5.
The Appendix contains an overview of the output columns of the SHOW commands of the
component NDM and an overview of all START commands.
There is a comprehensive index covering all entries for Volumes 1 through 5.
Order number
U23164-J-Z125-3-76
U3585-J-Z125-8-76
471
Related publications
[18]
BS2000/OSD-BC V4.0
Commands, Volume 6, Output in S Variables and SDF-P-BASYS
User Guide
Target group
This manual is addressed to programmers and users who write procedures.
Contents
Volume 6 contains tables of all S variables that are supplied with values by the SHOW commands in conjunction with structured output. Further chapters deal with:
- introduction to working with S variables
- SDF-P-BASYS V2.1A
Order number
U23165-J-Z125-3-76
[19]
Commands (Reliant UNIX)
User Reference Manual
Target group
Reliant UNIX users and system administrators
Contents
This manual describes the Reliant UNIX user commands in alphabetical order. The descriptions are based on the manual pages. In the event of there being discrepancies between
the information in the User Reference Manual and the manual pages, use the description
in the manual pages as in case of doubt this is more up to date.
Order number
U25628-J-Z915-1-76
[20]
OSD-SVP V2.0
SR2000 - Operation and Administration
User Guide
Target group
This manual is addressed to DP managers, systems support staff and end users.
Contents
The manual describes and explains the functional differences between the operating
systems OSD-SVP V3.0 and BS2000/OSD V4.0.
It also offers notes on where to find detailed descriptions of the RISC-specific changes to
the user interfaces in the documentation for BS2000/OSD V4.0.
Order number
U25001-J-Z125-3-76
472
U3585-J-Z125-8-76
Related publications
[21]
SM2 V13.0A (BS2000/OSD)
Software Monitor
Volume 2: Analysis and Display of SM2 Monitored Data
Target group
This manual is addressed to users and systems support staff.
Contents
The monitoring system SM2 supplies users with statistical data on the performance of their
DP systems and on resource utilization. Volume 2 of the manual describes the SM2U1 utility routine for editing and administering the SM2 output files, and the analysis routines
SM2R1, SM2R1-PC, SM2ONLINE-PC and SM2-PA.
Administration and operation of SM2 are described in Volume 1.
Order number
U41078-J-Z125-1-76
[22]
SHC-OSD V2.0A (BS2000/OSD)
Symmetrix Host Component
User Guide
Target group
This manual is intended for systems support staff and service technicians.
Contents
The SHC-OSD subsystem is the BS2000 host component for Symmetrix systems. It provides information services and commands for controlling the Symmetrix functions SRDF
(Symmetrix Remote Data Facility) and
TimeFinder (Symmetrix Multi Mirror Facility).
Brief overview of contents:
– Symmetrix in BS2000
– SRDF
downtime scenarios and measures for ensuring continued operation
– TimeFinder
creating, separating and restoring multi-mirror pairs
– commands (listed in alphabetical order)
– Assembler and C program interface
Order number
U41000-J-Z125-2-76
U3585-J-Z125-8-76
473
Related publications
[23]
BS2000/OSD V4.0
Functional Extensions and Supplementary Documentation
User Guide
Target group
This manual is addressed to systems support staff, Assembler programmers and BS2000
users.
Contents
The manual contains supplementary information for the following manuals, for which there
will be no new edition for BS2000/OSD-BC V4.0:
– “Introductory Guide to DMS“
– “DMS Macros“
– “Executve Macros“
– “Dynamic Binder Loader / Starter“
– “Subsystem Management“
– “Introductory Guide to the SDF Dialog Interface“
– “PCA“
– “ADAM“
– “System Exits“
– “Job Variables“
– “SDF-P“
– “SPOOL“
The manual incorporates the new functionalities for BS2000/OSD V4.0, all relevant
README files, and supplementary information relating to support for SR2000 systems.
Together with the various manuals named above, the supplementary information in this
manual constitutes complete, up-to-date documentation.
Order number
U41077-J-Z125-1-76
474
U3585-J-Z125-8-76
Index
/390 CPU time
446
A
ACF report 209
activation 443
activation decision 443
ACTIVE PARAMETER screen 319
ACTIVITY report 211
ADD-CONNECTION-SET statement 69
ADD-COSMOS-EVENT statement 72
ADD-FILE statement 73
ADD-ISAM-POOL statement 74
administration facility 76
switch to 76
admit additional SM2 administrators 83
alias 408
alphanum-name (data type) 409
attributes category 222
attributes of the SM2 output file 195
freely selected 196
preset 195
authorization table 14
B
background monitoring 11
background storage 444
basic load 340
basic resources 339
batch processing (criteria) 26
BCAM Application Name 46
BCAM CONNECTION report 218
BCAM-CONNECTION
exclude connection sets 103
BCAM-CONNECTION (monitoring program)
BLMUX channel 445
U3585-J-Z125-8-76
35
475
Index
bottleneck analysis 28
boursing mechanism 447
BREAK function 153
BREAK statement 157
BUCKET parameters 35
BYMUX channel 445
byte multiplexer channels 228
C
cache for PCA DEVICE report, select 174
cache utilization 43
caching 444
CALL-ADMINISTRATION-PART statement 76
CALL-EVALUATION-PART statement 77
cat (suffix for data type) 420
category 222
CATEGORY QUEUE report 222
CATEGORY report 220
CATEGORY WSET report 225
cat-id (data type) 409
CHANGE-ISAM-STATISTICS statement 158
CHANGE-MEASUREMENT-PROGRAM statement
channel
define for monitoring 114
output 228
channel load 38
CHANNEL report 227
channel types 445
channel utilization 345
CHANNEL-IO (monitoring program) 38
clock resetting, uninterruptible 19
CLOSE-LOG-FILE statement 80
CMS (monitoring program) 38
CMS report 229
command return codes 192
command-rest (data type) 409
compl (suffix for data type) 415
composed-name (data type) 409
connection group 36, 48
connection set 35, 48, 69
define for monitoring 69
excluded, define 103, 104
constructor (string) 418
continuation character 423
476
78
U3585-J-Z125-8-76
Index
control output 152
controlled mode 152, 167
controller
select 176
with caches 272
corr (suffix for data type) 420, 421
COSMOS (monitoring program) 39
define monitoring program definition 115
modify monitoring program definiton 84
prepare 82
CPU report 235
CPU service units 446
CPU time 446
CPU utilization 345
c-string (data type) 409
D
DAB (monitoring program) 39
DAB CACHE report 240
DAB cache, select 173
DAB report 237
data records 18
data types in SDF 409
date (data type) 409
deactivation 446
define
authorizations for nonprivileged users 98
ISAM pool for monitoring 74
DEFINED PARAMETER screen 327
demand paging method 451
description of SDF syntax 405
device (data type) 409
DEVICE report 244
DEVICE statement 160
device utilization 345
devices
define 160
for extended system statistics, define 131
for service time statistics, define 130
dilation factor 447
DISK (monitoring program) 39
disk access 39
disk controllers with cache 43
U3585-J-Z125-8-76
477
Index
disk devices
define for monitoring 123, 124
DISK FILE report 248
disk statistics 39
DISK-FILE (monitoring program) 40
DLM (monitoring program) 40
DLM report 250
DMS I/O operations 447
DRV implementation 351
dwell time 26, 447
dynamic IO reconfiguration 32
E
efficient DP system usage 29
efficient use of SM2 27
END statement 81, 163
event-driven monitoring method 344
events
define for monitored data acquisition (COSMOS) 72
remove from monitoring program definition (COSMOS)
examples
SM2 monitoring program 199
EXCP 448
EXCP call 213
expanded storage (ES) 448
external storage utilization 339
105
F
FILE
nonprivileged (monitoring program) 55
privileged (monitoring program) 41
file
define for monitoring 73
excluded, define 107
file access 40, 41
file migration 41
file names 164
FILE reports 252
output monitored data 252
FILE statement 164
file statistics 73
privileged 73, 107
filename (data type) 410
firmware service time (DCS) 448
478
U3585-J-Z125-8-76
Index
fixed (data type) 409
forced deactivation 446
format description (SM2) 422
free pool 453
function states 212, 454
G
gen (suffix for data type) 420
global index 418
GLOBAL report 255
global storage (GS) 41, 449
GS (monitoring program) 41
GS report 256
GSVOL (monitoring program) 41
GSVOL report 257
H
hardware duration 449
hardware service time
DCS 449
non-DCS 449
HELP statement 165
hiperfile concept 449
HIPLEX MSCF® 42
host
define for SM2 statements and screen output
host communication 42
HSMS (monitoring program) 41
HYPERVISOR-IDLE value 348
I
I/O control module 445
I/O operations (SM2) 445
IDLE state 454
index 418
information screens 205
INITIATE-COSMOS statement
initiating task 444
initiation 449
INPROC time 35
input during monitoring 153
input/output 449
U3585-J-Z125-8-76
110
82
479
Index
inquiry-and-transaction mode 25
insert remarks 168
installation 401
with IMON 402
integer (data type) 411
interaction 45, 450
interactive mode 25
criteria 25
interactive processing 25
internal program name 65
INWAIT time 35
IO reconfiguration 32
ISAM
nonprivileged (monitoring program) 55
privileged (monitoring program) 42
ISAM buffer management 42
ISAM pools 42, 56, 158
exclude from the monitoring process (nonprivileged user) 188
excluded, define 108
include and exclude in the monitoring process (nonprivileged user)
include in the monitoring process (nonprivileged user) 185
ISAM reports 258
output monitored data 258
ISAM statistics 74
privileged 74
ISP syntax 422
J
job
26
K
keyword operands
422
L
logical level 449
low (suffix for data type)
LRU principle 452
480
158
415
U3585-J-Z125-8-76
Index
M
main memory 450
management 261
utilization 342
man (suffix for data type) 420, 421
management
selective 453
system-global 452
task-local 452
mandatory (suffix for data type) 421
MAX MPL 222
mean values 19
MEASUREMENT STATUS screen 139, 328
request 139
memory classes 459
MEMORY report 261
messages 365
metacharacters 422
MIN MPL 222
minimize arm movements 458
MISSED RECORDS 197
MODIFY-ADMINISTRATOR-ADMISSION statement 83
MODIFY-COSMOS-PARAMETER statement 84
MODIFY-MEASUREMENT-PERIODS statement 93
MODIFY-RESPONSETIME-PARAMETER statement 95
MODIFY-USER-ADMISSION statement 98
module information 193
module loading information 191
modules (SM2) 342
monitor files (nonprivileged user) 164
monitored data reports 201
monitored objects and associated users, output 143
monitored objects, output 183
monitoring
terminate (nonprivileged user) 163
monitoring cycle 17
modify 93
relationship with output cycle 153
monitoring data
output of 18
monitoring interval 93
U3585-J-Z125-8-76
481
Index
monitoring method 15, 344
based on monitoring cycle 15
based on sampling cycle 15
event-driven 15, 340, 344
sample-driven 344
monitoring program run
start 144
terminate 147
monitoring programs 33, 78
stop and restart with new monitored objects
monitoring status, output 187
monitoring task, activate 14
MSCF (monitoring program) 42
MSCF report 266
multiprocessor system 229
multiprogramming level 222
multi-step transaction 25
78
N
name (data type) 411
NET DEVICE report 269
NET-DEVICE (monitoring program) 42
networks 30
prerequisites for using SM2 in 30
restrictions 32
screen output 31
selecting hosts with SM2 30
standard SM2 output file 31
users 31
notational conventions 422
NSM (monitoring program) 42
NSM report 270
O
objects and monitoring parameters
output active 135
output defined 137
odd (suffix for data type) 420
offline seek 445
online analysis 77
switch to 77
online monitoring cycle 17
online output 33
open mode 198
482
U3585-J-Z125-8-76
Index
OPEN-LOG-FILE statement 101
operand
keyword 422
positional 422
operation 26
OUTPROC time 35
output cycle 151, 153
output mode
automatic 151
define 166
output priority (devices) 160
OUTPUT statement 166
overall performance 450
overhead 450
overview
of statements for nonprivileged users 437
of statements for SM2 administrators 424
P
page fault 451
real 451
page reclaims 451
paging 452
paging activities, assign 444
paging I/O operations 453
paging memory 453
paging rate 453
PAM output file 197
partial-filename (data type) 412
path info (ICVV) 453
path-compl (suffix for data type) 415
PCA (monitoring program) 43
PCA CACHE report 176, 274
PCA CONTROLLER report 276
PCA DEVICE report 174, 278
PCA reports 272
PCA subsystem 272
PCS report 280
percentage frequency 19
performance expectations
system-oriented 28
user-oriented 28
performance of DP system 26
U3585-J-Z125-8-76
483
Index
PERIODIC TASK report 282
define sort criterion and output information
PERIODIC-TASK (monitoring program) 43
PFA (monitoring program) 44
PFA CACHE report 286
PFA cache, select 179
PFA CONTROLLER report 288
PFA reports 285
PGE task 453
positional operands 422
POSIX (monitoring program) 44
POSIX report 290
posix-filename (data type) 412
posix-pathname (data type) 412
PPC 216, 452
primary administrator 12, 83
PRIOR task scheduler 222
privileged user 12
processor states 454
productive CPU RST 458
productive I/O RST 458
productive performance 450
product-version (data type) 413
program
start 57
terminate 58
program counter statistics 189, 342
Q
queues 456
quotes (suffix for data type)
177
421
R
REACT time 35
real-time monitoring 11
reconfiguration 32
reducing error sources
measures for 346
REMARK statement 168
REMOVE-BCAM-CONNECTION-SET statement
REMOVE-CONNECTION-SET statement 104
REMOVE-COSMOS-EVENT statement 105
REMOVE-FILE statement 107
REMOVE-ISAM-POOL statement 108
484
103
U3585-J-Z125-8-76
Index
report identifiers 171
REPORT statement 169
reports 153, 201
select 169
request queue 232
request user help information 165
resource service time 450
resource utilization
CPU 340
external storage 339
response time 26, 45, 96, 128
response time statistics 49, 95
bucket-specific 95, 127
category-specific 95, 127
define settings 127
examples 49
modify settings 95
RESPONSETIME (monitoring program)
RESPONSETIME report 292
RESTART statement 172
RISC mode 454
RST (Resource Service Time) 450
45
S
SAM output file 198
sample procedures 352
sample-driven monitoring method 344
samples, number of 346
sampling cycle 17
screen output 201
scroll commands 152
SDV (Start Device) 455
SDV fast release mode 445
secondary administrator 12, 83
select report 169
SELECT-DAB-CACHE statement 173
SELECTED HOSTS screen 332
SELECT-HOSTS statement 110
SELECT-PCA-CACHE statement 174
SELECT-PCA-CONTROLLER statement 176
SELECT-PERIODIC-TASK-PARAMETER statement 177
SELECT-PFA-CACHE statement 179
SELECT-SYMMETRIX-CONTROLLER statement 180
SELECT-UTM-APPLICATION statement 182
U3585-J-Z125-8-76
485
Index
SENSE-SDV 445
sep (suffix for data type) 420
service time 450
service time statistics 50
service times definition (DCS) 455
SERVICETIME (monitoring program) 50
SERVICETIME monitoring values 351
SET-BCAM-CONNECTION-PARAMETER statement 112
SET-CHANNEL-IO-PARAMETER statement 114
SET-COSMOS-PARAMETER statement 115
SET-DISK-FILE-PARAMETER statement 124
SET-DISK-PARAMETER statement 123
SET-PERIODIC-TASK-PARAMETER statement 125
SET-RESPONSETIME-PARAMETER statement 127
SET-SERVICETIME-PARAMETER statement 130
SET-SYSSTAT-PARAMETER statement 131
SET-TASK-PARAMETER statement 132
SHARED PVS report 299
short-term monitoring
start 352
terminate and resume former monitoring operations 355
SHOW-ACTIVE-PARAMETER statement 135
SHOW-DEFINED-PARAMETER statement 137
SHOW-MEASUREMENT-STATUS statement 139
SHOW-SELECTED-HOSTS statement 140
SHOW-SM2-STATUS statement 141
SHOW-USER-MEASURED-OBJECTS statement 143, 183
SM2
use in networks 30
SM2 administrator 61
SM2 counters 19
SM2 data
accuracy 343
SM2 monitoring routine (overview) 9
SM2 output file 11, 80, 195
analyze 359
attributes 195
close 80, 198
manage 197
open 101, 198
specify 190
user-specific 189
write task 341
write to 195
486
U3585-J-Z125-8-76
Index
SM2 reports 152, 201, 202
SM2 screen output 201
representation of values 206
SM2-PA (analysis program) 189
SM2R1 analysis, prepare 357
software duration 456
software service time
DCS 456
non-DCS 456
standard categories 222
standard installation 402
standardized CPU service units 446
standardized CPU time 446
Start Device (SDV) 455
start program 57
start report output 153, 184
for selected reports 172
start SM2 57
START statement 184
START-ISAM-STATISTICS statement 185
START-MEASUREMENT-PROGRAM statement 144
START-SM2 (BS2000 command) 57
START-TASK-MEASUREMENT (BS2000 command) 189
statements 61
for nonprivileged users (overview) 437
for SM2 administrators 61, 424
length 423
overview 424
status of SM2 system tasks, output 141
STATUS statement 187
STATUS TABLE 333
STOP time 212
STOP-ISAM-STATISTICS statement 188
STOP-MEASUREMENT-PROGRAM statement 147
STOP-TASK-MEASUREMENT(BS2000 command) 189
storage allocation 197
structured-name (data type) 413
suffixes for data types 415
SVC (monitoring program) 51
SVC report 301
SVC statistics 189
SYMMETRIX control 351
SYMMETRIX CONTROLLER report 303
SYMMETRIX DEVICE report 305
U3585-J-Z125-8-76
487
Index
SYMMETRIX report 302
syntax description 405
SYSSTAT (monitoring program) 51
system capacity planning 27
system counters 19
system mode, change to 157
system privilege SWMONADM 12
system resource utilization (SM2) 339
T
TASK (monitoring program) 52
task CPU time 446
TASK LOCK MANAGER (monitoring program) 53
task monitoring
activating 189
task queues 456
TASK user-specific (monitoring program) 56
tasks
and devices for task statistics, define 132
deactivated 457
monitored data acquisition, define 125
TCP/IP report 307
TCP-IP (monitoring program) 52
temp-file (suffix for data type) 420
terminals for report output 206
terminate SM2 57
terminate SM2 run 81
text (data type) 413
think time 45, 96, 128
throughput rate 26
time (data type) 413
time equivalent for the housekeeping performance 457
time equivalent for the productive performance 458
timesharing mode 25
TLM (monitoring program) 53
TLM report 309
transaction 25, 458
transaction rate 26
transaction time 25, 45, 97, 129
trend monitoring 27
488
U3585-J-Z125-8-76
Index
U
under (suffix for data type) 415
UPG 452
user
nonprivileged 12
SM2 12
user (suffix for data type) 421
USER MEASURED OBJECTS screen
user monitoring programs 55
user task statistics 342
UTC time 19
UTM (monitoring program) 53
UTM APPLICATION report 313
UTM report 310
336
V
variables
relevant 345
vers (suffix for data type) 421
virtual address space
subdivision 459
VM (monitoring program) 54
VM2000 operation 347
VM2000 report 316
VM2000 system 54, 316
VOLUME load 351
vsn (data type) 413
W
wait time 45
in the BCAM pool 97, 129
non-voluntary 447
voluntary 447
WEIGHT 222
wild(n) (suffix for data type) 416
wildcard syntax 65
wild-constr (suffix for data type) 418
with (suffix for data type) 415
with-compl (suffix for data type) 415
with-constr (suffix for data type) 418
with-low (suffix for data type) 415
without (suffix for data type) 420
without-cat (suffix for data type) 420
without-corr (suffix for data type) 420
U3585-J-Z125-8-76
489
Index
without-gen (suffix for data type) 420
without-man (suffix for data type) 420
without-odd (suffix for data type) 420
without-sep (suffix for data type) 420
without-user (suffix for data type) 421
without-vers (suffix for data type) 421
with-under (suffix for data type) 415
with-wild(n) (suffix for data type) 416
working set 452
X
x-string (data type) 414
x-text (data type) 414
490
U3585-J-Z125-8-76
Contents
1
1.1
1.2
1.3
1.4
1.5
1.6
Preface . . . . . . . . . . . . . . . . . . . . . . . . . . . . . . . . . . . . . . . . . . . . . . . . . . . . . . . . . . . . . .
Brief description of the SM2 monitoring system . . . . . . . . . . . . . . . . . . . . . . . . . . . . . . .
Target group . . . . . . . . . . . . . . . . . . . . . . . . . . . . . . . . . . . . . . . . . . . . . . . . . . . . . . . . . . .
Summary of contents . . . . . . . . . . . . . . . . . . . . . . . . . . . . . . . . . . . . . . . . . . . . . . . . . . . .
Changes made since the last version of the manual . . . . . . . . . . . . . . . . . . . . . . . . . . . .
Notational conventions . . . . . . . . . . . . . . . . . . . . . . . . . . . . . . . . . . . . . . . . . . . . . . . . . . .
README file . . . . . . . . . . . . . . . . . . . . . . . . . . . . . . . . . . . . . . . . . . . . . . . . . . . . . . . . . .
2
2.1
2.2
2.3
2.4
2.5
2.6
2.7
2.8
2.9
2.10
2.11
2.12
2.13
2.14
The SM2 monitoring program . . . . . . . . . . . . . . . . . . . . . . . . . . . . . . . . . . . . . . . . . . . . 9
Overview . . . . . . . . . . . . . . . . . . . . . . . . . . . . . . . . . . . . . . . . . . . . . . . . . . . . . . . . . . . . . 9
SM2 operating modes . . . . . . . . . . . . . . . . . . . . . . . . . . . . . . . . . . . . . . . . . . . . . . . . . . 11
Users . . . . . . . . . . . . . . . . . . . . . . . . . . . . . . . . . . . . . . . . . . . . . . . . . . . . . . . . . . . . . . . 12
Table of authorizations . . . . . . . . . . . . . . . . . . . . . . . . . . . . . . . . . . . . . . . . . . . . . . . . . . 13
Activating a monitoring task . . . . . . . . . . . . . . . . . . . . . . . . . . . . . . . . . . . . . . . . . . . . . . 14
Acquisition of monitored data . . . . . . . . . . . . . . . . . . . . . . . . . . . . . . . . . . . . . . . . . . . . . 15
Monitoring cycle . . . . . . . . . . . . . . . . . . . . . . . . . . . . . . . . . . . . . . . . . . . . . . . . . . . . . . . 17
Outputting and saving monitored data . . . . . . . . . . . . . . . . . . . . . . . . . . . . . . . . . . . . . . 18
SM2 monitored variables . . . . . . . . . . . . . . . . . . . . . . . . . . . . . . . . . . . . . . . . . . . . . . . . 20
Analyzing monitored data . . . . . . . . . . . . . . . . . . . . . . . . . . . . . . . . . . . . . . . . . . . . . . . 24
Performance expectations of the user . . . . . . . . . . . . . . . . . . . . . . . . . . . . . . . . . . . . . . 25
Using SM2 for system monitoring . . . . . . . . . . . . . . . . . . . . . . . . . . . . . . . . . . . . . . . . . 27
Basic procedure for ensuring efficient DP system usage . . . . . . . . . . . . . . . . . . . . . . . 29
SM2 in computer networks . . . . . . . . . . . . . . . . . . . . . . . . . . . . . . . . . . . . . . . . . . . . . . 30
3
3.1
3.2
SM2 monitoring programs . . . . . . . . . . . . . . . . . . . . . . . . . . . . . . . . . . . . . . . . . . . . .
Overview . . . . . . . . . . . . . . . . . . . . . . . . . . . . . . . . . . . . . . . . . . . . . . . . . . . . . . . . . . . .
Privileged SM2 monitoring programs . . . . . . . . . . . . . . . . . . . . . . . . . . . . . . . . . . . . . . .
BCAM-CONNECTION Monitored data on connection sets . . . . . . . . . . . . . . . . . . . . .
CHANNEL-IO
Monitored data on the channel load . . . . . . . . . . . . . . . . . . . .
CMS
Monitored data on the catalog management system . . . . . . .
COSMOS
Monitored data on the system for bottleneck analysis . . . . . .
DAB
Monitored data on DAB activities . . . . . . . . . . . . . . . . . . . . . .
DISK
Monitored data on disk access . . . . . . . . . . . . . . . . . . . . . . . .
DISK-FILE
Monitored data on file access for selected disks . . . . . . . . . . .
DLM
Monitored data on lock requests . . . . . . . . . . . . . . . . . . . . . . .
FILE
Monitored data on file access for selected files . . . . . . . . . . . .
U3585-J-Z125-8-76
1
1
2
2
4
7
8
33
33
35
35
38
38
39
39
39
40
40
41
Contents
3.3
4
4.1
4.1.1
4.1.2
4.2
4.3
HSMS
Monitored data on file migration . . . . . . . . . . . . . . . . . . . . . . .
GS
Monitored data on access to global storage . . . . . . . . . . . . . .
GSVOL
Monitored data on volumes in global storage . . . . . . . . . . . . .
ISAM
Monitored data on ISAM pools . . . . . . . . . . . . . . . . . . . . . . . .
MSCF
Monitored data on communication between hosts . . . . . . . . .
NET-DEVICE
Monitored data on network devices . . . . . . . . . . . . . . . . . . . .
NSM
Monitored data on HIPLEX MSCF® . . . . . . . . . . . . . . . . . . . .
PCA
Monitored data on 3419/21 disk controllers under PCA . . . . .
PERIODIC-TASK
Monitored data on tasks . . . . . . . . . . . . . . . . . . . . . . . . . . . . .
PFA
Monitored data on caches under User PFA . . . . . . . . . . . . . .
POSIX
Monitored data on POSIX . . . . . . . . . . . . . . . . . . . . . . . . . . . .
RESPONSETIME
Monitored data on the BCAM pool . . . . . . . . . . . . . . . . . . . . .
SERVICETIME
Monitored data on the service time . . . . . . . . . . . . . . . . . . . . .
SVC
Monitored data on SVC calls . . . . . . . . . . . . . . . . . . . . . . . . . .
SYSSTAT
Global system and category-specific monitored data . . . . . . .
TASK
Task-specific monitored data . . . . . . . . . . . . . . . . . . . . . . . . . .
TCP-IP
Monitored data on TCP/IP connections . . . . . . . . . . . . . . . . .
TLM
Monitored data on locks . . . . . . . . . . . . . . . . . . . . . . . . . . . . .
UTM
Monitored data on UTM applications . . . . . . . . . . . . . . . . . . .
VM
CPU shares of virtual machines . . . . . . . . . . . . . . . . . . . . . . .
Nonprivileged SM2 monitoring programs . . . . . . . . . . . . . . . . . . . . . . . . . . . . . . . . . . . .
FILE
Monitored data on file access . . . . . . . . . . . . . . . . . . . . . . . . .
ISAM
Monitored data on ISAM pools . . . . . . . . . . . . . . . . . . . . . . . .
TASK
Task-specific monitored data . . . . . . . . . . . . . . . . . . . . . . . . . .
41
41
41
42
42
42
42
43
43
44
44
45
50
51
51
52
52
53
53
54
55
55
55
56
SM2 operation . . . . . . . . . . . . . . . . . . . . . . . . . . . . . . . . . . . . . . . . . . . . . . . . . . . . . . .
Starting and terminating SM2 . . . . . . . . . . . . . . . . . . . . . . . . . . . . . . . . . . . . . . . . . . . .
Starting the program . . . . . . . . . . . . . . . . . . . . . . . . . . . . . . . . . . . . . . . . . . . . . . . . . . .
START-SM2 . . . . . . . . . . . . . . . . . . . . . . . . . . . . . . . . . . . . . . . . . . . . . . . . . . . . . . . . . .
Terminating the program . . . . . . . . . . . . . . . . . . . . . . . . . . . . . . . . . . . . . . . . . . . . . . . .
Overview of SM2 operation . . . . . . . . . . . . . . . . . . . . . . . . . . . . . . . . . . . . . . . . . . . . . .
Statements for SM2 administrators . . . . . . . . . . . . . . . . . . . . . . . . . . . . . . . . . . . . . . . .
ADD-BCAM-CONNECTION-SET
Add connection set for BCAM-CONNECTION monitoring . . . . . . . . . . . . . . . . . . . . .
ADD-CONNECTION-SET
Add connection set for RESPONSETIME monitoring . . . . . . . . . . . . . . . . . . . . . . . . .
ADD-COSMOS-EVENT
Define events for monitored-data acquisition . . . . . . . . . . . . . . . . . . . . . . . . . . . . . . .
ADD-FILE
Define file to be monitored . . . . . . . . . . . . . . . . . . . . . . . . . . . . . . . . . . . . . . . . . . . . .
ADD-ISAM-POOL
Define ISAM pool to be monitored . . . . . . . . . . . . . . . . . . . . . . . . . . . . . . . . . . . . . . .
CALL-ADMINISTRATION-PART
Switch from evaluation part to administration facility . . . . . . . . . . . . . . . . . . . . . . . . .
57
57
57
57
58
59
61
66
69
72
73
74
76
U3585-J-Z125-8-76
Contents
CALL-EVALUATION-PART
Switch from administration facility to evaluation part . . . . . . . . . . . . . . . . . . . . . . . . . 77
CHANGE-MEASUREMENT-PROGRAM
Stop current monitoring program run and restart it with new monitored objects . . . . 78
CLOSE-LOG-FILE
Close SM2 output file . . . . . . . . . . . . . . . . . . . . . . . . . . . . . . . . . . . . . . . . . . . . . . . . . 80
END
Terminate SM2 run . . . . . . . . . . . . . . . . . . . . . . . . . . . . . . . . . . . . . . . . . . . . . . . . . . . 81
INITIATE-COSMOS
Prepare COSMOS monitoring program . . . . . . . . . . . . . . . . . . . . . . . . . . . . . . . . . . . 82
MODIFY-ADMINISTRATOR-ADMISSION
Admit additional SM2 administrators . . . . . . . . . . . . . . . . . . . . . . . . . . . . . . . . . . . . . 83
MODIFY-COSMOS-PARAMETER
Modify parameters for COSMOS monitoring . . . . . . . . . . . . . . . . . . . . . . . . . . . . . . . 84
MODIFY-MEASUREMENT-PERIODS
Modify SM2 monitoring cycle . . . . . . . . . . . . . . . . . . . . . . . . . . . . . . . . . . . . . . . . . . . 93
MODIFY-RESPONSETIME-PARAMETER
Modify parameters for RESPONSETIME monitoring . . . . . . . . . . . . . . . . . . . . . . . . . 95
MODIFY-USER-ADMISSION
Define authorizations for nonprivileged users . . . . . . . . . . . . . . . . . . . . . . . . . . . . . . . 98
OPEN-LOG-FILE
Open SM2 output file . . . . . . . . . . . . . . . . . . . . . . . . . . . . . . . . . . . . . . . . . . . . . . . . 101
REMOVE-BCAM-CONNECTION-SET
Exclude connection set(s) from BCAM-CONNECTION monitoring . . . . . . . . . . . . . 103
REMOVE-CONNECTION-SET
Exclude connection set(s) from RESPONSETIME monitoring . . . . . . . . . . . . . . . . . 104
REMOVE-COSMOS-EVENT
Remove events from COSMOS monitoring parameters . . . . . . . . . . . . . . . . . . . . . . 105
REMOVE-FILE
Remove file(s) from FILE monitoring parameters . . . . . . . . . . . . . . . . . . . . . . . . . . . 107
REMOVE-ISAM-POOL
Remove ISAM pool(s) from ISAM monitoring parameters . . . . . . . . . . . . . . . . . . . . 108
SELECT-HOSTS
Define hosts for SM2 statements and screen output . . . . . . . . . . . . . . . . . . . . . . . . 110
SET-BCAM-CONNECTION-PARAMETER
Define BCAM-CONNECTION monitoring parameters . . . . . . . . . . . . . . . . . . . . . . . 112
SET-CHANNEL-IO-PARAMETER
Define CHANNEL-IO monitoring parameters . . . . . . . . . . . . . . . . . . . . . . . . . . . . . . 114
SET-COSMOS-PARAMETER
Define COSMOS monitoring parameters . . . . . . . . . . . . . . . . . . . . . . . . . . . . . . . . . 115
SET-DISK-PARAMETER
Define DISK monitoring parameters . . . . . . . . . . . . . . . . . . . . . . . . . . . . . . . . . . . . . 123
SET-DISK-FILE-PARAMETER
Define DISK-FILE monitoring parameters . . . . . . . . . . . . . . . . . . . . . . . . . . . . . . . . 124
U3585-J-Z125-8-76
Contents
4.4
SET-PERIODIC-TASK-PARAMETER
Define PERIODIC-TASK monitoring parameters . . . . . . . . . . . . . . . . . . . . . . . . . . .
SET-RESPONSETIME-PARAMETER
Define RESPONSETIME monitoring parameters . . . . . . . . . . . . . . . . . . . . . . . . . . .
SET-SERVICETIME-PARAMETER
Define SERVICETIME monitoring parameters . . . . . . . . . . . . . . . . . . . . . . . . . . . . .
SET-SYSSTAT-PARAMETER
Define SYSSTAT monitoring parameters . . . . . . . . . . . . . . . . . . . . . . . . . . . . . . . . .
SET-TASK-PARAMETER
Define TASK monitoring parameters . . . . . . . . . . . . . . . . . . . . . . . . . . . . . . . . . . . . .
SHOW-ACTIVE-PARAMETER
Output active monitoring parameters . . . . . . . . . . . . . . . . . . . . . . . . . . . . . . . . . . . .
SHOW-DEFINED-PARAMETER
Output defined monitoring parameters . . . . . . . . . . . . . . . . . . . . . . . . . . . . . . . . . . .
SHOW-MEASUREMENT-STATUS
Output monitoring status . . . . . . . . . . . . . . . . . . . . . . . . . . . . . . . . . . . . . . . . . . . . . .
SHOW-SELECTED-HOSTS
Output selected hosts . . . . . . . . . . . . . . . . . . . . . . . . . . . . . . . . . . . . . . . . . . . . . . . .
SHOW-SM2-STATUS
Output status of SM2 system tasks . . . . . . . . . . . . . . . . . . . . . . . . . . . . . . . . . . . . .
SHOW-USER-MEASURED-OBJECTS
Output monitored objects and associated users . . . . . . . . . . . . . . . . . . . . . . . . . . . .
START-MEASUREMENT-PROGRAM
Start monitoring program run . . . . . . . . . . . . . . . . . . . . . . . . . . . . . . . . . . . . . . . . . .
STOP-MEASUREMENT-PROGRAM
Terminate monitoring program run . . . . . . . . . . . . . . . . . . . . . . . . . . . . . . . . . . . . . .
Statements for nonprivileged users . . . . . . . . . . . . . . . . . . . . . . . . . . . . . . . . . . . . . . .
BREAK
Switch to system mode . . . . . . . . . . . . . . . . . . . . . . . . . . . . . . . . . . . . . . . . . . . . . . .
CHANGE-ISAM-STATISTICS
Include and exclude ISAM pools . . . . . . . . . . . . . . . . . . . . . . . . . . . . . . . . . . . . . . . .
DEVICE
Select devices with monitored data . . . . . . . . . . . . . . . . . . . . . . . . . . . . . . . . . . . . .
END
Terminate monitoring . . . . . . . . . . . . . . . . . . . . . . . . . . . . . . . . . . . . . . . . . . . . . . . .
FILE
Monitor files . . . . . . . . . . . . . . . . . . . . . . . . . . . . . . . . . . . . . . . . . . . . . . . . . . . . . . . .
HELP
Request user help information . . . . . . . . . . . . . . . . . . . . . . . . . . . . . . . . . . . . . . . . .
OUTPUT
Define output mode . . . . . . . . . . . . . . . . . . . . . . . . . . . . . . . . . . . . . . . . . . . . . . . . . .
REMARK
Insert remarks . . . . . . . . . . . . . . . . . . . . . . . . . . . . . . . . . . . . . . . . . . . . . . . . . . . . . .
125
127
130
131
132
135
137
139
140
141
143
144
147
150
157
158
160
163
164
165
166
168
U3585-J-Z125-8-76
Contents
4.5
4.6
4.7
5
5.1
REPORT
Select reports . . . . . . . . . . . . . . . . . . . . . . . . . . . . . . . . . . . . . . . . . . . . . . . . . . . . . .
RESTART
Start output of selected reports . . . . . . . . . . . . . . . . . . . . . . . . . . . . . . . . . . . . . . . .
SELECT-DAB-CACHE
Select DAB cache . . . . . . . . . . . . . . . . . . . . . . . . . . . . . . . . . . . . . . . . . . . . . . . . . . .
SELECT-PCA-CACHE
Select cache for PCA DEVICE report . . . . . . . . . . . . . . . . . . . . . . . . . . . . . . . . . . . .
SELECT-PCA-CONTROLLER
Select controllers for PCA CACHE report . . . . . . . . . . . . . . . . . . . . . . . . . . . . . . . . .
SELECT-PERIODIC-TASK-PARAMETER
Select sort criterion and output information for
PERIODIC TASK report . . . . . . . . . . . . . . . . . . . . . . . . . . . . . . . . . . . . . . . . . . . . . . . .
SELECT-PFA-CACHE
Select PFA cache . . . . . . . . . . . . . . . . . . . . . . . . . . . . . . . . . . . . . . . . . . . . . . . . . . .
SELECT-SYMMETRIX-CONTROLLER
Select SYMMETRIX controllers . . . . . . . . . . . . . . . . . . . . . . . . . . . . . . . . . . . . . . . .
SELECT-UTM-APPLICATION
Select UTM applications . . . . . . . . . . . . . . . . . . . . . . . . . . . . . . . . . . . . . . . . . . . . . .
SHOW-USER-MEASURED-OBJECTS
Output monitored objects . . . . . . . . . . . . . . . . . . . . . . . . . . . . . . . . . . . . . . . . . . . . .
START
Start report output . . . . . . . . . . . . . . . . . . . . . . . . . . . . . . . . . . . . . . . . . . . . . . . . . . .
START-ISAM-STATISTICS
Monitor ISAM pools . . . . . . . . . . . . . . . . . . . . . . . . . . . . . . . . . . . . . . . . . . . . . . . . . .
STATUS
Output monitoring status . . . . . . . . . . . . . . . . . . . . . . . . . . . . . . . . . . . . . . . . . . . . . .
STOP-ISAM-STATISTICS
Terminate monitoring of ISAM pools . . . . . . . . . . . . . . . . . . . . . . . . . . . . . . . . . . . . .
BS2000 commands for activating user task monitoring . . . . . . . . . . . . . . . . . . . . . . . .
Writing to the SM2 output file . . . . . . . . . . . . . . . . . . . . . . . . . . . . . . . . . . . . . . . . . . . .
SM2 monitoring program: examples . . . . . . . . . . . . . . . . . . . . . . . . . . . . . . . . . . . . . .
188
189
195
199
SM2 screen output . . . . . . . . . . . . . . . . . . . . . . . . . . . . . . . . . . . . . . . . . . . . . . . . . . .
SM2 reports . . . . . . . . . . . . . . . . . . . . . . . . . . . . . . . . . . . . . . . . . . . . . . . . . . . . . . . . .
ACF report . . . . . . . . . . . . . . . . . . . . . . . . . . . . . . . . . . . . . . . . . . . . . . . . . . . . . . . .
ACTIVITY report . . . . . . . . . . . . . . . . . . . . . . . . . . . . . . . . . . . . . . . . . . . . . . . . . . . .
BCAM CONNECTION report . . . . . . . . . . . . . . . . . . . . . . . . . . . . . . . . . . . . . . . . . .
CATEGORY report . . . . . . . . . . . . . . . . . . . . . . . . . . . . . . . . . . . . . . . . . . . . . . . . . .
CATEGORY QUEUE report . . . . . . . . . . . . . . . . . . . . . . . . . . . . . . . . . . . . . . . . . . .
CATEGORY WSET-Report . . . . . . . . . . . . . . . . . . . . . . . . . . . . . . . . . . . . . . . . . . . .
CHANNEL report . . . . . . . . . . . . . . . . . . . . . . . . . . . . . . . . . . . . . . . . . . . . . . . . . . .
CMS report . . . . . . . . . . . . . . . . . . . . . . . . . . . . . . . . . . . . . . . . . . . . . . . . . . . . . . . .
CPU report . . . . . . . . . . . . . . . . . . . . . . . . . . . . . . . . . . . . . . . . . . . . . . . . . . . . . . . .
201
209
209
211
218
220
222
225
227
229
235
U3585-J-Z125-8-76
169
172
173
174
176
177
179
180
182
183
184
185
187
Contents
5.2
DAB reports . . . . . . . . . . . . . . . . . . . . . . . . . . . . . . . . . . . . . . . . . . . . . . . . . . . . . . .
DAB report . . . . . . . . . . . . . . . . . . . . . . . . . . . . . . . . . . . . . . . . . . . . . . . . . . . . . . . .
DAB CACHE report . . . . . . . . . . . . . . . . . . . . . . . . . . . . . . . . . . . . . . . . . . . . . . . . . .
DEVICE report . . . . . . . . . . . . . . . . . . . . . . . . . . . . . . . . . . . . . . . . . . . . . . . . . . . . .
DISK FILE report . . . . . . . . . . . . . . . . . . . . . . . . . . . . . . . . . . . . . . . . . . . . . . . . . . .
DLM report . . . . . . . . . . . . . . . . . . . . . . . . . . . . . . . . . . . . . . . . . . . . . . . . . . . . . . . .
FILE reports . . . . . . . . . . . . . . . . . . . . . . . . . . . . . . . . . . . . . . . . . . . . . . . . . . . . . . .
GLOBAL report . . . . . . . . . . . . . . . . . . . . . . . . . . . . . . . . . . . . . . . . . . . . . . . . . . . . .
GS report . . . . . . . . . . . . . . . . . . . . . . . . . . . . . . . . . . . . . . . . . . . . . . . . . . . . . . . . .
GSVOL report . . . . . . . . . . . . . . . . . . . . . . . . . . . . . . . . . . . . . . . . . . . . . . . . . . . . . .
ISAM reports . . . . . . . . . . . . . . . . . . . . . . . . . . . . . . . . . . . . . . . . . . . . . . . . . . . . . . .
MEMORY report . . . . . . . . . . . . . . . . . . . . . . . . . . . . . . . . . . . . . . . . . . . . . . . . . . . .
MSCF report . . . . . . . . . . . . . . . . . . . . . . . . . . . . . . . . . . . . . . . . . . . . . . . . . . . . . . .
NET DEVICE report . . . . . . . . . . . . . . . . . . . . . . . . . . . . . . . . . . . . . . . . . . . . . . . . .
NSM report . . . . . . . . . . . . . . . . . . . . . . . . . . . . . . . . . . . . . . . . . . . . . . . . . . . . . . . .
PCA reports . . . . . . . . . . . . . . . . . . . . . . . . . . . . . . . . . . . . . . . . . . . . . . . . . . . . . . .
PCA CACHE report . . . . . . . . . . . . . . . . . . . . . . . . . . . . . . . . . . . . . . . . . . . . . . . . . .
PCA CONTROLLER report . . . . . . . . . . . . . . . . . . . . . . . . . . . . . . . . . . . . . . . . . . .
PCA DEVICE report . . . . . . . . . . . . . . . . . . . . . . . . . . . . . . . . . . . . . . . . . . . . . . . . .
PCS report . . . . . . . . . . . . . . . . . . . . . . . . . . . . . . . . . . . . . . . . . . . . . . . . . . . . . . . .
PERIODIC TASK report . . . . . . . . . . . . . . . . . . . . . . . . . . . . . . . . . . . . . . . . . . . . . .
PFA reports . . . . . . . . . . . . . . . . . . . . . . . . . . . . . . . . . . . . . . . . . . . . . . . . . . . . . . . .
PFA CACHE report . . . . . . . . . . . . . . . . . . . . . . . . . . . . . . . . . . . . . . . . . . . . . . . . . .
PFA CONTROLLER report . . . . . . . . . . . . . . . . . . . . . . . . . . . . . . . . . . . . . . . . . . . .
POSIX report . . . . . . . . . . . . . . . . . . . . . . . . . . . . . . . . . . . . . . . . . . . . . . . . . . . . . .
RESPONSETIME report . . . . . . . . . . . . . . . . . . . . . . . . . . . . . . . . . . . . . . . . . . . . . .
SHARED PVS report . . . . . . . . . . . . . . . . . . . . . . . . . . . . . . . . . . . . . . . . . . . . . . . .
SVC report . . . . . . . . . . . . . . . . . . . . . . . . . . . . . . . . . . . . . . . . . . . . . . . . . . . . . . . .
SYMMETRIX reports . . . . . . . . . . . . . . . . . . . . . . . . . . . . . . . . . . . . . . . . . . . . . . . .
SYMMETRIX CONTROLLER report . . . . . . . . . . . . . . . . . . . . . . . . . . . . . . . . . . . .
SYMMETRIX DEVICE report . . . . . . . . . . . . . . . . . . . . . . . . . . . . . . . . . . . . . . . . . .
TCP/IP report . . . . . . . . . . . . . . . . . . . . . . . . . . . . . . . . . . . . . . . . . . . . . . . . . . . . . .
TLM report . . . . . . . . . . . . . . . . . . . . . . . . . . . . . . . . . . . . . . . . . . . . . . . . . . . . . . . .
UTM reports . . . . . . . . . . . . . . . . . . . . . . . . . . . . . . . . . . . . . . . . . . . . . . . . . . . . . . .
UTM REPORT . . . . . . . . . . . . . . . . . . . . . . . . . . . . . . . . . . . . . . . . . . . . . . . . . . . . .
UTM APPLICATION report . . . . . . . . . . . . . . . . . . . . . . . . . . . . . . . . . . . . . . . . . . . .
VM2000 report . . . . . . . . . . . . . . . . . . . . . . . . . . . . . . . . . . . . . . . . . . . . . . . . . . . . .
SM2 information screens . . . . . . . . . . . . . . . . . . . . . . . . . . . . . . . . . . . . . . . . . . . . . . .
ACTIVE PARAMETER . . . . . . . . . . . . . . . . . . . . . . . . . . . . . . . . . . . . . . . . . . . . . . .
DEFINED PARAMETER . . . . . . . . . . . . . . . . . . . . . . . . . . . . . . . . . . . . . . . . . . . . . .
MEASUREMENT STATUS . . . . . . . . . . . . . . . . . . . . . . . . . . . . . . . . . . . . . . . . . . . .
SELECTED HOSTS . . . . . . . . . . . . . . . . . . . . . . . . . . . . . . . . . . . . . . . . . . . . . . . . .
STATUS TABLE . . . . . . . . . . . . . . . . . . . . . . . . . . . . . . . . . . . . . . . . . . . . . . . . . . . . .
USER MEASURED OBJECTS . . . . . . . . . . . . . . . . . . . . . . . . . . . . . . . . . . . . . . . . .
237
238
240
244
248
250
252
255
256
257
258
261
266
269
270
272
274
276
278
280
282
285
286
288
290
292
299
301
302
303
305
307
309
310
311
313
316
319
319
327
328
332
333
336
U3585-J-Z125-8-76
Contents
6
6.1
6.1.1
6.1.2
6.1.3
6.2
6.2.1
6.2.2
6.2.3
6.3
6.3.1
6.3.2
6.3.3
6.3.4
6.4
Notes on SM2 operation . . . . . . . . . . . . . . . . . . . . . . . . . . . . . . . . . . . . . . . . . . . . . .
System resource utilization by SM2 . . . . . . . . . . . . . . . . . . . . . . . . . . . . . . . . . . . . . . .
External storage utilization . . . . . . . . . . . . . . . . . . . . . . . . . . . . . . . . . . . . . . . . . . . . . .
CPU utilization . . . . . . . . . . . . . . . . . . . . . . . . . . . . . . . . . . . . . . . . . . . . . . . . . . . . . . .
Main memory utilization . . . . . . . . . . . . . . . . . . . . . . . . . . . . . . . . . . . . . . . . . . . . . . . .
Accuracy of the SM2 data . . . . . . . . . . . . . . . . . . . . . . . . . . . . . . . . . . . . . . . . . . . . . .
Causes of inaccuracies . . . . . . . . . . . . . . . . . . . . . . . . . . . . . . . . . . . . . . . . . . . . . . . .
Notes on particular variables . . . . . . . . . . . . . . . . . . . . . . . . . . . . . . . . . . . . . . . . . . . .
Measures for reducing the error sources . . . . . . . . . . . . . . . . . . . . . . . . . . . . . . . . . . .
Special applications . . . . . . . . . . . . . . . . . . . . . . . . . . . . . . . . . . . . . . . . . . . . . . . . . . .
SM2 together with VM2000 . . . . . . . . . . . . . . . . . . . . . . . . . . . . . . . . . . . . . . . . . . . . .
VOLUME load with installed DRV . . . . . . . . . . . . . . . . . . . . . . . . . . . . . . . . . . . . . . . .
Channel load with BUS peripherals . . . . . . . . . . . . . . . . . . . . . . . . . . . . . . . . . . . . . . .
SERVICETIME monitoring values with SYMMETRIX control . . . . . . . . . . . . . . . . . . .
Sample procedures . . . . . . . . . . . . . . . . . . . . . . . . . . . . . . . . . . . . . . . . . . . . . . . . . . .
339
339
339
340
342
343
343
345
346
347
347
351
351
351
352
7
7.1
Variables reports . . . . . . . . . . . . . . . . . . . . . . . . . . . . . . . . . . . . . . . . . . . . . . . . . . . . 361
Table of monitored variables . . . . . . . . . . . . . . . . . . . . . . . . . . . . . . . . . . . . . . . . . . . . 361
8
Messages . . . . . . . . . . . . . . . . . . . . . . . . . . . . . . . . . . . . . . . . . . . . . . . . . . . . . . . . . . 365
9
Installation . . . . . . . . . . . . . . . . . . . . . . . . . . . . . . . . . . . . . . . . . . . . . . . . . . . . . . . . .
Installation procedure . . . . . . . . . . . . . . . . . . . . . . . . . . . . . . . . . . . . . . . . . . . . . . . . . .
Activating the syntax file . . . . . . . . . . . . . . . . . . . . . . . . . . . . . . . . . . . . . . . . . . . . . . .
Creating a new DSSM catalog . . . . . . . . . . . . . . . . . . . . . . . . . . . . . . . . . . . . . . . . . . .
Loading and unloading the subsystem . . . . . . . . . . . . . . . . . . . . . . . . . . . . . . . . . . . .
401
402
402
403
404
10
10.1
10.2
10.3
Appendix . . . . . . . . . . . . . . . . . . . . . . . . . . . . . . . . . . . . . . . . . . . . . . . . . . . . . . . . . . .
SDF syntax description . . . . . . . . . . . . . . . . . . . . . . . . . . . . . . . . . . . . . . . . . . . . . . . .
ISP syntax description . . . . . . . . . . . . . . . . . . . . . . . . . . . . . . . . . . . . . . . . . . . . . . . . .
Overview of SM2 statements . . . . . . . . . . . . . . . . . . . . . . . . . . . . . . . . . . . . . . . . . . . .
Overview of statements for the SM2 administrator . . . . . . . . . . . . . . . . . . . . . . . . . . .
Overview of statements for the nonprivileged user . . . . . . . . . . . . . . . . . . . . . . . . . . .
405
405
422
424
424
437
Glossary . . . . . . . . . . . . . . . . . . . . . . . . . . . . . . . . . . . . . . . . . . . . . . . . . . . . . . . . . . . 443
List of Figures . . . . . . . . . . . . . . . . . . . . . . . . . . . . . . . . . . . . . . . . . . . . . . . . . . . . . . 461
List of Tables . . . . . . . . . . . . . . . . . . . . . . . . . . . . . . . . . . . . . . . . . . . . . . . . . . . . . . . 463
Related publications . . . . . . . . . . . . . . . . . . . . . . . . . . . . . . . . . . . . . . . . . . . . . . . . . 465
Index . . . . . . . . . . . . . . . . . . . . . . . . . . . . . . . . . . . . . . . . . . . . . . . . . . . . . . . . . . . . . . 475
U3585-J-Z125-8-76
Eine Dokuschablone von Frank Flachenecker
by f.f. 1992
SM2 V13.0A (BS2000/OSD)
Software Monitor
Volume 1: Administration and Operation
Target group
This manual is addressed to users and systems support staff.
Contents
The monitoring system SM2 supplies users with statistical data on the performance of their
DP systems and on resource utilization. Volume 1 of the manual describes operation of the
SM2 monitor, the SM2 monitoring programs and the SM2 screen reports.
Analysis and display of the SM2 monitored data are dealt with in Volume 2.
Edition: August 1999
File: SM2_1.PDF
Copyright © Siemens AG 1999.
All rights reserved.
Delivery subject to availability; right of technical modifications reserved.
All hardware and software names used are trademarks of their respective manufacturers.
U3585-J-Z125-8-76
Siemens AG
Information and Communication Products
Computer Systems
User Documentation BS2000
81730 Munich
Germany
Fax: (0 89) 6 36-4 04 43
e-mail: [email protected]
http://manuals.mchp.siemens.de
Submitted by
Comments on SM2 V13.0A
Software Monitor
✁
U3585-J-Z125-8-76
Comments
Suggestions
Corrections
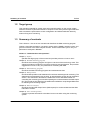
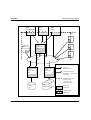
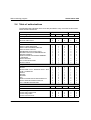
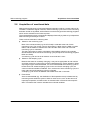
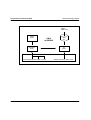
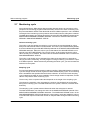
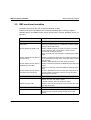
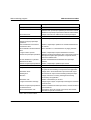
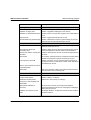
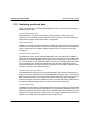
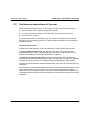
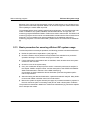


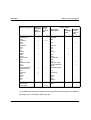
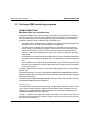
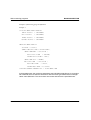
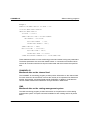
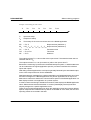
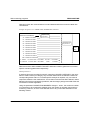
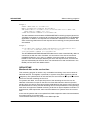
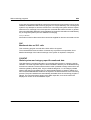
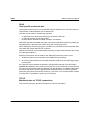
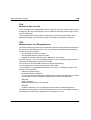
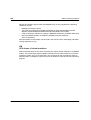
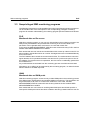
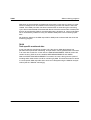
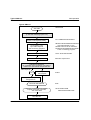
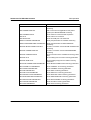
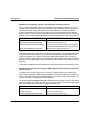
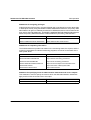
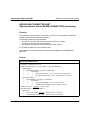
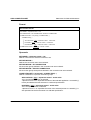
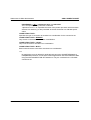
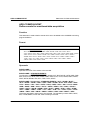

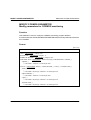
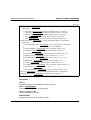
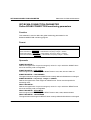
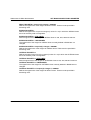
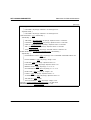

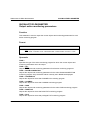
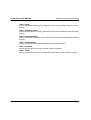
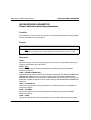
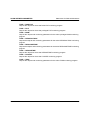
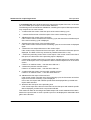
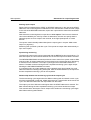
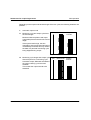
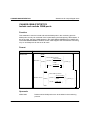
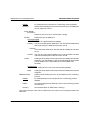
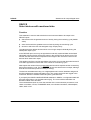
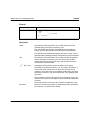
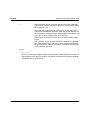
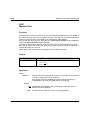

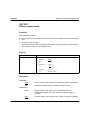
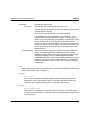
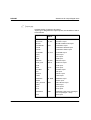
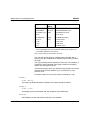
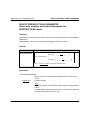
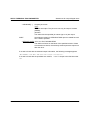
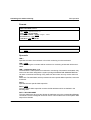
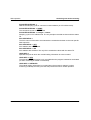
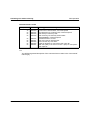
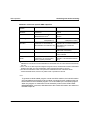

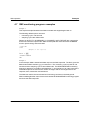
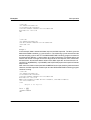
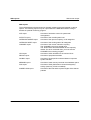
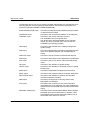
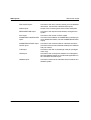
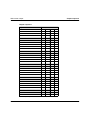
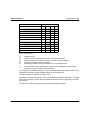
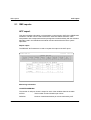
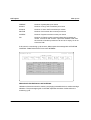
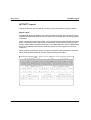
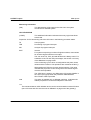
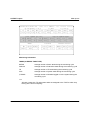
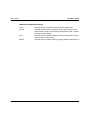
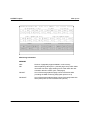
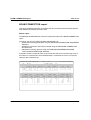
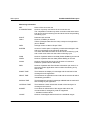
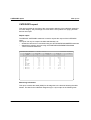
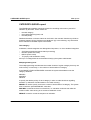
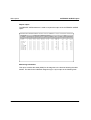
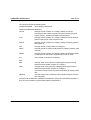
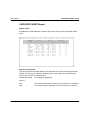
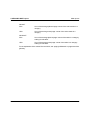
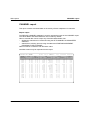
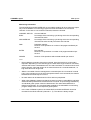
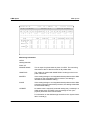
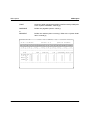
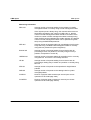
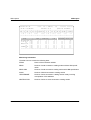
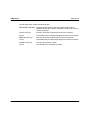
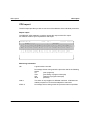
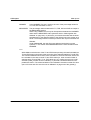
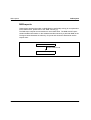
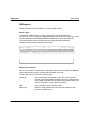
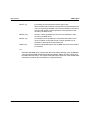
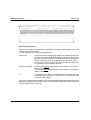
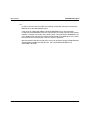
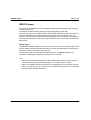
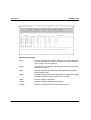
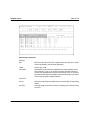
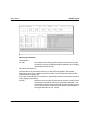
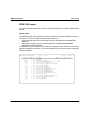
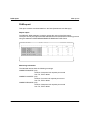
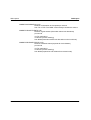
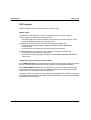
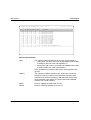
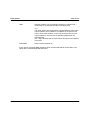
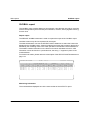
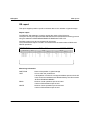
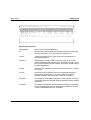

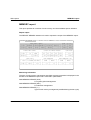
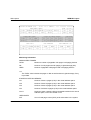
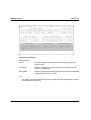
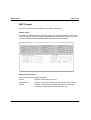
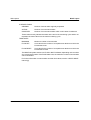
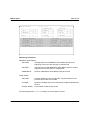
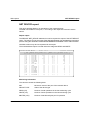
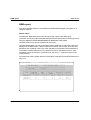
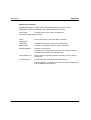
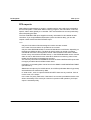
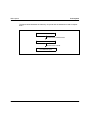
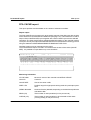
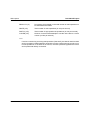
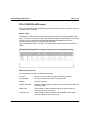
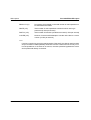

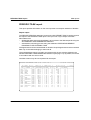
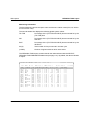
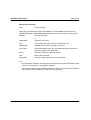
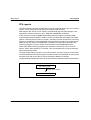
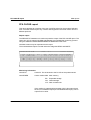
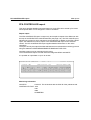
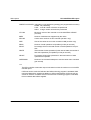
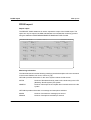
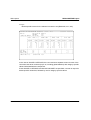
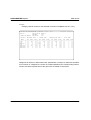
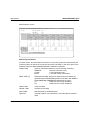
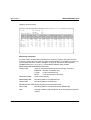
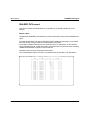
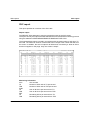
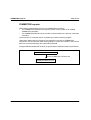
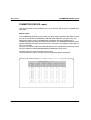
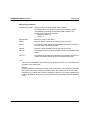
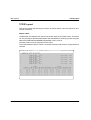
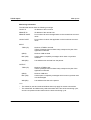
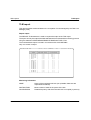
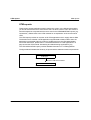
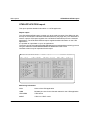
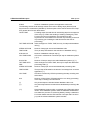
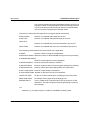
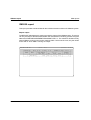
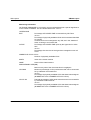
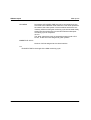
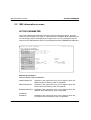
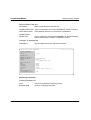
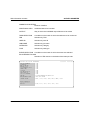
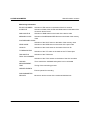
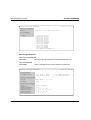
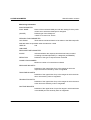
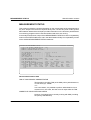
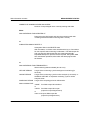
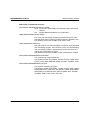
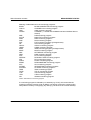
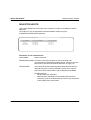
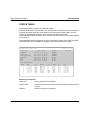
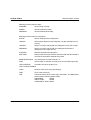

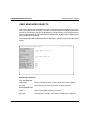

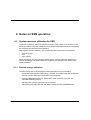
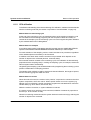
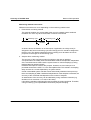
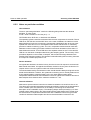
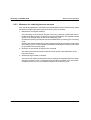
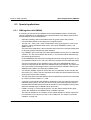
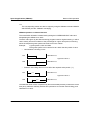
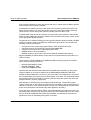
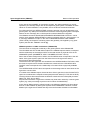
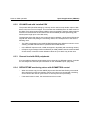
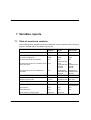
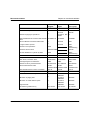
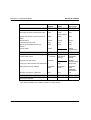

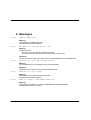
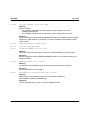
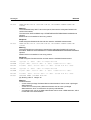
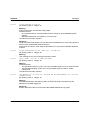
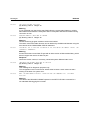

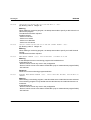
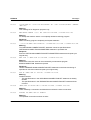
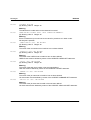
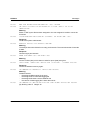
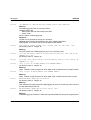
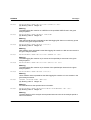
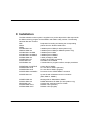
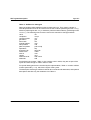
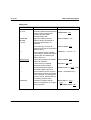
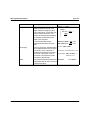
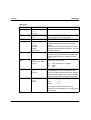
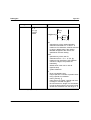
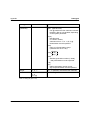
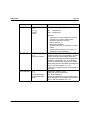
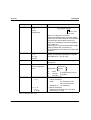
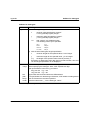
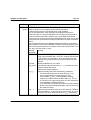
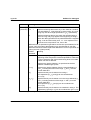
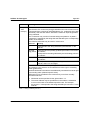
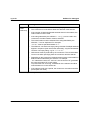
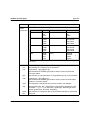
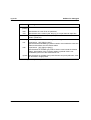
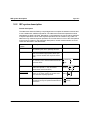
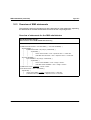
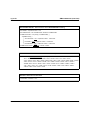
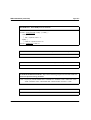
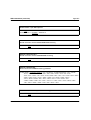
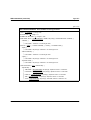
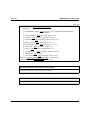
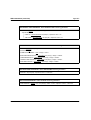
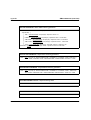
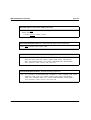
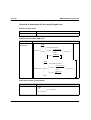
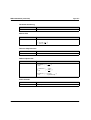
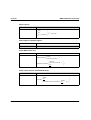
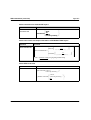
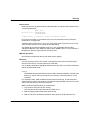
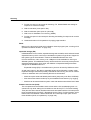
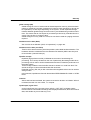
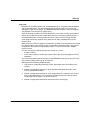
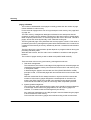
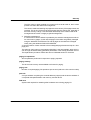
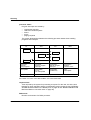
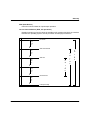
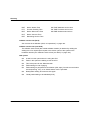
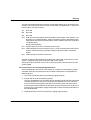
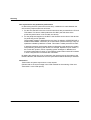


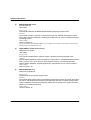
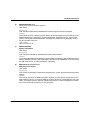
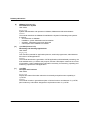
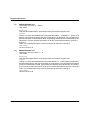
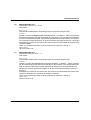
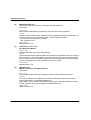
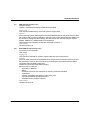


![委託役務業務必携 [PDFファイル/1.09MB]](http://vs1.manualzilla.com/store/data/006529412_2-d6fd05a63a82dc6c43e483fd4bd123cd-150x150.png)