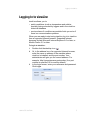
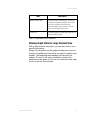
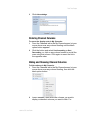
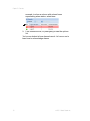
1
USER GUIDE viewLinc 3.6 Vaisala Veriteq viewLinc Software f i g u r at i o n or is not Ex i s t i n g Ne t wor k Us e r P C M211346EN-A Copyright Copyright 2011 Vaisala Canada Inc. All rights reserved. No copying, distribution, publication, modification, or incorporation of this document, in whole or part, is permitted for commercial purposes without the express written permission of Vaisala Canada Inc. Vaisala Canada Inc 13775 Commerce Parkway Richmond, BC V6V 2V4 Canada Trademarks Vaisala Canada Inc, Vaisala Veriteq, Vaisala Veriteq vLog, Vaisala Veriteq viewLinc, and Vaisala Veriteq Spectrum are trademarks of Vaisala Canada Inc. Windows is a registered trademark of Microsoft Corporation. All other trademarks referred to are the property of their respective owners. Disclaimer and Limitation of Liability Vaisala Canada Inc and its subsidiaries assume no responsibility for any damage or loss resulting from the use of this manual. Vaisala Canada Inc and its subsidiaries assume no responsibility for any loss or claims by third parties which may arise through the use of this software. Vaisala Canada Inc. and its subsidiaries assume no responsibility for any damage or loss caused by deletion of data as a result of hardware malfunction. Be sure to make backup copies of all important data to protect against data loss. Vaisala Canada Inc makes no warranties, either expressed or implied, regarding Vaisala Veriteq data loggers, Vaisala 300 Series Transmitters, or software, its merchantability, or its fitness for any particular purpose. The exclusion of implied warranties is not permitted by some states. As such, the exclusion may not apply to you. Vaisala Veriteq viewLinc has been tested using a variety of network systems. However, the large number of possible hardware and network configurations makes testing under every circumstance impossible. If you have trouble using Vaisala Veriteq viewLinc software, contact Vaisala Canada Inc. Technical Support For technical support in North America, please call 1-866-861-3388, or for customers outside North America, see “Getting Help” on page 4. Email: [email protected] Document part number: M211346EN-A Release date: March 2011 Contents Chapter 1: Getting Started . . . . . . . . . . . . . . . . . . . . . . . . . . . . . . . . . 1 Overview . . . . . . . . . . . . . . . . . . . . . . . . . . . . . . . . . . . . . . 2 Logging In to viewLinc . . . . . . . . . . . . . . . . . . . . . . . . . . . 3 Getting Help . . . . . . . . . . . . . . . . . . . . . . . . . . . . . . . . . . . 4 Chapter 2: Channels . . . . . . . . . . . . . . . . . . . . . . . . . . . . . . . . . . . . . . 7 About Channels . . . . . . . . . . . . . . . . . . . . . . . . . . . . . . . . . 8 What is a Channel? . . . . . . . . . . . . . . . . . . . . . . . . . . . . . . . 8 Where are my Channels? . . . . . . . . . . . . . . . . . . . . . . . . . . . 8 Understanding the Channels Screen . . . . . . . . . . . . . . . . . . 9 Opening Large Channel Views . . . . . . . . . . . . . . . . . . . . . 10 Real-Time Graphs . . . . . . . . . . . . . . . . . . . . . . . . . . . . . . 11 Reading Graphs in Large Channel View . . . . . . . . . . . . . . . 12 Viewing Graph Detail in Large Channel View . . . . . . . . . . . 13 Acknowledging Alarms from Large Channel View . . . . . . . 14 Ordering Channel Columns . . . . . . . . . . . . . . . . . . . . . . . . 15 Hiding and Showing Channel Columns . . . . . . . . . . . . . . . 15 Chapter 3: Alarms . . . . . . . . . . . . . . . . . . . . . . . . . . . . . . . . . . . . . . . 17 About Alarms . . . . . . . . . . . . . . . . . . . . . . . . . . . . . . . . . 18 What Happens When an Alarm is Triggered? . . . . . . . . . . . 19 Acknowledging Alarms . . . . . . . . . . . . . . . . . . . . . . . . . . 20 Chapter 4: Events . . . . . . . . . . . . . . . . . . . . . . . . . . . . . . . . . . . . . . . 23 Viewing Events . . . . . . . . . . . . . . . . . . . . . . . . . . . . . . . . 24 Adding Comments to Events . . . . . . . . . . . . . . . . . . . . . . 25 Printing Event Logs . . . . . . . . . . . . . . . . . . . . . . . . . . . . . 25 Exporting Event Logs . . . . . . . . . . . . . . . . . . . . . . . . . . . . 26 Chapter 5: Reports . . . . . . . . . . . . . . . . . . . . . . . . . . . . . . . . . . . . . . 27 About Historical Data . . . . . . . . . . . . . . . . . . . . . . . . . . . . 28 Generating Historical Data Reports . . . . . . . . . . . . . . . . . 28 Generating Alarm History Reports . . . . . . . . . . . . . . . . . . . 28 viewLinc 3.6 User Guide i Contents Generating Channel History Reports . . . . . . . . . . . . . . . . . 30 Index . . . . . . . . . . . . . . . . . . . . . . . . . . . . . . . . . . . . . . . . . . . . . . . . .33 ii © 2011 Vaisala Canada Inc Chapter 1: Getting Started This section includes: • overview of the Vaisala Veriteq Continuous Monitoring System (CMS) • logging in to viewLinc from an Internet browser to monitor conditions viewLinc 3.6 User Guide 1 Chapter 1: Getting Started Overview Welcome to viewLinc 3.6, a key element in the Vaisala Veriteq Continuous Monitoring System (CMS). Using viewLinc you can easily monitor data logger readings locally on a PC or across a network using a supported version of Microsoft® Internet Explorer® or Mozilla® Firefox® Internet browser. With viewLinc 3.6, you can: • monitor remote conditions from multiple data loggers from a local or remote PC desktop • view real-time data in a graphical format • generate historical data and alarm reports • receive visual or email alarms when conditions you are monitoring are out of compliance or if there is a network communication problem • analyze automatically documented logger events, such as when alarms are triggered, acknowledged or there are logger communication problems • schedule transfers of Vaisala Veriteq logger data (also referred to as ‘historical data’) to be viewed and graphed with Vaisala Veriteq Spectrum or vLog software • easily identify loggers and the zones in which they operate • create preconfigured comments for alarm notifications When installed, the Vaisala Veriteq CMS is comprised of software components (including viewLinc), and hardware components (including data loggers, a PC with a supported Internet browser, and, depending on how you connect the loggers to your PC, various cables, Vaisala Veriteq vNet or Digi networking devices). Your administrator will determine the best way to install viewLinc for your needs. You will interact with viewLinc by logging in on the user PC with either Firefox 3.5 or later or Internet Explorer 6.0 or later. Let’s log in now. 2 © 2011 Vaisala Canada Inc Logging In to viewLinc Logging In to viewLinc viewLinc allows you to: • watch conditions (such as temperature and relative humidity) being recorded by loggers and in the viewLinc historical database • receive alarms if conditions are outside limits you set or if there is a communications problem When you are ready to start using viewLinc,log in to viewLinc from a supported Internet browser. Supported Internet browsers include Microsoft Internet Explorer 6.0 or later, or Mozilla Firefox 3.5 or later. To log in to viewLinc: 1 2 3 Double-click the desktop icon . Or, in the address box of a supported Internet browser, enter the name or address of the machine where viewLinc is installed, and the port number. Your administrator will give you the correct address. For example, http://computername:portnumber (if no port number is specified, 80 is used by default). In the login screen, enter your username and password. Click Login. viewLinc 3.6 User Guide 3 Chapter 1: Getting Started 4 The main viewLinc screen appears, showing available channels or (the first time you log in) an empty “My Channels” screen. If you don’t see any channel data, go to the Channels tab. In the Zones area, select a channel from the list, and click Refresh. The selected channel’s data will appear. If no channels display, your data logger may not be connected properly, you may not have Channels assigned to you, or there could be a problem with viewLinc itself. Speak to your administrator. Note: The administrator may have set up the system to prompt you for your password periodically to ensure system security. When prompted, reenter your password. . For more on channels, see Chapter 2: Channels. Getting Help If you need help, technical support is available: North America Contact Vaisala Canada Inc, 8am-4pm PST Monday - Friday, at 1-866-861-3388 (or 604-273-6850) or email [email protected]. See also www.vaisala.com/ veriteq. 4 © 2011 Vaisala Canada Inc Getting Help For sales, pricing, quotations, or general information, please call 1-800-683-8374 (or 604-273-6850). Outside of North America: [email protected] Vaisala Headquarters (Finland) Vanha Nurmijärventie 21 01670 Vantaa FINLAND Industrial Instruments Phone: +358 9 8949 2658 Fax: +358 9 8949 2295 Japan Service Center 42 Kagurazaka 6-Chome Shinjuku-ku Tokyo 162-0825 JAPAN Phone: +81 3 3266 9611 Fax: +81 3 3266 9610 China Service Center Floor 2, EAS Building No. 21, Xiao Yun Road, Dongsanhuan Beilu Chaoyang District Beijing 100027 CHINA Phone: +86 10 5827 4100 Fax: +86 10 8526 1155 viewLinc 3.6 User Guide 5 Chapter 1: Getting Started 6 © 2011 Vaisala Canada Inc Chapter 2: Channels This section is for administrators and general users. In this section, you’ll learn about: • channels and zones • selecting channels and zones to display in My Channels • opening large channel views • viewing and working with real-time graphs in a large channel view Let’s get started learning what a channel is in viewLinc. viewLinc 3.6 User Guide 7 Chapter 2: Channels About Channels What is a Channel? Depending on the type of Vaisala data loggers you have installed, a logger may have up to five channels available to measure temperature, relative humidity, voltage and/or current (one channel is used for each type of measurement). Note: 300 Series Transmitters Output Quantities are displayed as Channels. Each channel displays the type of data being measured. Using viewLinc, you can monitor any data logger channel that is connected to the network. When you first log in to viewLinc, the Channels window displays. This window includes: • zones available for monitoring • data logger channels available for the selected zone • active monitoring channels and actual channel data • threshold indicators • context-sensitive Help Where are my Channels? If you don’t see any channels in the My Channels area, it could be that: • There are no zones or channels selected. In the Zones area, ensure at least one channel or zone has the check Refresh in the My box next to it selected, then click Channels area. • Your logger may not be connected properly. Speak to your administrator. 8 © 2011 Vaisala Canada Inc About Channels Understanding the Channels Screen The Channels screen in viewLinc contains many important features: Tabs Zones button bar My Channels button bar Zones area My Channels area Zone channels button bar Zone channels available Help window Item Details Tabs Contains main viewLinc tabs: Channels, Transfers, Events, System, Alarms, Reports. Zones button bar Contains buttons like Refresh, Pause Alarming, etc. Zones area Where configuration of zones takes place. Use zones to organize the many channels that may be connected to viewLinc. Zones channels available List of data logger channels available for a selected zone. My Channels area Includes details on channel configurations, current data readings, latest timestamp and threshold alarm setting information. Table 1: Important parts of the Channels screen My Channels displays general information about your logger and channels. Most columns are easy to understand; however, here are a few definitions to help you get familiar viewLinc 3.6 User Guide 9 Chapter 2: Channels with viewLinc. To see all options, see “Hiding and Showing Channel Columns” on page 15: Column Displays Zone Zone the channel is in. Logger Description Logger description (editable from the System tab). Channel Number Number representing the channel for that logger (each logger has 1 or more channels, and labels them 1, 2, and so on). Channel Description Description of channel (editable from the System tab). Value Value of that channel, for example, temperature in Celsius. Timestamp Time that the last channel reading was taken. Status “OK” appears if there are no currently active alarms. Changes to indicate if a threshold alarm condition or any other alarm has been detected. Threshold Summary Summary of threshold status, if active. Alarming Indicates whether the channel or logger is currently alarming (having reached an alarm threshold). Table 2: Columns of information in My Channels Opening Large Channel Views This window contains the most current data reading for the channel, any related threshold settings, a graphical representation of recent historical data readings, and an area to indicate an active alarm. Note: 10 You can view a particular channel reading in a single window, or you can open multiple channel © 2011 Vaisala Canada Inc Real-Time Graphs windows. If you use Internet Explorer, ensure your browser is set up to open new links in a new window or tab. Go to Tools | Internet Options, then, on the General tab in the Tabs section, click Settings and choose to open links from other programs in A new tab in the current window. To open a large channel view: 1 From the Channels tab in the My Channels area, select a channel you want to view. 2 Click View or double-click the selected channel line. A new resizeable window containing information about the selected channel appears. 3 Repeat steps 1 and 2 to view multiple large channel views. To close a large channel view, click the close box in the top right corner of the window. To acknowledge an alarm, see “Acknowledging Alarms” on page 20. Real-Time Graphs With viewLinc, you can view live data in graphical form at any time. Each graph displays the last 300 or 1000 data points (based on the sample interval set for the logger and the Internet browser you use), and threshold values for the corresponding time period. To view live data as a graph: 1 From the Channels tab, in the My Channels area, select a channel you to want to view. 2 Click View (or double-click the selected channel line) This opens the large channel view. In this screen you can view the most recent historical trends, and hover over specific data points for more detailed readings. viewLinc 3.6 User Guide 11 Chapter 2: Channels Reading Graphs in Large Channel View When you open a channel, you can read both a numerical and graphical representation of the logger reading. Here is a description of the key elements in the graphing area: Item Description Title bar Displays the name of the active logger and type of data reading (humidity, temperature, voltage or current). Header bar Indicates the date and time of latest reading; the time zone is based on the time zone setting of the PC running the browser. Numerical display area Displays most current data value in units being measured, as defined by the user. Graph area A graphical representation of data history is displayed here. Left-side Y-axis Shows the scale for the data displayed in the graph. X-Axis time scale Shows the reporting time frame ( if you use Internet Explorer 6.0, you can only view the last 300 data points; all other browsers will show the last 1000 points). Channel Line Indicated by a line to show historical measurement readings based on a specific date or time frame. Move your mouse and hover over a specific point to show the specific X- and Y-axis values. Threshold Line Indicated by a color-coded line (based on threshold setting) to show historical threshold values. Move your mouse and hover over a specific point to show the specific X- and Y-axis values. Table 3: Large channel view elements 12 © 2011 Vaisala Canada Inc Real-Time Graphs Item Description Active Alarms area Displays active alarm details: Threshold value and amount exceeded; alarm date and time; whether the alarm was acknowledged, and by whom. Permits user to acknowledge an alarm. Status bar Indicates channel monitoring status (OK or Alarm condition type). Table 3: Large channel view elements Viewing Graph Detail in Large Channel View With a large channel view open, you can also zoom in on a specific time period. Simply click anywhere on the graph and drag your cursor to the right to highlight the time period you want to magnify, then release. The magnified area displays until the next live update. To return to full view immediately, double-click anywhere on the graph (or to zoom out, select an area, drag cursor to the left, then release). viewLinc 3.6 User Guide 13 Chapter 2: Channels Use your mouse to click and select a time period. Release the mouse to view the details. Acknowledging Alarms from Large Channel View From a large channel view window, you can acknowledge alarms. To acknowledge an alarm from a large channel view: 1 From the large channel view Active Alarm panel, click Acknowledge. 2 14 In the Acknowledge Alarm dialog box that appears, enter information to describe what was done to correct the alarm situation, or a general comment. © 2011 Vaisala Canada Inc Real-Time Graphs 3 Click Acknowledge. Ordering Channel Columns To re-sort the display order in My Channels: 1 From the Channels tab in the My Channels area, let your 2 mouse hover over any column heading until the black option button appears. Click the button and select Sort Ascending or Sort Descending, or, click on any column header to sort all the rows using that column. Click again to resort the list in the opposite order. Hiding and Showing Channel Columns To hide columns in My Channels: 1 From the Channels tab in the My Channels area, let your mouse hover over any column heading, then click the black option button. 2 Select Columns, then select the columns you want to display or deselect columns you want to hide. For viewLinc 3.6 User Guide 15 Chapter 2: Channels example, to show a column with colored icons representing alarm status, select Icon. 3 Click outside the list, or press [Esc] to hide the options list. You’ve now looked at how channels work - let’s move on to learn how to acknowledge alarms. 16 © 2011 Vaisala Canada Inc Chapter 3: Alarms Alarms and alarm acknowledgement are one of the keys to success with the Vaisala Veriteq Continuous Monitoring system. In this chapter, you’ll learn to: • understand types of alarms in viewLinc • create alarm templates • set threshold and communication alarms • deactivate and reactivate alarms • acknowledge alarms • pause alarms To learn about how to generate Alarm reports, see Chapter 5: Reports. Let’s get started looking at alarms. viewLinc 3.6 User Guide 17 Chapter 3: Alarms About Alarms Users with Full Control, Configure Alarms, and Configure Custom Threshold permissions can set alarm limits, and, when conditions exceed these limits, alarms are triggered which notify key staff of the condition. Staff with Acknowledge Alarms permissions or higher then acknowledge alarms in viewLinc. All transactions are recorded in the Event Log and the Historical database. There are several types of alarms in viewLinc: threshold alarms, communication alarms, event log validation alarms, and logger sampling alarms. If you are using validatable loggers, you may also receive logger validation alarms and calibration alarms. Using viewLinc, you can customize the alarm information that is issued for threshold, communication and logger alarms by configuring them from the System | Loggers tab. Threshold Alarms Threshold alarms notify users when conditions (such as temperature and relative humidity) are outside acceptable limits. Threshold alarms are not enabled by default. To trigger threshold alarms when certain thresholds are exceeded, users with assigned permissions must configure them. Communication Alarms Communication alarms notify users when communication between a host (Logger Host or viewLinc Server) and its data loggers is down. This may be because viewLinc Server can not communicate with the logger, or the data logger connection to a host has been severed. Communication alarms serve as a system health test, alerting you if there is a problem that might disrupt viewLinc monitoring and alarming. 18 © 2011 Vaisala Canada Inc About Alarms Event Log Validation Alarms An Event Log Validation alarm indicates that the viewLinc event log historical data has been modified or tampered with and is therefore no longer validatable. Logger Configuration Alarms If you receive a Configuration Alarm, this indicates that your data logger has stopped recording data history or was configured incorrectly. This could be the result of being set to stop when full, a delayed start, or the logger could have an internal error. This alarm can also be triggered if a channel has been disabled in the logger using Spectrum or vLog. To correct this issue, you can verify or modify the Vaisala Veriteq data logger settings using vLog. If the problem persists, contact your Vaisala technical support representative. Logger Validation Alarms If you use a VL-type data logger, you’ll receive a Validation alarm if the validation memory in the logger is corrupted or has been modified. Contact your Vaisala technical support representative. Logger Calibration Alarms If you use a VL-type data logger, Calibration Alarms send you intermittent notification when your data logger is due for calibration. You receive notifications at the following intervals: 3 months and 1 month before the calibration date, then again on the data logger’s scheduled calibration date. This alarm will remain active until the logger has been recalibrated. What Happens When an Alarm is Triggered? When an alarm is triggered, several things can happen (depending on the configuration set by your administrator): • A pop-up can appear showing a description of the condition, and an alarm message. If pop-ups are blocked in your browser, an error message appears, prompting you to enable pop-ups for viewLinc. • An email can be sent. If configured, emails are automatically sent to the address (or addresses) specified when threshold limits are exceeded, communications are viewLinc 3.6 User Guide 19 Chapter 3: Alarms interrupted, or an event log or logger alarm condition is present. Alarm emails can be sent repeatedly based on how alarm properties have been set. • An application can be launched or an external device turned on. If configured, an external device (such as a light or buzzer) or a computer application (such as batch file which can page or phone a particular number) can be triggered when an alarm condition occurs. • All of the above. Your administrator may also set up a tree alarm hierarchy, a method of notifying different individuals of an alarm if the first notification is not acknowledged within a specified time frame. Alarms should be acknowledged in viewLinc and the situation dealt with as soon as possible. All transactions are recorded in the Event Log and Historical database and can be viewed in an Event Log or Alarm report. Acknowledging Alarms All users can receive alarms, but only users with the correct permission can acknowledge alarms. If an alarm is set to require alarm acknowledgement, alarms must be acknowledged. You must be logged in to viewLinc to acknowledge alarms. Acknowledgement information, such as the action taken and any comments, is tracked in the Event Log and Historical database. For more information, see Chapter 4: Events and Chapter 5: Reports. When an alarm is triggered, a new row appears in the Alarms tab. This section covers acknowledging alarms using the Active Alarms tab. You can also acknowledge alarms from a large channel view (see “Acknowledging Alarms from Large Channel View” on page 14). To acknowledge alarms from the alarms tab: 1 From Alarms | Active Alarms, select the active alarm, then click 20 Acknowledge. © 2011 Vaisala Canada Inc Acknowledging Alarms 2 The Acknowledge Alarm dialog box appears, prompting you to enter actions taken and comments. 3 Click Acknowledge. Your comments and actions are added to the Event log and the Acknowledge Alarm box closes. My Channels is updated with this change in status. viewLinc 3.6 User Guide 21 Chapter 3: Alarms 22 © 2011 Vaisala Canada Inc Chapter 4: Events All events - such as alarms, transfers of data from the data logger, alarm acknowledgements, system configuration changes and general system notifications - are tracked in viewLinc’s Event Log, under the Events tab. The data tracked in Events is different from the data tracked in a data logger. Where the viewLinc Event Log tracks events occurring within the viewLinc system (such as notification of successful transfer of data from a logger to a stored local directory), the data logger itself tracks the changes in temperature, relative humidity or voltage. To ensure viewLinc continuously monitors and stores event history, event log validation alarms notify you when the viewLinc event log has been modified. For more about event log validation alarms, see Chapter 3: Alarms. Use the Events tab to analyze events to determine when and where particular problems occurred, or to diagnose a situation that needs troubleshooting. In this section, you’ll learn to: • view events • add comments to events • print event logs • export and save event log data into .xls format viewLinc 3.6 User Guide 23 Chapter 4: Events Viewing Events Events are viewed on an Event Log, a text-based listing of all system events occurring with the data loggers on your system. To view Events: 1 From viewLinc, click Events. The Event Log appears, 2 3 displaying a list of events, and, if available, comments on the event in the Event Details area to the right of the event listing. Using the date and time selectors, choose the period for which you want to see events. Enter a date (using format MM/DD/YYYY HH:MM) or use the calendar button to specify a date range. Using the buttons to the right of the date and time selectors, select or deselect buttons to see specific types of event details. After selecting an event type button to Refresh to refresh the list. The filter your results, click more buttons you deselect, the shorter the list will be. You can choose to view: • Alarm Events. A list of alarms that were triggered during the specified time period. • Admin Events. A list of administrator actions taken, such as logging in to viewLinc and new alarm threshold settings. • Transfer Events. List of logger data transfers performed during the specified time period. • System Events. List of changes to configuration options or any failed attempts to communicate between viewLinc Servers and data loggers. 24 © 2011 Vaisala Canada Inc Adding Comments to Events Adding Comments to Events You may want to add comments to the Event Log, perhaps to outline why an event occurred or what was done in response to an event or problem. To add a comment to the Event Log: 1 From viewLinc, click Events. 2 Highlight the row (event) to add the comment to, and click Add Comment. The Add Custom Comments to Event screen appears. 3 Enter your comment, then click Save. To view a comment for a particular event, highlight the row containing that event and look for the comment in the Event Details area. 4 Printing Event Logs To print the event log: 1 From viewLinc, click Events. 2 3 Choose the date and time range you are interested in printing. In the date/time box, enter a date and/or time in 24-hour notation, or click the calendar icons to make your selection. Using the buttons to the right of the date and time selector, choose to either include or not include Alarm Events, Admin Events, Transfer Events and/or System Events. 4 Click Refresh. 5 Click Print. viewLinc 3.6 User Guide 25 Chapter 4: Events 6 In a new browser window, a printer-friendly Event Log report opens. 7 The Print dialog box displays automatically allowing you to set your print parameters and print the Event Log. Exporting Event Logs With viewLinc you can export event log data into a saved .xls file for analysis at a later date. To export event logs: 1 In viewLinc, click Events and choose the date range you 2 3 4 26 are interested in exporting. In the date/time box, enter a date and/or time in 24-hour notation, or click the calendar icons to make your selection. Using the buttons to the right of the date and time selector, choose to either include or not include Alarm Events, Admin Events, Transfer Events and/or System Events. Click Refresh. Click Export. A file download dialog opens, prompting you to open or save the events .xls file. © 2011 Vaisala Canada Inc Chapter 5: Reports Using viewLinc, you can create graphs and reports to analyze changes in data over time based on the historical data collected by Vaisala loggers. In this section, you’ll learn what historical data is and how to: • analyze historical data • generate historical data reports in graphical and tabular formats viewLinc 3.6 User Guide 27 Chapter 5: Reports About Historical Data Vaisala data loggers have the ability to store large amounts of data inside them. Data is logged in frequencies from once every 10 seconds to once every 24 hours. To set this frequency -- known as the sample interval -- for Vaisala Veriteq loggers, refer to the Spectrum or vLog User Guide. To set the sample interval for 300 Series Transmitters refer to the specific Vaisala product User Guide . With viewLinc you can monitor real-time conditions for loggers over the network, analyze or graph changes in conditions over time, or compare conditions recorded by different loggers. This analysis is performed using the Reports tab. Generating Historical Data Reports viewLinc provides you with a set of graphical reports which can help you easily view trends in data readings or alarm monitoring statistics (such as alarm trigger frequency). • Alarm reports provide an overview of alarm events over a period of time (events related to every alarm are grouped together and presented in a readable form). • Channel History reports provide a detailed history of channel values (presented in both graphical and tabular form). Generating Alarm History Reports To generate an Alarm history report: 1 On the Reports tab in the Alarm Reports list, select the report you want to generate. The report parameters appear on the right side of your screen (users can only view report parameters for the reports they generate, or reports to which they have been granted owner access). 2 28 On the General tab you can specify the period you want the report to include using the default option, Most Recent © 2011 Vaisala Canada Inc Generating Historical Data Reports Events, or a specific date range. If you choose a fixed date range, use the calendars to indicate from/to dates. Note: 3 In the Scheduled Generation area of the General tab, you can choose the format for your report (PDF or tabseparate, for Excel), to automatically generate and save the report to a specific file location, or send the report to an email address or a list of addresses (use a comma to separate email addresses). You can also schedule when you want the report to generate, and how frequently you want it generated. Note: 4 5 If you have Admin access, you can select a Report Owner, the user you want to have access to modify or generate this report (to set up a list of users refer to the viewLinc Administrator Guide). For large report data sets, we recommend that you schedule report generation at a time when few users are using the system, such as after business hours. On the Report Content tab determine whether you want a brief report (with one line for each alarm) or a detailed report (showing details about all alarm activities: activation, notifications, acknowledgement, etc.). On the Report Source Data tab define the report scope. To include alarm report details from all channels, select All Channels. You can also select specific channels and zones: a Select the option, Selected Channels and Zones. b To select one or more channels in a zone, select the zone name (checkbox). c viewLinc 3.6 User Guide To select a specific channel in a zone, select the channel description (checkbox). 29 Chapter 5: Reports d Repeat these steps for each channel you want to in- clude on the report. All selected channels appear in the Selected region. 6 On the Page Layout tab define your report display options: a Page Header and/or Page Footer options: choose the pages you on which you want a header or footer displayed. To define the header or footer, enter text in the Left, Center or Right fields. b You can also choose the type of paper you want to print on, and the orientation. 7 8 Click Save. To manually generate the report, from Generate Report choose either Export to Excel or Generate PDF Report, Generating Channel History Reports To generate a Channel History report: Note: viewLinc does not provide a default Channel History report. Instead, the first time you generate a Channel History report, the report is automatically saved. 1 2 3 30 On the Reports tab, in the Channel History Reports list, select the report you want to generate. The report details appear on the right side of the screen. On the General tab specify the user you want to have access to this report (if not already granted Full Control), and the range type data based on a specific date range, or the most recent data. In the Scheduled Generation area, you can choose the format for your report (PDF or tab-separate, for Excel), to automatically generate and save the report to a specific file location, or send the report to an email address or a list of addresses (use a comma to separate email addresses). You can also schedule when you want the report to generate, and how frequently you want it generated. © 2011 Vaisala Canada Inc Generating Historical Data Reports Note: 4 5 For large report data sets, we recommend that you schedule report generation at a time when few users are using the system, such as after business hours. On the Report Content tab identify the types of data you want included in the report, including Logger Samples (data points retrieved from the data logger’s internal memory), Logger Sample Statistics (this allows you to change Statistic Settings in the Statistic Settings tab), Real-time Samples, and/or Thresholds. If you include Logger Sample Statistics, use the Statistics Settings tab to define how information will display on your report, and any statistical information you want to include: a From Statistics Settings, select a statistics interval if you want to intermittently generate statistics within the time frame of a report. For example, if your report generates data based on a seven day (weekly) interval, you may want to view statistics daily. b In the Include area, select the types of statistical data you want to add to the report, including maximum value, average value, minimum value, standard deviation and mean kinetic temperature (MKT): 6 • If you want to specify the activation energy, check Mean kinetic temperature and specify the activation energy as KJ/mol. On the Report Source Data tab, define the report scope and color spectrum. To report on all channels, select All Channels. You can also select specific channels and zones: a Select the option, Selected Channels and Zones. b To select one or more channels in a zone, select the zone name. c To select a specific channel in a zone, select the channel description checkbox. d To add an index to the graph, select Show Markers. e viewLinc 3.6 User Guide To specify a color to highlight a specific channel’s data, select the channel, then select an option from the 31 Chapter 5: Reports color dropdown. If you select Auto, viewLinc chooses a color according to the default color spectrum: f 7 When the channel line colors are set to ‘Auto’ viewLinc assigns the next free color from a built-in palette of colors. Repeat for each channel you want to include on the report. All selected channels appear in the Selected region. Use the Page Layout tab to define the headers, footers, paper size and orientation: a For Header or Footer options, choose to display on all pages, on the first page only, on the last page only, or on the first and last page. b To define the content of your header or footer, enter text in the Left, Center or Right fields. c 32 You can also choose the paper size you want to print on, and the orientation. 8 Click Save. 9 To manually generate the report, click Report. Generate © 2011 Vaisala Canada Inc Index Numerics 300 Series Transmitters output quantities 8 A acknowledge an alarm 14, 20 active alarms viewing 13 adding comments to event logs 25 alarm trigger launch an application or action 20 alarming status, defined 10 alarms 17–21 acknowledging 14, 20 active viewing 13 communication 18 email notifications 19 logger 19 Configuration 19 Logger Calibration alarms defined 19 multiple notifications 20 threshold 18 tree hierarchy 20 Validation 19 average value 31 channels 7–16 displaying in My Channels 4, 8 opening 10 output quantities 8 reading graphs 12 closing large channel view 11 color selecting for reports 31 comments adding to event logs 25 viewing 25 communication alarms defined 18 Configuration alarms defined 19 E email notifications 19 event logs 23–26 adding comments to 25 exporting 26 printing 25 saving 26 viewing 24 viewing comments 25 Excel reports 29, 30 exporting event logs 26 C G Calibration alarms 19 Channel Description defined 10 Channel Number 10 Channel Value defined 10 reading 12 H viewLinc 3.6 User Guide graphs reading 11 viewing 10 help 4 historical data 2, 27 purpose of 28 viewing 10 33 Index I Internet Explorer settings 10 L PDF reports 29, 30 pop-ups for alarms 19 printing event logs 25 large channel view closing 11 reading graphs 11 launching applications or devices 20 Logger Configuration alarms defined 19 Logger Validation alarms defined 19 loggers Calibration alarms 19 Configuration alarms 19 Validation alarms 19 login screen 3 logs, event. See event logs. R M sample count 31 See also loggers session expiry 4 setting browser settings 10 spreadsheets, event log data in 26 standard deviation 31 statistics intervals 31 statistics settings 31 Status bar, defined 10 maximum value 31 mean kinetic temperature (MKT) 31 Microsoft Excel exporting logs to 26 viewLinc event logs and 26 minimum value 31 My Channels 9 N notifications calibration 19 multiple 20 O opening large channel view 10 output quantities 8 P passwords reconfirmation after session expiry 4 34 reading channel values 12 graphs in large channel view 12 threshold values 12 reports 27–32 color 31 Excel 29, 30 generating 28, 30 PDF 29, 30 types 28 S T Tab bar 9 technical support 4 threshold alarms defined 18 Threshold Summary, defined 10 threshold values, reading 12 timestamp 10 transmitters output quantities 8 © 2011 Vaisala Canada Inc Index U user accounts logging in 3 using color for reports 31 V Validation alarms defined 19 viewing active alarms 13 channels 10 event comments 25 viewLinc channels displaying in My Channels 4, 8 logging in 3 security options 4 X xls files 26 Z zones viewing 9 viewLinc 3.6 User Guide 35 Index 36 © 2011 Vaisala Canada Inc