1
PowerLogicTM Series 800 Power Meter
Appendix D—Advanced Power Quality Evaluations
63230-500-225A2
3/2011
EN50160 Evaluation Data Available Over a Communications Link
Portal Registers
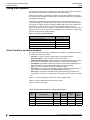
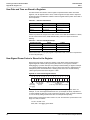
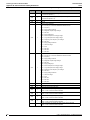
Evaluation data is available over communications via “portal” register reads. Each data
item is assigned a portal register number. A block read of the specified size at that address
will return the data for that item. In general, if the block size is smaller than specified, the
data returned will be 0x8000 (-32768) to indicate the data is invalid. If the block size is
larger than specified, the data for the item will be returned and the remaining registers will
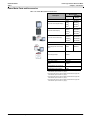
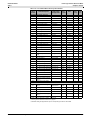
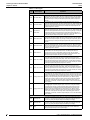
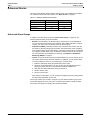
be padded with 0x8000. Refer to Table D–12 for portal register descriptions.
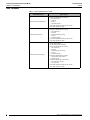
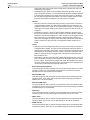
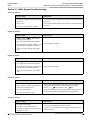
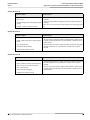
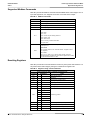
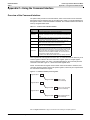
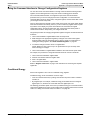
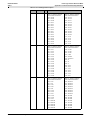
Table D–12: Portal Register Descriptions
Portal
Description Size
Data
Register number of Metered Quantity (can be used to confirm data item
being reported)
Register value (present metered value)
Average value (at end of last completed averaging time period)
Minimum value during the last completed averaging time period
Maximum value during the last completed averaging time period
Minimum value during this interval
Maximum value during this interval
Minimum value during the last interval
53432 –
53434
Summary of
Meter Data
33
Evaluations by
Item
Maximum value during the last interval
Percent in Evaluation Range 1 this interval
Percent in Evaluation Range 2 this interval (when applicable)
Percent in Evaluation Range 1 last interval
Percent in Evaluation Range 2 last interval (when applicable)
Count of average values in Evaluation Range 1 (MOD10L2)
Count of average values in Evaluation Range 2 (MOD10L2)
Count of total valid averages for Evaluation of Range 1 (MOD10L2)
Count of total valid averages for Evaluation of Range 2 (MOD10L2)
Date/Time Last Excursion Range 1 (4-register format)
Date/Time Last Excursion Range 2 (4-register format)
Date/Time Last Reset (4-register format)
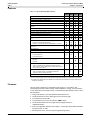
Count of rapid voltage increases this week
53435 –
53437
Summary of
Rapid Voltage
12
Changes by
Phase
Count of rapid voltage decreases this week
Count of rapid voltage increases last week
Count of rapid voltage decreases last week
Date/Time last rapid voltage change (4-register format)
Date/Time last reset (4-register format)
53438 –
53440
53441 –
53443
Summary of
Voltage Dips
104
by Phase This
Week
Summary of
Voltage Dips
104
by Phase Last
Week
Count of dips by magnitude & duration this week (96 values) [See
“Detection and Classification of Supply Voltage Dips” on page 97.]
Date/Time last voltage dip (4-register format)
Date/Time last reset (4-register format)
Count of dips by magnitude & duration last week (96 values) [See
“Detection and Classification of Supply Voltage Dips” on page 97.
Date/Time last voltage dip (4-register format)
Date/Time last reset (4-register format)
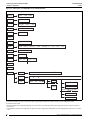
Flag indicating interruption is active
Elapsed seconds for interruption in progress
Count of short interruptions this year
53444 –
53447
Summary of
Supply
Voltage
Interruptions
3-Phase and
by Phase
Count of long interruption this year
Count of short interruptions last year
34
Count of long interruptions last year
Count of interruptions by duration this year (10 values) [See “Detection of
Interruptions of the Supply Voltage” on page 98.]
Count of interruptions by duration last year (10 values) [See “Detection of
Interruptions of the Supply Voltage” on page 98.]
Date/Time of last interruption (4-register format)
Date/Time of last reset (4-register format)
© 2011 Schneider Electric. All Rights Reserved.
101