1
Agilent
Compatibility of the U2000 Series USB Power Sensors with
Agilent Instruments
Application Note
U2000 Series USB Power Sensor as an Agilent Instrument
Accessory
Table of Contents
Introduction
2
U2000 Series USB Power
Sensor’s Compatibility with
Agilent Instruments
3
How Does It Work?
• N5230C PNA-L Vector
4
Network Analyzer
• E5071C ENA Vector
6
Network Analyzer
• N9340x Handheld Spectrum
8
Analyzer
• N5183A MXG Signal Generator 12
Conclusion
13
Related Literature
14
Product Web Site
14
Making an accurate power measurement requires both a power meter and a power
sensor. The power sensor converts the RF signal and microwave signal into analog
signals. Subsequently, the power meter will perform the statistical processing and
display the result in decimal format. Today, the Agilent U2000 Series USB power sensors
connect to a PC via the USB port, providing power measurements ranging from +20 dBm
to –60 dBm, and over frequencies ranging from 9 kHz to 24 GHz. The combination of
power meter and power sensor makes the U2000 Series USB power sensor a standalone
instrument that provides an affordable solution for power measurement. Results of the
power measurement can be retrieved through the power measurement software on the
PC via USB cable or via SCPI commands. The U2000 Series USB power sensors are also
compatible with Agilent instruments such as the vector network analyzer, spectrum
analyzer, signal generator, cable and antenna tester, and FieldFox RF analyzer.
This application note explains how the U2000 Series USB power sensor performs source
power calibration with the N5230A PNA-L and scalar analysis of a frequency converter
with E5071C ENA vector network analyzer. The U2000 Series USB power sensors are
able to turn the N9340A handheld spectrum analyzer into a power meter function and
also perform user flatness correction (UFC) with external leveling using the N5183A MXG
signal generator.
Introduction
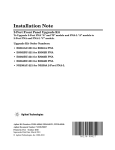
The U2000 Series USB power sensors are USB-based power sensors, which are more
affordable and lighter in weight than typical power meters (see Figure 1). The USB power
sensor can measure true average power from the RF and microwave device and thus
makes the power sensor similar to power-sensing solutions. Current power measurement
solutions require the power sensor to be connected to a power meter in order to perform
measurements.
The new breakthrough design of the U2000 Series USB power sensors enables the
sensors to function as standalone instruments that can operate with a PC to provide the
power measurement. The plug-and-play USB connectivity provides fast and easy setup.
The power sensor also eases monitoring and troubleshooting with the features-packed
N1918A Power Analysis Manager software.
Features
• Frequency ranging from 9 kHz to 24 GHz (sensor dependent)
• Wide dynamic range of –60 dBm to +44 dBm
• Internal triggering capability without the need for an external triggering module and
power supply
• Internal zeroing capability that eliminates the need for external calibration
• High measurement speed of up to 250 readings per second
• Power measurement in PC or selected Agilent instruments
• True average power measurement for all signal types with unlimited bandwidth
Figure 1 U2000 Series USB power sensor
2
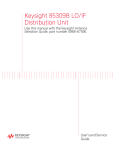
U2000 Series USB Power Sensor’s Compatibility with Agilent Instruments
The Agilent instruments such as vector
network analyzers, spectrum analyzers,
signal generators, cable and antenna
testers, and FieldFox RF analyzer are
now compatible with the U2000 Series
USB power sensors (see Table 1 and
Figure 2). Each compatible instrument
has built-in firmware to support the
USB power sensor, unless it specifically
requires N1918A Power Analysis Manager
software or the Visual Basic Assistant
(VBA) application. You must upgrade
your instrument’s firmware to the latest
revision (see Table 1) through the Agilent
Web site, in order to enable the features
and compatibility.
Vector Network Analyzer (PNA, PNA-X
and PNA-L)
To perform the source power calibration
and provide the output power to measure
gain compression, intermodulation
distortion, and other device parameters
accurately.
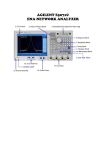
Vector Network Analyzer (ENA)
To perform scalar analysis of a frequency
converter, which requires the VBA
application. The ENA also perform the
source power calibration and provide
the output power to measure gain
compression, intermodulation distortion,
and other device parameters accurately.
Spectrum Analyzer (MXA, EXA and PXA)
To display the power measurement on
spectrum analyser with the free N1918A
Power Analysis Manager software.
Signal Generator (MXG)
To perform user flatness correction
(UFC) with external leveling. Supports
and displays two USB power sensor
measurement on the MXG display.
Handheld/RF Spectrum Analyzer,
Cable and Antenna Tester, and
FieldFox RF Analyzer/VNA
Turns the instrument into a power meter.
Displays power measurement with its
user interface (UI), which integrates
the display of USB power sensor
measurements.
Table 1 Firmware release and revision compatible with USB power sensor
Instrument
Model No.
Firmware Revision
Vector Network Analyzer
PNA: E836xA/B/C
PNA: N522xA
PNA-X: N5242A
PNA-L: N5230A/C
ENA: E506xA/B
A.07.50.13 and above
A.09.42.16 and above
A.07.50.13 and above
A.10.06 and above*1
A.02.06 and above *1
Spectrum Analyzer
Handheld: N9340A/B
RF Spectrum Analyzer: N9320B
MXA: N9020A
EXA: N9010A
PXA: N9030A
A.01.05 and above
B.02.20 and above
A.01.74 and above*2
A.01.74 and above*2
A.04.05 and above*2
Signal Generator
MXG: N518xA and N516xA
A.01.31 and above
Cable and Antenna Tester
Handheld: N9330A/B
A.01.05 and above
FieldFox RF Analyzer
N9912A FieldFox RF Analyzer
N9923A FieldFox RF VNA
A.02.05 and above
A.05.53 and above
*1 Able to perform scalar analysis of a frequency converter which requires the VBA application, and able to
perform source power calibration with built-in firmware.
*2 Refer to the Power Analysis Manager N1918A Installation Guide (N1918A-90002) for PC hardware
requirements.
E836xA/B/C PNA Vector
Network Analyzer
N5242A PNA-X Vector
Network Analyzer
N5230A/C PNA-L Vector
Network Analyzer
E5071C ENA Vector
Network Analyzer
*Requires VBA wizard
N9912A FieldFox RF
Analyzer
N518xA MXG
Signal Generator
N9330A/B Handheld
Cable and Antenna
Tester
N9010A EXA Signal Analyzer
*Requires N1918A software
N9020A MXA Signal Analyzer
N9320B RF Spectrum
Analyzer
*Requires N1918A software
N9340A/B Handheld
Spectrum Analyzer
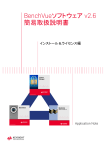
Note: Each compatible instrument comes with built-in firmware to support the USB power sensor, unless specified whereby it requires N1918A Power Analysis Manager or VBA wizard.
Figure 2 U2000 Series USB power sensors’ compatibility with Agilent instruments
3
How Does It Work?
N5230C PNA-L Vector Network
Analyzer
N5230C PNA-L
• To perform the source-power
calibration.
GPIB
• To provide output power in order to
measure gain compression, intermodulation distortion, and other
device parameters accurately.
With source power calibration, the power
at a certain point is calibrated, to be
within the range of the uncertainty of the
power meter and sensor. For details of the
Source Power Cal procedure, please refer
to the Agilent Web site’s PNA Source
Power Cal procedure online help file
(Power Calibration, under the Calibrating
a Measurement section). You can readily
obtain the procedure from Network
Analyzer’s Help menu.
Traditionally, the source power calibration
is performed through GPIB connectivity
and supported by the Agilent power meter
and sensor (see Figure 3). This solution
requires a big space for storing the power
meter and sensor in the production test,
along with considerable expense, to
acquire power meter and sensor just for
Source Power Cal purposes.
Coaxial cable
Power Meter
Power Sensor
Figure 3 Source Power Cal using both power meter and power sensor
connected to PNA through GPIB connection
N5230C PNA-L
USB Port
USB mini-B connector
with locking mechanism
Coaxial cable
U2000 Series USB
power sensor
Figure 4 USB power sensor connecting directly to a PNA USB port through
USB mini-B connector
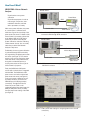
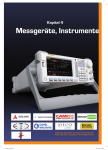
Today, the U2000 Series USB power
sensors offer a solution that is integrated
with the PNA. The U2000 Series USB
power sensors are used to replace both
power meter and sensor (see Figure 4)
in the source power calibration process.
It provides the direct connection into
PNA USB port via USB plug-and-play
connectivity. Throughout the Source
Power Cal process, PNA can be
configured to detect the power meter (via
GPIB) or USB power sensor (via USB)
from the power meter setting of the PNA
(see Figure 5).
Figure 5 PNA’s power meter setting for configuring USB sensor via USB
connectivity
4
How Does It Work? (continued)
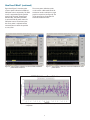
Figure 6 and Figure 7 show the results
of source power calibration for EPM and
USB power sensors respectively. The PNA
source is stepped through the specified
range (in this example, stepped from 1
GHz to 6 GHz), and power (at 0 dBm)
is measured with the power meter and
USB power sensor. At each data point,
the source power is adjusted until the
measured power is within the specified
accuracy level.
The source power calibration results
can be saved in a Microsoft® Excel file
and the two results combined in a single
graph for comparison (see Figure 8). The
results appear to be comparable and
within the ±0.05 db limit line.
Figure 6 Source power calibration result with EPM and E9301A
power meter and sensor
Figure 7 Source power calibration result with U2000 Series USB
power sensor
Figure 8 EPM power meter and USB power sensor source power calibration data
comparison
5
How Does It Work? (continued)
E5071C ENA Vector Network
Analyzer
• To perform scalar analysis of a
frequency converter which requires
a VBA application through U2000
Series USB power sensor.
E5071C ENA Series Network Analyzer with Frequency Offset Mode Option
IF ± Df
f1
ENA has a frequency offset mode (FOM)
option used to measure the frequency
converter device accurately. The “offset”
of source and receiver port frequency
can be defined precisely. The receiver
port can detect the down-converter or
up-converter signal. There are limitations
to using FOM to measure the frequency
converter device. First, the local oscillator
(LO) signal of the device under test (DUT)
has to be known and locked to the source
or receiver port frequency of a network
analyzer. Otherwise, the difference
between predicted intermediate frequency
(IF) signal and actual IF signal is directly
converted to a magnitude error because
of the intermediate frequency bandwidth
(IFBW) filter shape implemented in these
network analyzers.
Figure 9 shows the ENA setup in FOM
mode. IFBW is set to 1 kHz, and the 3 dB
BW of the IFBW filter is approximately
1 kHz. If the actual output frequency of
the DUT has offset as 500 Hz (=BW/2)
from target frequency, the magnitude
result has a 3 dB error. When the output
signal drifts, the measurement results are
also changed at the same time.
You can overcome the limitation of FOM
by using the USB power sensor (with
network analyzer VBA, sample wizard
is available) as a “broadband power
detector” (see figure 10). The USB power
sensor is used to measure all power in its
bandwidth, and the measurement result is
stable and not influenced by output signal
offset or drift (see Figure 11). For instance,
the USB power sensor provides USB plugand-play connectivity and easy setup in
the network analyzer.
ADC
f1 – f2 + IF
Port 1
Port 2
DUT
f1
RF
IF
f1 – (f2 ± Df)
When IFBW = 1 kHz, then
3 dB BW = 1 kHz
Df influences magnitude accuracy
f2 ± Df
Figure 9 IFBW versus LO frequency drifts with FOM mode
E5071C ENA Series Network Analyzer with USB Power Sensor
IF
f1
ADC
f1 – f2 + IF
USB Connection
Port 2
Port 1
DUT
f1
RF
IF
f1 – (f2 ± Df)
LO
U200x Power Sensor
Df does not influence the power
meter’s measurement accuracy
f2 ± Df
Figure 10 USB power sensor (broadband detect) versus LO Frequency drift
6
How Does It Work? (continued)
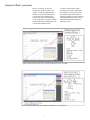
Figure 11 and Figure 12 show the
measurement result of “locked” and
“drifted” LO signal by FOM mode (see
the blue trace) and USB power sensor
(see the red trace) respectively. The
measurement result of the USB power
sensor shows that it has good correlation
with the FOM result at locked signal, and
is stable with drifted LO signal.
For details of the frequency offset
procedure and operation of VBA with
the USB power sensor, please refer to
the “Agilent Simple Scalar Network
Analysis of Frequency Converter Devices
using U2000 USB Power Sensor Series
with ENA Series Network Analyzers,
Application Note”
Figure 11 Measurement results with “Locked” LO (RF Power versus IF Power)
Figure 12 Measurement results with “Drifted” LO (RF Power versus IF Power)
7
How Does It Work? (continued)
N9340A Handheld Spectrum
Analyzer
• Turns the handheld spectrum analyzer
into power meter. Displays power
measurement with its user interface
(UI), which integrates the display of
power measurements.
Instructions
1. Power up the N9340A. Connect the U2000 Series USB power sensor to the USB port
of the N9340A (see Figure 13).
Keystrokes surrounded by [ ] represent
front-panel hardkeys of the instruments,
while keystrokes surrounded by { }
represent softkeys.
Figure 13 HHSA connect with USB power sensor.
2. Press [Mode], use [↑] or [↓] key to select the {Power Meter} then press [ENTER]
(see Figure 14).
Figure 14 N9340A HHSA turns into a power-meter measurement
Power Meter Menu
• Zeroing: Access to zeroing and calibration menu
• Meas Disp: Access to measurement display menu and configure the displayed
measurement resolution and format
• Meas Setup: Set up the relative measurement or set display offsets.
• Preset: Preset the USB power sensor
8
Instructions
3. Press {Zeroing ►} to perform the Internal or External Zeroing if necessary (see
Figure 15).
Figure 15 External and Internal Zeroing are performed to reduce the zero offset
and noise impact in order to measure power accurately
Internal Zeroing
Internal zeroing uses an electronic switch to isolate the power sensor bulkhead
from the internal measurement circuitry during the procedure, thereby allowing the
sensor to be physically connected to an active RF source when internally zeroing.
Therefore, you do not need to disconnect the RF source or power off the external
source during an internal zero procedure. This feature makes internal zeroing more
convenient, but you may only use internal zeroing if zero set (Internal) is within the
application requirements.
External Zeroing
In external zeroing, the sensor does not utilize the electronic switch to isolate
the measurement circuitry from the bulkhead. In this case, the RF power must be
removed from the bulkhead either by turning the source off or physically removing
it from the sensor during the external zero procedure. External zeroing generally
has better zero set performance. The INT or EXT zeroing selection should be made
based on the measurement needs.
By default, internal zeroing is performed by the firmware when the USB sensor is
connected to N9340A HHSA.
9
Instructions
4. Press {Return}. Press {Meas Disp ►} (see Figure 16).
Figure 16 Meas Disp menu allows you to configure the display
measurement and resolution
The Meas Disp (Measurement Display) menu allows you to configure the
measurement display as follows:
• Disp Range: Indicates the top and bottom range of display measurement.
• Resolution: Indicates the measurement resolution’s numeric type in four
different levels (1, 2, 3 or 4). The default Resolution is 3.
• Disp Mode: You can configure the measurement display either in meter or
chart format. The default Disp Mode is Meter.
• Chart View: Switches the measurement display to chart view
• Pause: Pause or continue the measurements
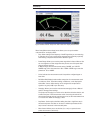
To view the measurement in chart or graph format, press {Disp Mode} to select
{Chart} (see Figure 17).
Figure 17 Measurement display in chart format
10
Instructions
5. Press {Return}. Press {Meas Setup} (see Figure 18).
Figure 18 Measurement Setup menu with meter-view display measurement
Meas Setup (Measurement Setup) menu allows you to set up the relative
measurement or set display offsets.
• Freq: Allows setting for the frequency of the RF signal that you are measuring.
It optimizes the accuracy and minimizes measurement uncertainty, especially
when making comparative measurements between signals.
•
Power Range: Allows you to set the power range either in Auto or Manual. You
are encouraged to use Auto range when they are not sure of the power level
they are about to measure.
In Manual range, there are two manual setting: “LOWER” and “UPPER”.
LOWER range covers the power from -60 to -10dBm. UPPER range covers the
power from -10 to +20dBm.
•
Limits: Indicates the measurement result is beyond the configured upper or
lower limit.
•
Rel/Offset: Rel (Relative) mode enables comparison of a measurement result
to a reference value. The relative reading, or difference, can be displayed in
either dB or % terms. Offset setting can be configured to compensate for
signal loss or gain (in dB) in your test setup.
•
Averaging: Allows you to set the measurement averaging in Auto or Manual
mode, to average power readings.
The purpose of averaging is to reduce noise, obtain the desired resolution, and
to reduce the jitter in the measurement results. Increasing the value of the
measurement average reduces measurement noise, but the measurement time
is increased. The default of Averaging is Auto.
•
Step Detect: Used to reduce the filter settling time after a significant step in
the measured power. The filter can be set to re-initialize upon detection of a
step increase or decrease in the measured power.
•
Meas Interval: Allows you to set the time (in s or ms) to capture the new
power measurement continuously.
11
How Does It Work? (continued)
N5183A MXG Signal Generator
• To perform user flatness correction
(UFC) with external leveling to
improve power accuracy and flatness.
• To provide dual display measurement
of two USB power sensors.
User flatness correction with external
leveling provides the ability to have
extremely flat output power at the testing
interface beyond the signal generator RF
output connector. If an external device
(such as amplifier, attenuator, coupler,
detector, divider or long cable) is placed
between the RF output connector and
the testing interface, it will introduce
additional gain or loss as well as
frequency response mismatch to the
whole system. Therefore it is necessary to
perform the UFC with external leveling to
remove this type of influence.
Figure 19 Connection diagram of USB sensor to MXG for UFC external leveling
In this case, the U2000 Series USB power
sensor offers a solution integrated with
the MXG. The U2000 Series USB power
sensor is directly connected to front
panel’s USB port of MXG (see Figure 19)
provides remote programming function.
The MXG’s built-in UFC personality will
allow you to configure the calibration
array, start and stop frequency and
number of the frequency points to be
corrected. The setup function thus will
observe the difference between measured
power and calibrated power. The
correction factors of the UFC process are
shown as in Figure 20.
For details of operation and procedure
on UFC with external leveling and
power measurement, please refer to
“Agilent How to Utilize User Flatness
Correction with External Leveling Using
USB Power Sensor on MXG Signal
Generator, Application Note” and “Agilent
N5161A/62A/81A/82A/83A MXG Signal
Generators, User’s Guide”.
Figure 20 Correction factors automatically performed and display on MXG
12
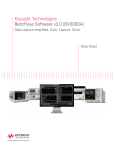
Dual Power Meter Display
Function on MXG
The dual power meter display function can
be used to display the current frequency
and average power of either one or two
power sensors. For each channel, you can
control the settings for On/Off, channel
frequency, channel offset, averaging and
measurement units, and the dual power
meter display feature. To use two U2000
series power sensors with the MXG, an
USB hub (with power supply) can be
connected to the MXG’s front panel USB
connector (see figure 21). Figure 22 shows
the dual power meter display function on
MXG signal generator.
USB Port
U2000 Series USB Power Sensor
N5183A MXG
Figure 21 Connection diagram of two USB power sensors on MXG via external USB hub
Figure 22 Dual power meter display function on MXG signal generator
Conclusion
The U2000 Series USB power sensors are compact and portable, easy to use, and cost
effective for you as it provides the following benefits:
•
Compatibility with other Agilent instruments such as vector network analyzer,
spectrum analyzer, signal generator, cable and antenna tester, and FieldFox RF
analyzer.
•
Portability for field application. The smaller size and light weight of the USB power
sensors allow you to carry it to the site for field applications.
•
Simplified measurement setup with USB power, plug-and-play connectivity, and builtin triggering circuit.
•
Lower cost without compromising on performance or quality. Standalone USB power
sensors do not need a power meter to provide accurate power measurement via PC/
laptop or other Agilent instruments.
13
Related Literature
Product Web Site
[1] Agilent U2000 Series USB Power
Sensors, Technical Overview
Literature Number: 5989-6279EN
For most up-to-date and complete
application and product information, visit
Agilent Web site at the following URL:
[2] Agilent N9340A Handheld Spectrum
Analyzer, Technical Overview
Literature Number: 5989-5071EN
www.agilent.com/find
[3] Agilent Handheld Cable and Antenna
Tester, Technical Overview
Literature Number: 5989-5522EN
[4] Agilent Simple Scalar Network
Analysis of Frequency Converter
Devices using the U2000 USB Power
Sensor Series with the ENA Network
Analyzer, Application Note
Literature Number: 5989-8689EN
14
www.agilent.com
For more information on Agilent Technologies’ products, applications or services,
please contact your local Agilent office. The
complete list is available at:
Agilent Email Updates
www.agilent.com/find/emailupdates
Get the latest information on the
products and applications you select.
www.axiestandard.org
AdvancedTCA® Extensions for
Instrumentation and Test (AXIe) is
an open standard that extends the
AdvancedTCA for general purpose
and semiconductor test. Agilent
is a founding member of the AXIe
consortium.
Agilent Advantage Services is committed
to your success throughout your equipment’s lifetime. To keep you competitive, we continually invest in tools and
processes that speed up calibration and
repair and reduce your cost of ownership.
You can also use Infoline Web Services
to manage equipment and services more
effectively. By sharing our measurement
and service expertise, we help you create
the products that change our world.
www.agilent.com/find/advantageservices
www.lxistandard.org
LAN eXtensions for Instruments puts
the power of Ethernet and the Web
inside your test systems. Agilent is a
founding member of the LXI consortium.
www.pxisa.org
PCI eXtensions for Instrumentation
(PXI) modular instrumentation
delivers a rugged, PC-based high-performance measurement and automation system.
Agilent Channel Partners
www.agilent.com/find/channelpartners
Get the best of both worlds: Agilent’s
measurement expertise and product
breadth, combined with channel
partner convenience.
Agilent Electronic Measurement Group
DEKRA Certified
ISO 9001:2008
Quality Management Sys
System
www.agilent.com/quality
www.agilent.com/find/contactus
Americas
Canada
Brazil
Mexico
800
United States
Asia Pacific
Australia
China
Hong Kong
India
Japan
Korea
Malaysia
Singapore
Taiwan
Other AP Countries
(877) 894 4414
(11) 4197 3600
01800 5064
(800) 829 4444
1 800 629 485
800 810 0189
800 938 693
1 800 112 929
0120 (421) 345
080 769 0800
1 800 888 848
1 800 375 8100
0800 047 866
(65) 375 8100
Europe & Middle East
Belgium
32 (0) 2 404 93 40
Denmark
45 45 80 12 15
Finland
358 (0) 10 855 2100
France
0825 010 700*
*0.125 €/minute
Germany
6333
Ireland
Israel
Italy
Netherlands
Spain
Sweden
United Kingdom
6201
49 (0) 7031 464
1890 924 204
972-3-9288-504/544
39 02 92 60 8484
31 (0) 20 547 2111
34 (91) 631 3300
0200-88 22 55
44 (0) 118 927
For other unlisted countries:
www.agilent.com/find/contactus
Revised: January 6, 2012
Product specifications and descriptions
in this document subject to change
without notice.
Microsoft is a U.S. registered trademark of Microsoft Corporation.
© Agilent Technologies, Inc. 2012
Published in USA, July 12, 2012
5989-8743EN