1
User guide for the Casio Classpad
Portland Community College
Tammy Louie
[email protected]
Summer 2011
1
Contents
1 The
1.1
1.2
1.3
layout of your Casio Classpad
Application Keys . . . . . . . . . . . . . . . . . . . . . . . . . . . . . . . . .
Settings and Modes . . . . . . . . . . . . . . . . . . . . . . . . . . . . . . . .
Screen Settings other important features . . . . . . . . . . . . . . . . . . . .
3
3
5
6
2 Calculator Basics
8
2.1 Keyboard . . . . . . . . . . . . . . . . . . . . . . . . . . . . . . . . . . . . . 8
2.2 Pretty Print/ 2D . . . . . . . . . . . . . . . . . . . . . . . . . . . . . . . . . 10
2.3 Drag and Drop . . . . . . . . . . . . . . . . . . . . . . . . . . . . . . . . . . 11
3 Performing Calculations
3.1 Algebra . . . . . . . .
3.1.1 Simplify . . . .
3.1.2 Expand . . . .
3.1.3 Factor . . . . .
3.1.4 Solve . . . . . .
.
.
.
.
.
.
.
.
.
.
.
.
.
.
.
.
.
.
.
.
.
.
.
.
.
.
.
.
.
.
.
.
.
.
.
.
.
.
.
.
.
.
.
.
.
.
.
.
.
.
.
.
.
.
.
.
.
.
.
.
.
.
.
.
.
.
.
.
.
.
.
.
.
.
.
.
.
.
.
.
.
.
.
.
.
.
.
.
.
.
.
.
.
.
.
.
.
.
.
.
.
.
.
.
.
.
.
.
.
.
.
.
.
.
.
.
.
.
.
.
12
12
12
14
15
16
4 Storing
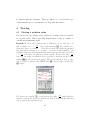
4.1 Storing a solution value . . . . . .
4.2 Storing a function . . . . . . . . .
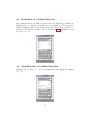
4.3 Evaluation of a defined function . .
4.4 Simplification of a defined function
4.5 Solve using a defined function . . .
.
.
.
.
.
.
.
.
.
.
.
.
.
.
.
.
.
.
.
.
.
.
.
.
.
.
.
.
.
.
.
.
.
.
.
.
.
.
.
.
.
.
.
.
.
.
.
.
.
.
.
.
.
.
.
.
.
.
.
.
.
.
.
.
.
.
.
.
.
.
.
.
.
.
.
.
.
.
.
.
.
.
.
.
.
.
.
.
.
.
.
.
.
.
.
.
.
.
.
.
.
.
.
.
.
.
.
.
.
.
.
.
.
.
.
19
19
21
23
23
24
5 Graphing Equations/ Functions
5.1 Swap and Resize . . . . . . . . . . . . . . . . .
5.2 Graphing options . . . . . . . . . . . . . . . . .
5.3 Graphing an equation or function . . . . . . . .
5.4 Finding intercepts and intersections . . . . . .
5.4.1 y-intercept and trace . . . . . . . . . . .
5.4.2 x-intercepts/ roots . . . . . . . . . . . .
5.4.3 Finding Maximums and Minimums . . .
5.4.4 Finding intersection between two graphs
.
.
.
.
.
.
.
.
.
.
.
.
.
.
.
.
.
.
.
.
.
.
.
.
.
.
.
.
.
.
.
.
.
.
.
.
.
.
.
.
.
.
.
.
.
.
.
.
.
.
.
.
.
.
.
.
.
.
.
.
.
.
.
.
.
.
.
.
.
.
.
.
.
.
.
.
.
.
.
.
.
.
.
.
.
.
.
.
.
.
.
.
.
.
.
.
.
.
.
.
.
.
.
.
.
.
.
.
.
.
.
.
.
.
.
.
.
.
.
.
.
.
.
.
.
.
.
.
25
25
26
27
31
31
32
34
36
.
.
.
.
.
.
.
.
.
.
.
.
.
.
.
.
.
.
.
.
.
.
.
.
.
.
.
.
.
.
6 Tables
38
7 Extensions to other math courses
7.1 Statistics . . . . . . . . . . . . . . . . . . . . . . . . . . . . . . . . . . . . .
7.2 Trigonometry and Conic sections . . . . . . . . . . . . . . . . . . . . . . . .
7.3 Calculus and 3D graphs . . . . . . . . . . . . . . . . . . . . . . . . . . . . .
39
39
40
41
2
1
1.1
The layout of your Casio Classpad
Application Keys
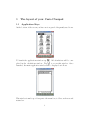
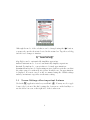
At the bottom of the screen you have an icon panel of frequently used icons.
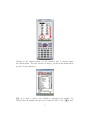
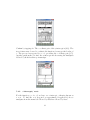
To launch the applications window tap m. All calculations will be completed in the calculations window. Tap M to access this window. Once
launched, the main application window will be displayed as follows:
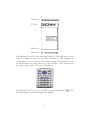
This window is made up of four parts: the menu bar, toolbar, work area and
status bar.
3
Menu bar
Toolbar
Work area
Status bar
Both the menu bar and toolbar will change relative to the application you are
using. The status bar seen above shows the current modes. The settings seen
in the image above are considered the initial defaults. Later in this section,
we will discuss how to change the mode of the calculator. The calculator has
two types of keyboards: soft keys and hard keys.
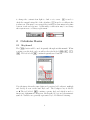
The hard keys can be seen above and the soft keys found under k
will discuss these features throughout the manual.
4
. We
1.2
Settings and Modes
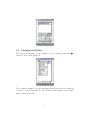
The modes and format of your calculator can be changed using the O
button located on the menu bar.
Choose Basic Format to specify rounding features like fix 4 for solutions
rounded to four decimals places. The calculator will default to exact values
unless otherwise specified.
5
Although the mode of the calculator can be changed using the O button,
you may also use the shortcuts located in the status bar. Tap the word Alg
and the word changes to Assist.
Alg Algebra mode: automatically simplifies expressions.
Assist Assistant mode: does not automatically simplify expressions.
Decimal Decimal mode: convert values to decimal approximations
Standard Standard mode: display using an exact form except in the case that
the value cannot be written in exact form. In which case, an approximation
is displayed. For most cases, I would recommend using the default settings
unless your instructor specifies an alternate setting.
1.3
Screen Settings other important features
Under the m application window you will find Y. You may need to toggle
down to the bottom of the list by using the down arrow on the hardkeys or
use the slider bar seen on the right side of the touchscreen.
6
Changes to the actual software of your calculator may be changed using
the system menu. The user should not change options in this menu unless
specified by the instructor.
; can be used to restore your calculators original factory settings. Be
advised that all settings and previous downloads will be lost. Z is used
7
to change the contrast from light to dark or vice versa. X is used to
check the current battery life of the calculator. M is used to recalibrate the
touchscreen. This may be necessary if the touchscreen demonstrates lag time
between touch and response. Additionally, recalibration may be necessary
after system reset or battery replacement.
2
2.1
Calculator Basics
Keyboard
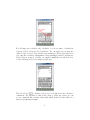
The k
button will be used frequently throughout this manual. When
you first open the keyboard you will see the tabs labeled 9
,0
,(
,
)
. The tab labeled9
contains frequently used buttons.
Note the image shows the same digits and operators (add, subtract, multiply
and divide) as seen on the hard keyboard. The backspace key is labeled
as ,.The tab labeled 0
contains a qwerty keyboard which is used to
insert text, alphanumeric characters, Greek symbols, logic and other numeric
symbols. Variables are generally represented by bold italicized lettering.
8
For all single use variables, the calculator does not require a distinction
between bolded and non-bolded variables. For our purposes you may use
either bolded or non-bolded variable representations. It is noteworthy, however, that the calculator distinguishes between multiple variable expressions.
Bolded letters grouped together are implied multiplication whereas nonbolded lettering is read as a single variable xyz.
The tab labeled (
contains a directory for all functions and calculator
commands. We will refer to this as the catalog. Using the catalog we can
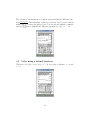
access commands like absolute value abs( which treats absolute value as a
function prompting an input.
9
2.2
Pretty Print/ 2D
Other calculators like the TI-89 use a feature called pretty print to display
fractions, exponents, radials and other complex mathematical expressions.In
contrast, the Casio Classpad uses a fill in two dimensional featire found under
the tab marked 2D. The calculator will prompt the user to fill in specified
fields. If a 2D feature is not available, the user must rely on proper use of
grouping symbols.
The 2D window can be used for a variety of functions such as fractions N,
square root 5, radicals %, exponents O, exponentials Q, logarithms
V, and absolute value 4. Pretty print, as mentioned previously, means
that the calculator can translate a statement like (2x+2)/4 into the form
2x+2
. The calculator will interact with either form. Whenever possible, the
4
calculator will convert results to pretty print.
10
2.3
Drag and Drop
The calculator has a drag and drop feature embedded in its software. This
is helpful when the user would like to repeat a specific expression but does
not want to retype the entire expression. Use the stylus to highlight an
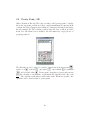
expression or part of an expression.
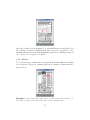
Step 1: Highlight the desired characters. Make sure to lift the stylus from
the screen for Step 2.
The characters should be highlighted and your stylus should be lifted from the
screen to stop the highlighting process. Next touch the highlighted box while
11
dragging the stylus to an empty dialog box. Once at the desired location lift
the stylus from the screen to complete the drop. Try this again using the
value 28 in the results side of the screen.
3
3.1
Performing Calculations
Algebra
While your calculator can complete these tasks, it is also important to know
how to Simplify, Expand, Factor, and Solve by hand; without the use of
technology. See instructor for course expectations.
3.1.1
Simplify
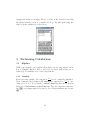
In the previous example, the expression 2x+2
is not completely simplified.
4
by canUpon command, the calculator will simplify the expression to x+1
2
celing a factor of 2. To access the command Simplify, first choose Action
followed by Transformation then Simplify. Type the expression either using )
or grouping symbols. Be sure to close your parenthesis and execute
E.
12
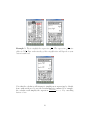
√
√
Example √
1. Try to simplify the expression 50. The expression 50 simplifies to 5 2. Your understanding of this simplification will depend on your
current math level.
Note that the calculator will attempt to simplify most expressions by default,
hence without the need to use the actual simplify command. For example,
the calculator will simplify the expression (x+1)(x+2)
to x + 1 by cancelling
x+2
factors of one.
13
3.1.2
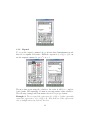
Expand
To access the expand command choose Action then Transformation and
then choose expand. If I want to FOIL the expression (x + 1)(x + 3), I can
use the expand command to get x2 + 4x + 3.
The more time spent using the calculator, the easier it will be to complete
desired tasks. Understanding of format is very important for this calculator.
The following example will demonstrate the need for proper format:
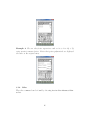
Example 2. Try to expand the expression x(x + 1)(x + 3) then separately
expand the expression x × (x + 1)(x + 3). Note that one of the expressions
uses a multiplication sign and one does not.
14
Since the calculator is programmed to work with function notation like f (x)
the calculator requires a multiplication sign between two variables to distinguish function notation from multiplying expressions. Examples such as
x(x + 1) need to be typed as x×(x+1).
3.1.3
Factor
To access the factor command choose Action then Transformation and then
choose factor. The factor command will factor constants or expressions into
prime factors.
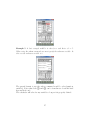
Example 3. If we factor the value 10 we get the prime factorization 2 · 5.
If a value is prime, the result is the same as the original entry.
15
Example 4. We can also factor expressions such as 2x + 2 to 2(x + 1)
using greatest common factor. Notice that prime polynomials are displayed
the same as the original entry.
3.1.4
Solve
The solve command can be found by choosing Action then Advanced then
solve.
16
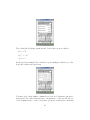
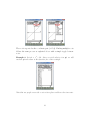
Example 5. A basic example would be to solve for x such that x + 1 = 5.
When using the solve command you must specify the unknown variable. In
this case the unknown variable is x.
The general format to use the solve command would be solve(equation,
variable). Notice that both , and = can be found in two locations: hard
keys and keyboard.
The calculator will solve for any variable so long as it is properly defined.
17
Try solving the following equations and observe the reported solution.
a) x2 = 25
b) x2 = −25
c) x2 = 3
In the previous examples the calculator reports multiple solutions, no solutions and solutions in exact form.
You may notice that similar commands are seen in both menu options for
Action and also under Interactive. An instructor could use the tab labeled Interactive to create e-activities (electronic activities) for students
18
to complete using the calculator. This topic will not be covered in the scope
of this manual but see your instructor for help with this feature.
4
4.1
Storing
Storing a solution value
You can use the store feature of the calculator to rename a letter or variable
as a specific value. This is especially helpful when a value is complex or
contains non-terminating digits.
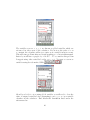
Example 6. Given the equation 0.4x = 0.2(0.6x) − 4 we solve for x to
. Upon approximating u this solution as a
find a solution as x = − 100
7
decimal we have x ≈ −14.285 . . .. If we were to check our solution by plugging
the approximate solution x ≈ −14.285 . . . into the original equation, our
solution would only check approximately. Instead we can store the exact value
and expect our solution to check exactly. To store the value − 100
x = − 100
7
7
into x we can retype our solution in the next line or you may use the button
marked D for the most recent answer. The correct format to store a value
into a variable is always value FIRST then W, chosen italic variable then
E button.
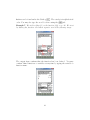
If I choose the variable x it will remain the value − 100
until otherwise
7
stored or cleared. To check our solution we wish to show that the left hand
side is equal to the right hand side.
19
The variables seen as x, y, z, t are known as global variables which are
referenced in other areas of the calculator. If you store the value of x as
a constant, the calculator will not recognize x as a variable in later screens.
This will cause problems when we discuss graphing y = x later in this manual.
Instead you will have a graph of y = 14.285 . . . To account for this problem
I suggest using other variables besides x,y,z, or t. You may access more
variables using the tab marked VAR.
.
Should you decide to store using global variables you will need to clear the
value of assigned variables before attempting to use x, y ,z or t as a variable
elsewhere in the calculator. Find Clear All Variables listed under the
edit menu bar.
20
You can check the value of a variable by typing in the variable x and
E. If cleared correctly, the variable will no longer output a constant value.
Format is important when storing a constant for a variable. Always store a
constant into a variable not the other way around. If you switch the order,
the calculator will report an error. The ability to overcome error messages
will come with practice.
4.2
Storing a function
In addition to storing constant values, you can also store entire functions.
The calculator command for storing an entire function is known as Define.
21
Define can be found under the Catalog (
. The catalog is in alphabetical
order. You may also type the word d-e-f-i-n-e using the 0
tab.
Example 7. We wish to define f(x) as the function f (x) = x2 −16. We start
by defining the function. See button sequence seen in the following image:
The output done confirms that the function has been defined. You may
confirm defined functions or variables at any time by typing the variable or
function name.
22
4.3
Evaluation of a defined function
Once a function has been defined you may call to the function for evaluation,
simplification, or complete operations on a given function. This section is
written assuming previous knowledge with solve. For a more detailed description of the solve command, refer to subsection 3.1.4. Evaluate f (−2)
for f (x) = x2 − 16.
4.4
Simplification of a defined function
Simplify f (a) for f (x) = x2 − 16 or something more interesting like expand
f (a − 1).
23
The calculator can simplify more complex expressions like the difference quo(x)
, Understanding of this topic will vary based on your current
tient f (x+h)−f
h
math level. To recreate the image below, you can use the simplify command
and the )
tab to simplify the difference quotient for f (x) = x2 − 16.
4.5
Solve using a defined function
When we solve f (x) = 0 for f (x) = x2 − 16 we get two solutions x = −4 and
x = 4.
24
5
5.1
Graphing Equations/ Functions
Swap and Resize
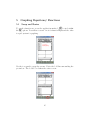
To graph a function we access the application marked g
located within
the m options. You will two screens: one is for function input and the other
is a grid system for graphing.
Use the icon panel to swap the screens. Notice the bold line surrounding the
y= window. The bolded box defines the active screen.
25
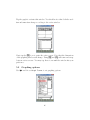
Tap the graph to activate this window. You should notice that both the tool
bar and menu bar change according to the active window.
Next, tap the r icon to resize the active screen. Note that the dimensions
of the graphing window will change. Using r and S will resize and swap
between active screens. You may tap these icons until the window fits your
preference.
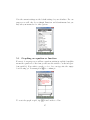
5.2
Graphing options
Use O and choose Graph Format to set graphing options.
26
Note the current settings are the default setting for your calculator. For our
purposes we will only choose Graph Function and Coordinates but you
may ask your instructor for other options.
5.3
Graphing an equation or function
For most of our purposes we will use equations written in explicit form (this
means the equation is of the form y= and uses the variable x as the independent variable). If we wish to graph y = 2x + 1 we can type into the empty
box following y1. You must press E to confirm y1.
To create the graph on grid, tap $ found on the tool bar.
27
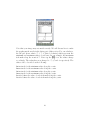
Note that your image may not match exactly. We will discuss how to make
the graphs match exactly in the latter part of this section. For our calculator,
the the grid shows values -7, 3, 7, -3 (listed clockwise) which represent the
minimum and maximum values of each axes. In our example, the maximum
tick mark along the x-axis is 7. If we tap the r icon, the values change
accordingly. The values have now changed to -7, 8,7 and -8 respectively. The
values can be described as the following:
Xmin stands for the minimum value along the x-axis.
Xmax stands for the maximum value along the x-axis.
Ymin stands for the minimum value along the y-axis.
Ymax stands for the maximum value along the y-axis.
Xscale defines the value of each tick mark along the x-axis.
Yscale defines the value of each tick mark along the y-axis.
28
A standard viewing window is commonly used in mathematics. The dimensions are [−10, 10, 1] by [−10, 10, 1]. This means Xmin and Ymin are −10,
xmax and ymax are 10 and increments of 1 are used on both axes. To choose
a standard viewing window use Zoom from the menu bar followed by Quick
Standard.
The values Xmin, Xmax, Xscale, Ymin, Ymax, and Yscale may be changed
by using 6 found in the tool bar. Note that the values have changed to
[−10, 10, 1] by [−10, 10, 1] as mentioned earlier. Other options like dot and
tmin will not changed for the scope of this manual.
The tool bar option marked ! may be used or r will create a split
screen. From the y= window you may change the style of the each graph.
Tap the line segment located to the right of the equation.
29
From the next screen you may choose between normal, thick, broken thick,
square plot, cross plot, and dot plot. For this example I have chosen Thick.
Regraph $.
Many calculators require a mode change to graph equations like x = −2.
However the Casio can complete this task with just a few steps! We wish to
change y2 into a x= format. Be sure that y= is the active window (bolded
window frame). Using the tool bar icon C you may choose h. Make sure
both equations y1 and x2 are checked. Regraph $ Notice that the line
style helps you distinguish one graph from another.
30
5.4
5.4.1
Finding intercepts and intersections
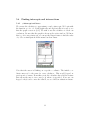
y-intercept and trace
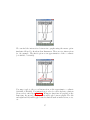
We can use the calculator to approximate x and y intercepts. We begin with
the function y = 2x + 1. Both graphically and algebraically it is easy to see
that the graph crosses at (0, 1). We wish to use the calculator to check our
conclusion. Be sure that the graph is chosen as the active window. We know
that x = 0 for any y-intercept, we can use the Trace feature to find the value
of y. Choose Analysis from the menu bar then Trace.
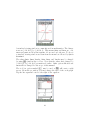
Note that the cursor is blinking on a specific coordinate. The initial coordinate may not be the same for every calculator. This would depend on
previous use of trace. From this screen, the calculator has a hidden feature
that allows the user to trace any (x, y) when x is specified. If we use our
keypad or keyboard to enter the value 0, we see a hidden evaluation feature.
31
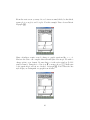
Confirm by tapping ok. The coordinate pair of the y-intercept is (0,1). The
trace feature may be used to evaluate the function for any specified value of
x. The process can repeated for x = 3, providing the coordinate pair (3, 7).
Another quick method to find the y-intercept involves using the Analysis
followed by G-Solve then y-intercept.
5.4.2
x-intercepts/ roots
For the function y = 2x + 1 we have one x-intercept, otherwise known as
a root. To find the root (reported as approximate if applicable) choose
analysis from the menu bar followed by G-Solve followed by Root.
32
The root is reported as the coordinate pair (−0.5, 0). Finding multiple roots
follows the same process as explained above with a simple toggle between
roots.
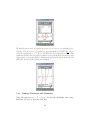
Example 8. Let y2 = x2 − 10. Since we wish only to view y2, we will
uncheck y1 and return to this function for a later example.
Note that our graph crosses the x-axis at two places and hence has two roots.
33
To find the first root, we repeat the process for root as we completed previously. Our first root is provided as approximately (−3.162277,√
0). If we
solve the equation 0 = x2 − 10 we will find the exact solutions ± 10. The
graphing window does not report solutions using pretty print but instead will
approximate a decimal solution. Additional roots may be found using the left
and right arrows located on the hard keypad.
5.4.3
Finding Maximums and Minimums
Using the function y2 = x2 − 10 we can find the minimum value using
Analysis followed by G-solve then Min.
34
You will notice that you have options labeled Max, Min, fMax, fMin.
Using Max or Min finds the global maximum or the global maximum for
the given function. Using fMax or fMin will locate the local maximums or
minimums based on the window specifications. In our example, our minimum
x value is −10 so the local maximum y-value on this interval will be f (−10) =
90. We see the coordinate pair (−10, 90). Note that (10, 90) is also on the
graph. Because the coordinate (−10, 90) comes first, assuming left to right,
the calculator reports (−10, 90) versus (10, 90). You may toggle using the
hard arrows to the other coordinate (10, 90).
35
If a global maximum or global minimum does not exist for the given function,
an error message will be displayed.
5.4.4
Finding intersection between two graphs
To find the intersection between two graphs we will start with two functions
y1 = 2x + 1 and y2 = x2 + 10 as seen in earlier examples. Be sure that
both y1 and y2 are check marked. You may distinguish between the lines by
changing the line style.
36
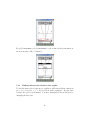
We can find the intersection between two graphs using the menu option
Analysis followed by G-solve then Intersect. There are two intersections
for our example. The first is given as an approximation of the coordinate
(−2.464101, −3.928203).
You may toggle to the second intersection as the approximate coordinate
(4.464101, 9.9282032). For instructions to solve for exact algebraic solutions
please refer to subsection Algebra. . When two functions are graphed at the
same time, the up and down hard keys will toggle between graphs. The left
and right hard keys will toggle between solutions such as intersections, roots,
etc.
37
6
Tables
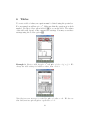
To create a table of values, an equation must be defined using the y= window.
For our example we will use y1 = x2 . Make sure that the equation y1 is check
marked. Use the toolbar option labeled # to access the table. The values
of the table will depend on the current table settings. You may access these
settings using the toolbar option 8.
Example 9. Create a table for y1 = x2 and y2 = 1/x for −3 ≤ x ≤ 3. We
change the table settings to include x values from −3 to 3.
Note that an error message is created for y2 = 1/x when x = 0. We also see
that both functions y1 and y2 are equal when x = 1.
38
7
7.1
Extensions to other math courses
Statistics
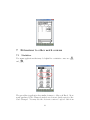
Two menu applications that may be helpful for a statistics course are I
and R
.
The spreadsheet application has similar features to Microsoft Excel. Most
newly purchased Casio Classpads include an electronic (trial version) of the
Casio Classpad. You may use the electronic version to upload data from
39
a PC or Mac. Some useful features found in I include descriptive and
inferential statistics
7.2
Trigonometry and Conic sections
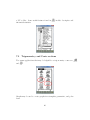
Two menu applications that may be helpful for a trigonometry course are g
and C.
Graphs may be used to create graphs in rectangular, parametric, and polar
form.
40
Also note that the keyboard includes Trig options.
7.3
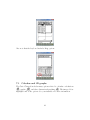
Calculus and 3D graphs
The Casio Classpad includes many options related to calculus: calculations
J, graphs g
, and three dimensional graphing D. The images below
highlight some of the options. See your instructor for more information.
41
42