1
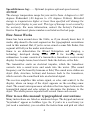
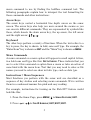
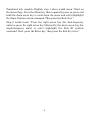
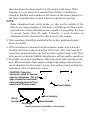
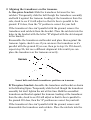
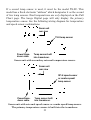
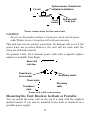
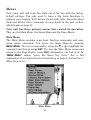
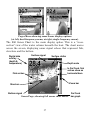
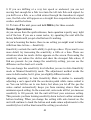
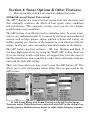
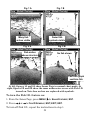
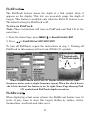
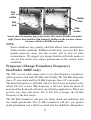
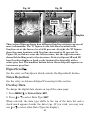
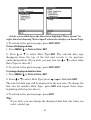
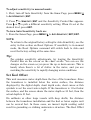
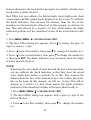
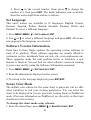
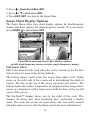
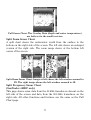
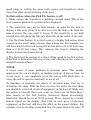
Fig. 3A Fig. 3B Muddy bottom Hard bottom Grayline This series of figures shows how different Grayline settings can reveal more information. The "A" figures to the left show locations with Grayline set at the factory level of 64 percent. At right, the "B" figures show the same locations with Grayline increased to 84 percent. In Figure 1B, no fish are near the left structure, but the right structure shows fish holding next to the structure. Notice in figures 2B and 3B how Grayline displays a hard, rocky bottom (the drop-offs) with a wider gray line. The muddier bottom below those drop-offs appears as a narrower gray line. HyperScroll See the entry on Ping Speed, which controls the HyperScroll feature. Noise Rejection See the entry on Advanced Signal Processing in this section. Overlay Data To change the digital data shown on top of the sonar page: 1. Press MENU|↓ to OVERLAY DATA|ENT. 2. Press ↓ or ↑ to select Data Type|ENT. When selected, the data type shifts to the top of the data list and a check mark appears beside the data type. (If you wish, you may now use ↓ or ↑ to select other Data Types for display.) 60