1
OPERATING INSTRUCTIONS
TYPE 874-LBA/-LBB
SLOTTED LINES
GENERAL
RADIO
COMPANY
GENERAL RADIO COMPANY
WEST
CONCORD,
MASSACHUSETTS
617 369-4400
5 ALE 5
NEW
01781
617
OFFICES
ENGINEERING
ENGLAND*
22 Baker Avenue
West Concord, Massachusetts 01781
Telephone 617 646-0550
METROPOLITAN
NEW YORK*
Broad Avenue at Linden
Ridgefield, New Jersey 07657
Telephone N.Y. 212 964-2722
N.J. 201 943-3140
SYRACUSE
Pickard Building
East Molloy Road
Syracuse, New York 7327 7
Telephone 3 75 454-9323
PHILADELPHIA
Fort Washington Industrial Park
Fort Washington, Pennsylvania 79034
Telephone 215 646-B030
WASHINGTON*
and BALTIMORE
7 7420 Rockville Pike
Rockville, Maryland 20B52
Telephone 301 946-1600
ORLANDO
7 13 East Colonial Drive
Orlando, Florida 32B01
Telephone 305 425-4671
• Repair services are available at these offices.
646-7400
CHICAGO*
6605 West North Avenue
Oak Park, Illinois 60302
Telephone 312 B4B-9400
CLEVELAND
5579 Pearl Road
Cleveland, Ohio 44 729
Telephone 216 BB6-01 50
LOS
ANGELES*
1 000 North Seward Street
Los Angeles, California 9003B
Telephone 213 469-6201
SAN
FRANCISCO
626 San Antonio Road
Mountain View, California 94040
Telephone 415 94B-B233
DALLAS*
2600 Stemmons Freeway, Suite 210
Dallas, Texas 7 5207
Telephone 214 637-2240
TORONTO*
99 Floral Parkway
Toronto 75, Ontario, Canada
Telephone 416 247-2177
MONTREAL
1255 Laird Boulevard
Town of Mount Royal, Quebec, Canada
Telephone 514 737-3673
General Radio Company (Overseas), BOOB Zurich, Switzerland
General Radio Company (U.K.) Limited, Bourne End, Buckinghamshire, England
Representatives in Principal Overseas Countries
Printed in USA
INSTRUCTION
MANUAL
TYPE 874-LBA/-LBB
SLOTTED LINES
Form 0874-0215-1
April, 1966
Copyright 1962 by General Radio Company
West Concord, Massachusetts, USA
GENERAL
WEST
R A D I 0
CONCORD,
COMPANY
MASSACHUSETTS,
USA
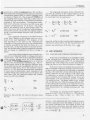
TABLE
OF
CONTENTS
Section 1. GENERAL DESCRIPTION.
1
Section 2.
2.1
2.2
2.3
THEORY •
Characteristic Impedance and Velocity of Propagation.
Traveling and Standing Waves.
Line Impedance
1
1
2
3
Section 3.
3.1
3.2
3.3
DESCRIPTION.
Slotted Line Design
Generator
Detector.
10
10
12
13
Section 4.
4.1
4.2
4.3
4.4
4.5
4.6
4.7
4.8
OPERATION
Connections and Adjustments .
Detector Tuning .
Probe Penetration Adjustment.
Measurement of Wavelength .
Measurement of Low VSWR (Below 10:1)
Measurement of High VSWR •
Measurement of 50-0hm Coaxial Line Circuits .
Measurements on Components and Lumped Circuits
14
14
15
16
17
17
18
22
26
Section 5. MISCELLANEOUS .
5.1 Operation at Frequencies Below 300 Me
5.2 Calibration of the Variation in Probe Coupling
29
29
29
Section 6.
6.1
6.2
6.3
6.4
6.5
6.6
6. 7
30
30
30
30
30
31
31
31
SERVICE AND MAINTENANCE .
General .
Replacement of Crystal Rectifier
Cleaning and Lubrication .
Removal of Center Conductor.
Centering of Probe in Slot •
Adjustment of Nylon Cord Tension
Replacement of Nylon Cord
NOTE: All instructions for the Type 874-LBA apply equally to the Type
874-LBB except that the maximum operating frequency of the Type 874-LBB
extends to 8.5 Gc.
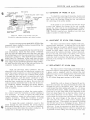
Figure 1. The Type 874-LBA Slotted Line and the Type 874-W50, 50-ohm Termination Unit
are shown connected for the measurement of the VSWR of Type 874-QN Adaptors. These
adaptors are used to connect components fitted with type N Connectors to devices fitted
with Type 874 Connectors.
SPECIFICATIONS
Characteristic Impedance: 50 ohms, ±0.5%.
Probe Travel:
sion is 1 mm.
Scale Accuracy:
50 em.
Scale calibrated in em; each divi-
±(0.1 mm +0.05%).
Residual VSWR: Less than Frequency Type 874-LBA Type 874-LBB
(Gc)
1.025
1.04
1.055
1.07
1.1
Price
Accessories Required. Adjustable stub (Type 874-D20L)
for tuning the crystal rectifier when audio'-frequency detec·
tor or microammeter is used; suitable detector and genera·
tor; Type 874~R22A Patch Cord, for ·detector connection.
Other Accessories Available: Type 874-LV Micrometer
Vernier carriage drive. See List of GR874 Components at
the rear of this manual.
1.0116
1.0164
1.0244
1.0356
1.0500
1.0675
1.1000
1.1000
Dimensions:
mm), over-all.
26
by 4~ by 3~ inches (660 by 115 by 90
Net Weight: 8~ pounds (3.9 kg).
U.S. Patent No. 2,548,457
Several copies of Smith Charts are supplied with the
Slotted Line. Additional copies can be obtained from
General Radio at the following prices.
No. of units
- 300 Me to 5 Gc.
At 300 Me the slotted
Operation below 300
accuracy.
Accessories Supplied: Storage box and spare drive cable.
Constancy of Probe ~enetration: Type 874-LBA- ±1.5%.
Type 874-LBB - ±1.25%:
1.0
2.0
3.0
4.0
5.0
6.0
7.5
8.5
Frequency Range:
Type 874-LBA
Type 874-LBB - 300 Me to 8.5 Gc.
lines cover one half wavelength.
Me is possible with slightly reduced
and over
$1.25
Catalog
Number
5301-7568
5301-7569
5301-7560
5301-7561
5301-7562
Description
Type
Type
Type
Type
Type
Y Smith Chart
Z Smith Chart
N Smith Chart
NE Smith Chart
HE Smith Chart
(20-mmho admittance coordinates)
(50-ohm impedance coordinates)
(normalized coordinates)
(normalized expanded coordinates)
(normalized highly expanded coordinates)
GENERAL DESCRIPTION- THEORY
SECTION
1
GENERAL
DESCRIPTION
One of the important basic measuring instruments used at ultra-high frequencies is the slotted
line. With it, the standing-wave pattern of the electric
field in a coaxial transmission line of known characteristic impedance can be accurately determined.
From aknowledge of the standing-wave pattern several characteristics of the circuit connected to the
load end of the slotted line can be obtained. For instance, the degree of mismatch between the load and
the transmission line can be calculated from the ratio
of the amplitude of the maximum of the. wave to the
amplitude of the minimum of the wave. This is called
the voltage standing-wave ratio, VSWR. The load impedance can be calculated from the standing-wave
ratio and the position of a minimum point on the line
with respect to the load. The wavelength of the exciting wave can be measured by obtaining the distance
between minima, preferably with a lossless load to
obtain the greatest resolution, as successive minima
SECTION
or maxima are spaced by half wavelengths. The
properties outlined above make the slotted line valuable for many different types of measurements on
antennas, components, coaxial elements, and networks.
The Type 874- LBA Slotted Line is designed to
measure the standing-wave pattern on a 50- ohm·
coaxial transmission line, over a frequency range
from about 300 to 5000 Me. A small probe mounted
on a sliding carriage extends through a slot into the
region between the inner and outer conductors of a
coaxial line and samples the electric field in the line.
The probe is connected to a detector, and the variation in electric field intensity, and hence the voltage
along the line, can be determined from the variation
in detector output, as the carriage is moved along the
line.
2
THEORY
2.1 CHARACTERISTIC IMPEDANCE AND VELOCITY
OF PROPAGATION.
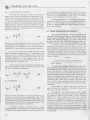
A transmission line has uniformly distributed
inductance and capacitance, as shown in Figure l. The
.6.L
series resistance due to conductor losses and the
shunt resistance due to dielectric losses are also
uniformly distributed, but they will be neglected for
the present. The square root of the ratio of the inductance per unit length, L, to the capacitance per
-----lT
o---4---I___._I-----+--1---------+--------+-1 ___ -·-T
Io
Figure 1. Circuit showing the distribution
of inductance and capacitance
along a transmission line.
~
TYPE 874-LBA SLOTTED LINE
~~~~~~~-----------------unit length, C, is defined as the characteristic impedance, Z 0 , of the line.
(1)
This is an approximation which is valid when line
losses are low. It gives satisfactory results for most
practical applications at high frequencies.
In the next paragraph, transmission-line behavior will be discussed in terms of electromagnetic
waves traveling along the line. The waves travel with
a velocity, v , which depends on L and C in the following manner:
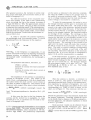
2.2 TRAVELING AND STANDING WAVES.
The performance of a transmission line having
a uniform characteristic impedance can be explained
in terms of the behavior of the electromagnetic wave
that travels along the line from the generator to the
load, where all or a portion of it may be reflected
with or without a change in phase, as shown in Figure
2a. The reflected wave travels in the opposite direction along the line, back toward the generator. The
phases of these waves are retarded linearly 360° for
each wavelength traveled.
The wave traveling from the generator is called
the incident wave, and the wave traveling toward the
GEN.
1
$
(2)
=--..jLC
0
If the dielectric used in the line is air, (permeability
unity), the product of L and C for any uniform line
is always the same. The velocity is equal to the velocity of light, c, (3 X 10¹⁰ em/sec). If the effective
dielectric constant, K, is greater than unity, the velocity of propagation will be the velocity of light
divided by the square root of the effective dielectric
constant.
=
LOAD
TRANSMISSION LINE
A
A
8
4
3A
8
1.
3A
9
4
2
w
0
:::>
1-
(a)
TRAVELING
WAVES
::J
o..
~
0
~-360°
<X
it_72o··l_.U_..JH--t-t\T1
c
(3)
The relationship between frequency, f, and
wavelength, ,;:\. , in the transmission line is
w
0
:::>
:\f
f
= zr
=
1-
(4a)
Jr
::::J
~
STANDING
WAVE
<X
w
(4b)
A.
(b)
(j)
<X
0..
:A
=
·180"
I
L
(4c}
·360"
0
f
A
A
3A
A
5A
3A
7A
8482848
i = INCIDENT WAVE.
= REFLECTED WAVE.
s= SUM OF INCIDENT AND
REFLECTED WAVES.
r
If the dielectric is air (permeability is unity),
Af
=
3
X
10 10
em /sec
(4d)
if:>. is in centimeters and f is in cycles per second.
2
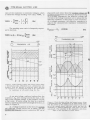
Figure 2. (a) Chart showing the variations in the amplitude and phase of incident and reflected waves along a
transmission line. (b) The vector combination. ~f the in·
cident and reflected waves at various points along the
line is illustrated and the resultant standing wave produced by the r;ombination of the two waves is plotted.
THEORY
generator is called the reflected wave. The combination of these two traveling waves produces a stationary
interference pattern which is called a standing wave,
as shown in Figure 2b. The maximum amplitude of
the standing wave occurs when the incident and reflected waves are in phase or when they are an integral
multiple of 360° out of phase. The minimum amplitude occurs when the two waves are 180', or an odd
integral multiple thereof, out of phase. The amplitude of the standing wave at other points along the
line is the vector sum of incident and reflected waves.
Successive minima and maxima are spaced, respectively, a half-wavelength along the line, as shown in
the figure.
The magnitude and phase of the reflected wave
at the load, relative to the incident wave, are functions of the load impedance. For instance, if the
load impedance is the same as the characteristic
impedance of the transmission line, the incident wave
is totally absorbed in the load and there is no reflected wave. On the other hand, if the load is lossless, the incident wave is always completely reflected,
with no change in amplitude but with a change in
phase.
A traveling electromagnetic wave actually consists of two component waves: a voltage wave and a
current wave. The ratio of the magnitude and phase
of the incident voltage wave, Ei, to the magnitude
and phase of the incident current wave, Ii, is always
equal to the characteristic impedance, Z 0 • The reflected waves travel in the opposite direction from
the incident waves, and consequently the ratio of the
reflected voltage wave, Er, to the reflected current
wave, Ir, is -Z 0 • Since the characteristic impedance
in most cases is practically a pure resistance,! the
incident voltage and current waves are in phase with
each other, and the reflected voltage and current
waves are 180' out of phase.
E·1
Ii
Er
Ir
=
(5a)
Zo
(5b)
= -z 0
Equations (Sa) and (Sb) are valid at all points along
the line.
1
=
R + jwL
G + jwC
R
=
L 1
-i wL
-X----
C 1-j_Q_
we
The magnitude and phase of the reflected voltage wave, Er, relative to the incident wave, Ei, at the
load is called the reflection coefficient,
'which can
be calculated from the expression
r
r
=
Er =
Ir
Zx
Zo
Zx + Zo
E·l
1
= -Ii
r
=
Yo- Yx
(6)
Yo+ Yx
at the load
(7a)
at the load
(7b)
where Zx andYx are the complex load impedance and
admittance, and Z 0 and Yo are the characteristic impedance and admittance of the line. (Y 0 = z~).
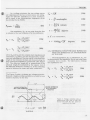
2.3 LINE IMPEDANCE.
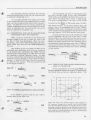
2.3.1 VOLTAGE AND CURRENT DISTRIBUTION.
If the line is terminated in an impedance equal
to the characteristic impedance of the line, there
will be no reflected wave, and = 0, as indicated by
Equation (6). The voltage and current distributions
along the line for this case are shown in Figure 3.
r
If the line is open-circuited at the load, the voltage wave will be completely reflected and will undergo
no phase shift on reflection, as indicated by Equation
( 6), (Zx = c0), while the current wave will also be completely reflected but will undergo a 180' phase shift
on reflection, as shown in Figure 4. If the line is
short-circuited, the current and voltage roles are
interchanged, and the impedance pattern is shifted
?-./4 along the line. The phase shifts of the voltage
and current waves on reflection always differ by 180°,
as the reflected wave travels in the opposite direction
from the incident wave. A current maximum, therefore, always occurs at a voltage minimum, and vice
versa.
The volta~e at a maximum of the standing-wave
pattern is I Ei 1 + IErl or lEi (l +
and at a
minimum is I Eil - I Erl or IEi I (l - I I). The
I
1r1)
r
where L is the inductance per unit length in henrys,
C is the capacitance per unit length in farads, R is
the series resistance per unit length in ohms, and
G is the shunt conductance per unit length in mhos.
The approximation is valid when the line losses are
low, or when~
=f.
3
~--TY_P_E_8_7_4-_LB_A__S_L_O_T_T_E_D__
L_IN_E________________________________________
ratio of the maximum to minimum voltages, which
is called the voltage standing-wave ratio, VSWR, is
VSWR
=
Emax
=
E min
1 +
1
lr I
lr I
(Sa)
The standing-wave ratio is frequently expressed in decibels.
VSWR in db = 20 log 10
0
E
max
Emin
phase with each other. Since the incident voltage and
incident current waves are always in phase (assuming
Z 0 is a pure resistance), the effective voltage and
current at the voltage maximum are in phase and the
effective impedance at that point is pure resistance.
At a voltage maximum, the effective impedance is
equal to the characteristic impedance multiplied by
the VSWR.
Rpmax
Zo
(VSWR)
(9a)
(8b)
GEN.
¢
GEN.
TRANSMISSION
=
TRANSMiSSION LINE
Ei
LINE
~AD
Er
-1ao•
-360°
UJ
0
UJ=>
>1;!a..
<t:J
(!)::2:
z<t
0
z
-360"
~~
(/)<{
I
a.. -720°
l...
8
..1..
4
ll
8
)._
2
~
8
;n.n.
4
8
lo
Figure 3. Chart showing voltage and current waves along
a transmission line terminated in its characteristic impedance. Note the absence of reflected waves and that
the impedance is constant and equal to the characteristic impedance at all points along the line.
+9~~--+---+---+---+---~--~_,
UJ
_l
OH---;---~--;---~--~---r--~
(!)
At any point along a uniform lossless line, the
impedance, Zp. seen looking towards the load, is the
ratio of the complex voltage to the complex current
at that point. It varies along the line in a cyclical
manner, repeating each half-wavelength ofthe line, as
shown in Figure 4.
At a voltage maximum on the line, the incident
and reflected voltage waves are in phase, and the
incident and reflected current waves are 180" out of
4
~ -9o·u---~--~---L--~--~~--~~
n..
8
3i\
4
~
~
8
2
3A. ~ _L
8
4
8
0
Figure 4. Chart showing voltage and current waves along
a transmission line terminated in an open-circuit. Note
that the minima of the voltage waves occur at the maxima of the current waves, and vice versa, and that the
separation of adjacent minima for each wave is a half·
wavelength. The variation in the magnitude and phase
angle of the impedance is also shown.
THEORY
le
At a voltage minimum, the two voltage waves
are opposing and the two current waves are aiding.
Again the effective impedance is a pure resistance
and is equal to the characteristic impedance of the
line divided by the VSWR.
Zo
e=
e = 3~oiJK
The impedance, Zp, at any point along the line
is related to the load impedance by the expression
uL
Zx + jZ 0 tane
Zp = Zo
(llb)
rad"1ans
(llc)
(ltd)
degrees
is in centimeters,
(lOa)
Z 0 + j Zxtane
Yp = yo
{e wavelengths
e = T21T1[K
K
(9b)
VSWR
(lla)
=1JK
e=
Yx + jY 0 tane
0.012fMc.fJK
(lle)
degrees
(lOb)
Y0 + jYx tane
2.3.2 DETERMINATION OF THE LOAD IMPEDANCE
FROM THE IMPEDANCE AT ANOTHER POINT
ON THE LINE.
where Zx and Yx are the complex load impedance and
admittance, Z 0 and Yo are the characteristic impedance and admittance of the line, and e is the electrical
length of line between the load and the point along the
line at which the impedance is measured. (See Figure
5.)2 The effective length,.,fe, is proportional to the
physical length,-( multiplied by the square root of
the effective dielectric constant, K, of the insulating
material between the inner and outer conductors.
The load impedance, Zx, or admittance, Yx, can
be determined if the impedance, Zp, at any point along
a lossless line is known. The expressions relating
the impedances are:
zp - j Z 0 tane
Z0
2 In Figure S,point pis shown at a voltage minimum.
However, Equations (lOa) and (lOb) are valid for any
location of point p on the line.
YP - jY 0 tane
Y0
(12a)
j Zp tane
-
-
jYPtane
(12b)
t
~---e,f-----<
VOLTAGE DISTRIBJTION
WITH LOAD CONNECT~
e;l-+'- -
VOLTAGE DISl"FBJTION
WITH LOAD SHORTCIRCUITED
---
GEN .
Figure 5. Voltage variation along a
transmission line with a load connected and with the line short-circuited at the load.
I
e =e-n •
1ao•
Em ax
VSWR= Emin
Ton e'=Tone
5
~--T_Y_P_E_8_74_-L_B_A__
S_L_O_T_T_E_D_L_I_N_E_______________________________________
If the line loss cannot be neglected, the equations
are:
Zx
Yx
=
Zo
=
Zp
Z 0 tanh?Y.i
Zo
Zp tanhcr.i
yp
Y tanh.:rl
Yo
YP tanhcrl
Yo
(13a)
minimum located with the load connected, e will be
negative. The points corresponding to half-wavelength
distances from the load can be determined by shortcircuiting the line at the load and noting the positions
of the voltage minima on the line. The minima will
occur at multiples of a half-wavelength from the load.
If the VSWR is greater than 10 tan e, the following approximation of Equation (14b) gives good
results:
0
(13b)
(15a)
VSWRcos 2 e
when
2f
= ((
a:
+ jJ.1, and
=attenuation constant in nepers/cm
(15b)
= att. in db /100 ft
g
26940
=phase constant in radians/em
2.3.4 SMITH CHART.
=2-rrf /LC =2-rr_fK
2.3.3 DETERMINATION OF THE LOAD IlV1PEDANCE
FROM THE STANDING-WAVE PATTERN.
The load impedance can be calculated from a
knowledge of the VSWR present on the line and the
position of a voltage minimum with respect to the load,
since the impedance at a voltage minimum is related
to the VSWR as indicated by Equation (9b). The equation can be combined with Equation (12a) to obtain
an expression for the load impedance in terms of the
VSWR and the electrical distance, e, between the
voltage minimum and the load.
1 - j(VSWR) tan e
(14a)
VSWR - jtane
2(VSWR) - j ~VSWR):l ·- ~ sin28
[(VSWR)2. + 1] + liVSWR)
2
-
~ cos2e
(14b)
Since in a lossless line the impedance is the
same at half-wavelength intervals along the line, e
can be the electrical distance between a voltage minimum and any multiple of a half-wavelength from the
load (see Figure 5). Of course, if the half-wavelength
point used is on the generator side of the voltage
6
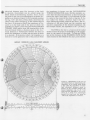
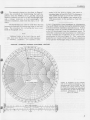
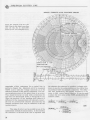
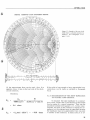
The calculation of the impedance transformation produced by a length of transmission line using
the equations previously presented can be time consuming. Mr. P. H. Smith3 has devised a chart, shown
in Figure 6, which simplifies these calculations. In
this chart the circles whose centers lie on the resistance component axis correspond to constant values
of resistance. The arcs of circles whose centers lie
on an axis perpendicular to the resistance axis correspond to constant values of reactance. The chart
covers all values of impedance from zero to infinity.
The position of a point corresponding to any given
complex impedance can be found from the intersection of the resistance and reactance coordinates corresponding to the resistive and reactive components
of the unknown impedance.
As the distance from the load is increased or
decreased, the impedance seen looking along the line
toward a fixed unknown will travel around a circle
with its center at the center of the chart. The angular
movement around the circle is proportional to the
electrical displacement along the line. One complete
traverse of the circle will be made for each halfwavelength of travel. The radius of the circle is a
function of the VSWR.
2.3.4.1 Calculation of Impedance at One Point from
the Impedance at Another Point on a Line. If the impedance at one point on a line, say at a point p is
known, and the impedance at another point a known
3 Smith,P.H.,Electronics,Vol.l7,No. l,pp.l30-133,
318-325, January 1944.
THEORY
electrical distance away (for instance, at the load)
is desired, the problem can be solved using the
Smith Chart in the following manner: First, locate
the point on the chart corresponding to the known impedance, as shown in Figure 6. (For example, assume
that Zp = 20 + j25 ohms.) Then, draw a line from the
center of the chart through Zo to the outside edge of
the chart. If the point at which the impedance is desired is on the load side of the point at which the
impedance is known, travel along the WAVELENGTHS
TOWARD LOAD scale, from the intersection of the
line previously drawn, a distance equal to the electrical distance in wavelengths between the point at
which the impedance is known and the point at which
it is desired. If the point at which the impedance is
desired is on the generator side of the point at which
IMPEDANCE
the impedance is known, use the WAVELENGTHS
TOWARD GENERATOR scale. (In this example, assume that the electrical distance is 0.11 wavelength
toward the load.) Next, draw a circle through Zp with
its center at the center of the chart, or lay out, on the
last radial line drawn, a distance equal to the distance between Zp and the center of the chart. The coordinates of the point found are the resistive and
reactive components of the desired impedance. (In
the example chosen, the impedance is 16 - j8 ohms.)
The VSWR on the line is a function of the radial
distance from the point corresponding to the impedance, to the center of the chart. To find the VSWR,
lay out the distance on the STANDING WAVE RATIO
scale located at the bottom of the chart, and read the
COORDINATES- 50·0HM CHARACTERISTK IMPEDANCE
Figure 6. Illustration of the use of
the 'Smith Chart for determining the
impedance at a certain point along
a line when the impedance a specified electrical distance away is
known. In the example plotted, the
known impedance, Zp. is 20 + i25
ohms and the impedance, Zx, is desired at a point 0.11 wavelength
toward the load from the point at
whicb the impedance is known.
7
~
TYPE 874-LBA SLOTTED LINE
~-------------------------VSWR as a ratio,
~~~· or in db on the appropriate
scale. (In the example of Figure 6, the VSWR is 3.2
or 10.1 db.)
2.3.4.2 Calculation of Impedance at the Load from
theVSWRand Position of a Voltage Minimum. In impedance measurements in which the voltage standingwave pattern is measured, the impedance at a voltage minimum is a pure resistance having a rnagni-
z
tude of~. Plot this point on the resistance cornponent axis and draw a circle having its center at
the center of the chart drawn through the point. The
impedance at any point along the transmission line
must lie on this circle. To determine the load irnpedance, travel around the circle from the original
point an angular distance on the WAVELENGTHS
TOWARD LOAD scale equal to the electrical distance,
expressed as a fraction of a wavelength, between the
voltage minimum and the load (or a point a half-wavelength away from the load, as explained in Paragraph
2.3.3.) If the half-wave point chosen lies on the generator side of the minimum found with the load
connected, travel around the chart in the opposite direction, using the WAVELENGTHS TOWARD GENERATOR scale. The radius of the circle can be determined directly from the VSWR, expressed as a
ratio, or, if desired, in decibels by use of the scales
labeled STANDING WAVE RATIO, located at the bottorn of the chart.
IMPEDANCE
Figure 7. Example of the calcula·
tion of the unknown impedance from
measurements of the VSWR and
position of a voltage minimum, us·
ing a Smith Chart. The measured
VSWR is 5 and the voltage minimum
w ith the unknown connected is 0.14
wavelength from the effective posi·
tion of the unknown. A method of
determining the admittance of the
unknown is also illustrated.
8
COORDINATES- 50-0HM CHARACTERISTlC IMPEDANCE
THEORY
The example plotted on the chart in Figure 7
shows the procedure for determining the load impedance when the VSWR is 5 to 1, and the electrical
distance between the load or a half-wavelength point
and a voltage minimum is 0.14 wavelength. The
unknown impedance, read from the chart, is 23 - j55
ohms.
The Smith Chart can also be used when the line
between the load and the measuring point is not lossless. The procedure for correcting for loss is outlined in Paragraph 4.6.3.
NOTE
Additional copies of the Smith Cbart are available, drawn for a 50-ohm system in either impedance
or admittance coordinates. The Impedance Chart •.
ADMmANCE
similar to tbe one shown in Figure 6 but printed on
transparent paper, is Form 5301-7569Z. The Admittance
Chart, similiar to Figure 8, is Form 5301-7568Y.Anormalized char' with an expanded center portion for low
VSWR measurements, is also available on Form 53017561NE.
2.3.4.3 Conversion from Impedance to Admittance.
The Smith Chart can also be used to obtain the transformation between impedance and admittance. Follow
around the circle of constant VSWR adistanceof exactly 0.25 wavelength from the impedance point. To
obtain the conductance and susceptance in millimhos,
simply multiply the coordinates of the newly dete'r mined point by 0.4 (see Figure 7). This conversion
property is a result of the inversion of impedance
every quarter-wavelength along a uniform transmis-
COORDtoiATES-20-MWMHO CHARACTERISTIC ADMmANCE
Figure 8. Example of the calculation of the unknown admittance from
measurements of the VSWR and the
position of a voltage minimum, using
the Smith Chart drawn for admittance
measurements on lines having characteristic admittances of 20 millimhos (50 ohms).
9
~--T_YP_E__
87_4-_L_BA__S_L_O_T_T_E_D__
L_IN_E______________________________________
sion line. The impedances at points 1 and 2, a quarterwavelength apart, are related by the equation
Zo2
zl
=
(16a)
z2
The example plotted on the chart is the same
as that used for the impedance example of Figure 7.
or
zl
=
2.
Zo Y2
(16h)
2.3.4.4 Admittance Measurements Using the Smith
Chart. The admittance of the unknown can be obtained directly from a normalized Smith Chart, or
from the chart shown in Figure 8, whose coordinates
are admittance components, rather than by the procedure outlined in Paragraph 2. 3.4.3. When the chart
shown in Figure 8 is used, the characteristic admittance, 20 millimhos, is multiplied by the measured
VSWR to find the conductance at the voltage minimum.
The radius of the corresponding admittance circle on
the chart can be found by plotting the measured conductance directly on the conductance axis. The radius
can also be found from the STANDING WAVE RATIO
scale located at the bottom of the chart. The electrical
distance to the load is found and laid off on the WAVE-
SECTION
LENGTHS TOWARD LOAD scale, starting at 0.25
wavelength. On the VSWR circle, the coordinates of the
point corresponding to the angle found on the WAVELENGTHS scale are the values of conductance and
susceptance of the unknown.
2.3.4.5 Use of Other Forms of the Smith Chart. In
some forms of the Smith Chart, all components are
normalized with respect to the characteristic impedance to make the chart more adaptable to all
values of characteristic impedance lines. If normalized charts are used, the resistance component value
used for the voltage-minimum resistance is VSlWR'
and the unknown impedance coordinates obtained
must be multiplied by the characteristic impedance
of the line to obtain the unknown impedance in ohms.
If the admittance is desired, the coordinates that
correspond to the admittance should be multiplied by
the characteristic admittance.
The normalized Smith Chart is produced in a
slide rule form by the Emeloid Corporation, Hillside,
New Jersey.
3
DESCRIPTION
3.1 SLOTTED LINE DESIGN.
The Type 874-LBA Slotted Line is designed to
measure the voltage standing-wave pattern produced
by any load connected to it. Its characteristic impedance is 50 ohms. The outer conductor is slotted
for a length of approximately 50 centimeters, and a
small shielded probe extends into the region between
the two conductors. The probe is mounted on a carriage, which slides along the outside of the outer
conductor. The penetration of the probe into the line
and, hence, the capacitive coupling between the probe
and the line, can be adjusted over a wide range by
means of a screw adjustment. Cross-sectional views
of the probe arrangement are shown in Figure 9a.
10
Since the probe is capacitively coupled tothe
line, the voltage induced in the probe circuit is proportional to the voltage existing between the inner
and outer conductors of the line at the probe position.
The carriage is driven by means of a nylon
cord which passes around a drum mounted on the
casting at one end of the line and around an idler pulley which is mounted on the casting at the other end
of the line. The driving knob is attached to the same
shaft as the drum. The drive depends upon friction.
One and a half turns of the cord around the drum is
sufficient to give a positive drive. A ratchet-type
take-up reel is located on the back of the carriage to
I
(1.
I
DESCRIPTION
INNER CONDUCTOR
PROBE ADJUSTING SCREW
FELT WASHER (0814-o072~)
Figure 9a. Cross-sectional views of the
carriage on the Type 874-LDA Slotted Line,
showing the crystal mount and the adjustable probe.
RING NUT (0.874-6126) .
SLOT IN
COAXIAL LINE
PROBE
FLAT SPRING
PROBE CARRIAGE
CARRIAGE
Figure 9b. Rear view of the drive mechanism,
showing the arrangement of the nylon cord.
CARRIAGE
Figure 9c. Installation of the nylon cord, viewed
from the top of carriage.
BALL
BEARING
CORD
SLACK TAKE-UP REEL
1·1/2 TURNS AROUND DRUM
permit adjustment of the cord tension. Figures 9b and
9c show the cord, drum, and take-up device.
The rf voltage induced in the probe can be mea-
sured by means of a built- in tuned crystal detector
and associated indicating equipment, as shown in Figures lO and 11, or by means of an external receiver,
as shown in Figure 12.
11
~ TYPE 874-LBA SLOTTED LINE
~----------------------~-
874-D20.L
TUNING
STUB
TYPE 1360-A
MICROWAVE OSCILLATOR
Figure 10. Use of a modulated source for
measurements with the Type 874-LBA Slotted
Line. The built-in crystal detector and a
standing-wave indicator are used to detect
the voltage induced in the probe. The probe
is tuned by means of the adjustable stub
shown.
STANDING WAVE
INDICATOR
874-L8A SLOTTED
874-G
ATTENUATOR
NE
74-D20L TUNING STUB
UNIT
OSCILLATOR
25- OR 50-~a
METER
Figure 11. Use of an unmodulated source for
measurements with the Type 874-LBA Slotted
Line. The indicator is a microammeter.
UNKNOWN
Figure 12. Use of an unmodulated
source and a superheterodyne detector or receiver for measurements with
Jhe Type 874-LBA Slotted Line.
UNIT
OSCILLATOR
TO
POWER SUPPLY
874-~_)f
TO
POWER
SUPPLY
LOW-PASS
FILTER
I
~
874-G
ATTENUATOR
One end of the slotted line is terminated in the
circuit under test, usually called the unknown, and the
other in the power source. Each end is fitted with a
locking Type 87 4 Connector which introduces only
very small reflections in the line, at frequencies up
to about 5 Gc and keeps leakage better than 120 db
down.
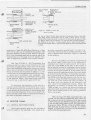
3.2 GENERATOR.
The generator requirements are dependent on
the type of detector used and on the standing-wave
ratio of the load to be measured. Table 3-1 is a chart
showing several possible generators with their respective frequency ranges. The Type 1264- A Modulating Power Supply is an ideal source of 1-kc square-
12
UNKNOWN
874-LBA
SLOTTED LINE
TABLE 3-1. GENERATORS
Type
Name
Frequency Range
1215-B
Unit Oscillator
50-250 Me
1209-B
Unit Oscillator
250-960 Me
1209-BL
Unit Oscillator
180-600 Me
1208-B
Unit Oscillator
65-500 Me
1361-A
UHF Oscillator
500-1000 Me
1218-A
Unit Oscillator
900-2000 Me
1360-A
Microwave Oscillator 1. 7-4.0 Gc.
DESCRIPTION
wave modulation, as well as a regulated power supply, for the unit oscillators in slotted -line use.
3.3
DETECTOR
As mentioned previously, either the built-in
crystal detector4 or an external receiver can be· used
as a detector.
3.3.1 CRYSTALRECTIFIERAND STANDING-WAVE
METER.
The most commonly used and the most generally satisfactory detector is the built-in crystal rectifier' with one of the several commercially available
VSWR indicators. The oscillator driving the line
should be modulated, preferably by square waves.
The Type 1232- A Tuned Amplifier and Null Detector
is a satisfactory standing-wave indicator when the
VSWR of the unknown is less than 1.8.
At very low levels, the crystal operates in the
square-law region; that is, the rectified output is
proportional to the square of the rf input. At high
levels the crystal approaches a linear characteristic.
In most cases, the crystal is operated in the squarelaw range. To check for square-law operation, measure the same unknown at different detector- signal
levels, making sure that the same answer is obtained at two or more signal levels.
3.3.2 OTHER DETECTORS.
3.3.2.1 Crystal Rectifier and Microammeter. An
even simpler detector sy(>tem_ consists of the builtin crystal rectifier used with an external microammeter, as shown in Figure 11. In this case, the rectified de output of the crystal is measured on a sensitive microammeter connected between the inner
and outer terminals of the right-hand connector on
the probe carriage. In most cases, the rectified de
4 If desired, Type 618- A Bolometer elements, manufactured by Polytechnic Research and Development
Co., can be inserted in place of the crystal.
output is closely proportional to the square of the
rf input at currents up to roughly 50 microamperes.
The limit of the square-law region is greatly affected
by the resistance of the microammeter, since the rf
crystal impedance varies with the de bias voltage
developed across the meter. Therefore, for the most
accurate results, the detector characteristic should
be checked at the operating frequency, using an rf
attenuator. The sensitivity of this system is poor,
and difficulties are usually.encountered in measuring
even a moderately high VSWR unless the oscillator
output is large, as the probe coupling required may
be excessive (refer to Paragraph 4.3). The simplicity
of the system makesitattractive in manycaseswhen
a low VSWR is to be measured.
The detector can be used beyond its squarelaw range if it is calibrated in terms of an rf attenuator used to control accurately the relative input to
the line, or by the actual adjustment of the rf input at
the voltage maximum and at the voltage minimum to
produce the same meter indication. In the second
method, the VSWR can be read from the rf attenuator,
and all dependence on the detector response is then
eliminated. For measurements on lines carrying high
power, a 25k-ohmpotentiometercanbeusedas shown
in Figure 11. In those cases, operation is usually beyond the square-law region and is often at a high
enough level to be in the linear range.
3.3. 2. 2 Heterodyne Detector. The Type DNT Detector (See Figure 12), which consists of the Type
874-MRL Mixer Rectifier, the Type 1216-A Unit I-F
Amplifier, and a Unit Oscillator for heterodyning the
signal, is also a satisfactory detector for the slot:..
ted line, particularly for the measurement of high
VSWR' s, because of its good sensitivity and harmonic rejection. The shielding Qf this detector is excellent, a property which is useful in the measurement
of radiating systems. Harmonics of the local oscillator frequency can be used to beat with the signal from
the slotted line. Hence, the upper frequency limit
may be several times the upper frequency limit of
the oscillator.
NOTE
The crystal must be removed from the carriage mount
in this application.
13
~--T_YP_E_8_7_4-_LB_A__S_L_O_T_T_E_D_L_I_N_E______________________________________
SECTION
4
OPERATION
4.1 CONNECTIONS AND ADJUSTMENTS.
4.1.1 GENERAL.
In use, the slotted Une is fed from an oscillator
which is connected to one end of the line. The circuit
to be measured is connected to the other end. If a
Type DNT detector is to be used and the Type 87 4MRL Mixer Rectifier (Paragraph 3. 3. 2. 2) is to be used
as the detector, it is mounted directly on the lefthand connector on the probe carriage, as indicated
in Figure 12. No connection is made totheother connector on the carriage. Remove the internal crystal
from the carriage. Type 874-R20LA or -R22LA Patch
Cords should be used in all equipment interconnections to prevent rf leakage.
If the built-in crystal detector (refer to Paragraphs 3.3.1 and 3.3.2) is to be used, a Type 874D20L Adjustable Stub should be locked in the lefthand connector on the carriage. The shielded connection to the amplifier, attenuator, or microammeter
should be made from the other connector using a Type
87 4- R22A Patch Cord, as shown in Figure 10, or Type
874-R33 Patch Cord.
4.1.2 COAXIAL ADAPTORS.
If the unknown, the generator, or the detector
is fitted with connectors other than the Type 87 4,
adaptors can be used to make the necessary transition to the Type 874 Connector. A large number of
adaptors are available (see list at the rear of this
manual), permitting use of the slotted line with most
standard connectors. The low standing-wave ratios
of the Type 874 Adaptors assure a minimum of reflection, and the adaptors will have no significent effect on the measurements. Any of the units listed in
the table of adaptors may be used. It should be remembered, however, that the impedance of Type UHF
Connectors is not constant with frequency and may
introduce appreciable reflection in the line at higher
frequencies.
14
In addition to the adaptors, there are available
Type 874 tees, ells, air lines, rotary joints, and other
accessories for convenience of connection. Refer to
the list at the rear of this manual or, for full description, to the latest General Radio Catalog.
4.1.3 METHODS OF SHORT- AND OPEN-CIRCUITlNG A LINE.
The method of producing a short-circuit for
line-length measurement or adjustment is important.
When an antenna or other element terminating a line
is measured, the short circuit can be made, as shown
in Figure 13.
An accurately positioned open -circuit is more
difficult to obtain than an accurately positioned shortcircuit, as the fringing capacitance at the end of the
center conductor will effectively make the line appear
to be longer than it really is. Compensation for the
fringing capacitance is provided in the open -circuit
termination units mentioned below.
A satisfactory method of producing a shortcircuit or open-circuit is to use a Type 874-WN or
WN3 Short-Circuit Termination or Type 874-WO or
W03 Open-Circuit Termination Unit. The Types WN3
and W03 Units produce a short- or open-circuit at a
physical distance of 3 em (3.2 em electrical distance)
from the front face, on the measuring instrument side
of the insulating bead, as shown in Figure 13. The
front face of the bead is located at the bottom of the
slots between the contacts on the outer conductor.
Hence its position can be easily determined from the
outside of the connector. If the device under test is
fitted with a Type 87 4 Connector and a length of 50ohm Air Line, the circuit under test can be disconnected and a Type 874-WN3 or Type 874-W03 Shortor Open-Circuit Termination Unit connected for the
line-length measurement. The coaxial-line section of
a Type874-MLComponent Mountcan be usedforthis
OPERATION
3 em Physical
3.2cm Electrical
50-0HM
~==j~~b=~COAXIAL
LINE
tFZ=P-g~~§P==~ POl NT AT WHICH
IMPEDANCE IS
MEASURED
874-WN OR WO
(b)
POSITION OF
EFFECTIVE
SHORT OR OPEN
CIRCUIT
874-WN3 OR W03
POLYSTYRENE
BEAD
Figure 13. Methods of Short- and
Open-Circuiting.
(a) Use of Type 874-WN3 Short-Circuit Termination Unit or Type 874W03 Open-Circuit Termination Unit to make a short circuit or opencircuit when measuring point is located 3 em. from face of bead, as in upper figure. Upper unit is similiar to a Type 874-ML Component Mount.
(b) Position of the short- or open-circuit when a Type 874-WN ShortCircuit Termination Unit or Type 874-WO Open-Circuit Termination Unit
is used.
(a)
purpose, or a Type 874-WN3 Short Circuit or a Type
874- LlO Air Line can be modified to be suitable. The
physical distance of the air line between the front
face of the insulating bead and the point at which the
measurement is to be made must be exactly 3 em.
This arrangement produces very accurate results.
The Type 87 4- WN or - WO Termination Unit
produces a short or open circuit directly at the front
face of the insulating bead. These units can be used,
even if the impedance is desired at a point on the line
other than at the face of the bead, if the electrical
distance between the two points is added to or subtracted from the line length measured with the shortor open-circuit termination unit connected. The
electrical line length for air dielectric line is equal
to the physical length. Each bead in the Type 87 4
Connector has an electrical length of 0.55 em.
To determine the impedance at the input to a
coaxial circuit connected to the slotted line, a Type
874-WN Short-Circuit can be used to produce a short
circuit directly at the front face of the insulating bead
in the Type 874 Connector on the circuit under test.
(The front faee of the bead is located at the bottom of
the slots in the outer conductor.)
4.2 DETECTOR TUNING.
4.2.1 CRYSTAL RECTIFIER TUNING.
The crystal rectifier built into the carriage is
tuned by means of the adjustable stub, which is ef-
fectively connected in parallel with it in order to increase the sensitivity and to provide selectivity. The
stub is adjusted until maximum output is indicated
by the detector.
Be sure the stub is not tuned to a harmonic of
the desired signal rather than to the fundamental.
Confusion may result in some cases if the tuning is
done with a high VSWR on the line, as the minima of
the harmonics may not be coincident with the minima
of the fundamental and, consequently, the harmonic
content of the signal picked up by the probe may be
several orders of magnitude greater than that present
in the local oscillator output. To minimize the possibility of mistuning, the probe should be tuned with a
lowVSWR on the line, for instance, with the line terminated in a Type 874-W50 Termination Unit or with
the load end of the slotted line open-circuited. In
the latter case, the minima of the harmonics fall
very close to the fundamental minima. Hence, the
possibility of confusion is small, even though the
VSWR is high. As a check, the distance between two
adjacent voltage minima on the line can be measured.
If the stub is tuned correctly, the spacing should be
half a wavelength.
With the Type 874-020L Adjustable Stub, the
crystal can be tuned to frequencies from about 275
Me to above 5 Gc. In the vicinity of 3 Gc the crystal
is self-resonant: the effective Q of the probe circuit
is low and the tuning rather broad. For operation at
frequencies below 275 Me, a Type 874-050L Adjustable Stub can be used down to 150 Me, or various
lengths of Type 87 4- L Air Line can be inserted in
series with the adjustable stub.
15
~--T_Y_PE__
87_4_-L_B_A_S_L_O_T_T_E_D__L_I_N_E______________________________________
4.2.2 HETERODYNE DETECTOR.
When the DNT Detector is used, care must be
taken to tune the local oscillator to beatwith the desired signal and not with one of its harmonics. Harmonics of the oscillator signal can beat with harmonics of the signal picked up from the slotted line and
produce an output at the intermediate frequency if the
local oscillator is tuned to a wrong frequency. Proper
settings of the local oscillator are given by the following expression, assuming that the intermediate
frequency is 30 Me.
tance between two voltage minima on the line, which
should be half a wavelength at the operating frequency.
The use of an appropriate Type 87 4- F Low- Pass
Filter is often convenient in these cases.
At some frequencies it is necessary to insert
a Type 874-LlOL, 10-cm Air Line between the connector on the carriage and the mixer rectifier, in
order to develop sufficient local-oscillator voltage
.across the crystal.
4.3 PROBE PENETRATION ADJUSTMENT.
=
(17)
where fLO is the frequency of the local oscillator,
fs is the signal frequency, and n is an integer, corresponding to the harmonic of the local oscillator
signal used. Always use the lowest possible harmonic.
If n = 1, there are two possible setting!:' of the
local oscillator separated by 60 megacycles and
centered about the signal frequency. If n = 2, the two
possible settings are separated by 30 Me and are
centered about fs/n. In the general case, the two
possible settings are separated by 60 /n and are centered about the frequency fs /n.
The second harmonic of the desired signal frequency will produce a beat frequency of 30 Me when
the local oscillator frequency is
=
2f8 .±. 30
f 8 .±. 15
(18)
or, in general,
f
=
+ 30
s- h
n
(19}
h
where his the harmonic of the signal frequency. It
can be seen from the above equation that some of the
harmonic responses may be located reasonably close
to the frequency at which the fundamental is detected.
The higher the harmonic of the local oscillator, the
closer will be the spurious responses.
In general, spurious responses do not cause
much difficulty, as the frequency to which the detector
is tuned can be easily checked by measuring the dis-
16
The probe penetration should be adjusted for
adequate sensitivity as well as insignificant effect
on the measured VSWR, The presence of the probe
affects the VSWR because it is a small admittance
in shunt with the line. It has the greatest effect at a
voltage maximum, where the line impedance is high.
To adjust the probe penetration, remove the
tuning stub connected to the left- hand connector and
turn the small screw found inside the inner connector.
(See Figure 9.) Clockwise rotation of the screw increases the coupling. In most cases in which moderate VSWR' s are measured, a penetration of about 30%
of the distance between the two conductors gives sa tisfactory n~sults.
CAUTION
Do not screw the probe down tight against the
center conductor, as it will damage the probe or the
center conductor.
To adjust the coupling to 30%, increase the coupling until the probe strikes the center conductor of
the slotted line; then back it off six full turns of the
screw. The point of contact between the probe and
the center conductor is most easily measured by connecting an ohmmeter between the inner and outer conductors of the line. Note the point at which the resistance suddenly drops from a very high value to a
reasonably low value. The crystal is in series with
this circuit, so the resistance will not drop to zero.
No indication will be obtained if the crystal has been
removed.
The amount of probe peneration can be visually checked by looking at the probe through the
slot from one end of the line.
The effect of the probe coupling on the VSWR
can be determined by measurement of the VSWR at
two different degrees of coupling. If the measured
VSWR is the same in both cases, the probe coupling
used has no significant effect on the measurement.
If the measured VSWR' s are different, additional measurement should be made with decreasing amounts
of probe penetration until no difference occurs. However, as pointed out in the previous paragraph, a 30%
coupling usually gives satisfactory results except
when the VSWR is high, which usually requires a larger coupling.
OPERATION
The probe coupling or the oscillator output
should be adjusted until the output from the detector
is in a satisfactory range. If the crystal detector is
used, this means the maximum output to be measured
should not correspond to an input beyond the squarelaw range if the square -law characteristic is to be
depended upon (refer to Paragraph 3. 3.1), and the probe
coupling should not be large enough to affect the measurements appreciably.
The variation in probe coupling along the line
is affected by the depth of penetration. At large penetrations the variation tends to increase. The specified
± 1 1/2% holds for penetrations of 30%.
4.4 MEASUREMENT OF WAVELENGTH.
The wavelength of the exciting wave in air can
be measured using the slotted line by observing the
separation between adjacent voltage minima·when the
line is short- or open -circuited. As explained in
Paragraph 2. 2, the spacing between adjacent minima,
d, is one-half wavelength or
~
= 2d
(20) .
For greater accuracy at the higher frequencies, the
distance over a span of several minima can be measured. If the number of minima spanned, not counting
the starting point, is n, then
=
2d
n
(21)
4.5 MEASUREMENT OF LOW VSWR (BELOW 10:1}.
4.5.1 TWO METHODS.
When the standing-wave ratio to be measured
is less than about 10:1, the VSWR can be read directly
on the scale of a standing-wave indicator (follow the
manufacturer's instructions); or, with the Type 1232- A
Tuned Amplifier and Null Detector or the Type DNT
Detector, it can be determined from the difference
between the two decibel- scale readings corresponding to the voltage maximum and voltage minimum on
the slotted line.
The db difference can be converted to VSWR
on the auxiliary scales at the bottom of the Smith
Chart or can be computed from the expression
VSWR = log- 1 db .
20
When using the Type 1232-A Amplifier with a squarelaw detector, the difference in db must be divided by
two to obtain the value to use in the above formula.
The probe coupling can vary a maximum of
11/2% along the line, and the VSWR measured is in
error by the difference in coupling coefficients at the
maximum and minimum voltage points. This error can
be avoided by calibration of the variation of coupling
with probe position, as outlined in Paragraph 5.2, or
it can be reduced greatly by measuring several minima and several maxima, then averaging the results.
The coupling usually changes the most near the ends
of the line and, hence, better accuracy usually can
be obtained if measurements close to either end are
avoided.
For a particular setup, a check must be made
to determine whether the crystal is operating in the
square-law range. (Refer to Paragraph 3.3.1.)
4.5.2 DETERMINATION OF IMPEDANCE FROM
VSWR.
To determine the impedance of the unknown,
the VSWR and the electrical distance between a voltage minimum on the line and the unknown must be
determined. The unknown impedance is calculated
as outlined in Paragraph 2.3.3 or 2.3.4.
To find the effective distance to the unknown,
short-circuit the line with a very-low-inductance
short at the position of the unknown (refer to Paragraph 4.1.3) and measure the position of a voltage
minimum on the line. This minimum is an integral
number of half-wavelengths from the unknown. Since
the impedance along a lossless line is the same every
half-wavelength, the position of the voltage minimum
found with the line short-circuited is the effective
position of the unknown. If the line is very long, oscillator frequency shifts (discussed in Paragraph
4.6.3) may be serious. See Figure 5.
4.5.3 BROAD MINIMUM.
When the VSWR is very low, the m1ruma will
be very broad, and it may be difficult to locate their
positions accurately. In this case, better results usually can be obtained by measuring the positions of
points on either side of a voltage minimum at which
the voltage is roughly the mean of the minimum and
maximum voltages, as shown in Figure 14. The minimum is located midway between these two points.
(Either the geometric or the arithmetical mean can
be used. It is necessary only to have an identifiable
value.)
17
~
TYPE 874-LBA SLOTTED LINE
~~~~~~~------------------
Figure 14. Method of
improving the accuracy of the determination of the position
of a voltage minimum
on the line when the
VSWR is low.
0
line case, the spacing, A, between points on the line
at which the rf voltage is V2 times the voltage at the
minimum, is measured, as shown in Figure 15. The
VSWR is related to the spacing, A, and the wavelength, )\, by the expression
~
~
VSWR ~
~
f=!
..J
>
..J
l.
(22)
7T/1
!i:!
If the detector is operating in the square-law region,
PROBE-POSITION
4.5.4 ADDITIONAL PRECAUTIONS.
If the line connecting the unknown to the slotted
line has a significant amountof loss, the effect of the
loss on the unknown impedance can be corrected for,
as outlined in Paragraph 4.6.2
Harmonics of the oscillator frequency may also
cause trouble, as discussed in Paragraph 4.6.4. The
effectwill tend to be most serious when theVSWR at
the harmonic frequencies is high.
V2 times the rf voltage corresponds to twice the
minimum rectified output or a 6-db change in output.
For very sharp minima, the width of the minimum can be measured to a much greater accuracy
by use of the Type 87 4- LV Micrometer Vernier than
by means of the centimeter scale on the slotted line.
The vernier can be read to ±0.002 em. When the vernier is used, the probe is moved slightly to the right
of the minimum and the vernier is adjusted to have
its plunger strike the carriage on the unpainted surface below the output connector. To adjust the position of the vernier, loosen the thumbscrew which
clamps the vernier to a reinforcing rod, slide it along
to the proper position, and relock it.
4.6 MEASUREMENT OF HIGH VSWR.
4.6.1 LIMITATIONS.
When the VSWR on the line is 10 to 1 or more,
direct accurate measurements of a voltage maximum
and a voltage minimum are difficult because:
(1) The effect of a fixed probe-coupling coefficient
on the measurement increases as the VSWR increases
because the line impedance at the voltage maximum
increases, and the shunt impedance produced by the
probe has greater effect.
(2) As the VSWR increases, the voltage at the
voltage minimum usually decreases and, hence, a
greater probe-coupling coefficient is required to obtain adequate s ensiti vi ty. The inc rea sed probe coupling may cause errors as outlined in (1).
(3) The accuracy of the measurement ofthe relative voltage decreases as the VSWR increases. The
voltage range becomes too great to permit operation
entirely in the square-law region.
4.6.2 WIDTH OF MINIMUM METHOD.
Accurate measurements of VSWR's greater
than 10 can be made using the width-of-minimum
method. This is analogous to the determination of
circuit Q by measurement of the frequency increment between the two half-power points. In the slotted
18
Then drive the probe through the minimum and
the twice-power points by turning the micrometer
screw. Determine the output meter reading corresponding to the minimum; set the standing-wave indicator for 6 db more attenuation.
Back off the micrometer and return the probe
to the right side of the minimum. Then again drive
the probe through the minimum and twice-power
points and note the two micrometer readings corresponding to the original output meter reading. The
difference between these readings is equal to A.
If the minimum is too close to the right-hand
end of the line to permit the use of the vernier in the
usual manner, the vernier can be moved to the lefthand side of the carriage and the other end of the
plunger can be used to drive the carriage.
Figure 15. Method of
measuring the width
of the voltage miniUJ
mum for VSWR deter- w~f2E minI]]~
minations when tbe Oo
VSWR is high.
g:>
!
a:
t....
UJ
UJ
-2A 0 1-
~~
<%1.J:::>
E min--
wo
a:
<X
:::>
"
Cll
PROBE POSITION ON LINE
OPERATION
The electrical distance between the unknown
and the minimum found on the line can be determined
A.S outlined in Paragraph 4.5.2.
At very high standing-wave ratios, the losses
in the slotted line and in any connecting line or cable
used can have an appreciable effect on the measurements. To keep this error as low as possible, the
voltage minimum nearest the load should be measured. A correction for the loss in the line can be
made as outlined in Paragraph 4.6.3.
4.6.3 CORRECTION FOR LOSS IN LINE BETWEEN
MEASURING POINT AND UNKNOWN.
When a load is connected to the slotted line
through a length of air line or cable, the loss in the
air line or cable may appreciably affect the measurements. Loss in the cable tends tomakethe measured VSWR less than the true VSWR produced by
the load.
The amount of loss in a length of cable can be
estimated from published data or can be measured
on the slotted line. Determine the VSWR with the
load en<;l of the connecting line or cable open -circuited
and shielded to prevent radiation losses. An open
circuit is used for this measurement to eliminate the
significant losses present in most short-circuiting
devices. A Type 8 7 4- WO Open -Circuit Termination
is useful for this purpose. The total attenuation,cx£,
in the length of cable is:
tanh
a£
Ot.Jl =
=
1
(23a)
(VSWR) 0 c
1
tanh- 1
nepers
The attenuation can also be determined from
the open-circuited VSWR by use of the TRANSMISSION LOSS and STANDING WAVE RATIO scales located below the Smith Chart, shown in Figure 16b.
The point corresponding to the open circuit VSWR
is located on the
~m!lx or DB scales under STAND-
min
lNG WAVE RATIO. At the same distance from the
center, find a corresponding point on the TRANSMISSION LOSS scale. Attenuation of the line is equal
to the number of decibels between the left-hand end of
the scale labeled 1 DB STEPS and this latter point.
In most cases the loss in the slotted line itself
can be neglected, but the loss in the line or cable
used to connect the slotted line and the load is of importance. The unknown impedance can then be calculated in the same manner as for the lossless case, if
the measured voltage standing-wave ratio, (VSWR)m,
is first corrected for the effect of the loss in the line.
The effective voltage standing-wave ratio, (VSWR)e,
is then exactly
(VSWR)m
=
(VSWR)e
1 -
1
(VSWR) 0 c
(VSWR)m
(VSWR) 0 c
(25)
4.6.4 CORRECTION FORLUMPED SERIESRESISTANCE AT CONNECTOR.
In the measurement of a very high VSWR, the
lumped resistance loss at the Type 87 4 Connector on
the slotted line can have an important effect. The
(23b)
('VSWR)oc
0 .20
<D
0
0.020
2000
UJ
z
:::;
t/)
"'
J::
=
1
8.686tanh- 1
0-15
0
db.
(23c)
(VSWR) 0 c
.;
0
z
"
0.10
"';!;"
0.07
"
t/)
where the VSWR is expressed as a ratio, not in db.
..,
..,ii'
0.05
..,
0
tanh is
closely equal to the angle, and
~
t/)
>
<J)
<J)
9
z
0
;::
a.
If the VSWR is greater than 10, the
0:
0
1£
a.
t/)
Vl
0.015
0
UJ
0
'!'
UJ
0:
0
UJ
J::
,_0
0:
""'
...J
..,
0:
0.03
<J)
;!;
0.003
300
a£ --
700
1000
2000
FREQUENCY-Me
1
nepers
(VSWR) 0 c
(24)
=
300
500
8.686
(VSWR)oc
db.
Figure 16a. Plot of the effective lumped series resistance at
the connector, measured on a typical Type 874-LBA "Slotted
Line. The insertion-loss produced in a matched line by the measured value of lumped resistance is also indicated, as well as the
VSWR which would be produced by the measured lumped resistance located at a current maximum in an open- or short-circuited
50-ohm line that has no other losses.
19
~
TYPE 874-LBA SLOTTED LINE
~-----------IMPEDANCE
COORDINATES- 50·0HM CHARACTERISTK IMPEDANCE
Figure 16b. Example of the use of the
Smith Chart for line length corrections
when the line has an appreciable
amount of loss. (See Paragraph 4.6.3.)
Min.= 0 .12A. toward
"-... ~·
!
Attenuation = 0.
True VsWR ofload=l3db or
.,
L
~
4 .5tol
Measured VSWR of lood
/
.... , ;
~
RADIALLY SCALED PARAMET,ERS
!j
~
;:;
~
l!:
CENTER
I
magnitude of this resistance for a typical line is
plotted in Figure 16a. Maximum error in measured
VSWR occurs when the voltage maximum is at the
effective position of the series resistance. If a current minimum occurs at this point, there is no error.
This should be borne in mind when corrections for
line loss are determined (refer to Paragraph 4.6.3).
When the position of the standing-wave pattern is
different for the measurement with unknown connected from its position with unknown disconnected, the
lumped resistance loss may be different in the two
measurements.
This type of error can be avoided by use of the
substitution method of measurement. In this method,
the reactance at the end of the line is adjusted with
20
the unknown disconnected to produce a voltage minimum at exactly the same position on the slotted line
as produced with the unknown connected. The effective loss produced by the lumped resistance is the
same in both cases; hence Equation 26 can be used
to obtain the true value of the VSWR produced by the
unknown alone.
1
(VSWR) 0 c
(26)
(VSWR)m
1 - (VSWR)oc
OPERATION
When VSWR is greater than 10 tan e, the following
approximation is valid:
The impedance of an unknown connected to the
slotted line by a line or cable having an appreciable
loss can be calculated from the slotted -line me asurements by use of the Smith Chart exactly as outlined in Paragraph 2.3.4.2 if the measured VSWR is
corrected as indicated in Equation (25); or the complete correction procedure can be carried out on the
Smith Chart and the need for the solution of Equation
(25) eliminated in the following manner. First, the
point corresponding to the measured VSWR is determined on the scale marked STANDING WAVE RATIO,
located below the chart, and the corresponding point
on the TRANSMISSION LOSS, l DB STEPS scale is
found. Travel outward on this scale TOWARD LOAD,
a distance corresponding to the db attenuation in the
line and locate a new point. The radius of the circle
drawn on the Smith Chart is the distance from this
point to the center of the scale. The unknown impedance is found on this new circle at an angle from the
resistance axis corresponding to the electrical distance to the load, as outlined in Paragraph 2. 3.4.2.
(29)
(30)
The equations are much more accurate than the Smith
Chart, particularly when the VSWR is high.
As an example, suppose the open-circuit standing-wave ratio is 30 db, or 31.6 to l. The VSWR with
the unknown connected is 25 db or 17.77 to l, and the
minimum with the unknown connected is located 0.17
wavelength on the generator side of the short-circuit
minimum. Then,
For example, suppose the measured open-circuit VSWR is 20 db, the VSWR with the load connected is 10 db, and the minimum with the load connected
is 0.12 wavelength on the load side of the short-circuit minimum. The attenuation,<lf. in the length of
cable is 0.86 db. The point on the STANDING WAVE
RATIO scale for a VSWR of 10 db is located as shown
in Figure 16b, and the corresponding point is found
on the TRANSMISSION LOSS l-DB STEPS scale. A
new point on the TRANSMISSION LOSS scale 0.86 db
(0.86 division) toward the left-hand end of the scale
is found and a line is drawn from this point to the
STANDING WAVE RATIO scale. The reading of the
scale at this point is 4.5 or 13 db, which is the true
VSWR.
50
=
Xx
[(VSWR)e
Xx
=
- Z0 x
~
-50 tan 61.2°
2
+ 1
J+
= -90.9
ohms
4.6.5 OSCILLATOR FREQUENCY SHIFTS.
In some cases, when the unknown is short-circuited and the position of a voltage minimum is measured to determine the effective position of the unknown, errors can be caused by shifts in the oscillator frequency with the change in the load impedance
between the short-circuited and loaded conditions.
The effect can become more serious as the length of
2(VSWR)e
Zo X
5.32 ohms
40.5 cos (360° x 0.17)
Corrections for line length can also be made
by use of the following transmission -line equations,
from Equations (l4a) and (l4b):
Rx
=
2
J
[ (VSWR)e 2 - 1 cos2e
(27)
[ (VSWR)/ - 1] sin2e
2
[(VSWR)e + 1]
+
[(VSWR)e
where e is the electrical distance between the minima with the line short-circuited and with the load
connected. It is positive when the load minimum is
on the generator side of the short-circuit minimum.
(28)
2
-
1] cos2e
line between the load and the slotted line is increased.
Oscillators which are tightly coupled to the line can
have relatively large frequency shifts. The effect
can be greatly reduced by the insertion of a pad, such
21
~--T_Y_P_E_8_74_-_LB_A__
S_L_O_T_T_E_D__
L_IN_E_______________________________________
as a Type 874-Gl0,10-DB Pad, between the oscillator
and the slotted line. If the resultant decrease in input cannot be tolerated, the oscillator tuning can be
adjusted to compensate for the frequency shift. The
oscillator frequency can be checked on a receiver or
a heterodyne frequency meter. Signal generators, in
general, are loosely coupled, and the frequency shift
is usually small.
length is short. Square-wave modulation should be
used to minimize frequency modulation. The Type
1264- A Modulating Power Supply is recommended for
use with the oscillators listed in Table I.
4.6.6 HARMONICS.
4. 7 .l USE OF CONNECTING CABLE.
Another possible source of error in the measurement of high standing-wave ratios is the presence
of harmonics in the wave traveling along the line.
Harmonics can be generated by the driving oscillator
or by a non-linear unknown such as a crystal rectifier. The minima for the harmonics will not necessarily appear at the same points along the line or
have the same relative amplitudes as the fundamental minima. Hence, a small harmonic content in the
signal may produce a harmonic signal many times
that of the fundamental at a minimum point. Therefore, if the detector will respond at all to harmonics,
difficulty may be encountered. Superheterodyne receivers and the mixer rectifier detector, in general,
have excellent harmonic rejection; but the tuned
crystal detector may not have a large amount of rejection for various harmonics because the tuning
stubhas higher-order resonances. When the crystal
detector is used for measurements of high VSWR' s,
and preferably even when a receiver is used, a good
low-pass filter, such as the Type 874-F500L or -F1000L Low-Pass Filter, is required between the oscillator and the line to reduce the harmonics to an insignificant value. The Type DNT Detector is recommended when the VSWR is very high.
4.7 MEASUREMENT OF 50-0HM COAXIAL LINE
CIRCUITS.
In coaxial-line measurements, the VSWR on
the line, the impedance seen looking into an unknown
line, or the impedance at the far end of a line maybe
needed. In measurements on antennas, we may want
either the VSWR on a line terminated in the antenna
or the actual antenna impedance. However, in most
cases it is not possible to connect the antenna directly to the slotted line and an intermediate length of
cable or air line must be used. The line or cable
should have a 50-ohm characteristic impedance.
Lengths of Type 874-A2 Cable can be used for this
purpose. The connecting cable has no effect on the
VSWR if it is a lossless, uniform line, hence the
VSWRproduced bythe loadis the same asthatmeasured on the slotted line. In practice, however, the
connecting cable and connectors will not be absolutely
uniform but will have small discontinuities which will
have some effect on the VSWR. The uniformity of
lengths of Type 874-L Air Line is much better than
that of coaxial cable and should be used if possible,
to obtain the most accurate results. There is, also,
always some loss in the connecting cable. If it is
significant, a correction can be made for it, as outlined in Paragraph 4.6.2.
4.7.2 MEASUREMENT OF VSWR ON A 50-0HM
LINE.
4.6.7 FREQUENCY MODULATION.
The presence of appreciable frequency modulation on the applied signal may produce errors when
the standing-wave ratio is very high. Frequency
modulation is usually produced when a high -frequency
oscillator is amplitude-modulated; but, in oscillators
using filament-type tubes, frequency modulation can
also be caused by the filaments when heated with ac
power. The amount of frequency modulation for a
given degree of amplitude modulation usually increases as the oscillator frequency approaches its
upper limit. The Type 1209 Unit Oscillator and Type
1021-AU Signal Generator are satisfactory for modulated signal measurements on very high VSWR' s at
50% modulation, up to about 750 Me. At the higher
frequencies, reasonably large errors are produced
in measurements of standing-wave ratios of the order of 500 or 1000. At standing-wave ratios below
50, the error is usually negligible if the over-all line
22
To determine the VSWR on a 50-ohm line terminated in the unknown, the following procedure can
be used:
(1) Set up the equipment and tune the detector, as
outlined in Paragraphs 4.1, 4.2, and 4.3.
(2) Connect the unknown directly to the slotted
line, if possible, or use lengths of 50-ohm air line
or cable provided with constant-impedance connectors, such as Type 874. If the unknown is fitted with
other than Type 874 Connectors, use one of the adaptors listed in Paragraph 4.1.2.
(3) Check the output from the detector at a voltage minimum and maximum and determine that the
generator output and probe coupling are satisfactory,
as outlined in Paragraphs 3. 2 and 4.3. If the indicated
VSWR is greater than 10, only the voltage minimum
need be measured, as the width-of-minimum method
·can be used.
OPERATION
(4) If theVSWR is less than lO,measure the relative output from the detector at several minima
and maxima. Actually, only one minimum and one
maximum need be measured, but because of the variations in probe coupling along the line, greater accuracy can be obtained if several minima and maxima
are averaged or if the probe coupling is calibrated,
as outlined in Paragraph 5. 2. If the VSWR is greater
than 10, use the width-of-minimum method, outlined
in Paragraph 4.6.2, to determine the VSWR.
4.7.3 UNKNOWN IMPEDANCE CONNECTED AT
THE END OF A 50-0HM LINE.
To obtain the actual load impedance, use the
following method:
(1) Followprocedures (1)through(4) of Paragraph
4.7.2.
(2) Measure the position of the voltage minimum
nearest the load end of the line.
(3) Short-circuit the end of the line at the point of
connection to the unknown. Use a very low inductance
metal sheet or strap, or a Type 874 -WN3 or -WN
Short Circuit, as described in Paragraph 4.1.3. Then
find the position of a voltage minimum on the line
with the line shorted and record the scale reading
corresponding to the probe position (refer to Paragraph 4.5.1).
(4) Determine the difference in position, .f, between the minimum measured with the line shorted,
and the minimum measured with the unknown connected. Divide the result by the wavelength to obtain
+ . I f several measurements are tobemade atdifferent frequencies on the same circuit, the over-all
electrical line length between any point on the slotted line and the short circuit can be determined. Then
the line needs to be short-circuited only once.
(5) On the 50-ohm Smith Chart, determine the
radius of the circle on which the impedance must lie
from the scale labeled STANDING WAVE RATIO, located at the bottom of the chart. Draw a circle having
this radius on the chart, with its center at the center
ofthe chart. (Referto Paragraph2.3.4.2.) The transmission-line equations presented in Paragraph 2.3.3
can be used in place of the Smith Chart. (The 50- ohm
impedance version is considered here.)
(6) Notewhether the minimum found with the line
shorted lies on the generator side or on the load side
of the minimum found with the load connected. If the
short -circuit minimum lies on the load side, travel
from zero around the circle a long the WAVELENGTHS
TOWARD LOAD scale the number of wavelengths
found in Step (4). If the minimum lies on the generator side, travel in the opposite direction along the
WAVELENGTHSTOWARDGENERATOR scale. Draw
a line from this point to the center of the chart, as in
Figure 7.
(7) Find the impedance in ohms of the unknown
from the coordinates of the intersection of the line
drawn in Step (6) and the circle drawn in Step (5). If
the admittance is desired, travel around the chart
another 0.25 wavelength and draw another line to the
center of the chart, or use the admittance chart as
outlined in Paragraph 2.3.4.4 (Figure 8). The coordinates of the intersection of this line with the circle
multiplied by 0.4 are the components of the admittance of the unknown in millimhos.
4. 7 .3.1 Example of Antenna Impedance Measurement,
Low VSWR. The antenna is a stub mounted perpendicular to a ground plane. At the ground plane the
stub is connected to the center conductor of a short
section of 50-ohm coaxial line which terminates in a
Type 874, 50-0hm Connector. Since it is not practical to bring the slotted line close enough to the antenna to make a direct connection between the slotted
line and the instrument, a 3-foot length of 50-ohm
coaxial cable is used to make the connection. (For
the best accuracy, the cable should be as short as
possible and, if possible, sections of Type 874-L30
Air Line should be used in place of the cable.) The
generator is a Type 1209 Unit Oscillator modulated
by a Type 1264-AModulating Power Supply. The detector is a commercially available VSWR indicator
used with the built-in crystal detector. The Type
1232-A Tuned Amplifier and Null Detector is also a
suitable detector when the VSWR of the unknown is
less than 1.8 (5 db). A Type 87 4- D20L Adjustable Stub
is used to tune the crystal. The oscillator is set to
operate at 750 Me and the stub is adjusted for maximum output with the cable disconnected from the
slotted line. The probe penetration was previously
set at 30% (6 turns out from the center conductor),
at which position it has no appreciable effect on the
measurements. The antenna is then connected and
the checks made for square-law operation.
For an accurate measurement of the VSWR,
the probe is set to the voltage maximum nearest the
load, and the gain is adjusted to produce a meter
reading of 1 db. The probe position at this point is
found to be 35.22 em. The probe is then moved in
one direction until a voltage maximum is found and
the meter reading is recorded.
The probe is then moved to each of the voltage
maxima and minima found on the line and the meter
readings obtainedare 1.0, 6.3, 0.8, 6.1, 1.2, and 6.5.
The VSWR is half the average difference in the attenuator settings or
1/2
~-3
+
~.1
+6.5- 1.0 + 038 + 1.2] = 2.65 db
= 1.36
23
~~T~YP~E~8~7~4-~LB~A~S~L~O~T~T~E~D_L~I~N~E-------------------------------------(For greater accuracy, the variation in probe coupling can be calibrated, and corrections made, as outlined in Paragraph 5.2.)
The effective position of the measured minimum with respect to the load is then measured by
short-circuiting the line at the antenna by means of
a Type 874-WN3 or -WN. The approximate position
of the minimum is found. The gain is then increased
to improve the resolving power. (The minimum positioncan be determined accurately bymeasuring the
position of the two equal- output points, one on either
side of the minimum. In this case, the minimum occurs at 36.12 em.)
In order to calculate the antenna impedance,
the wavelength must be accurately known. It can be
determined from the frequency by the equation:
A=
in em
where fMc is the frequency in megacycles. It can
also be measured on the line by obtaining the distance
between minima, as outlined in Paragraph 4.4. In
the example under consideration, the wavelength is
40.00 em.
The pertinent information, therefore, is:
VSWR = 2.65 db.
Position of minima with load connected=
35.22 em.
Position of minima with short-circuit at
load = 36.12 em.
)... = 40.00 em.
The impedance of the antenna is calculated as
outlined in Paragraph 2.3.4. 2. The radius on the
Smith Cl:art, corresponding to 2.65 db, is found from
the scales below the chart and the circle drawn on
the chart, as shown in Figure-17. The position of the
minimum with respect to the short-circuit minimum
is 36.124 3 5 · 22 = 0.00225 wavelength toward the
0
are the same as indicated in the previous example,
but when the VSWR is found to be greater than 10,
the width-of-minimum method is used. The probe is
set to a voltage minimum near the load and the generator voltage is increased to a maximum.
To make the measurement, the probe is set at
the voltage minimum and the gain is increased until
the meter reads about half scale. The probe is then
moved to the right of the minimum, beyond the point
at which the meter reads full scale. If the Type 874LV Micrometer Vernier is available, it should be adjusted so the plunger contacts the unpainted surface
on the edge of the carriage. The carriage is then
moved continuously to the left, using the micrometer
vernier (or the knob, if a micrometer vernier is not
used) and the meter reading at the minimum is noted.
The gain is set to make the minimum read exactly 6
db on the meter. The carriage is then moved to the
right until the meter reads off scale, then moved to
the left by means of the micrometer vernier or the
knob. The scale or vernier readings corresponding
to the 0-db meter readings on each side of the null
are recorded. The meter indication at the minimum
should be 6 db. If it is not, the gain is readjusted to
make it 6 db, and the measurement is repeated.
In the measurement in question, the minimum
occurs at a scale reading of 42.40 em and the micrometer vernier readings for the two 0 -db meter readings are 2.111 and 0.632 em. The distance between
the twice-power points, D., is then 1.479 em. The
wavelength, 4, at 350 Me is 85.7 em. The VSWR,
from Equatialn (22), is then
VSWR
= 1TAl::t.. = 1T
85.7
1.479
X
=
18.46
When the antenna is shorted, a m1mmum is
found at 13.09 em. The antenna impedance is then
calculated using the Smith Chart or the transmissionline equations, as outlined in Paragraphs 2.3.3 and
2.3.4.2. On the Smith Chart, the radius of the circle
corresponding to a VSWR of 18.46 is drawn on the
chart, as in Figure 17. The minimum with the an-
load. The antenna impedance is, therefore, 36.8- j3.5
ohms.
tenna shorted is
In this case, the loss in the line between the
antenna and the slotted line is negligible. In cases
in which it is not, a correction can be made as outlined in Paragraph 4.6.3.
toward the generator from the minimum found with
the antenna unshorted. Traveling around the circle
on the Smitll Chart a distance of 0.340wavelength toward the generator, the unknown impedance is found
to be 9.0 - F8 ohms.
4. 7. 3. 2 Measurement of the Impedance of an Antenna
Having High VSWR. The same antenna measur~d in
the previous example, when measured at 350 Me,
shows a high VSWR. The preliminary adjustments
More accurate results can be obtained by use
of Equatiods (15a) and (15b), Paragraph 2.3.3. Here
e = -360° I_ 0.340 = 122.4°, and tan e- = 1.576. Since
tan e i~ less than 0.1 and the VSWR is greater than
VSWR
24
42
.4~;) 3 · 09 = 0.340 wavelength
OPERATION
IMPEDANCE
COORDINATES- 50-0HM CHARACTERISTIC IMPEDANCE
Figure 17. Example of the use of the
Smith Chart to calculate antenna impedances. (See Paragraphs 4.7. 3.1
and 4. 7.3.2.)
10, the approximate form can be used. Also, 8 is
negative, since it lies on the load side of the shortcircuit minimum.
If the cable is long enough to have appreciable loss,
corrections can be made as outlined in Paragraph
4.6.3.
Therefore,
=
=
=
2
VSWRcos 8
9.4
ohms
=
50
4. 7.4 MEASUREMENT OF TilE INPUT IMPEDANCE
TO COAXIAL- LINE CIRCUITS.
To measure the input impedance to a coaxialline circuit, connect the circuit directly to the slotted
line by means of a coaxial connector. Then use the
procedure outlined inParagraph 4.7.3. In this measurement, the point in the connector at which the impedance is to be obtained must be specified, because
the impedance may vary appreciably from one point
to another in the connector. In many cases, it is ad -
25
~
TYPE 874-LBA SLOTTED LINE
~-------------------------vantageous to measure the impedance at the front
face of the polystyrene bead in the unknown connector. (Refer to Paragraph 4.1.3.) In order to determine the impedance at this point, the electrical distance from the insulator in the connector and the position of a voltage minimum on the slotted line must
be found.
Figure 18. Approximate equivalent circuit of connecting
lead reactances encountered
when components are measured.
To determine the electrical distance, measure
the physical distance between the two points in question and add 0.48 em to the length obtained to account
for the lower velocity of propagation in the insulators
at the end of the slotted line.
Another more accurate method of determining
the effective electrical distance is to short-circuit
the end of the slotted line with a Type 8 7 4- WN Short
Circuit and then determine the position of a voltage
minimum on the slotted line, as outlined in Paragraph
2.3.3. The short circuit is made at the face of the
bead in this unit.
Measure the VSWR and calculate the unknown
impedance, as outlined in Paragraph 4. 7 .3.
4.8 MEASUREMENTS ON COMPONENTS AND
LUMPED CIRCUITS.
4.8.1 PROCEDURES.
The Type 87 4- LBA Slotted Line can be used to
measure the impedance of components of all types.
At high frequencies, this type of measurement is
complicated by many factors, the most important of
which generally are: (1) the position of the element
with respect to ground, leads, and other circuit elements can have a large effect on the impedance of an
element, and (2) the reactances of leads used to connect the component to the measuring device, any leads
which may be part of the component under test, and
the stray capacitance of the measuring terminals and
supplementary leads may also appreciably affect the
measurements.
To minimize the effects of the first difficulty,
the component should be measured while mounted in
the position in the circuit in which it is to be used, or
under as similar conditions as possible. One method
of measuring a component in position in a circuit is
to connect it to the slotted line by means of a length
of flexible cable or rigid coaxial line, as shown in
Figure 18. The rigid line is preferred, as its characteristic impedance is more uniform. The impedance is measured, as outlined in Paragraph 2.3.4.2.
The line is short-circuited at its load end by one of
the methods shown in Figures 13a and 13b.
The supplementary leads used to connect the
component to the end of the coaxial line should be as
26
CABLE BONDED
TO CHASSIS
short as possible to minimize the effects of the lead
and terminal reactances.
The leads referred to do not include those normally used to connect the unknown to the circuit. If
the supplementary leads are short, the stray reactances can be considered as lumped into two elements: a shunt capacitance across the end of the
line, and an inductance in series with the line, as
shown in Figure 18. The lead and terminal reac tances affect the measured impedance, Zm, as can be
seen from the equivalent circuit in the figure. In
order to determine the actual impedance of the unknown, the measured impedance should be corrected
for the effects of the lead and terminal reactances,
using the following equations:
Rx
=
Rm
-D
Xm
Xx
=
(31)
(I - ~:)
2
Rm
-Xa
D
-XL
(32)
where
(33)
1
Xa
=
XL
= wL
we a
ohms
{34)
ohms
{35)
where L is the magnitude of the lead tnductance in
henrys and Ca is the magnitude of the shunt capaci tance in farads.
OPERATION
If the admittance of the unknown is desired,
rather than the impedance, the admittance, Ym,
appearing across the end of the line, is calculated
from the VSWR and from t he position of a voltage
minimum, as outlined in Paragraph 2.3.4.4. The following equations should be used to correct for the
lead reactances:
Gx
Gm
=
(36)
D
I
Bm
Bx =
(1- =~j
dotted capacitor of Figure 18. The ratio of the two
capacitances can be estimated from the physical configuration of the circuit.
An even better approximation can be made when
the leads are reasonably long, if the inductance and
capacitance are assumed to be uniformlydistributed
and the leads are treated as a section of transmission line. The characteristic impedance, Z 0 , of this
line and the tangent of the electrical length, tan e,
are related to the short- and open-circuit impedances,
Zoe and Zsc, by the expressions:
Gz
m
BL
(41)
(37}
D
where
D
,
Bm
=
~
B~ jz + (Gm
BL
=
Bm - Ba
=
Bm - wCa
BL
J
tane
(38)
(39)
X
l(j3
(42)
millimhos
Equation (12) or the Smith Chart can be used to
correct the measured impedance for the effect of the
equivalent section of transmission line. If a Smith
Chart designed for lines having a 50-ohm impedance
is used, the measured values should be divided by
~
before entering the chart and the resultant cor-
rected impedance multiplied by ~- In most cases
BL
=-
103
millimhos
(40)
wL
where Ca and L are as defined in the previous p :;.ragraph. All admittance components are in millimhos.
The magnitudes of the lead and terminal reactances or susceptances can be determined from me asurements of the reactance seen with the leads shortcircuited by a low-inductance copper sheet at the
point of connection to the unknown, and the reactance
seen with the leads open -circuited at the point of connection to the unknown. The inductive reactance is
measured when the leads are short-circuited and the
capacitive reactance is measured when the leads are
open-circuited. For this approximation to hold, the
lead-capacitive reactance should be greater than five
times the lead-inductive reactance.
the capacitance is not uniformly distributed but the
approximation usually gives reasonably accurate results. A normalized Smith Chart is better suited to
this application.
In most cases more accurate measurements
can be made by use of the Type 874-ML Component
Mount, shown in Figure 19, on which the component
or lumped circuit can be mounted. The end of the
center conductor of a section of air line is used as
------------1
I
I
I
I
I
I
I
I
I
I
I
COMPONENT
LNDER TEST
I
I
A somewhat better approximation canbe made
if the lead capacitance is assumed to be distributed
between the t\vo ends of the leads, as shown by the
-------,----_j
Figure 19. Sketch of the
Type 874-ML Component Mount.
SHIELD
27
__S_L_O_T_T_E_D__L_IN_E________________________________________
~--TY_P_E_8_7_4-_LB_A
the ungrounded terminal, and the outer conductor is
extended in the form of a disk for a ground plane.
The line can be short-circuited at the. terminal by
means of a very low inductance disk (supplied) or the
mount can be disconnected and replaced by a Type
874-WN3 Short-Circuit Termination Unit. The distance from the front face of the polystyrene bead in
the connector mount is located 3 em away from the
ground-plane surface; hence, the termination unit
referred to places a short-circuit effectively at the
ground-plane surface when it is substituted for the
component mount.
A correction must be made for the reactance
of supplementary leads, as previously outlined.
To remove the coaxial-line section from the
ground plate, loosen the locking nut. It can then be
installed in any other plate if a 3/4-27 tapped hole is
provided.
In this case, the impedance directly across the
ends of the resistor is needed. However, the resistor is connected to the mount by means of its own
leads, which affect the measurements. Since it is
not desirable to clip the leads at the ends of the resistor to measure the lead reactances, the resistor
is removed and identical leads are substituted. The
position of the minimum on the line is determined
with the leads open-circuitedand is found to be39.90
em. The ends of the leads are short-circuited by
spot-soldering a copper sheet about three inches in
diameter to the ends of the leads and the minimum
position is found again. In this case it is at 32.95 em.
The short-circuit reactance, Xsc, calculated
from the Smith Chart, is +57 ohms. The open-circuit reactance, X0 c, is -330 ohms. The actual impedance appearing across the resistor terminals is
then calculated by the use of Equations (31) and (32).
4.8.2 EXAMPLEOFMEASUREMENTOF A 200-0HM
RESISTOR AT 600 MC.
In this case, the resistor is mounted on a Type
87 4- ML Component Mount, shown in Figure 19, which
is connected to the slotted line. The built-in crystal
detector is usedwith aVSWRindicator. A block diagram of the setup is shown in Figure 10. The stub
is tuned with the slotted line open -circuited, as indicated in Paragraph 4.2. The unknown is connected
and the input power is adjusted to keep the maximum
excursion of the crystal within the square-law range.
Averages of several VSWR readings are taken to
minimize the effect of the variation in probe coupling
along the line, and an average reading of 3.16 is obtained. Position of the voltage minimum nearest load
was 40.25 em.
The component mount is then disconnected, the
Type 874 - WN3 Short Circuit is connected to the
slotted line, and the position of a voltage minimum
is located. The position of the minimum nearest the
load is found to be at 51.20 em. Therefore,
D
=
118
=
-66.0
=
Xsc
=
X0c
ohms
=
ohms
+ 57
= - 330
=
0.768
118
=
0.768
154
0.219 wavelength
The measured resistance and reactance, calculated by the use of the Smith Chart, are:
Rm = 118 ohms; Xm = -66 ohms.
28
=
ohms
118
-330
=
=
ohms
=
VSWR = 3.16
51.20 - 40.25
50
ohms
2
0.768
-57
0.768
=
-72.2 ohms
The measured resistance is less. than the de
value of 200 ohms, due to the shunt capacitance of
the resistor itself.
MISCELLANEOUS
SECTION
5
MISCELLANEOUS
5.1 OPERATION AT FREQUENCIES BELOW 300 Me.
Since the probe travel is only 50 em, it will not
always be possible to measure both a voltage minimum and maximum on the line at frequencies below
300 Me, as the range of travel of the probe is onehalf wavelength at 300 Me. At frequencies below 150
Me, where the line is less than a quarter of a wavelength, it will never be possible to measure both a
voltage maximum and minimum on the line directly.
If both a voltage minimum and maximum do not appear on the line at frequencies above 150 Me, additional lengths of Type 87 4- L30 and - LlO Air Lines
can be inserted between the line and the load until
both a minimum and a maximum do appear. Of
course, if the VSWR is greater than 10, only the minimum need appear on the slotted section of line, because the measurement can be made by the width -ofminimum method.
At frequencies below 150 Me, lengths of air
line can be inserted between the line and the load until either a minimum or maximum can be measured.
Sections of air line are then transferred to the other
side of the slotted line, that is, between the line and ·
the generator, until the maximum or minimum ap- ·
pears and can be measured. The sections are transferred, rather than removed, to keep the load on the ·
oscillator and, hence, the relative voltage amplitude
on the line, constant.
A somewhat better solution is to use two slotted
lines and add sections of air line between them or
between one of them and the load until a minimum
appears on one line and a maximum on the other.
The probes are set at the respective maximum and
minimum and the outputs from the detector and the
position of the probe at the minimum are recorded.
A Type 874-WSO Termination Unit is then connected
to the end of the line and the outputs of the two detee tors again recorded. Since the voltage is constant
all along the line with the termination connected, the
probe couplings in this case are proportional to the
outputs if the detector is linear. If the detector is
square-law, the probe couplings are proportional to
the square roots of the outputs. The outputs observed
with the load connected can then be corrected for any
difference in coupling. This calibration corrects for
differences in probe penetration, differences in probe
couplings, and differences in sensitivity of the detectors.
The Type 874-D20L Stub will tune the crystal
rectifier down to 275 Me. The Type 874-DSOL Stub
will tune down to 125 Me. Additional lengths of air
line can be inserted in series or in shunt, using a
Type 87 4 Tee for operation at lower frequencies.
With the long stub in place, smoother operation of
the carriage is obtained if the whole slotted line is
tilted slightly forward to make the stub almost vertical.
5.2 CALIBRATION OF THE VARIATION IN PROBE
COUPLING.
The variation in probe coupling along the line
can be calibrated and the measurements very easily
corrected for the variations. A 1000-cycle signal of
at least 10 volts from the audio oscillator is applied
to the slotted line whose load end is open-circuited.
The tuning stub and crystal are removed and the input to the amplifier(Type 1232-Ais suitable) is connected directly to the connector normally used for
the tuning stub. The variation in indication on the
amplifier meter is then recorded as a function of the
probe position. The curve thus obtained can be applied to rf measurements. In this calibration, the
crystal is not used and the output is directly proportional to the coupling. Therefore, the correction factor measured should be doubled to allow for the
square-law rectification characteristic.
The variations in probe coupling will change
somewhat as the probe penetration is varied. Hence,
for most accurate results, the calibration curve
should be made with the same probe penetration as
was used in the rf measurements.
29
~ __T_Y_P_E_8_74_-L_B_A__
S_L_O_T_T_E_D_L_I_N_E_______________________________________
SECTION
6
SERVICE
AND
6.1 GENERAL.
The two-year warranty given with every General Radio instrument attests the quality of materials
and workmanship in our products. When difficulties
do occur, our service engineers will assist in any
way possible.
In case of difficulties that cannot be eliminated
by the use of these service instructions, please write
or phone our Service Department, giving full information of the trouble and of steps taken to remedy it.
Be sure to mention the serial and type numbers of the
instrument.
Before returning an instrument to General Radio
for service, please write to our Service Department
or nearest district office (see back cover), requesting a Returned Material Tag. Use of this tag will ensure proper handling and identification. For instruments not covered by the warranty, a purchase order
should be forwarded to avoid unnecessary delay.
6.2 REPLACEMENT OF CRYSTAL RECTIFIER.
The Type lN23B Crystal Rectifier is mounted
in the carriage (See Figure 9a), where it is held in
place by a spring. To remove the rectifier, first unscrew the crystal cover on the back of the carriage
and then pull the rectifier from its socket.
The crystal can be checked with an ordinary
ohmmeter. Measure the resistance with both polarities of applied de voltage. The resistance should be
below 700 ohms in one direction and above 15,000
ohms in the other.
MAINTENANCE
When the track needs cleaning, spread a coat
of kerosene or light oil, such as clock oil, over the
whole outside of the outer conductor. Use a pipe
cleaner or a cloth. Then slide the carriage back and
forth several times to dislodge any dirt caught in the
felt rings. Finally, wipe the track dry with a cloth.
Repeat this procedure until the cloth does not pick
up any dirt.
If the line is very dirty, remove and clean the
felt washers. To remove them, unscrew the retaining washers at both ends of the carriage (see Figure
9a) and pull out the felt. Clean the felt in a solvent.
When replacing the felt washers, flatten them out
and push them into place. Reload the felt washers
with a light oil through the oil holes at the ends of
the carriage.
An oil port at the bottom of the carriage per::nits lubrication at the point of contact with the tie
bar. This is especially important if the slotted line
is motor driven.
The slot in the outer conductor can be cleaned
with a pipe cleaner.
If the inside of the tube needs cleaning, remove
the connectors at both ends as well as the center conductor and unscrew the probe about six turns. Pass
a cloth attached to a string through the tube. Do not
perform this operation unless it is really necessary;
it requires cate and readjustment of the center conductor after the line is reassembled.
6.4 REMOVAL OF CENTER CONDUCTOR.
NOTE
6.3 CLEANING AND LUBRICATION.
The Slotted Line should be kept in its storage
box o•: covered when not in use to keep dirt from accumulating on the carriage track. The track should
be cleaned and lubricated occasionally for best performance.
The felt washers shown in Figure 9a are lubricated through the oil holes provided. Use a light oil
and keep the oil ports filled so that there is a light oil
film on theouter tube. It mayoccasionally be necessary to tighten the retaining rings to keep the felt ·
washers in contact with the tube. Do not tighten them
too much, or they will make it difficult to slide the
carriage, causing backlash.
30
Use of the Type 874-TOK Tool Kit is recommended for
convenience and best results
Before or during disassembly of the line, mark
the center conductor, both teflon insulators, and both
inner conductors, so that they can be reassembled
with their original orientations.
To remove the connectors, unscrew the coupling
nut at the base of the connector, and pull off the outer
conductor sections. Then carefully pull the inner conductor sections and insulators out of the line. (This
may be difficult because the inner teflon insulator is
a press fit.) Then remove the center conductor. (See
Figure 20.)
SERVICE AND MAINTENANCE
POLYSTYRENE BEAD
END CASTING
6.5 CENTERING OF PROBE IN SLOT .
(0874-0700)
OUTER
CONDUCTOR
TEFLON INSULATOR
(0874-0603)
(0874- 7230)
SPRING FINGERS
SLOT FOR
PROBE
INNER
CONDUCTOR
(0874-6119)
CENTER CONDUCTOR
(0874-6121)
RETAINING RINGS
OUTER
CONDUCTOR
(0874 -OSlO)
(0874- 6123)
To check the centering of the probe shield, hold
the line up to a light and sight from one end along the
slot. Move the carriage along the line and observe
the centering of the probe shield.
If the probe is not centered, unscrew the large
screws that tighten the clamps on the end casting,
loosen the outer tube in its mounting, and rotate it
slightly. The outer-conductor wrench of the Type 87 4TOK Tool Kit inserted as a handle at one end may
make it easier to rotate the line.
Figure 20. Sketch of end section of the line
showing the supporting insulators and conical section.
6.6 ADJUSiMENT OF NYLON CORD TENSION.
Replace the polystyrene bead (0874-0700) of the
connector inner conductor before reassembling the
line to ensure a tight fit.
Be careful to reassemble the line with the original orientations. Insert the line center conductor
part way into the right-hand end of the line, and slip
the spring fingers over the conical section on the righthand inner conductor. Then push the inner conductor
(with Type 87 4 Connector on the end) into the tube
until the polystyrene bead is flush with the end of the
tube. Align the key inside the connector outer conductor with the slot in the end of the tube and fasten the
connector in place with the coupling nut.
Slide the left- hand inner conductor into the
other end of the line until its end almost contacts the
end of thecenterconductor, as seen through the large
slot. Bend a piece of wire into a shallow hook, insert
it through the slot, and hook it around the end of the
center conductor. Lift the center conductor so that
it will slip onto the conical section, and carefully
push the inner conductor into place. Be sure that the
conical section enters the hole in the end of the center conductor without damaging the spring fingers.
Then align the keyway, reattach the connector and
lock it in place.
If it is necessary to adjust the center conductor, rotate it until the variation in probe coupling is
at a minimum. To raise or lower the ends of the
center conductor, rotate the teflon beads, which are
slightly eccentric. Check the variation in probe
coupling at 1000 cps, as outlined in Paragraph 5.2.
To rotate the center conductor, insert a thin
blade through the slots between the spring fingers
(accessible through the slot in the outer conductor).
A prying motion will rotate the center conductor. Be
careful not to damage the spring fingers.
The nylon cord will stretch slightly with time,
causing some backlash. A take-up reel on the back
of the carriage can be used to adjust the cord tension.
The inner flange of the reel has a number of holes
around its outer edge; a pin, on the carriage body,
enters one of the holes to provide a ratchet-type lock.
To turn the reel, first pull it out about l /16 inch to
withdraw the pin from the hole in the flange. Then
rotate the reel to produce the desired cord tension,
and lock it by pushing it in so that the pin enters one
of the holes.
6.7 REPLACEMENT OF NYLON CORD.
The nylon cord is very tough, and should last a
long time unless it rubs against a sharp cutting edge.
A spare cord is supplied with the slotted line, and
additional cords can be obtained from General Radio
Company. The cord is 0.045 inch in diameter and
74-1/2 inches long; part number is 0874-3690.
Install the cord as shown in Figures 9b and 9c.
Knot the cord near one end, and thread the other end
through the hole in the anchor post. Then pass the
cord around the idler pulley and wrap it 1-1/2 times
around the drive drum. Make sure that the end of the
first turn is on the knob side of the beginning of the
first turn (see Figure 9c) so that the turns travel in
the correct direction on the drum. Then pass the
cord around the anchor post and thread it through the
hole in the outer flange of the take -up reel. Knot
the cord near the end to keep it from slipping back
through the hole. Then adjust the tension by pulling
out the take-up reel, to disengage the pin. Rotate it
clockwise until the action of the drive knob feels satisfactory. It may be necessary to sli_d e the cord axially along the driving drum to center it properly and
to prevent it from riding over the flange at one end.
31
TYPE 87 4 COAXIAL COMPONENTS
TYPE 874 CABLE CONNECTORS
CONNECTOR
TYPE
~
::t:
0
0
.,.,
874- A2
RG-BA/U
RG-98/U
RG-lOA/U
RG-87A/U
RG-11'6/U
RG-156/U
RG-165/U
RG-!66/U
RG-213/U
RG-214/U
RG-215/U
RG- 225/U
CABLE
-CA
CABLE
LOCKING
PANEL
FLANGED
-CLA
-PBA
-CLBA
-CBA
-PBBA
TYPE 874 ADAPTORS
PANEL
LOCKING
-PLA
-PLBA
PANEL
LOCKING
RECESSED
-PRLBA
"'
w
a._
>-
I-
w
..J
"'u<
~
::t:
0
~
i:
0
z
w
..J
"'u<
-..J
a._
a._
<
~
::t:
0
0.,.,
0
.,.,0
i:
0
z
~
::t:
0
0
.,.,
~
Z::t:
00
z~
RG-62/U
(Serie s )
RG-718/U
RG-140/U
RG-210/U
RG-174/U
RG-188/U
RG-316/U
RG-161/U
RG-187/U
RG-179/U
QB]A
QB]L*
QBPA
plug
c
plug
jack
QC]A
QC]L*
QCP
HN
plug
jack
QH]A
QHPA
LC
plug
QL]A
QLPA
LT
plug
jack
QLT]
QLPT
plug
QMD]
QMD]L*
QMDP
jack
Microdot
jack
plug
N
QN]A
QNJL*
QNP
QNPL*
jack
OSM/BRM plug
QMM]
QMM]L*
QMMP
QMMPL*
jack
sc
plug
QSC]
QSC]L*
QSCP
(Sandia)
jack
-CSBA
-CLSBA
-PBSBA
-PLSBA
-PRLSBA
TNC
plug
UHF
plug
QTNJ
QTNJL*
QTNP
jack
RG-59~
~
::t:
874-
BNC
-PRLA
1 - - ~-227/U
RG-llA/U
RG-12A/U
RG-13A/U
RG-638/U
RG-798/U
RG-89/U
RG-144/U
RG-146/U
RG-149/U
RG-216/U
874- A3
RG-29/U
RG-55/U
(Series)
RG-58/U
(Serie s)
RG-141A/U
RG-142A/U
RG-159/U
RG-223/U
TO TYPE
UHF
-C62A
-C L62A
-PB62A
-PL62A
-PRL62A
so-u
Air Line
jack
QU]
QUJL*
QUP
7/8-in.
I-5/8-in.
3-1/8 - in.
QUIA
QU2
QU3A
• Locking Type 874 Connector
-C174A
-CL174A
-PB174A
-PL174A
-PRL174A
Example: To connect Type 874 to
a type N jack, order Type 874-QNP.
CONNECTOR ASSEMBLY TOOLS
Example: For a locki ng cab le connector for RG-SA/U, order Type 874-CLSA.
TYPE 874-
TOK
TOSS
TOB
FUNCTION
Tool Kit
Crimping Tool
Crimping Tool
OTHER COAXIAL ELEMENTS
TYPE 874-
TYPE 874-
A2
SO !1 cable (low loss)
A3
SO !1 cable
D20L, DSOL
20 -, SO- em adjustable stubs
EL, EL-L
90° ell
FlBS.L
!85-Mc/s low-pass filter
FSOOL
500-Mc/s low-pass filter
F!OOOL
1000-Mc/s low-pass filter
F2000L
2000-Mc/s low-pass filter
F4000L
4000-Mc/s low-pass filter
FBL
bias insertion unit
G3, G3L , G6,G6~ 3-, 6-, JO- , and 20-dB
GJO, GIOL •
attenuators
G20, G20L
GAL
adjustable attenuator
]R
rotary joint
K,KL
coupling capacitor
L!O, L!OL
!0-, 20-, and 30-cm
L20, L20L
rigid air lines
L30, L30L
LAL
33-58 em adjustable line
LK!OL , LK20L
constant-Z adjustable lines
LR
radiating line
LTL
trombone constant-Z line
}
ML
MB
MR, MRL
R20A, R20LA
R22A, R22LA
R33, R34
T,TL
TPD, TPDL
u
component mount
coup ling probe
mixer-rectifier
patc h cord, double shield
patch cord, double shield
patc h cord, single shield
tee
TYPE
NO.
U-line section
short - circuit terminations
terminations
insertion unit
series inductor
z
stand
balun
variable capacitor
voltmeter indicator
voltmeter detector
voltmeter r ectifie r
100-n termination
200-11 termination
so-n termination
USED
WITH
Basic
874-8
50-ohm
Air Line
Basic
Locking
874-BRL
50-ohm
Air Line
Panel
Locking
874-PLT
Wire Lead
Panel
Locking
Recessed
874-PRLT
Wire Lead
Panel
Locking
Feedthrough
874-PFL
Type 874
power divider
UBL
VCL
VI
VQ,VQL
VR, VRL
W!OO
W200
WSOB, WSOBL
WN, WN3
WO, W03
X
XL
y
MISCELLANEOUS COAXIAL CONNECTORS
CONNECTOR
TYPE
open~circuit
clip loc k
Patch Cords
L suffix indicates locking Type 87 4 Connector.
FOR COMPLETE DETAILS, REFER TO THE GENERAL RADIO CATALOG.