1
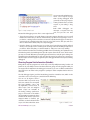
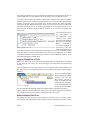
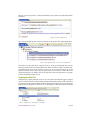
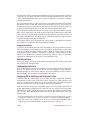
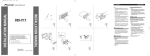
The ColdFusion 8 Debugger Explained:
Interactive Step Debugging for ColdFusion 8
by Charlie Arehart
M
any CFML developers have felt that the one thing missing from their arsenal of tools
was an interactive step debugger. Until now, step debugging in ColdFusion required
FusionDebug, a third-party tool I introduced to readers in Volume 1 Issue 2 of this journal.
ColdFusion 8 now includes its own CFML step debugger, and in this article, I’ll introduce
readers to the concept of step debugging and to the tool in ColdFusion 8, without presuming
you’ve read the earlier article or used FusionDebug. In the sidebar below, I’ll explain why
developers, even those who dismiss debuggers, should give them serious consideration. I
think perhaps you’ll see some aspects of the tool that exceed your expectations.
What is Interactive Step Debugging?
Interactive or step debugging has got nothing to do with the debugging output at the
bottom of your CFML page. Have you ever wished you could watch as your program
executes from line to line? That’s exactly what a step debugger does for you. You can set
breakpoints on any line of CFML code, and, in the case of the CF8 debugger, set it to stop on
a line of code in error. You can step into your include files, custom tags, functions and CFC
methods, watch the values of expressions and variables, and do much more.
Such tools are common in languages like Java, .NET, Javascript, Flex and Flash. CFML
developers who have not used those languages may not even have noticed that we’ve
lacked a debugger. ColdFusion 4 and 5 did have interactive debugging, by way of ColdFusion
Studio, now HomeSite+, but Macromedia/Adobe chose not to carry that feature forward
into ColdFusion MX. In 2006, Intergral GmbH introduced FusionDebug, a tool that brought
step debugging to ColdFusion MX. Now Adobe has included a debugger in ColdFusion 8
(which works in all editions of the product).
While FusionDebug is a commercial product and the ColdFusion 8 debugger (“the CF8
debugger” for the remainder of this article) is free, note that FusionDebug also works with
ColdFusion 6 and 7. The two tools are very similar, though, and I’ll discuss the differences at
the end of the article.
Both CFML debuggers allow you to trigger the debugging session not only in the
development environment, but also in any browser, or indeed from any kind of client that
can make requests to CFML pages — CFM or CFC files — on your server. Naturally, this
powerful feature may cause some concerns about security, which we’ll address later.
About the ColdFusion 8 Debugger
Like FusionDebug, the ColdFusion 8 debugger is an Eclipse plug-in, leveraging the
underlying debugging capabilities built into Eclipse. FlexBuilder is an Eclipse plug-in as well,
and also provides debugging which leverages the underlying Eclipse debugging features.
If you don’t use Eclipse currently, you may worry about having to switch editors. First, note
that you don’t need to give up your favorite CFML editor, DWMX, CF Studio, HomeSite+,
CFEclipse, or whatever. Further, you need to know only minimal Eclipse functionality—
87 Tools
The Fusion Authority Quarterly Update
which is very easy to learn—to use the CF8 Debugger. You can just use the Eclipse-based
debugger to do debugging and then go back to your favorite editor if you really prefer.
Why Use a Step Debugger?
What advantages does a debugger offer over CFOUTPUT and CFDUMP, and other
such techniques? Here are just a few ways in which interactive step debugging can
solve problems a CFML developer might otherwise find very difficult.
You can’t always use CFOUTPUT or CFDUMP
CFDUMP and CFOUTPUT create no output when OUTPUT=”no” has been set in
CFCOMPONENT or CFFUNCTION, or when CFSILENT has been used, which you may
find used in frameworks and complex applications. In both cases, you may try to
disable those features but that may introduce errors or unexpected results due to
other code that was relying on them, so that isn’t always an option. You could also
use CFTRACE or CFLOG to send output to a file, but this is nowhere near as simple as
viewing variables in the debugger.
Sometimes you are outputting to Flex, Ajax or Web Services — not a
browser.
You can’t always reasonably add debugging output to code that is called by a Flex or
Ajax client, or a web service. CFDUMP typically creates a big HTML table, an issue if
the client is expecting XML. The CFML debuggers, however, can debug CFML pages
requested from Flex, Flash, Flash Remoting, Ajax or web services clients. In fact, they
can intercept any kind of requests for a CFML page including scheduled tasks, event
gateways, the new CFTHREAD, or events in Application.cfc like onSessionEnd or
onApplicationEnd.
You can intercept and debug a request from any user — on remote
machines or in production!
The CFML debuggers can intercept and show the step-by-step execution of any CFML
page run by anyone in any manner. It’s not limited to requests you trigger yourself.
You can use it to debug someone else’s request. This allows debugging of strange
problems on production or test servers that you can’t recreate in development. A real
end user can run a request that’s causing a problem while you watch. Of course, this
capacity is a two-edged sword. You can’t currently limit debugging to be shown only
for requests from some given user, so it will impact anyone who makes the request
while you have debugging enabled. But the CF8 debugger only intercepts the first
request received. Another person can request the same page while the other is being
debugged and that request will not be debugged. The debugged user meanwhile
would see the page hang until the developer responded to let the page proceed.
There are performance and security impacts in enabling debugging, so you should
think carefully about leaving it enabled all the time in production.
There’s no need to change your code.
If you use CFOUTPUT and CFDUMP, you have to remember to remove those tags when
you are done debugging. How often do we see code still showing debug output?
88 Tools
The Fusion Authority Quarterly Update
There’s no need to have write access to the code.
What if you need to debug some code that is protected so that you can’t edit it
anyway? Debuggers don’t require you to have write access. When you’re in
production or on a server where you don’t have edit permissions, this can be a
valuable benefit.
You don’t need to enable ColdFusion’s debugging output.
Similarly, if you don’t have access to turn on ColdFusion 8’s debugging output, you
can still use the debugger.
CFDUMP will not always suffice to solve a problem.
When you are at a breakpoint, you can see the value of all variables in all scopes. The
CF8 debugger has a very easy-to-use tree view of the scopes. This includes query
results. And since you can see everything, you may be able to learn something about
the variables or make connections that you might not have thought of otherwise.
You can discover the flow of execution of the request.
Debuggers will display a clear visual representation of the flow of a request. You
can readily see whether the code went into a certain IF statement or loop, or if it
included a file or called a custom tag or method. This is also a great way to introduce
a new developer to your code or to CFML in general.
The debugger stops on error.
This capability in the CF8 debugger puts you in the editor at the line and page where
the error occurred. This especially helps if you have debugging output disabled or
restricted.
You can view the stack trace during execution.
Output from traditional ColdFusion debugging shows at the end of the page
request what files were called to run the entire request, but that doesn’t really help
you understand which were opened just to get to a particular line of code. In the
CFML debuggers, the stack trace pane displays all the files you opened to get to any
breakpoint.
Getting Started
You will need both:
 the Eclipse IDE (Integrated Development Environment), which is a free download from eclipse.org
 the ColdFusion 8 Eclipse Extensions, which are free from Adobe.com
Download and install the free Eclipse IDE, unless you already have it installed. You might
already have it if, for instance, you have FlexBuilder or CFEclipse. You can obtain it at
http://www.eclipse.org/. The CF8 debugger is supported on Eclipse version 3.1.2 or 3.2.
Installing Eclipse is beyond the scope of this article, but the good news is that it’s really just
a matter of saving the provided Eclipse directory onto your file system and running the
Eclipse executable (such as Eclipse.exe on Windows). The Eclipse site explains installation on
all supported operating systems.
Now download and install the ColdFusion 8 extensions for Eclipse, a zip file available at
http://www.adobe.com/support/coldfusion/downloads.html#cfdevtools. The process is very
The Fusion Authority Quarterly Update
Tools 89
easy, and you’ll find instructions on the installation in the ColdFusion 8 manual, Installing
and Using ColdFusion, in the chapter “Installing Integrated Technologies”, available online
at http://livedocs.adobe.com/coldfusion/8/htmldocs/othertechnologies_11.html.
The next step is to enable debugging in the ColdFusion Administrator (separate from
the traditional debugging), as well as to set the port on which the debugger will listen,
and also to enable ColdFusion RDS (Remote Development Services). See “Setting
up ColdFusion to Use the Debugger” in the chapter of the ColdFusion Developer’s
Guide entitled “Using the ColdFusion Debugger”. There you will also see discussion
of a minor difference in setup for ColdFusion’s multiple instance (Multiserver) or J2EE
configurations versus the standalone Server configuration. This chapter can be found at
http://livedocs.adobe.com/coldfusion/8/htmldocs/help.html?content=usingdebugger_1.html.
Finally, you’ll need to configure Eclipse itself in a couple of ways, which are also
discussed in that documentation chapter. This involves configuring a connection to
your server via RDS in the ColdFusion 8 Eclipse plugins interface, configuring mappings
if ColdFusion and Eclipse are not on the same machine, and switching to the Eclipse
Debug perspective. While FusionDebug does not rely on the ColdFusion RDS feature,
the CF8 debugger does. All these steps are described in the docs mentioned above, as
well as at the top of another page in that chapter, “Using the ColdFusion Debugger”, at
http://livedocs.adobe.com/coldfusion/8/htmldocs/usingdebugger_6.html.
Besides the Adobe documentation, there’s a very nice Adobe Dev Center article by Brian
Szoszorek, “Using the ColdFusion 8 Step-Through Debugger for Eclipse”, which walks carefully
through the configuration and setup of the Admin and the debugger, with ample screenshots.
It’s available online at http://www.adobe.com/devnet/coldfusion/articles/debugger.html.
I presume you’ll read those resources for setting up ColdFusion and the debugger, but I do
address some aspects of these configuration features later in the article.
First Stop: Setting a Breakpoint
Now that you’ve configured both the debugger and ColdFusion itself, and you’ve started
the debugger (as described in the docs mentioned above), open the file you wish to debug
in the Eclipse environment. You can begin by telling the tool that you want to stop execution
on a given line of CFML code. This is called setting a breakpoint. You just right-click on the
line of code in the Eclipse editor, and choose Toggle Breakpoint. Where in FusionDebug you
could right-click anywhere on the line, in the CF8 debugger, you must be sure to place the
mouse over the line number (if shown) or over the area just to the left of that (the grey area
on the left in Figure 1 below). You can also use the shortcut, Ctrl-Shift-B.
When the CFML template you’re working with is requested, and that line of code would be
executed, the program halts and the debugger interface reflects that execution has halted.
It will open the file if it’s not already open, and show the line of code on which execution
has stopped. (See Figure 1)
The blue dot to the left of the line shows where a breakpoint has been set, and the blue arrow
and shading on the line indicates that control has halted on that line. Those familiar with
FusionDebug will notice that this part of the interface is the same. In fact, both debuggers
are really leveraging underlying features of the Eclipse interface and its built-in debugging
functionality. Still, without the CF8 debugger or FusionDebug, it wouldn’t be possible to
debug CFML requests using Eclipse alone.
90 Tools
The Fusion Authority Quarterly Update
You may wonder what happens
when a user requests a page
that is being debugged. He’ll
generally see the page request
waiting in the browser, as if the
request is just taking a long
time.
Both CFML debuggers can
intercept a request from any
Figure 1: Simple sample code
user, not just the user who
initiated the debugging session. This is a two-edged sword:
 The good news is that you can use this feature to intercept a request other than one you yourself
initiated. How often have you tried to understand why a problem was happening to a user in
production or testing, but been unable to recreate it locally? Or, the debugger can intercept a
request made by something other than a browser, such as web services, Flex, Ajax, and more.
More on all that in the sidebar, “Why Use a Step Debugger?”
 Using this feature also means that anyone on that server being debugged will be affected
when you set a breakpoint. This certainly speaks to taking caution about setting breakpoints in
production. Still, it’s nifty that you can. But remember – with power comes responsibility.
Here’s another area where the CF8 debugger differs from FusionDebug. As I explained in my
FusionDebug article, FusionDebug intercepts all requests from all such users, which means
you may see several different requests piling up in the interface, ready for you to debug. The
CF8 debugger works differently; it stops only the first request it receives for a given page.
All other requests for that page are ignored by the debugger while the first request is being
debugged.
Observing Program State Information (Variables)
Being able to stop the program in its tracks may seem only mildly interesting, but the real
power lies in your ability to learn a lot about what was going on in the program while you
are stopped at a breakpoint in the debugger. For instance, you can see all the variables that
may have been set either in the program or perhaps in other templates before this one
executed.
The CF8 debugger (again, just like FusionDebug) provides a Variables view, which in the
case of the code as seen in Figure 1, would show the following:
You can see (in Figure 2) that a
structure with a key and an array
has been created. You can expand
the local Variables scope, and
any Application, Session, Server, or
other scopes. (You can configure
which scopes are viewable in
the Debug Settings preferences
page, as discussed in the Adobe
documentation mentioned above
and later in this article.) If you were
stopped within a method, you
could also see the local Var and This
scopes. Isn’t that a whole lot easier
The Fusion Authority Quarterly Update
Figure 2: Variables view
Tools 91
than putting in CFDUMPs or CFOUTPUTs, and having to remember to remove them? As I discuss
in the sidebar, there are also situations where you simply can’t use CFDUMP or CFOUTPUT.
If you had a large number of variables, exploring this Variables view would be tedious.
Another option is to set a number of watched expressions. This is more like using old-style
outputs, except they never send output to the browser; instead, the results are shown
inside the debugger. With this Expressions panel, you can choose to watch any variable or
expression. (An expression can be anything you might put on the right side of the “=” of a
CFSET, or in a CFIF condition, including variables, functions, and so on.) Here’s an example that
shows a few:
You can enter expressions
by
right-clicking
in
the Expressions View,
selecting Add Watch
Expression, and typing in
the expression manually.
Unlike
FusionDebug,
you cannot highlight an
expression in the code
Figure 3: Expressions view
editor, and right-click and
select Watch Expression. And though the CF8 debugger won’t show a Set Variable option
when you right-click such a variable within code, you can indeed right-click on a variable
in either the variables or expressions pages in order to set that variable on the fly to a new
value while debugging an application.
Stepping Through Lines of Code
While it is useful to stop at one point in the program and view all of the above, the ability
to step through your code is one of the debugger’s most important and fundamental
features.
Consider again the code in Figure 1, where we were stopped on line 4. How would we tell
the debugger to proceed? Notice the icons at the top of the Debug pane of the debugger
interface:
These icons tell the program
whether and how to continue
executing code. The Step
Over button selected in
Figure 4 is perhaps the most
commonly used, though the
one to the left of it is Step Into,
Figure 4: Debug pane
which is discussed later. When
you select Step Over, the debugger simply executes the next line of code (line 6 in Figure 1).
All the examples so far have talked about things you can do while stopped at a breakpoint.
These apply to code you’ve reached by stepping through code as well.
Understanding the Stack Trace
The Debug pane also presents a representation of the stack trace for a current request,
which is especially helpful when the line being executed is embedded deep within a multi-
92 Tools
The Fusion Authority Quarterly Update
file page request. For instance, consider the following code, which is an application built in
Fusebox 5:
Figure 5: Fusebox sample code
Let’s see how the debug view (stack trace) appears at this point in this sample application.
Figure 6: Debug (stack trace) view of Fusebox application
This reflects not only that we’re stopped on line 5 of dsp_productdetails.cfm, but also
that we got there from store.productdetails.cfm, which must have called or included dsp_
productdetails.cfm page on its own line 15, and so on. It’s great to be able to see, at any
point of execution in our request, how we got to where we are, based on which files were
called. Note that you can double-click on any of the lines shown in that stack trace to jump
to the indicated file and line of code.
Stepping into Other Files
Getting back to stepping through code, we can see in Figure 5 that the debugger is stopped
on line 5, which is about to call something called product.getDescription(). This looks like a
CFC (represented by product) calling a method called getDescription. But can the debugger
help us make sure that this is a CFC? Yes it can. Look at Figure 7, which shows that I’ve selected
Figure 7: Variables view showing CFC metadata
The Fusion Authority Quarterly Update
Tools 93
the path of the products variable in the Variables view, and I can see that it is indeed a CFC. If
I expand it, I can see various metadata, such as the actual file path where the CFC exists. This
can be powerful information when you’re trying to understand your location in a complex,
multi-file environment.
Since the next line of code is a call to a CFC method, we can follow the flow of execution into
that file. We can also do this with custom tags, included files, and so on. If we were to use
Step Into, the icon just to the left of Step Over, then the debugger would open product.cfc
(in the location indicated in Figure 7) and stop at the first line of CFML within that.
You could use the Step Return button to execute the current file without further stepping.
When you’ve stepped into a file, it will run the remainder of the file that was stepped into
(unless there were any remaining breakpoint in the file) and then stop before execution of
the next line of CFML code in the calling page. The Step Return button is enabled in Figure
6, and is to the right of Step Over and Step Into.
The left-most of those icons, which looks like a green arrow, is called Resume. It would let
the request run to completion unless it hit another breakpoint.
Stopping on an Error
It’s great to set a breakpoint and stop on a particular line of code, but sometimes you don’t
know exactly where you’re getting an error. Is it possible to get the debugger to stop when
an error is reached? Yes! Simply enable the option “Break on a CFML runtime exception”
in the Eclipse interface’s Window > Preferences > ColdFusion > Debug Settings. I’ve had
mixed success with this feature: sometimes it doesn’t stop when an error occurs. It could be
a problem of configuration on my system, so your mileage may vary.
And Still Much More…
There’s a lot more to show, but this should be enough to whet the whistle of those who
haven’t explored a debugger before.
Configuration and Security
A few configuration and security issues ought to at least be mentioned. Three configuration
pages in the Eclipse interface are devoted to the CF8 debugger or related features.
Window>Preferences, and from that dialogue, choose the ColdFusion section to find the
Debug Mappings, Debug Settings, and RDS Configuration pages.
Configuring RDS in both Eclipse and ColdFusion’s Admin
I mentioned that the CF8 debugger relies on ColdFusion’s RDS security. RDS (or Remote
Development Services) is the same feature used to control access to files, databases, and
CFCs on a ColdFusion server when they are accessed from editors like ColdFusion Studio,
HomeSite+, Dreamweaver, and Eclipse (with the Adobe Eclipse extensions).
ColdFusion must be configured to support RDS. Further, you need to understand the form
of RDS authentication enabled for your ColdFusion server, as you’ll need to provide that
information in the RD Configuration interface in Eclipse. The ColdFusion Administrator
page, Security > RDS > RDS Authentication, determines the RDS authentication to be used
for that server.
 If the “No authentication is needed” option is set, then no password is required. Of course this
configuration is dangerous if your server is accessible over any network, intranet or internet.
 If the option is set to “Use a single password only”, then you would provide in the Eclipse setting
whatever password is defined as the RDS Single Password option on the server.
94 Tools
The Fusion Authority Quarterly Update
 If “Separate user name and password authentication” is selected (an option available only on
the Enterprise and Developer editions), then both a username and password would be required
to access the server via RDS, where the usernames are defined in the Administrator page
Security > User Manager.
Discussion of the User Manager interface is beyond the scope of this article. By default there
are no configured user accounts. To enable user-based access you must first create user
accounts and passwords, and assign roles to those accounts. To use the debugger, such
a user would need the Allow RDS Access option enabled. He does not need to be given
any Admin access. You may notice an available sandbox role that you could allow called
Debugging and Logging > Debugging, but that’s for accessing the debugging page in the
Admin console.
If you’re having any problems getting the CF8 debugger to work, first confirm whether the
RDS setup on Eclipse is working for the connection to the server. Look at the tool in Window
>Show View > Other > ColdFusion and then use either the RDS Fileview or RDS Dataview
tools to confirm that you can connect to the server using one of them. If not, then you won’t
be able to do debugging.
In the CF8 debugger, it’s possible to enable multiple developers to debug a single server.
To do this, set the RDS configuration above, using multiple user accounts. Additionally, a
setting in the ColdFusion 8 Administrator, Debugging & Logging > Debugger Settings >
Maximum Simultaneous Debugging Sessions, which defaults to five, also controls how
many developers can do debugging at once or how many single developers can start
multiple debugging sessions.
Configuring the Multiserver or J2EE Configuration
There are a couple of final points to make regarding the use of ColdFusion in the Multiserver
(multiple instance) or J2EE configurations (as opposed to the perhaps more commonly used
Standalone configuration of ColdFusion).
With the Standalone edition, when you enable the debugger in the ColdFusion 8
Administrator, ColdFusion automatically modifies the jvm.config for the server. With the
Multiserver or J2EE configurations, ColdFusion requires that you make the change yourself,
adding the following string to the end of the java.args line:
-Xdebug -Xrunjdwp:transport=dt_socket,server=y,suspend=n,address=5005
Use whatever port you would have entered in the ColdFusion Admin page for enabling line
debugging. Whenever you have to modify your jvm.config, be sure to first make a backup of
the file, because if you make a mistake then the ColdFusion server won’t be able to start.
Second, in the Multiserver configuration, each instance (the ColdFusion instance, the admin
instance, and any new instances you create) will by default share a single jvm.config. That’s
acceptable in simple setups, but when using the debugger you may find that you need to
create a separate jvm.config for each instance. Some do that anyway, perhaps to create different
configurations (and therefore different jvm.config files) for each instance with different JVM
memory, or different garbage collection, or even different JVMs. You can find a couple of blog
entries discussing how to setup different jvm.config files for each instance, at:
http://mkruger.cfwebtools.com/index.cfm/2006/4/17/multiserver
http://www.alagad.com/go/blog-entry/cf7-cf8-jrun-and-the-jvm
The Fusion Authority Quarterly Update
Tools 95
Third, if you want to use the Sandbox security feature in the Multiserver or J2EE configuration,
you’ll need to enable a Java security manager (java.lang.SecurityManager), which is also
done by defining the JVM arguments in the jvm.config file. For JRun, this is the java.args line
in the jrun_root/jvm.config file:
-Djava.security.manager -Djava.security.policy=”cf_root/WEB-INF/cfusion/lib/coldfusion.
policy” -Djava.security.auth.policy=”cf_root/WEB-INF/cfusion/lib/neo_jaas.policy”
Differences Between the Debugger and FusionDebug
The focus in this article has been on the CF8 debugger, but along the way I’ve mentioned
a few ways in which the debugger is the same as or different from FusionDebug. Let’s do a
quick recap here. First, the CF8 debugger runs only on ColdFusion 8, where FusionDebug
works with ColdFusion 6, 7, and 8. On the other hand, you can use the CF8 debugger with
the free Developer edition of ColdFusion, but then you can’t use it for multiple developers
(or rather, you can’t use it for any more than ColdFusion will support for making requests
against the Developer edition, which is localhost plus two IP addresses.)
Some of the advantages of the CF8 debugger are related to use by multiple developers.
I’ve mentioned that the debugger does permit multiple developers to debug a single
ColdFusion server, and that it uses RDS to control such access. An administrator can control
debugger access using a single RDS password shared by all, or separate RDS accounts per
user in the Enterprise or Developer editions. For some, the fact that the debugger requires
RDS access may be a disadvantage. They’ve been conditioned to regard RDS as something
that should be disabled. Since the debugger is primarily a developer tool, though, as is RDS,
this shouldn’t be as much of a concern (though certainly for public production or central test
environments, it may be something to consider carefully due to the security implications of
enabling RDS on such public servers.)
Related to the multiple developer feature, the CF8 debugger only stops the first user making
a certain request, while FusionDebug lets you intercept all requests for a page, from all users.
That could be an advantage or a disadvantage. You may wish (with the CF8 debugger) that
you could see the requests of more than the first user hitting a page, or you may be annoyed
(by FusionDebug) that it lets you intercept the requests of any user hitting a page.
But the debugger adds something that FusionDebug lacks, which I haven’t mentioned
previously; the debugger adds another tab next to Variables and Breakpoints called Debug
Output Buffer, which shows the HTML or other content generated to that point in the flow
of execution. Very handy. Also, as I mentioned, the debugger lets you stop on an error.
Conclusion
That’s a lengthy review of features, benefits, and challenges in using the ColdFusion
8 debugger. I do hope that the introduction to step debugging and the debugger
interface and features will help you get started. For more on step debugging in CFML,
you may want to review the series of blog entries I’ve done previously on FusionDebug, at
http://carehart.org/blog/client/index.cfm/fusiondebug, or my previous article in Fusion
Authority Quarterly Update Volume 1 Issue 2.
You can also read more about the CF8 debugger in the CFML manual, ColdFusion Developer’s
Guide, in the chapter, “Using the ColdFusion Debugger”, as well as in the DevCenter article,
“Using the ColdFusion 8 step-through debugger for Eclipse”, both of whose URLs I offered
in the Getting Started section above.
96 Tools
The Fusion Authority Quarterly Update
A veteran ColdFusion developer since 1997, Charlie Arehart is a longtime contributor to
the community and a recognized Adobe Community Expert. He’s a certified Advanced
ColdFusion Developer and Instructor for ColdFusion 4/5/6/7 who served as tech editor of
the ColdFusion Developers until 2003. Now an independent contractor living in Alpharetta
GA, Charlie provides high-level troubleshooting/tuning assistance and training/mentoring
for ColdFusion teams (carehart.org/consulting). He helps run the Online ColdFusion Meetup
(coldfusionmeetup.com), an online ColdFusion user group), is a contributor to the ColdFusion
8 WACK books by Ben Forta, and is frequently invited to speak at developer conferences and
user groups worldwide.
Subscribe to Fusion Authority Quarterly Update!
Be in the know… For the low price of $49.95 a year (that’s 17% off
the regular rate of $14.95 an issue), you’ll get four issues packed with
the best ColdFusion content you can find. Our accurate, well-written
articles will make you a better ColdFusion professional.
PROFESSIONAL COLDFUSION CONTENT FOR THE COLDFUSION PROFESSIONAL
The
Qu
Quarterly Update
Vol. II Issu
Issue III
House of Fusion
3501 Avenue K
Brooklyn, NY 11210
VOL.II ISSUE III $14.95
4.95
8
n
n
o
o
i
i
us dit
F
ld al E
o
C ci
e
Sp
(For more information, see http://www.fusionauthority.com/quarterly)
The Fusion Authority Quarterly Update
Tools 97