1
dbx User’s Guide
Document Number 007-0906-090
CONTRIBUTORS
Written by Wendy Ferguson and Ken Jones
Edited by Christina Cary
Production by Gloria Ackley, Kay Maitz, and Lorrie Williams
Engineering contributions by Dave Anderson and Ray Milkey
Cover design and illustration by Rob Aguilar, Rikk Carey, Dean Hodgkinson,
Erik Lindholm, and Kay Maitz
© Copyright 1994, Silicon Graphics, Inc.— All Rights Reserved
This document contains proprietary and confidential information of Silicon
Graphics, Inc. The contents of this document may not be disclosed to third parties,
copied, or duplicated in any form, in whole or in part, without the prior written
permission of Silicon Graphics, Inc.
RESTRICTED RIGHTS LEGEND
Use, duplication, or disclosure of the technical data contained in this document by
the Government is subject to restrictions as set forth in subdivision (c) (1) (ii) of the
Rights in Technical Data and Computer Software clause at DFARS 52.227-7013 and/
or in similar or successor clauses in the FAR, or in the DOD or NASA FAR
Supplement. Unpublished rights reserved under the Copyright Laws of the United
States. Contractor/manufacturer is Silicon Graphics, Inc., 2011 N. Shoreline Blvd.,
Mountain View, CA 94043-1389.
Silicon Graphics and IRIS are registered trademarks and IRIX is a trademark of
Silicon Graphics, Inc.
dbx User’s Guide
Document Number 007-0906-090
Contents
List of Tables ix
About This Guide xi
What This Guide Contains xi
What You Should Know Before Reading This Guide
Suggestions for Further Reading xii
Conventions Used in This Guide xiii
1.
2.
xii
Getting Started With dbx 1
Examining Core Dumps to Determine Cause of Failure
Debugging Your Programs 2
Studying a New Program 3
Avoiding Common Pitfalls 4
1
Running dbx 5
Compiling a Program for Debugging Under dbx 5
Compiling and Linking Programs With Dynamic Shared Objects
Invoking dbx 6
dbx Options 7
Specifying Object and Core Files 8
The dbx Prompt 8
Specifying Files with dbx Commands 8
Running Your Program 9
Automatically Executing Commands on Startup 10
Using Online Help 11
Entering Multiple Commands on a Single Line 11
Spanning a Command Across Multiple Lines 11
Invoking a Shell 12
Quitting dbx 12
6
iii
Contents
iv
3.
Examining Source Files 13
Specifying Source Directories 13
Specifying Source Directories With Arguments 13
Specifying Source Directories With dbx Commands 14
Examples of dir and use 14
Using Path Remapping 15
Changing Source Files 15
Listing Source Code 16
Searching Through Source Code 17
Calling an Editor 18
4.
Controlling dbx 19
Creating and Removing dbx Variables 19
Setting dbx Variables 20
Listing dbx Variables 21
Removing Variables 21
Using the History Feature and the History Editor 21
Examining the History List 22
Repeating Commands 22
The History Editor 24
Creating and Removing dbx Aliases 24
Listing Aliases 25
Creating Command Aliases 25
Removing Command Aliases 27
Alias Example 27
Recording and Playing Back dbx Input and Output 28
Recording Input 29
Ending a Recording Session 29
Playing Back Input 30
Recording Output 30
Playing Back Output 31
Examining the Record State 31
Executing dbx Scripts 32
Contents
5.
Examining and Changing Data 33
Using Expressions 33
Operators 33
Constants 36
Numeric Constants 36
String Constants 37
Printing Expressions 37
Using Data Types and Type Coercion (Casts) 39
Displaying and Changing Program Variables 39
Qualifying Variable Names 39
Variable Scope 41
Displaying the Value of a Variable 41
Changing the Value of a Variable 43
Conflicts Between Variable Names and Keywords
Case Sensitivity in Variable Names 45
Determining the Scope of Variables 45
Displaying Type Declarations 45
Examining the Stack 46
Printing Stack Traces 47
Moving Within the Stack 49
Moving to a Specified Procedure 50
Printing Activation Level Information 52
Using Interactive Function Calls 53
Using ccall 53
Using clearcalls 54
Nesting Interactive Function Calls 55
C++ Considerations 56
Accessing C++ Member Variables 56
Referring to C++ Functions 57
44
v
Contents
vi
6.
Controlling Program Execution 59
Setting Breakpoints 59
Setting Unconditional Breakpoints 60
Setting Conditional Breakpoints 60
Stopping If a Variable or Memory Location Has Changed 61
Using Fast Watchpoints 62
Stopping If a Test Expression Is True 63
Conditional Breakpoints Combining Variable and Test Clauses 63
Continuing Execution After a Breakpoint 64
Tracing Program Execution 65
Writing Conditional Commands 68
Managing Breakpoints, Traces, and Conditional Commands 70
Listing Breakpoints, Traces, and Conditional Commands 71
Disabling Breakpoints, Traces, and Conditional Commands 71
Enabling Breakpoints, Traces, and Conditional Commands 72
Deleting Breakpoints, Traces, and Conditional Commands 73
Using Signal Processing 73
Catching and Ignoring Signals 73
Continuing After Catching a Signal 75
Stopping at System Calls 76
Stepping Through Your Program 78
Stepping Using the step Command 79
Stepping Using the next Command 79
Using the return Command 80
Starting at a Specified Line 80
7.
Debugging Machine Language Code 81
Examining and Changing Register Values 81
Printing Register Values 83
Changing Register Values 84
Examining Memory and Disassembling Code 85
Setting Machine-Level Breakpoints 88
Syntax of the stopi Command 88
Linking With DSOs 90
Contents
Continuing Execution After a Machine-Level Breakpoint 91
Tracing Execution at the Machine Level 92
Writing Conditional Commands at the Machine Level 93
Stepping Through Machine Code 94
8.
Multiple Process Debugging 97
Processes 97
Using the pid Clause 98
Using the pgrp Clause 98
Using Scripts 98
Listing Available Processes 99
Adding a Process to the Process Pool 100
Deleting a Process From the Process Pool 100
Selecting a Process 101
Suspending a Process 101
Resuming a Suspended Process 102
Waiting for a Resumed Process 103
Waiting for Any Running Process 103
Killing a Process 104
Handling fork System Calls 104
Handling exec System Calls 106
Handling sproc System Calls and Process Group Debugging
A.
dbx Commands 111
B.
Predefined Aliases 133
C.
Predefined dbx Variables
107
137
Index 145
vii
List of Tables
Table 2-1
Table 5-1
Table 5-2
Table 5-3
Table 5-4
Table 5-5
Table 6-1
Table 7-1
Table 7-2
Table 8-1
Table 8-2
Table B-1
Table C-1
dbx Command-Line Options 7
dbx Language Independent Operators 34
C Language Operators Recognized by dbx 35
Pascal Operators Recognized by dbx 35
Fortran 77 Operators Recognized by dbx 36
Variable Types 38
Effect of $stepintoall Variable on the step Command 79
Hardware Registers and Aliases 81
Memory Display Format Codes 86
How the $promptonfork Variable Affects dbx’s Treatment of
Forks 105
How the $mp_program Variable Affects dbx’s Treatment of
sprocs 107
Predefined Aliases 133
Predefined dbx Variables 137
ix
About This Guide
This guide explains how to use the source level debugger, dbx. You can use
dbx to debug programs in C, C++, Fortran77, and assembly language.
What This Guide Contains
This guide describes the features of dbx and provides simple examples of
how to use dbx to debug programs. Specifically, this guide includes:
Chapter 1, “Getting Started With dbx,” introduces some basic dbx
commands and offers some tips about how to approach a debugging session.
Chapter 2, “Running dbx,” explains how to run dbx and perform basic dbx
control functions.
Chapter 3, “Examining Source Files,” explains how to examine source files
under dbx.
Chapter 4, “Controlling dbx,” describes features of dbx that affect its
operation while debugging a program.
Chapter 5, “Examining and Changing Data,” describes how to examine and
change data in your program while running it under dbx.
Chapter 6, “Controlling Program Execution,” describes how to use the dbx
commands that control execution of your program.
Chapter 7, “Debugging Machine Language Code,” explains how to debug
machine language code.
Chapter 8, “Multiple Process Debugging,” explains multiprocess debugging
procedures.
xi
About This Guide
Appendix A, “dbx Commands,” lists and describes all dbx commands.
Appendix B, “Predefined Aliases,” lists and describes all predefined dbx
aliases.
Appendix C, “Predefined dbx Variables,” lists and describes all predefined
dbx variables.
What You Should Know Before Reading This Guide
This manual is written for programmers, and assumes that you are familiar
with general debugging techniques.
Suggestions for Further Reading
This dbx User’s Guide is part of the IRIS Developer Option (IDO), which
provides you with the software and documentation that you need to write
applications for Silicon Graphics platforms. A few IDO online and printed
manuals that may be of interest to you are listed below.
Programming on Silicon Graphics Systems: An Overview provides information
about the IRIX programming environment and tools available for
application programming. Topics covered include IRIX operating system,
compilers, user interface and developer tools, and application libraries.
Compiling and Performance Tuning Guide describes the compiler system and
programming tools and interfaces, and explains how to improve program
performance.
Topics in IRIX Programming presents information about internationalizing an
application, working with fonts, file and record locking, and inter-process
communication.
C Language Reference Manual covers the syntax and semantics of the C
programming language as implemented on the IRIX operating system.
xii
Conventions Used in This Guide
Silicon Graphics offers software options to assist in software development.
The CASEVision/Workshop option provides the WorkShop toolset: Debugger,
Static Analyzer, Performance Analyzer, Tester, and Build Manager.
You can order a printed manual from Silicon Graphics by calling SGI Direct
at 1-800-800-SGI1 (800-7441). Outside the U.S. and Canada, contact your
local sales office or distributor.
Silicon Graphics also provides manuals online. To read an online manual
after installing it, type insight or double-click the InSight icon. It’s easy to
print sections and chapters of the online manuals from InSight.
Conventions Used in This Guide
The conventions used in this manual help make information easy to access
and understand. The following list describes the conventions and how they
are used:
•
Command names, including dbx commands, appear in italics. For
example:
The edit command lets you edit files from within dbx.
•
Examples, shell prompts, and information displayed on the screen
appear in a typewriter font. For example:
Process 946: [6] trace count in main
•
Examples of what you enter are in boldface typewriter font. This
example illustrates entering edit soar.c in response to a (dbx)
prompt:
(dbx) edit soar.c
•
Command arguments you replace with actual values appear in italics.
In this example, you replace name with the name of an alias:
alias name
•
Optional arguments are enclosed in square brackets ([ ... ]). In the
following example, you can provide one or more directory names as
arguments to the command:
use [ dir ... ]
xiii
About This Guide
•
Mutually exclusive arguments to a command are enclosed in braces
({ ... }) and separated by a pipe character (|). In the first example below,
you can provide either an activation level or a procedure name as an
argument to the command. In the second example, because the
argument choices are enclosed in square brackets, you can use either
the call or return argument, or omit an argument to the command:
func { activation_level | procedure }
syscall catch [{ call | return }]
•
File and directory names appear in italics. For example:
You can put any dbx command in the .dbxinit file.
•
New terms appear in italics. For example:
Each procedure on the stack defines an activation level.
xiv
Chapter 1
1.
Getting Started With dbx
You can use dbx to trace problems in a program at the source code level,
rather than at the machine code level. dbx enables you to control a program’s
execution, symbolically monitoring program control flow, variables, and
memory locations. You can also use dbx to trace the logic and flow of control
to acquaint yourself with a program written by someone else.
This chapter introduces some basic dbx commands and discusses some tips
about how to approach a debugging session. Specifically, this chapter covers:
•
“Examining Core Dumps to Determine Cause of Failure”
•
“Debugging Your Programs”
•
“Studying a New Program”
•
“Avoiding Common Pitfalls”
Examining Core Dumps to Determine Cause of Failure
Even if your program compiles successfully, it still can crash when you try
to run it. When a program crashes, it generates a terminating signal that
instructs the system to write out to a core file. The core file is the memory
image of the program at the time it crashed.
You can examine the core file with dbx to determine at what point your
program crashed. To determine the point of failure, follow these steps:
1.
If the core file is not in the current directory, specify the pathname of the
core file on the dbx command line.
Note: If the source code for the program is on a different machine or the
source was moved, provide dbx with the pathname to search for source
code (also see “Specifying Source Directories” on page 13).
1
Chapter 1: Getting Started With dbx
2.
Invoke dbx for the failed program as described in “Invoking dbx” on
page 6. dbx automatically reads in the local core file.
3.
Perform a stack trace using the where command (described in
“Examining the Stack” on page 46) to locate the failure point.
For example, suppose you examine the core file for a program called test.
Suppose the stack trace appears as follows:
(dbx) where
> 0
1
2
3
foo2(i = 5) [“/usr/tmp/test.c”:44, 0x1000109c]
foo(i = 4) [“/usr/tmp/test.c”:38, 0x1000105c]
main(argc = 1, argv = 0xffffffad78) [“/usr/tmp/test.c”:55, 0x10001104]
__start() [“/shamu/crt1text.s”:137, 0x10000ee4]
In this case, test crashed at line 44 of the source file test.c. The program
crashed while executing the function foo2. foo2 was called from line 38 in
the function foo, which was in turn called from line 55 in the function main.
You can use the other features of dbx to examine values of program variables
and otherwise investigate why test crashed.
If you use dbx to debug code that wasn’t compiled using the –g option, local
variables are invisible to dbx, and source lines may appear to jump around
as a result of various optimizations. If the code is stripped of its debugging
information, dbx displays very little information.
Debugging Your Programs
Debugging a program consists primarily of stopping your program under
certain conditions and then examining the state of the program stack and the
values stored in program variables.
You stop execution of your program by setting breakpoints in your program.
Breakpoints can be unconditional, in which case they always stop your
program when encountered, or conditional, in which case they stop your
program only if a test condition that you specify is true. (See “Setting
Breakpoints” on page 59 for more information.)
To use breakpoints to debug your program, examine your program carefully
to determine where problems are likely to occur, and set breakpoints in these
2
Studying a New Program
problem areas. If your program crashes, first determine which line causes it
to crash, then set a breakpoint just before that line.
You can use several dbx commands to trace a variable’s value. Here’s a
simple method for tracing a program variable:
1.
Use the stop command (see “Setting Breakpoints” on page 59) to set
breakpoints in the program at locations where you want to examine the
state of the program stack or the values stored in program variables.
2.
Use the run or rerun command (described in “Running Your Program”
on page 9) to run your program under dbx. The program stops at the
first breakpoint that it encounters during execution.
3.
Examine the program variable as described in “Displaying the Value of
a Variable” on page 41. Examine the program stack as described in
“Examining the Stack” on page 46.
4.
Use the cont command (see “Continuing Execution After a Breakpoint”
on page 64) to continue execution past a breakpoint. However, you
cannot continue execution past a line that crashes the program.
Studying a New Program
Use dbx to examine the flow of control in a program. When studying the flow
of control within a program, use the dbx commands stop, run/rerun, print,
next, step, and cont. To study a new program:
1.
Use the stop command to set breakpoints in the program. When you
execute the program under dbx, it stops execution at the breakpoints.
If you want to review every line in the program, set a breakpoint on the
first executable line. If you don’t want to look at each line, set
breakpoints just before the sections you intend to review.
2.
Use the run and rerun commands to run the program under dbx. The
program stops at the first breakpoint.
3.
Use the print command to print the value of a program variable at a
breakpoint.
4.
Use the step, next, or cont command to continue past a breakpoint and
execute the rest of the program.
3
Chapter 1: Getting Started With dbx
•
step executes the next line of the program. If the next line is a
procedure call, step steps down into the procedure. step is described
in “Stepping Using the step Command” on page 79.
•
next executes the next line; if it is a procedure, next executes it but
does not step down into it. next is described in “Stepping Using the
next Command” on page 79.
•
cont resumes execution of the program past a breakpoint and does
not stop until it reaches the next breakpoint or the end of the
program. cont is explained in “Continuing Execution After a
Breakpoint” on page 64.
Another tool that you can use to follow the execution of your program is the
trace command (described in “Tracing Program Execution” on page 65).
With it you can examine:
•
values of variables at specific points in your program or whenever
variables change value
•
parameters passed to and values returned from functions
•
line numbers as they are executed
Avoiding Common Pitfalls
You may encounter some problems when you debug a program. Common
problems and their solutions are listed below.
4
•
If dbx does not display variables, recompile the program with the –g
compiler option. Note that in some cases, this may cause the problem to
go away, or its symptoms to change.
•
If the debugger’s listing seems confused, try separating the lines of
source code into logical units. The debugger may get confused if more
than one source statement occurs on the same line.
•
If the debugger’s executable version of the code doesn’t match the
source, recompile the source code. The code displayed in the debugger
is identical to the executable version of the code.
•
If code appears to be missing, it may be contained in an include file or a
macro. The debugger treats macros as single lines. To debug a macro,
expand the macro in the source code.
Chapter 2
2.
Running dbx
This chapter explains how to run dbx—specifically, it covers:
•
“Compiling a Program for Debugging Under dbx”
•
“Compiling and Linking Programs With Dynamic Shared Objects”
•
“Invoking dbx” from a shell
•
“Running Your Program”
•
“Automatically Executing Commands on Startup”
•
“Using Online Help”
•
“Entering Multiple Commands on a Single Line”
•
“Spanning a Command Across Multiple Lines”
•
“Invoking a Shell” from dbx
•
“Quitting dbx”
Compiling a Program for Debugging Under dbx
Before using dbx to debug a program, compile the program using the –g
option (for example, cc –g). The –g option includes additional debugging
information in your program object so that dbx can list local variables and
find source lines.
If you use dbx to debug code that was not compiled using the –g option, local
variables are invisible to dbx, and source lines may appear to jump around
oddly as a result of various optimizations. It is more difficult to debug code
without reliable references to lines of source code.
5
Chapter 2: Running dbx
Compiling and Linking Programs With Dynamic Shared Objects
This section summarizes a few things you need to know if you compile and
link your program with Dynamic Shared Objects (DSOs). A DSO is a
relocatable shared library. By linking with a DSO, you keep your program
size small and use memory efficiently.
If you compile and link with DSOs, dbx automatically notices their use in the
program and picks up the relevant debugging information. The dbx
command listobj shows any DSOs in a process. The dbx command whichobj
lists all DSOs in which the named variable is present.
See “Running Your Program” on page 9 for more description of the
differences between programs compiled and linked with DSOs and
programs compiled and linked with non-shared libraries. See also the dbx
help section on hint_dso for more information on dbx and DSOs. For more
information on DSOs, see “Using Dynamic Shared Objects” in the Compiling
and Performance Tuning Guide.
Invoking dbx
This section describes how to invoke dbx and includes:
•
“dbx Options”
•
“Specifying Object and Core Files”
•
“The dbx Prompt”
•
“Specifying Files with dbx Commands”
To invoke dbx from the shell command line, type dbx. The syntax is:
dbx [options] [object_file [corefile]]
6
Invoking dbx
dbx Options
Table 2-1 lists options you can give to dbx. These options are described in
detail later in this chapter.
Table 2-1
dbx Command-Line Options
Option
Description
–I dir
Tells dbx to look in the specified directory (in addition to the
current directory and the object file’s directory) for source
files. To specify multiple directories, use a separate –I for
each. If no directory is specified when you invoke dbx, it
looks for source files in the current directory and in the
object file’s directory. From dbx, changes the directories
searched for source files with the use and dir commands.
–c file
Selects a command file other than .dbxinit to execute on
starting dbx. For information on .dbxinit, see “Automatically
Executing Commands on Startup.”
–e num
Chooses a large size for the evaluation stack (as large as you
want). The default stack size is 20,000 bytes. num = number
of bytes. If you see the message too large to evaluate,
rerun dbx suppling a value greater than 20,000.
–k
Turns on kernel debugging. When debugging a running
system, specify /dev/kmem as the core file.
–i
Uses interactive mode. This option prompts for source even
when it reads from a file and treats data in a file as if it comes
from a terminal (stdin). This option does not treat “#”
characters as comments in a file.
–p pid
Debugs the process specified by the pid number.
–P name
Debugs the running process with the specified name (name as
described in the ps(1) reference page).
–r program [arg]
Runs the named program upon entering dbx, using the
specified arguments. The .dbxinit file (if any) is read and
executed after executing the object_file. You cannot specify a
core file with –r.
7
Chapter 2: Running dbx
Specifying Object and Core Files
The object_file is the name of the executable object file that you want to
debug. It provides both the code that dbx executes and the symbol table that
provides variable and procedure names and maps executable code to its
corresponding source code in source files.
A corefile is produced when a program exits abnormally and produces a core
dump. dbx allows you to provide the name of a core file that it uses as “the
contents of memory” for the program that you specify. If you provide a core
file, dbx lists the point of program failure. You can then perform stack traces
and examine variable values to determine why a program crashed.
However, you cannot force the program to execute past the line that caused
it to crash.
If you don’t specify a corefile, dbx examines the current directory for a file
named core. If it finds core, and if core seems (based on data in the core file) to
be a core dump of the program you specified, dbx acts as if you had specified
core as the core file.
You can specify object and core files either as arguments when you invoke
dbx or as commands that you enter at the dbx prompt.
The dbx Prompt
Once dbx starts, it displays the prompt:
(dbx)
To change this prompt, change the value of the dbx $prompt variable. “Setting
dbx Variables” on page 20 describes how to set dbx variables.
Specifying Files with dbx Commands
The givenfile and corefile dbx commands allow you to set the object file and the
core file, respectively, while dbx is running.
8
Running Your Program
givenfile [file]
If you provide a filename, dbx kills the currently running
processes and loads the executable code and debugging
information found in file.
If you do not provide a filename, dbx displays the name of
the program that it is currently debugging without
changing it.
corefile [file]
If you provide a filename, dbx uses the program data stored
in the core dump file.
If you do not provide a filename, dbx displays the name of
the current core file without changing it.
Running Your Program
You can start your program under dbx using the run or rerun command.
run run-arguments
The run command starts your program and passes to it any
arguments that you provide. The run command uses your
shell (the program named in the SHELL environment
variable or /bin/sh if an environment variable does not exist)
to process a run command. The shell syntax allowed in your
shell is allowed on the run command line. All shell
processing is accepted, such as expansion and substitution
of * and ? in filenames. Redirection of the program’s
standard input and standard output, and/or standard error
is also done by the shell. In other words, the run command
does exactly what typing target run-arguments at the
shell prompt does. You can specify target either on dbx
invocation or in a prior givenfile command. dbx passes
./target as argv[0] to target when you specify it as a relative
pathname.
A run command must appear on a line by itself and cannot
be followed by another dbx command separated by a semicolon (;). Terminate the command line with a return (newline). Note that you cannot include a run command in the
command list of a when command.
9
Chapter 2: Running dbx
rerun [run-arguments]
The rerun command, without any arguments, repeats the
last run command if applicable. Otherwise rerun is
equivalent to the run command without any arguments.
The sort command takes an input file and produces a sorted output file; you
can specify input and output files either through command-line arguments
or file redirection.
For example, from the command line you can enter:
% sort -i input -o output
% sort < input2 > output2
If you are debugging the sort program, the equivalent dbx commands are:
(dbx) run -i input -o output
(dbx) run < input2 > output2
If you execute these run commands in the order presented, you can repeat
the last run command by using the rerun command:
(dbx) rerun
Automatically Executing Commands on Startup
You can use an editor to create a .dbxinit command file. This file contains
various dbx commands that automatically execute when you invoke dbx. You
can put any dbx command in the .dbxinit file. If a command requires input,
the system prompts you for it when you invoke dbx.
On invocation, dbx looks for a .dbxinit file in the current directory. If the
current directory does not contain a .dbxinit file, dbx looks for one in your
home directory. (This assumes that you have set the IRIX system HOME
environment variable.)
10
Using Online Help
Using Online Help
The dbx command help has several options:
help
shows the supported dbx commands
help keyword
shows information pertaining to the given keyword, such as
alias, help, most_used, quit, playback, record, and so on
help all
shows the entire dbx help file
When you type help all, dbx displays the file using the command name
given by the dbx $pager variable. The dbx help file is large and can be difficult
to read even if you use a simple paging program like more(1). You can set the
$pager variable to a text editor like vi(1) or to your favorite editor.
For example, just add the following command in your .dbxinit file:
set $pager = vi
When the above entry is in your .dbxinit file, dbx displays the help file in vi.
You can then use the editor’s search commands to look through the help file
quickly. Quit the editor to return to dbx.
Entering Multiple Commands on a Single Line
You can use a semicolon (;) as a separator to include multiple commands on
the same command line. This is useful with commands such as when
(described in “Writing Conditional Commands” on page 68) as it allows you
to include multiple commands in the command block. For example:
(dbx) when at “myfile.c”:37 {print a ; where ; print b}
Spanning a Command Across Multiple Lines
You can use a backslash (\) at the end of a line of input to indicate that the
command is continued on the next line. This can be convenient when
entering complex commands such as an alias definition (aliases are
discussed in “Creating and Removing dbx Aliases” on page 24).
11
Chapter 2: Running dbx
For example:
(dbx) alias foll "print *(struct list *)$p ; \
set $p = (int)((struct list *)($p))->next"
Hint: You can also use the hed command for creating and modifying
commands. “The History Editor” on page 24 has details on this command.
Invoking a Shell
To invoke a subshell, enter sh at the dbx prompt, or enter sh and a shell
command at the dbx prompt. After invoking a subshell, type exit or <Ctrld> to return to dbx.
The syntax for the sh command is:
sh
Invoke a subshell.
sh command
Execute the specified shell command. dbx interprets the rest
of the line as a command to pass to the spawned shell
process, unless you enclose the command in double-quotes
or you terminate your shell command with a semicolon (;).
For example, to spawn a subshell, enter:
(dbx) sh
%
To display the end of the file datafile, enter:
(dbx) sh tail datafile
Quitting dbx
To end a dbx debugging session, enter the quit command at the dbx prompt:
(dbx) quit
12
Chapter 3
3.
Examining Source Files
This chapter explains how to examine source files under dbx. It describes:
•
“Specifying Source Directories”
•
“Changing Source Files”
•
“Listing Source Code”
•
“Searching Through Source Code”
•
“Calling an Editor”
Specifying Source Directories
Based on the information contained in an object file’s symbol table, dbx
determines from which source files the program was compiled and prints
portions of these files as appropriate.
Object files compiled with –g record the absolute path names to the source
files. Each time dbx needs a source file, it first searches the absolute path for
the source file. If the source file is not present (or if the object file was not
compiled with –g), dbx checks its own list of directories for source files.
By default, the dbx directory list contains only the current directory (from
which you invoked dbx) and the object file’s directory (if it is different from
the current directory). Each time dbx searches this list, it searches all
directories in the list in the order in which they appear until it finds the file
with the specified name.
Specifying Source Directories With Arguments
You can specify additional source directories when you invoke dbx with the
–I option. To specify multiple directories, use a separate –I for each.
13
Chapter 3: Examining Source Files
For example, consider debugging a program called look in /usr/local/bin, the
source for which resides in /usr/local/src/look.c. To debug this program, you
can invoke dbx from the /usr/local/bin directory by entering:
% dbx -I /usr/local/src look
Specifying Source Directories With dbx Commands
The dir and use commands allow you to specify a source directory list while
dbx is running.
dir [dir ...]
If you provide one or more directories, dbx adds those
directories to the end of the source directory list.
If you do not provide any directories, dbx displays the
current source directory list.
use [dir ...]
If you provide one or more directories, dbx replaces the
source directory list with the directories that you provide.
If you do not provide any options, dbx displays the current
source directory list.
Note: Both the dir and use commands recognize absolute and relative
pathnames (for example, ../src); however, they do not recognize C shell tilde
(~) syntax (for example, ~kim/src) or environment variables (for example,
$HOME/src).
Examples of dir and use
Let’s debug the look program in /usr/local/bin. Recall that the source resides
in /usr/local/src/look.c. If you invoke dbx from the /usr/local/bin directory
without specifying /usr/local/src as a source directory, it will not initially
appear in the directory list:
(dbx) dir
.
However, you can add /usr/local/src with the dir command by entering:
(dbx) dir /usr/local/src
(dbx) dir
. /usr/local/src
14
Changing Source Files
If you use the use command instead, the current directory is no longer
contained in the source directory list:
(dbx) use /usr/local/src
(dbx) use
/usr/local/src
Using Path Remapping
Files compiled with –g have full pathnames to source files. If you’re
debugging a program that was compiled somewhere else and you want to
specify a new path to the sources, use path remapping. Just substitute one
pattern for another pattern to remap the path so dbx can find the source file.
dir pattern1:pattern2
The dir (or use) command allows you to remap directories
and specify a new path to the source. dbx substitutes
pattern2 for pattern1.
For example, a compiled program’s source is /x/y/z/kk.c. The source was
moved to /x/y/zzz/kk/kk.c. Specify the dir (or use) command to remap the path:
(dbx) dir /z/:/zzz/kk/
The new path is /x/y/zzz/kk/kk.c where /z/ is replaced by the path specified
after the colon.
Changing Source Files
The file command changes the current source file to a file that you specify.
The new file becomes the current source file, on which you can search, list,
and perform other operations. For example, to set the current source file to
“Examining the Stack” on page 54procedure.c, enter:
(dbx) file procedure.c
Note: If your program is large, typically you store the source code in
multiple files. dbx automatically selects the proper source file for the section
of code that you are examining. Thus, many dbx commands reset the current
source file as a side effect. For example, when you move up and down
activation levels in the stack using the up and down commands, dbx changes
15
Chapter 3: Examining Source Files
the current source file to whatever file contains the source for the procedure
(see “Examining the Stack” on page 46 for more information on activation
levels).
If you enter the file command without any arguments, dbx prints the current
source file:
(dbx) file
procedure.c
You can also change the current source file by typing:
(dbx) func procedure
You can use the tag command to search the tag file for procedure:
(dbx) tag procedure
The tag command finds C preprocessor macros if they have arguments
(func procedure cannot). For more information about the tag file, see ctags(1).
Listing Source Code
The list command displays lines of source code. The dbx variable $listwindow
defines the number of lines dbx lists by default. The list command uses the
active frame and line of the current source file unless overridden by a file
command. Any execution of the program overrides the file command by
establishing a new current source file.
The syntax for the list command is:
list
Lists $listwindow lines beginning at the current line (or list
the line of the current pc if the current line is unknown or
not set).
list exp
Lists $listwindow lines starting with the line number given
by the expression exp. The expression can be any valid
expression that evaluates to an integer value as described in
“Using Expressions” on page 33.
list exp1:exp2 Lists exp2 lines, beginning at line exp1.
list exp1,exp2 Lists all source between line exp1 and line exp2 inclusive.
16
Searching Through Source Code
list func
Lists $listwindow lines starting at procedure func.
list func,exp
Lists all source between func and exp, inclusive.
list func:exp
Lists exp lines, beginning at func.
A > symbol prints to the left of the line that is the current line. A * symbol
prints to the left of the line of the current pc location.
For example, to list lines 20–35 of a file, enter:
(dbx) list 20,35
In response to this command, dbx displays lines 20 through 35 and sets the
current line to 36.
To list 15 lines starting with line 75, enter:
(dbx) list 75:15
In response to this command, dbx displays lines 75 through 89 and sets the
current line to 90.
Searching Through Source Code
Use the forward slash (/) and question mark (?) commands to search through
the current file for regular expressions in source code. For a description of
regular expressions, see the ed(1) reference page.
The search commands have the following syntax:
/[reg_exp]
Search forward through the current file from the current line
for the regular expression reg_exp. If dbx reaches the end of
the file without finding the regular expression, it wraps
around to the beginning of the file. dbx prints the first source
line containing a match of the search expression.
If you don’t supply a regular expression, dbx searches
forward based on the last regular expression searched.
17
Chapter 3: Examining Source Files
?[reg_exp]
Search backward through the current file from the current
line for the regular expression reg_exp. If dbx reaches the
beginning of the file without finding the regular expression,
it wraps around to the end of the file. dbx prints the first
source line containing a match of the search expression.
If you don’t supply a regular expression, dbx searches
backward based on the last regular expression searched.
For example, to search forward for the next occurrence of the string “errno,”
enter:
(dbx) /errno
To search backward for the previous occurrence of either “img” or “Img,”
enter:
(dbx) ?[iI]mg
Calling an Editor
The edit command lets you edit files from within dbx:
edit
The edit command invokes an editor (vi by default) on the
current source file. If you set the dbx variable $editor to the
name of an editor, the edit command invokes that editor. If
you do not set the $editor, dbx checks the environment
variable EDITOR and, if set, invokes that editor. When you
exit the editor, you return to the dbx prompt.
edit file
The edit command invokes the editor on the given file.
edit procedure The edit command invokes the editor on the file that
contains the source for the given procedure.
For example, to edit a file named soar.c from within dbx, type:
(dbx) edit soar.c
The edit command is also useful for editing dbx script files. See “Executing
dbx Scripts” on page 32 for more information on script files.
18
Chapter 4
4.
Controlling dbx
This chapter describes features of dbx that affect its operation while
debugging a program. Specifically, this chapter covers:
•
“Creating and Removing dbx Variables”
•
“Using the History Feature and the History Editor”
•
“Creating and Removing dbx Aliases”
•
“Recording and Playing Back dbx Input and Output”
•
“Executing dbx Scripts”
Creating and Removing dbx Variables
dbx allows you to define variables that you can use within dbx to store values.
These variables exist entirely in dbx; they are not part of your program. You
can use dbx variables for a variety of purposes while debugging. For
example, you can use dbx variables as temporary storage, counters, or
pointers that you use to step through arrays.
dbx also provides many predefined variables that control how various dbx
commands function. Appendix C, “Predefined dbx Variables” provides a
complete list of predefined dbx variables and their purposes.
A dbx variable does not have a fixed type. You can assign a dbx variable any
type of value, even if it already has a value of a different type. However, a
variable predefined by dbx does have a fixed predefined type.
You can use almost any name for dbx variables. A good practice to follow is
to use a dollar sign ($) as the first character of all dbx variables to prevent
conflicts with most program variable names. All of dbx’s predefined
variables begin with a dollar sign.
19
Chapter 4: Controlling dbx
The commands described in this section apply only to the manipulations of
dbx variables, not program variables. “Displaying and Changing Program
Variables” on page 39 describes how to manipulate program variables.
Setting dbx Variables
The set command sets a dbx variable to a given value, defining the variable if
it does not exist:
set var = exp
Define (or redefine) the specified dbx variable, setting its
value to that of the expression you provide.
You can display the value of a variable with the print command. For
example:
(dbx)
(dbx)
1
(dbx)
(dbx)
24
(dbx)
2
set $k = 1
print $k
set $k = $k +23
print $k
print $k / 11
In the above example, dbx performs an integer division because both the
variable $k and the constant 11 are integers. If you assign a floating point
value to $k and evaluate the expression again, dbx performs a floating point
division:
(dbx) set $k = 24.0
(dbx) print $k
24.0
(dbx) print $k / 11
2.1818181818181817
Note: We recommend that you begin a dbx variable with a $ to avoid
confusion with a program variable. A dbx variable without a leading $ hides
any program variable that has the same name. The only way to see the
program variable is to remove the dbx variable with an unset command.
20
Using the History Feature and the History Editor
Listing dbx Variables
If you enter the set command without providing any arguments, dbx
displays (in alphabetical order) a list of all currently defined dbx variables,
including predefined variables. Partial output looks like this:
(dbx) set
$addrfmt
“0x%x”
$addrfmt64
“0x%llx”
$assignverify
1
$casesense
2
$ctypenames
1
$curevent
3
$curline
44
$curpc
268439708
...
$stacktracelimit
1024
$stdc
0
$stepintoall
0
$tagfile
“tags”
Removing Variables
The unset command removes a dbx variable. For example, to delete the
variable $k, enter:
(dbx) unset $k
Using the History Feature and the History Editor
The dbx history feature is similar to the C shell’s history feature in that it
allows you to repeat commands that you have entered previously. However,
unlike the C shell’s history feature, dbx does not allow you to execute a
history command anywhere except the beginning of a line. Also, dbx does
not support history substitution of command arguments such as the C shell
!$ argument.
21
Chapter 4: Controlling dbx
Examining the History List
dbx stores all commands that you enter in the history list. The value of the
dbx variable $lines determines how many commands are stored in the history
list. The default value is 100.
Display the history list with the history command. For example, after setting
a breakpoint, running a program, and examining some variables, your
history list might look something like this:
(dbx) history
1
2
3
4
5
set $prompt = “(dbx)”
set $page=0
set $pimode=1
stop in main
history
Repeating Commands
You can execute any of the commands contained in the history list. Each
history command begins with an exclamation point (!):
!!
Repeats the previous command. If the value of the dbx
variable $repeatmode is set to 1, then entering a carriage
return at an empty line is equivalent to executing !!. By
default, $repeatmode is set to 0.
!string
Repeats the most recent command that starts with the
specified string.
!integer
Repeats the command associated with the specified integer
in the history list.
!-integer
Repeats the command that occurred integer times before the
most recent command. Entering !-1 executes the previous
command, !-2 the command before that, and so forth.
You can use the !! command to facilitate single-stepping through your
program. (Single-stepping is described in “Stepping Through Your
Program” on page 78.) The following illustrates using the next command to
execute 5 lines of source code and then using the !! command to repeat the
next command.
22
Using the History Feature and the History Editor
For example:
(dbx) next 5
Process 22545 (test) stopped at [main:60 ,0x10001150]
60 total += j;
(dbx) !!
(!! = next 5)
Process 22545 (test) stopped at [main:65 ,0x100011a0]
65 printf(“i = %d, j = %d, total = %d\n”,i,j,total);
Another convenient way to repeat a commonly used command is with
!string. For example, suppose that you occasionally print the values of
certain variables using the printf command while running your program
under dbx. (The printf command is described in “Printing Expressions” on
page 37.) In this case, as long as you do not enter any command beginning
with “pr” after you enter the printf command, you can repeat the printf
command by entering !pr. For example:
(dbx) printf "i = %d, j = %d, total = %d\n", i, j, total
i = 4, j = 25, total = 1
...
(dbx) !pr
i = 12, j = 272, total = 529
Using !integer, you can repeat any command in the history list. If you want
to repeat the printf command, but you have entered a subsequent print
command, examine the history list and then explicitly repeat the printf
command using its reference number. For example:
(dbx) history
1
set $prompt = “(dbx)”
2
set $page=0
...
45
printf "i = %d, j = %d, total = %d\n", i, j, total
46
next
...
49
print j
...
53
history
(dbx) !45
(!45 = printf "i = %d, j = %d, total = %d\n", i, j, total)
i = 9, j = 43, total = 1084
23
Chapter 4: Controlling dbx
The History Editor
The history editor, hed, lets you use your favorite editor on any or all of the
commands in the current dbx history list. When you enter the hed command,
dbx copies all or part of the history list into a temporary file that you can edit.
When you quit the editor, any commands left in this temporary file are
automatically executed by dbx.
If you have set the dbx variable $editor to the name of an editor, the hed
command invokes that editor. If you have not set the dbx variable $editor, dbx
checks whether you have set the environment variable EDITOR and, if so,
invokes that editor. If you have not set either the dbx variable or the
environment variable, dbx invokes the vi editor.
The syntax for the hed commands is:
hed
Edits only the last line of the history list (the last command
executed).
hed num1
Edits line num1 in the history list.
hed num1,num2
Edits the lines in the history list from num1 through num2.
hed all
Edits the entire history list.
By default, dbx doesn’t display the commands that it executes as a result of
the hed command (the dbx variable $pimode is set to 0). If $pimode is set to 1,
dbx displays the commands as it executes them. See $pimode in Appendix C,
“Predefined dbx Variables” for more information.
Creating and Removing dbx Aliases
You can create dbx aliases for debugger commands. Use these aliases as you
would any other dbx command. When dbx encounters an alias, it expands the
alias using the definition you provided.
dbx has a group of predefined aliases that you can modify or delete. These
aliases are listed and described in Appendix B, “Predefined Aliases.”
24
Creating and Removing dbx Aliases
If you find that you often create the same aliases in your debugging sessions,
you can include their definitions in your .dbxinit file so that they are
automatically defined for you. See “Automatically Executing Commands on
Startup” on page 10 for more information on the .dbxinit file.
Listing Aliases
You can display the definition of aliases using the alias command:
alias
Lists all existing aliases.
alias name
Lists the alias definition for name.
For example, to display the definitions of the predefined aliases “l” and
“bp,” enter:
(dbx) alias l
"list"
(dbx) alias bp
"stop in"
Creating Command Aliases
You can use the alias command to define new aliases:
alias name command
Defines name as an alias for command.
alias name “string”
Defines name as an alias for string. With this form of the alias
command, you can provide command arguments in the
alias definition.
alias name(arg1 [, ... argN]) “string”
Defines name as an alias for string. arg1 through argN are
arguments to the alias, appearing in the string definition.
When you use the alias, you must provide values for the
arguments, which dbx then substitutes in string.
The simplest form of an alias is to redefine a dbx command with a short alias.
Many of the predefined dbx aliases fall into this category: “a” is an alias for
the assign command, “s” is an alias for the step command. When you use one
25
Chapter 4: Controlling dbx
of these aliases, dbx simply replaces it with the command for which it is an
alias. Any arguments that you include on the command line are passed to
the command.
For example, if you to create “gf” as an alias for the givenfile command, enter:
(dbx) alias gf givenfile
(dbx) alias gf
"givenfile"
(dbx) gf
Current givenfile is test
(dbx) gf test2
Process 22545 (test) terminated
Executable /usr/var/tmp/dbx_examples/test2
(dbx) gf
Current givenfile is test2
More complex alias definitions require more than the name of a command.
In these cases, you must enclose the entire alias definition string in double
quotation marks. For example, you can define a brief alias to print the value
of a variable that you commonly examine. Note that you must use the escape
character (\) to include the double quotation marks as part of the alias
definition. For example:
(dbx) alias pa "print \"a =\", a"
(dbx) alias pa
"print "a =", a"
(dbx) pa
a = 3
You can also define an alias so that you can pass arguments to it, much in the
same way that you can provide arguments in a C language macro definition.
When you use the alias, you must include the arguments. dbx then
substitutes the values that you provide in the alias definition.
To illustrate this, consider the following alias definition:
(dbx) alias p(arg1, arg2, arg3, arg4) "print
’|arg1|arg2|arg3|arg4|’"
(dbx) alias p
(arg1, arg2, arg3, arg4)"print ’|arg1|arg2|arg3|arg4|’"
26
Creating and Removing dbx Aliases
The “p” alias takes four arguments and prints them surrounded by vertical
bars (|). For example:
(dbx) p(1,2,3,4)
|1|2|3|4|
(dbx) p( first, second, 3rd,4)
| first| second| 3rd|4|
In the previous example, dbx retains any spaces that you enter when calling
an alias.
You can also omit arguments when calling an alias as long as you include the
commas as argument separators in the alias call:
(dbx) p(a,,b,c)
|a||b|c|
(dbx) p(,first missing, preceding space,)
||first missing| preceding space||
(dbx) delete
delete
Removing Command Aliases
The unalias command removes the alias you provide as an argument. For
example, to remove the “pa” alias defined in the previous section, enter:
(dbx) unalias pa
You can remove any of the predefined dbx aliases; however, these aliases are
restored the next time you start dbx.
Alias Example
An easy way to follow linked lists is to use aliases and casts. This example
shows how to construct an alias that follows a simple linked list with
members defined by the following structure:
struct list { struct list *next; int value; };
In this example, a dbx variable called $p is used as a pointer to a member of
the linked list. You can define an alias called “foll” to print the contents of the
list member to which $p currently points and then advance to the next list
27
Chapter 4: Controlling dbx
member. Because the command is too long to fit onto one line, this example
uses the backslash character (\) to continue the command on a second line:
(dbx) alias foll "print *(struct list *)$p ; \
set $p = (long)((struct list *)($p))->next"
Casting $p to an integer type when following the link (the second
assignment in the alias) is essential. If omitted, dbx may leave the $p
reference symbolic and if so, goes into an infinite loop. (Type Ctrl-c to
interrupt dbx if it gets into the infinite loop.)
Before using this alias, you must set $p to point at the first list member. In this
example, assume that the program variable top points to the first list
member. Then you can use the “foll” alias to follow the linked list, printing
the contents of each member as you proceed:
(dbx) set $p = top
(dbx) foll
struct list {
next = 0x7fffc71c
value = 57
}
(dbx) foll
struct list {
next = 0x7fffc724
value = 3
}
(dbx) foll
struct list {
next = 0x7fffc72c
value = 12
}
Recording and Playing Back dbx Input and Output
dbx allows you to play back your input and record dbx’s output. dbx saves the
information that you capture in files, which allows you to create command
scripts that you can use in subsequent dbx sessions.
28
Recording and Playing Back dbx Input and Output
Recording Input
Use the record input command to start an input recording session. Once you
start an input recording session, all commands to dbx are copied to the
specified file. If the specified file already exists, dbx appends the input to the
existing file. You can start and run as many simultaneous dbx input
recording sessions as you need.
Each recording session is assigned a number when you begin it. Use this
number to reference the recording session with the unrecord command
described in “Ending a Recording Session” on page 29.
After you end the input recording session, use the command file with the
playback input or pi commands to execute again all the commands saved to
the file. See “Playing Back Input” on page 30.
For example, to save the recorded input in a file called script, enter:
(dbx) record input script
[4] record input script (0 lines)
If you do not specify a file to record input, dbx creates a temporary dbx file in
the /tmp directory. The name of the temporary file is stored in the dbx variable
$defaultin. You can display the temporary filename using the print command:
(dbx) print $defaultin
Because the dbx temporary files are deleted at the end of the dbx session, use
the temporary file to repeat previously executed dbx commands in the
current debugging session only. If you need a command file for use in
subsequent dbx sessions, you must specify the filename when you invoke
record input. If the specified file exists, the new input is appended to the file.
Ending a Recording Session
To end input or output recording sessions, use the unrecord command.
unrecord session1 [, session2 ...]
Turns off the specified recording session(s) and closes the
file(s) involved.
unrecord all Turns off all recording sessions and closes all files involved.
29
Chapter 4: Controlling dbx
For example, to stop recording session 4, enter the dbx command:
(dbx) unrecord 4
To stop all recording sessions, enter:
(dbx) unrecord all
The dbx status command does not report on recording sessions. To see
whether or not any active recording sessions exist, use the record command
described in “Examining the Record State” on page 31.
Playing Back Input
Use playback input to execute commands that you recorded with the record
input command. Two aliases exist for playback input: pi and source.) If you
don’t specify a filename, dbx uses the current temporary file that it created
for the record input command. If you set the dbx variable $pimode to nonzero,
the commands are printed out as they are played back. By default, $pimode
is set to zero.
Recording Output
Use the record output command to start output recording sessions within dbx.
During an output recording session, dbx copies its screen output to a file. If
the specified file already exists, dbx appends to the existing file. You can start
and run as many simultaneous dbx output recording sessions as you need.
By default, the commands you enter are not copied to the output file;
however, if you set the dbx variable $rimode to a nonzero value, dbx also
copies the commands you enter.
Each recording session is assigned a number when you begin it. Use this
number to reference the recording session with the unrecord command
described in “Ending a Recording Session” on page 29.
The record output command is very useful when the screen output is too large
for a single screen (for example, printing a large structure). Within dbx, you
can use the playback output command (described in “Playing Back Output”
on page 31) to look at the recorded information. After quitting dbx, you can
30
Recording and Playing Back dbx Input and Output
review the output file using any IRIX system text viewing command (such
as vi(1)).
For example, to record the dbx output in a file called gaffa, enter:
(dbx) record output gaffa
To record both the commands and the output, enter:
(dbx) set $rimode=1
(dbx) record output gaffa
If you omit the filename, dbx saves the recorded output in a temporary file in
/tmp. The temporary file is deleted at the end of the dbx session. To save
output for use after the dbx session, you must specify the filename when
giving the record output command. The name of the temporary file is stored
in the dbx variable $defaultout.
To display the temporary filename, type:
(dbx) print $defaultout
Playing Back Output
The playback output command displays output saved with the record output
command. This command works the same as the cat(1) command. If you
don’t specify a filename, dbx uses the current temporary file created for the
record output command.
For example, to display the output stored in the file script, enter:
(dbx) playback output script
Examining the Record State
The record command displays all record input and record output sessions
currently active. For example:
(dbx) record
[4] record input /usr/demo/script (12 lines)
[5] record output /tmp/dbxoXa17992 (5 lines)
31
Chapter 4: Controlling dbx
Executing dbx Scripts
You can create dbx command scripts using an external editor and then
execute these scripts using the pi or playback input command. This is a
convenient method for creating and executing automated test scripts.
You can include comments in your command scripts by using a single
pound sign (#) to introduce a comment. To include a # operator (described
in “Operators” on page 33) in a dbx script, use two pound signs (for example,
##27). When dbx sees a pound sign in a script file, it interprets all characters
between the pound sign and the end of the current line as a comment.
32
Chapter 5
5.
Examining and Changing Data
This chapter describes how to examine and change data in your program
while running it under dbx. Topics covered include:
•
“Using Expressions”
•
“Printing Expressions”
•
“Using Data Types and Type Coercion (Casts)”
•
“Displaying and Changing Program Variables”
•
“Determining the Scope of Variables”
•
“Displaying Type Declarations”
•
“Examining the Stack”
•
“Using Interactive Function Calls”
•
“C++ Considerations”
Using Expressions
Many dbx commands accept one or more expressions as arguments.
Expressions can consist of constants, dbx variables, program variables, and
operators. This section discusses operators and constants. “Creating and
Removing dbx Variables” on page 19 describes dbx variables, and
“Displaying and Changing Program Variables” on page 39 describes
program variables.
Operators
In general, dbx recognizes most expression operators from C, Fortran 77, and
Pascal. dbx also provides some of its own operators. Operators follow the C
33
Chapter 5: Examining and Changing Data
language precedence. You can also use parentheses to explicitly determine
the order of evaluation.
Table 5-1 lists the operators provided by dbx.
Table 5-1
dbx Language Independent Operators
Operator
Description
not
Unary operator returning false if the operand is true
or
Binary logical operator returning true if either operand is
nonzero
xor
Binary operator returning the exclusive-OR of its operands
/
Binary division operator (you can also use “//” for division)
div
Binary operator that coerces its operands to integers before
dividing
mod
Binary operator returning op1 modulo op2. This is equivalent
to the C “%” operator
#exp
Unary operator returning the address of source line specified
by exp
"file" #exp
Unary operator returning the address of source line specified
by exp in the file specified by file
proc #exp
Unary operator returning the address of source line specified
by exp in the file containing the procedure proc
The # operator takes the line number specified by the expression that follows
it and returns the address of that source line. If you precede the # operator
with a filename enclosed in quotation marks, the # operator returns the
address of the line number in the file you specify. If you precede the #
operator with the name of a procedure, dbx identifies the source file that
contains the procedure and returns the address of the line number in that
file.
For example, to print the address of line 27 in the current source file, enter:
(dbx) print #27
34
Using Expressions
To print the address of line 27 in the source file foo.c (assuming that foo.c
contains source that was used to compile the current object file), enter:
(dbx) print "foo.c" #27
To print the address of line 27 in the source file containing the procedure bar
(assuming that bar is a function in the current object file), enter:
(dbx) print bar #27
Note: A pound sign (#) introduces a comment in a dbx script file. When dbx
sees a pound sign in a script file, it interprets all characters between the
pound sign and the end of the current line as a comment. See “Executing dbx
Scripts” on page 32 for more information on dbx script files. To include the #
operator in a dbx script, use two pound signs (for example, ##27).
Table 5-2 lists the C language operators recognized by dbx.
C Language Operators Recognized by dbx
Table 5-2
Type
Operators
Unary
!
Binary
% << >> == <= >= != < > & && | || + - * / [ ] -> .
&
+
-
*
sizeof()
Note: C does not allow you to use the sizeof operator on bit fields. However,
dbx allows you to enter expressions using the sizeof operator on bit fields; in
these cases, dbx returns the number of bytes in the data type of bit fields
(such as int or unsigned int). The C language “^” exclusive-OR operator is
not supported. Use the dbx “xor” operator instead.
Table 5-3 lists the Pascal operators recognized by dbx.
Table 5-3
Pascal Operators Recognized by dbx
Type
Operators
Unary
not
Binary
mod =
^
+
<=
>=
<>
<
> and
or
+
-
* /
div
[]
35
Chapter 5: Examining and Changing Data
Table 5-4 lists the Fortran 77 language operators recognized by dbx. Note that
dbx does not recognize Fortran logical operators (such as .or. and .TRUE.).
Fortran 77 Operators Recognized by dbx
Table 5-4
Type
Operators
Unary
+
-
Binary
+
-
*
/
Note: Fortran array subscripting must use “[]” not “()”. For example, if x is
a two-dimension Fortran array, print x(1,2) won’t work; however, print
x[1,2] will work. If an array is defined as a Fortran array, refer to it with the
standard Fortran subscript ordering.
Constants
You can use both numeric and string constants under dbx.
Note: Expressions cannot contain constants defined by #define declarations
to the C preprocessor.
Numeric Constants
In numeric expressions, you can use any valid integer or floating point
constants. By default, dbx assumes that numeric constants are in decimal.
You can set the default input base to octal by setting the dbx variable $octin
to a nonzero value. You can set the default input base to hexadecimal by
setting the dbx variable $hexin to a nonzero value. If you set both $octin and
$hexin to nonzero values, $hexin takes precedence.
You can override the default input type by prefixing “0x” to indicate a
hexadecimal constant, or “0t” to indicate a decimal constant. For example,
“0t23” is decimal 23 (which equals hexadecimal 0x17), and “0x2A” is
hexadecimal 2A (which equals decimal 42).
By default, dbx prints the value of numeric expressions in decimal. You can
set the default output base to octal by setting the dbx variable $octints to a
nonzero value. You can set the default output base to hexadecimal by setting
36
Printing Expressions
the dbx variable $hexints to a nonzero value. If you set both $octints and
$hexints to nonzero values, $hexints takes precedence.
String Constants
Most dbx expressions cannot include string constants. The print and printf
commands are two of the dbx commands that accept string constants as
arguments. You can also use the set command to assign a string value to a
dbx variable.
Otherwise, string constants are useful only as arguments to functions that
you call interactively. See “Using Interactive Function Calls” on page 53 for
information on interactive function calls.
You can use either the double-quote character (") or the single-quote
character (’) to quote strings in dbx.
In general, dbx recognizes the following escape sequences in quoted strings
(following the standard C language usage):
\\ \n \r \f \b \t \’ \" \a
Printing Expressions
dbx provides the following commands for printing values of expressions:
print [exp1 [, exp2, ...] ]
Prints the value(s) of the specified expression(s).
printd [exp1 [, exp2, ... ] ]
Prints the value(s) of the specified expression(s) in decimal.
(pd is an alias for printd. See “Creating and Removing dbx
Variables” on page 19 for more information about dbx
aliases.)
printo [exp1 [, exp2, ... ] ]
Prints the value(s) of the specified expression(s) in octal. (po
is an alias for printo.)
printx [exp1 [, exp2, ... ] ]
Prints the value(s) of the specified expression(s) in
hexadecimal. (px is an alias for printx.)
37
Chapter 5: Examining and Changing Data
The variable types are listed in Table 5-5.
Variable Types
Table 5-5
Type
Variable Name
Value
signed char
sc
0xff
unsigned char
usc
0xff
signed short
ssh
0xffff
unsigned short
ush
0xffff
Examples include:
(dbx) pd
-1
(dbx) pd
-1
(dbx) px
0xff
(dbx) px
0xffff
(dbx) pd
255
(dbx) pd
65535
sc
ssh
sc
ssh
usc
ush
dbx always prints the bits in the appropriate type. pd is an exception; it
expands signed types with sign extension so the decimal value looks correct.
Another example:
(dbx) print sc, usc
’\377’ ’\377’
If $hexchars is set, this command displays ’0xff ’ ‘0xff ’. (This is a change
from releases previous to IRIX 5.2. Previously, the px, po cases on signed
short expanded to 32 bits, so px sc printed 0xffffffff.)
If the printed data type is pointer, dbx uses the format specified in the
$addrfmt or $addrfmt64 predefined dbx variable ($addrfmt64 is used on
only 64-bit processes).
38
Using Data Types and Type Coercion (Casts)
printf string [, exp1 [, exp2, ... ] ]
Print the value(s) of the specified expression(s) in the format
specified by the string, string. The printf command supports
all formats of the IRIX printf command except “%s.” For a
list of formats, see the printf(3S) reference page.
Using Data Types and Type Coercion (Casts)
You can use data types for type conversion (casting) by including the name
of the data type in parentheses before the expression you want to cast. For
example, to convert a character into an integer, use (int) to cast the value:
(dbx) print (int) ’b’
98
To convert an integer into a character, use (char) to cast the value:
(dbx) print (char) 67
’C’
This is standard C language type casting.
Displaying and Changing Program Variables
You can use the value of program variables in dbx expressions. You can also
change the value of program variables while running your program under
dbx control.
Qualifying Variable Names
You can use the same name for different variables multiple times in the same
program. For example, you can use a temporary counter named “i” in many
different functions.
During program execution, this potential ambiguity presents no problem.
The scope of each variable is local; space is allocated for it when the function
is called and freed when the function returns.
39
Chapter 5: Examining and Changing Data
Under dbx, however, you need to be able to distinguish between different
variables that may have the same name. To do so, you can qualify a reference
to a variable to specify its scope.
dbx qualifies variables with the file (also called module), the procedure, a
block, or a structure. You can manually specify the full scope of a variable by
separating scopes with periods. For example, in the expression:
mrx.main.i
i is the variable name, main is a procedure in which it appears, and mrx is the
source file (omitting the file extension) in which the procedure is defined.
To illustrate, consider a C program called test that contains a function
compare. In this example, the variable i is declared in both the main
procedure and the compare function:
int compare ( int );
main( argc, argv )
int argc;
char **argv;
{
int i;
...
}
int compare ( arg1, arg2 )
{
int i;
...
}
To trace the value of the i that appears in the function compare, enter:
(dbx) trace test.compare.i
To print the value of the i that appears in the procedure main, enter:
(dbx) print test.main.i
A leading dot (a period at the beginning of the identifier) tells dbx that the
first qualifier is not a module (file).
40
Displaying and Changing Program Variables
The leading dot is useful when a file and a procedure have the same name.
For instance, suppose mrx.c contains a function called mrx. Further, suppose
that mrx.c contains a global variable called mi and a local variable, also called
mi. To refer to the global variable, use the qualified form .mrx.mi, and to refer
to the local variable, use the qualified form mrx.mrx.mi.
Variable Scope
You can access the value of a variable only while it is in scope. The variable
is in scope only if the block or procedure with which it is associated is active.
After you start your program, whenever your program executes a block or
procedure that contains variables, your program allocates space for those
variables and they “come into scope.” You may access the values of those
variables as long as the block or procedure is active. Once the block or
procedure ends, the space for those variables is deallocated and you may no
longer access their values.
Displaying the Value of a Variable
You can display the value of a program variable using the print, printd, printf,
printo, and printx commands and the pd, po, and px aliases described in
“Printing Expressions” on page 37. For example, to print the value of the
program variable total, enter:
(dbx) print total
235
The print command also displays arrays, structures, and other complex data
structures. For example, if message is a character array (a string), dbx prints
the string:
(dbx) print message
"Press <Return> to continue."
As a more complex example, consider a simple linked list stored as an array
of elements, each element consisting of a pointer to the next element and an
integer value. If the array is named list, print the entire array by entering:
(dbx) print array
41
Chapter 5: Examining and Changing Data
dbx prints the value of each element in the array:
{
[0] struct list {
next = (nil)
value = 1034
}
[1] struct list {
next = 0x10012258
value = 1031
}
[2] struct list {
next = 0x10012270
value = 1028
}
[3] struct list {
next = 0x10012288
value = 1025
}
[4] struct list {
next = 0x100122a0
value = 1022
}
[5] struct list {
next = 0x100122b8
value = 1019
}
...
}
To print an individual element, enter a command such as:
(dbx) print array[5]
struct list {
next = 0x100122b8
value = 1019
}
No simple method exists for examining a portion of an array with the print
command. However, if your array consists of simple elements such as
integers or floating point values, you can directly examine the contents of
memory using the / (examine forward) command described in “Examining
Memory and Disassembling Code” on page 85.
42
Displaying and Changing Program Variables
Suppose a single-precision floating point array is named float_vals. To see the
six consecutive elements beginning with the fifth element, enter:
(dbx) &float_vals[4] / 6f
10012018: 0.25000000000000000 0.20000000298023224 0.16666699945926666
0.14280000329017639
10012028: 0.12500000000000000 0.11111100018024445
Changing the Value of a Variable
The assign command changes the value of existing program variables. You
can also use the assign command to change the value of machine registers, as
described in “Changing Register Values” on page 84.
The syntax of the assign command is:
assign variable = expression
Assigns the value of expression to the program variable,
variable.
For example:
(dbx) assign x = 27
27
(dbx) assign y = 37.5
37.5
If you receive an incompatible types error when you try to assign a value
to a pointer, use casts to make the assignment work. For example if next is a
pointer to a structure of type “element,” you can assign next a null pointer
by entering:
(dbx) assign *(int *) (&next) = 0
0
(dbx) assign next = 0
(nil)
(dbx) assign next = (struct list*) 0;
(nil)
In this example, nil denotes that the value of the pointer is 0; nil is similar
to NULL in the C language.
43
Chapter 5: Examining and Changing Data
Conflicts Between Variable Names and Keywords
When naming variables in your program, avoid using any dbx keywords. If
you have a variable with the same name as a dbx keyword and you attempt
to use that variable in a dbx command, dbx reports a syntax error.
If you do have a program variable with the same name as a dbx command,
you can force dbx to treat it as a variable by enclosing the variable in
parentheses. For example, if you try to print the value of a variable named in
by entering the following command, dbx displays an error.
(dbx) print
print in
^ syntax
Suggestion: in
Type !16 or !!
in
error
is a dbx keyword; a revised command is in history.
to execute: print (in)
The correct way to display the value of input is to enter:
(dbx) print (in)
34
dbx keywords include:
all
and
at
div
if
in
mod
not
or
pgrp
pid
sizeof
to
xor
By default, dbx treats as keywords the following C type keywords:
signed
unsigned
short
long
int
char
struct
union
enum
double
float
However, if your program is not written in C or C++, you may wish to
disable these keywords. The dbx variable $ctypenames determines whether or
not C type keywords are treated as dbx keywords. If $ctypenames is set to 1
44
Determining the Scope of Variables
(the default), then C type keywords are treated as dbx keywords; if
$ctypenames is set to 0, they are not.
Case Sensitivity in Variable Names
Whether or not dbx is case sensitive when it evaluates program variable
names depends on the value of the dbx variable $casesense.
If $casesense is 2 (the default), then the language in which the variable was
defined is taken into account (for example, C and C++ are case sensitive
while Pascal and Fortran are not). If $casesense is 1, case is always checked. If
$casesense is 0, case is always ignored. Note that file (module) names are
always case sensitive since they represent UNIX filenames.
Determining the Scope of Variables
The which command allows you to determine the scope of variables. This
command is useful for programs that have multiple variables with the same
name occurring in different scopes.
The which command prints the fully qualified name of the active version of
a specified variable. For example, to determine the scope of the variable i,
enter:
(dbx) which i
.foo.foo2.i
In the example above, the variable i that is currently active is local to the
procedure foo2 that appears in the module foo (corresponding to the file foo.c
in a C language program).
Displaying Type Declarations
The whatis command displays the type declaration for a specified variable or
procedure in your program.
45
Chapter 5: Examining and Changing Data
For example, to display the type declaration for the variable i, enter:
(dbx) whatis i
int i;
The following example illustrates the output of whatis for an array of
structures:
(dbx) whatis array
struct list {
struct list* next;
int value;
} array[12];
When you provide a procedure name to whatis, dbx reports the type of the
value returned by the procedure and the types of all arguments to the
procedure:
(dbx) whatis foo
int foo(i)
int i;
(dbx) whatis main
int main(argc, argv)
int argc;
char** argv;
Examining the Stack
Each time your program executes a procedure, the information about where
in the program the call was made from is saved on a stack. The stack also
contains arguments to the procedure and all of the procedure’s local
variables. Each procedure on the stack defines an activation level. Activation
levels can also consist of blocks that define local variables within procedures.
The activation level determines the scope of many dbx commands and
expressions. For example, unless you qualify a variable, as described in
“Qualifying Variable Names” on page 39, dbx assumes that variables you
reference are local to the current activation level.
The most recently called procedure or block is numbered 0. The next active
procedure (the one that called the current procedure) is numbered 1. The last
activation level is always the main program block.
46
Examining the Stack
Printing Stack Traces
The where command prints stack traces. Stack traces show the current
activation levels (procedures) of a program.
For example, consider the following stack trace for a program called test:
(dbx) where
> 0 foo2(i = 5) [“/usr/var/tmp/dbx_examples/test.c”:44, 0x1000109c]
1 foo(i = 4) [“/usr/var/tmp/dbx_examples/test.c”:38, 0x1000105c]
2 main(argc = 1, argv = 0xffffffad78) [“/usr/var/tmp/dbx_examples/
test.c”:55, 0x10001104]
3 __start() [“/shamu/lib/libc/libc_64/crt1text.s”:137, 0x10000ee4]
This program has four activation levels. The most recent, a call of the
procedure foo2, is numbered 0. The currently selected activation level is 0,
indicated by the “>” character.
The stack trace also reports that foo2 was passed one argument: the value 5
was assigned to the local variable i. The trace indicates that the program was
stopped at line 44 of the file test.c, which translates to machine address
0x1000109c.
The stack trace reports similar information for the next two activation levels
in this example. You can see that the function foo called foo2 from line 38 in
test.c. In turn, foo was called by main at line 55 of the file test.c. Finally, the
run-time start-up level was called at line 137 from the file ctrltext.s.
If you compile with –g0 or with no –g option, limited symbols are reported.
In cases such as this, where detailed symbolic information is not available,
the four hexadecimal values returned represent dbx’s guess that the function
has four integer arguments. The following example illustrates such a case:
(dbx) where
> 0 fooexample(0x300000000, 0x4000000ff, 0x5000000ff, 0x0)
[“/usr/var/tmp/dbx_examples/test3.c”:10, 0x10000cf8]
1 main(0x3, 0x4, 0x5, 0x0) [“/usr/var/tmp/dbx_examples/
test3.c”:5, 0x10000cbc]
2 __start() [“/shamu/lib/libc/libc_64/csu/
crt1text.s”:137, 0x10000c64]
(dbx) quit
Process 22582 terminated
int fooexample(int,int,int);
int main()
47
Chapter 5: Examining and Changing Data
{
fooexample(3,4,5);
return 0;
}
int fooexample(int i, int j, int k)
{
int x = i + j + 3*k;
return x;
}
The examples below show register values from code compiled without a –g
option. MIPS1 or MIPS2 code using the 32-bit ABI (for example, on an Indy):
(dbx) where
> 0 subr1(0x3, 0x7fffaf14, 0x7fffaf1c, 0x0) [“t.c”:3, 0x4009ec]
1 test(0x3, 0x7fffaf14, 0x7fffaf1c, 0x0) [“t.c”:8, 0x400a10]
2 main(0x1, 0x7fffaf14, 0x7fffaf1c, 0x0) [“t.c”:13, 0x400a48]
3 __start() [“crt1text.s”:133, 0x40099c]
There are four hexadecimal values displayed in most lines of the code above
since the 32-bit MIPS ABI has four integer argument passing registers. No
user-useful registers are passed to __start().
MIPS3 or MIPS4 code using the 64-bit ABI (for example, on a Power
Challenge):
(dbx) where
> 0 subr1(0x3, 0xffffffaed8, 0xffffffaee8, 0x0, 0x2f, 0x10, 0x0, 0xfbd82a0) [“/
usr/people/doc/debug/t.c”:3, 0x10000c9c]
1 test(0x3, 0xffffffaed8, 0xffffffaee8, 0x0, 0x2f, 0x10, 0x0, 0xfbd82a0) [“/
usr/people/doc/debug/t.c”:9, 0x10000ce8]
2 main(0x1000000ff, 0xffffffaed8, 0xffffffaee8, 0x0, 0x2f, 0x10, 0x0,
0xfbd82a0) [“/usr/people/doc/debug/t.c”:14, 0x10000d2c]
3 __start() [“/shamu/redwood2/work/irix/lib/libc/libc_64/csu/crt1text.s”:137,
0x10000c70]
There are eight hexadecimal values displayed in most lines of the code above
since the 64-bit MIPS ABI has eight integer argument passing registers. No
user-useful registers are passed to __start().
The values listed as arguments are the integer argument-passing register
values. Typically, only the 0 entry of the stack has those argument values
correct. Correctness is not guaranteed because the code generator can
overwrite the values, using the registers as temporary variables.
48
Examining the Stack
The debugger reports the integer argument-passing registers because this
information may be of some value.
For example, for the code samples above, the following code calls subr1():
int test(void)
{
subr1(3);
}
This code displays 0x3 as the argument register value. The other registers
listed for subr1 contain arbitrary data.
Moving Within the Stack
The up and down commands move up and down the activation levels in the
stack. These commands are useful when examining a call from one level to
another. You can also move up and down the activation stack with the func
command described in “Moving to a Specified Procedure” on page 50.
The up and down commands have the following syntax:
up [num]
Moves up the specified number of activation levels in the
stack. The default is one level.
down [num]
Moves down the specified number of activation levels in the
stack. The default is one level.
When you change activation levels, your scope changes. For example, unless
you qualify a variable, as described in “Qualifying Variable Names” on
page 39, dbx assumes that variables you reference are local to the current
activation level. Also, dbx changes the current source file to the file
containing the procedure’s source.
Consider examining the stack trace for a program called test4 and moving up
in the activation stack:
(dbx) where
> 0 foo2(i = 5) [“/usr/var/tmp/dbx_examples/foo.c”:46, 0x10001214]
1 foo(i = 4) [“/usr/var/tmp/dbx_examples/foo.c”:40, 0x100011d4]
2 main(argc = 1, argv = 0xffffffad78) [“/usr/var/tmp/dbx_examples/
test4.c”:25, 0x10000fa0]
3 __start() [“/shamu/lib/libc/libc_64/csu/crt1text.s”:137, 0x10000f34]
49
Chapter 5: Examining and Changing Data
(dbx) print i
5
(dbx) up
foo: 40 r = foo2(i+1);
The current activation level is now the procedure foo. As indicated in the
output, the variable i receives the argument passed to foo and is therefore
local to foo. The variable i at this activation level is different from the
variable i in the foo2 activation level. You can reference the currently active
i as “i”; whereas you must qualify the reference to the i in foo2:
(dbx) print i
4
(dbx) print foo2.i
<symbol not found>
Moving up one more activation level brings you to the main procedure:
(dbx) up
main: 25 j = foo(j);
(dbx) file
/usr/var/tmp/dbx_examples/test4.c
In this example, the source for main is in test4.c, whereas the source for foo
and foo2 is in foo.c; therefore, dbx changes the current source file when you
move up to the main activation level.
dbx resets the source file when you return to the foo2 activation level:
(dbx) down 2
foo2: 46 printf(“foo2 arg is %d\n”,i);
(dbx) file
/usr/var/tmp/dbx_examples/foo.c
Moving to a Specified Procedure
The func command moves you up or down the activation stack. You can
specify the new activation level by providing either a procedure name or an
activation level number.
50
Examining the Stack
The syntax for the func command is:
func {activation_level | procedure}
Changes the current activation level. If you specify an
activation level by number, dbx changes to that activation
level. If you specify a procedure, dbx changes to the
activation level of that procedure. If you specify a procedure
name and that procedure has called itself recursively, dbx
changes to the most recently called instance of that
procedure.
func
Displays the name of the procedure corresponding to the
current activation level.
When you change your activation level, your scope changes. For example,
unless you qualify a variable as described in “Qualifying Variable Names”
on page 39, dbx assumes that variables you reference are local to the current
activation level. Also, dbx changes the current source file to the one
containing the procedure’s source and the current line to the first line of the
procedure.
You can also give the func command the name of a procedure that is not on
the activation stack, even when your program is not executing. In this case,
dbx has no corresponding activation level to make current. However, dbx still
changes the current source file to the one containing the procedure’s source
and the current line to the first line of the procedure.
For example, consider the following activation stack:
(dbx) where
> 0 foo2(i = 5) [“/usr/var/tmp/dbx_examples/foo.c”:46, 0x10001214]
1 foo(i = 4) [“/usr/var/tmp/dbx_examples/foo.c”:40, 0x100011d4]
2 main(argc = 1, argv = 0xffffffad78) [“/usr/var/tmp/dbx_examples/
test4.c”:25, 0x10000fa0]
3 __start() [“/shamu/lib/libc/libc_64/csu/crt1text.s”:137, 0x10000f34]
In this case, you can go to the main activation stack by entering:
(dbx) func main
main: 25 j = foo(j);
This command changes the current activation level to “2” and changes the
current source file to test4.c.
51
Chapter 5: Examining and Changing Data
If you use the func command to go to a function that is not on the activation
stack, dbx changes only the current source file to the one containing the
procedure’s source and the current line to the first line of the procedure:
(dbx) func bar
3 {
(dbx) file
/usr/var/tmp/dbx_examples/bar.c
Printing Activation Level Information
The dump command prints information about the variables in an activation
level:
dump
Prints information about the variables in the current
procedure.
dump procedure Prints information about the variables in the specified
procedure. The procedure must be active. Starts searching
for procedure at the current activation level as set by the up
or down command. (See “Moving Within the Stack” on
page 49 for more information about the up and down
commands.)
dump .
Prints information about the variables in all procedures in
all activation levels.
For example, executing dump while in a function called foo2 appears as:
(dbx) dump
foo2(i = 5) [“/usr/var/tmp/dbx_examples/foo.c”:46, 0x10001214]
To examine the information for the procedure main, enter:
(dbx) dump main
main(argc = 1, argv = 0xffffffad78) [“/usr/var/tmp/dbx_examples/test4.c”:25,
0x10000fa0]
j=4
i = 12
r = <expression or syntax error>
a=0
total = 0
52
Using Interactive Function Calls
To perform a complete dump of the program’s active variables, enter:
(dbx) dump .
> 0 foo2(i = 5) [“/usr/var/tmp/dbx_examples/foo.c”:46, 0x10001214]
1 foo(i = 4) [“/usr/var/tmp/dbx_examples/foo.c”:40, 0x100011d4]
r=0
2 main(argc = 1, argv = 0xffffffad78) [“/usr/var/tmp/dbx_examples/
test4.c”:25, 0x10000fa0]
j=4
i = 12
r = <bad operand>
a=0
total = 0
Using Interactive Function Calls
You can interactively call a function in your program from dbx.
If the function returns a value, you can use that function in a normal dbx
expression. For example, consider a function prime defined in your program
that accepts an integer value as an argument, and returns 1 if the value is
prime and 0 if it is not. You can call this function interactively and print the
results by entering a command such as:
(dbx) print prime(7)
1
Using ccall
If your function does not return a value, or if you want to execute a function
primarily for its side effects, you can execute the function interactively with
the dbx command ccall:
ccall func(arg1, arg2, ... , argn)
This command calls a function with the given arguments.
Regardless of the language the function was written in, the
call is interpreted as if it were written in C, and normal C
calling conventions are used.
Note: Structure and union arguments to a function, and structure and union
returns from a function, are not supported.
53
Chapter 5: Examining and Changing Data
Functions called interactively honor breakpoints. Thus you can debug a
function by setting breakpoints and then calling it interactively.
If you perform a stack trace using the where command while stopped in a
routine executed interactively, dbx displays only those activation levels
created by your interactive function call. The activation levels for your active
program are effectively invisible. For example, a stack trace looks like this
during an interactive function call:
(dbx) where
> 0 foo2(i = 9) [“/usr/var/tmp/dbx_examples/foo.c”:46, 0x10001214]
1 foo(i = 8) [“/usr/var/tmp/dbx_examples/foo.c”:40, 0x100011d4]
===== interactive function call =====
2 foo2(i = 5) [“/usr/var/tmp/dbx_examples/foo.c”:46, 0x10001214]
3 foo(i = 4) [“/usr/var/tmp/dbx_examples/foo.c”:40, 0x100011d4]
4 main(argc = 1, argv = 0xffffffad78) [“/usr/var/tmp/dbx_examples/
test4.c”:25, 0x10000fa0]
5 __start() [“/shamu/lib/libc/libc_64/csu/crt1text.s”:137, 0x10000f34]
If you stop execution of an interactively called function, you are responsible
for eventually “unstacking” the call and returning from the function call. To
unstack a call, you can complete the call using dbx commands such as cont,
resume, next, or step as many times as necessary. If you run or rerun your
program, dbx automatically unstacks all interactive function calls.
Using clearcalls
Another way to unstack an interactive function call is to execute the clearcalls
command, which clears all stopped interactive calls.
(dbx) clearcalls
When stopped or faulted within one or more nested interactive calls, the
clearcalls command removes these calls from the stack and returns the
program to its regular callstack. This command is useful when a
segmentation fault, infinite loop, or other fatal error is encountered within
the interactive call.
When stopped in an interactive call, the call stack displayed by where shows
the following line at the end of each stack of interactive call instantiation.
54
Using Interactive Function Calls
==== interactive function call ====
For example, if the procedure foo() is interactively called from main(), you
see the following stack:
> 0 foo2(i = 9) [“/usr/var/tmp/dbx_examples/foo.c”:46, 0x10001214]
1 foo(i = 8) [“/usr/var/tmp/dbx_examples/foo.c”:40, 0x100011d4]
===== interactive function call =====
2 foo2(i = 5) [“/usr/var/tmp/dbx_examples/foo.c”:46, 0x10001214]
3 foo(i = 4) [“/usr/var/tmp/dbx_examples/foo.c”:40, 0x100011d4]
4 main(argc = 1, argv = 0xffffffad78) [“/usr/var/tmp/dbx_examples/
test4.c”:25, 0x10000fa0]
5 __start() [“/shamu/lib/libc/libc_64/csu/crt1text.s”:137, 0x10000f34]
Nesting Interactive Function Calls
You can also nest interactive function calls. In other words, if you have one
or more breakpoints in a function, and you call that function repeatedly, each
interactive call is stacked on top of the previous call. Breakpoints in a
function affect all nesting levels, so you cannot have different breakpoints at
different nesting levels.
The where command shows the entire stack trace from which you can
determine the nesting depth. The following example has two nesting levels.
(dbx) where
> 0 foo2(i = 17) [“/usr/var/tmp/dbx_examples/foo.c”:46,
0x10001214]
1 foo(i = 16) [“/usr/var/tmp/src/dbx_examples/foo.c”:40,
0x100011d4]
===== interactive function call =====
2 foo2(i = 9) [“/usr/var/tmp/dbx_examples/foo.c”:46,
0x10001214]
3 foo(i = 8) [“/usr/var/tmp/dbx_examples/foo.c”:40,
0x100011d4]
===== interactive function call =====
4 foo2(i = 5) [“/usr/var/tmp/dbx_examples/foo.c”:46,
0x10001214]
55
Chapter 5: Examining and Changing Data
5 foo(i = 4) [“/usr/var/tmp/dbx_examples/foo.c”:40,
0x100011d4]
6 main(argc = 1, argv = 0xffffffad78) [“/usr/var/tmp/src/
dbx_examples/test4.c”:25, 0x10000fa0]
7 __start() [“/shamu/lib/libc/libc_64/csu/
crt1text.s”:137, 0x10000f34]
To set a conditional breakpoint, for example, type:
(dbx) stop in foo if j == 7
Process
0: [3] stop in foo if j==7
If j is not within the scope of foo, then you will receive an error message if
you attempt to call foo interactively. To prevent this, disable or delete any
such breakpoints, conditional commands, or traces before executing the
interactive function call.
C++ Considerations
Debugging a program written in C++ is somewhat different from debugging
programs written in other languages. This section describes these
differences.
Accessing C++ Member Variables
Typically you use standard C++ syntax to access member variables of
objects. For example, if the string _name is a member variable of the object
myWindow, you can print its value by entering:
(dbx) print myWindow._name
0x1001dc1c = “MenuWindow”
To display a static member variable for a C++ class, you must specify the
variable with the class qualifier. For example, to print the value of the static
member variable costPerShare of the class CoOp, enter:
(dbx) print CoOp::costPerShare
25.0
56
C++ Considerations
Referring to C++ Functions
For the purpose of dbx debugging, functions in C++ programs fall into three
general categories:
Member functions
Refers to member functions using the syntax
classname::functionname. For example, refers to the member
function foo in the class Window as Window::foo.
Global C++ functions
Refers to global functions using the syntax ::functionname.
For example, refers to the global function foo as ::foo.
Non-C++ functions
Refers to non-C++ functions using the syntax functionname.
For example, refers to the function printf as printf.
A restriction to keep in mind when using dbx with C++ is that you cannot
distinguish between overloaded functions. For example, consider two
functions:
print(int);
print(float);
The following command sets a breakpoint in both functions:
(dbx) stop in ::print
The following contrived example illustrates various possibilities:
#include <stdio.h>
class foo {
int n;
public:
foo() {n = 0;}
foo(int x);
int bar();
int bar(int);
};
int foo:: bar()
{
return n;
}
57
Chapter 5: Examining and Changing Data
int foo:: bar(int x)
{
return n + x;
}
foo::foo(int x)
{
n = x;
}
int square(int x)
{
return x*x;
}
main()
{
foo a;
foo b = 11;
int x = a.bar();
int y = b.bar(x) + square(x);
printf("y = %d\n", y);
}
If you enter:
(dbx) stop in foo::foo
dbx stops execution in the constructor for the variable b; dbx may stop in the
constructor for the variable a (the ability to stop in an inline function may not
yet be fully implemented).
If you enter:
(dbx) stop in foo::bar
dbx stops execution both when a.bar is called and when b.bar is called,
because dbx is unable to distinguish between the overloaded functions.
To stop in square, enter:
(dbx) stop in ::square
To stop in printf (a C function), enter:
(dbx) stop in printf
58
Chapter 6
6.
Controlling Program Execution
A program typically runs until it exits or encounters an unrecoverable error.
You can use dbx, however, to stop a program under various conditions, step
through your program line by line, stop execution on receiving a signal, and
execute conditional commands based on your program’s status.
This chapter covers:
•
“Setting Breakpoints”
•
“Continuing Execution After a Breakpoint”
•
“Tracing Program Execution”
•
“Writing Conditional Commands”
•
“Managing Breakpoints, Traces, and Conditional Commands”
•
“Using Signal Processing”
•
“Stopping at System Calls”
•
“Stepping Through Your Program”
•
“Starting at a Specified Line”
Setting Breakpoints
Breakpoints allow you to stop execution of your program. Breakpoints can be
unconditional, in which case they always stop your program, or conditional, in
which case they stop your program only if a test condition that you specify
is true.
Note: All breakpoints halt program execution before executing the line on
which they are set. Therefore, if you want to examine the effects of a line of
code, you should set the breakpoint on the line of code following the one
whose effects you want to study.
59
Chapter 6: Controlling Program Execution
Each breakpoint is assigned a number when you create it. Use this number
to reference a breakpoint in the various commands provided for
manipulating breakpoints (for example, disable, enable, and delete, all
described in “Managing Breakpoints, Traces, and Conditional Commands”
on page 70).
Setting Unconditional Breakpoints
To set an unconditional breakpoint, you simply specify the point at which
you want to stop program execution, using one of the following forms of the
stop command:
stop at
Sets a breakpoint at the current source line.
stop at line
Sets a breakpoint at the specified source line in the current
source file.
stop in procedure
Sets a breakpoint to stop execution upon entering the
specified procedure.
stop at file:line
Sets a breakpoint in the specified file at the specified line.
Caution: If your program has multiple source files, be sure to set the
breakpoint in the correct file. To do so, you can explicitly set the source file
using dbx’s file command (see “Changing Source Files” on page 15), or you
can use the func command to go to a source file containing a specified
function (see “Moving to a Specified Procedure” on page 50).
Setting Conditional Breakpoints
An unconditional breakpoint is the simplest type of breakpoint; your
program stops every time it reaches a specified place. On the other hand, a
conditional breakpoint stops your program only if a condition that you
specify is true. The two conditions that you can test are:
60
•
Has the value of a variable or other memory location changed?
•
Is a test expression true?
Setting Breakpoints
Stopping If a Variable or Memory Location Has Changed
By including a variable clause in your stop command, you can cause dbx to
stop if the value of a variable or the contents of a memory location has
changed.
If you provide only a variable name in your variable clause, the breakpoint
stops your program if the value of the variable has changed since the last
time dbx checked it. If instead of a variable name, you provide an expression
of type pointer, dbx checks the data pointed to. If the data pointed to is a
structure, dbx checks that structure. If you provide an expression that’s not
of type pointer, dbx evaluates the expression and uses the result as an
address in memory. The breakpoint stops your program if the contents of the
memory location (32 bits) has changed since the last time dbx checked it.
The points at which dbx checks the value of a variable or memory location
depend on the command that you use to set the breakpoint:
stop [expression|variable]
Inspects the value before executing each source line. If the
expression is of type pointer, look at the data pointed to and
watch until it changes.
If the expression is not of type pointer, look at the 32 bits at
that address (assume the expression evaluates to an
address). For example, consider the command:
stop (struct s*) 0x12345678
This command checks the contents of the structure located
at 0x12345678.
stop [expression|variable] at line
Inspects the value at the given source line. Stops if the value
has changed.
If the expression is of type pointer, look at the data pointed
to and watch until it changes. If the expression is not of type
pointer, look at the 32 bits at that address (assume the
expression evaluates to an address).
61
Chapter 6: Controlling Program Execution
stop [expression|variable] in procedure
Inspects the value at every source line within a given
procedure. Stops if the value has changed.
If the expression is of type pointer, look at the data pointed
to and watch until it changes.
If the expression is not of type pointer, look at the 32 bits at
that address (assume the expression evaluates to an
address).
Using Fast Watchpoints
You can use fast watchpoints with the stop command. A fast watchpoint
watches a specified variable or memory address without severely impacting
the performance of the program being debugged.
In previous versions of dbx, the debugger had to single-step the process
being debugged and check if the value of a variable had changed after each
instruction. With fast watchpoints, the debugger uses a hardware virtual
memory write protect mechanism to allow the program to run freely until
the variable being watched changes. The program being debugged stops
only when the virtual memory page containing the variable is written to. If
the value of the variable being watched does not changed, dbx continues the
execution of the process. If a write modifies a watched variable, dbx notifies
you of the change.
Consider a small program that contains a global variable called global:
stop global
This command causes the program to stop if the value of the variable global
changes. The program runs virtually at full speed until global gets assigned
a new value. Similarly, consider the command:
stop 0x100100
This command stops when the 32- bit integer residing at address 0x100100
is modified, and runs at nearly full speed until the value changes. This form
of the stop command is useful for watching the contents of anonymous
memory, such as the memory returned by malloc().
62
Setting Breakpoints
dbx still needs to use the single-step approach if the stop command contains
an expression to watch, such as in stop if global == 1. The performance
of the debugged program can be greatly enhanced by including a variable to
watch in the stop command.
For example, the previous stop command can be expressed equivalently as
stop global if global == 1. This instructs the debugger to check only
the expression global == 1 if the value of global changes. For situations
where the expression does not depend upon a particular variable getting
modified such as stop if global == x * 3, the single-step approach is the
only way to achieve the desired behavior.
Stopping If a Test Expression Is True
By including a test clause in your stop command, you can cause dbx to stop
if the value of an expression is true. You can use any valid numerical
expression as a test. If the result of the expression is nonzero, the expression
is true and the test is successful.
The point at which dbx evaluates the test expression depends on the
command that you use to set the breakpoint:
stop if expression
Evaluates the expression before executing each source line.
Note that execution is very slow if you choose this type of
conditional breakpoint.
stop at line if expression
Evaluates the expression at the given line.
stop in procedure if expression
Evaluates the expression at every source line within a given
procedure.
Conditional Breakpoints Combining Variable and Test
Clauses
You can create conditional breakpoints that combine both variable and test
clauses. In these cases, the overall test evaluates to true only if both clauses
are true.
63
Chapter 6: Controlling Program Execution
The following forms of the stop command combine both the variable and test
clauses:
stop [expression1|variable] if expression2
Tests both conditions before executing each source line.
Stops if both conditions are true.
If expression1 is of type pointer, look at the data pointed to
and watch until it changes. If expression1 is not of type
pointer, look at the 32 bits at that address (assume the
expression evaluates to an address).
stop [expression1|variable] at line if expression2
Tests both conditions at the given source line. Stops if both
conditions are true.
If expression1 is of type pointer, look at the data pointed to
and watch until it changes. If expression1 is not of type
pointer, look at the 32 bits at that address (assume the
expression evaluates to an address).
stop [expression1|variable] in procedure if expression2
Tests both conditions at every source line within a given
procedure. Stops if both conditions are true.
If expression1 is of type pointer, look at the data pointed to
and watch until it changes. If expression1 is not of type
pointer, look at the 32 bits at that address (assume the
expression evaluates to an address).
Continuing Execution After a Breakpoint
The cont command allows you to continue execution after any type of
breakpoint. In its simplest form, program execution continues until the end
of the program or until another breakpoint is reached. You can also tell dbx
to continue your program until it reaches a given line or procedure; this is
similar to setting a temporary, “one-shot” breakpoint and then continuing.
The syntax of the cont command is:
cont
64
Continues execution with the current line.
Tracing Program Execution
cont {at | to} line
Sets a temporary breakpoint at the specified source line,
then resumes execution with the current line. When your
program reaches the breakpoint at line, dbx stops your
program and deletes the temporary breakpoint. The
keywords at and to are equivalent.
cont in procedure
Sets a temporary breakpoint to stop execution upon
entering the specified procedure, then resumes execution
with the current line. When your program reaches the
breakpoint in procedure, dbx stops your program and
deletes the temporary breakpoint.
If your program stopped because dbx caught a signal intended for your
program, then dbx will send that signal to your program when you continue
execution. You can also explicitly send a signal to your program when you
continue execution. Sending signals to your program upon continuation is
discussed in “Continuing After Catching a Signal” on page 75.
When you debug multiprocess programs, the resume command can be more
helpful than the cont command. Refer to “Resuming a Suspended Process”
on page 102 for more information about the resume command.
Tracing Program Execution
The trace command allows you to observe the progress of your program as
it executes. With it, you can print:
•
values of variables at specific points in your program or whenever
variables change value
•
parameters passed to and values returned from functions
Each trace is assigned a number when you create it. Use this number to
reference the trace in the various commands provided for manipulating
traces (for example, disable, enable, and delete, all described in “Managing
Breakpoints, Traces, and Conditional Commands” on page 70).
65
Chapter 6: Controlling Program Execution
The syntax of the trace command is:
trace variable Whenever the specified variable changes, dbx prints the old
and new values of that variable.
trace procedure
Prints the values of the parameters passed to the specified
procedure whenever your program calls it. Upon return,
dbx prints the return value.
trace [expression|variable] at line
Whenever your program reaches the specified line, dbx
prints the value of the variable if its value has changed.
If the expression is of type pointer, look at the data pointed
to and watch until it changes. If the expression is not of type
pointer, look at the 32 bits at that address (assume the
expression evaluates to an address).
trace [expression|variable] in procedure
Whenever the variable changes within the procedure, dbx
prints the old and new values of that variable.
If the expression is of type pointer, look at the data pointed
to and watch until it changes. If the expression is not of type
pointer, look at the 32 bits at that address (assume the
expression evaluates to an address).
trace [expression1|variable] at line if expression2
Prints the value of the variable (if changed) whenever your
program reaches the specified line and the given expression
is true.
If expression1 is of type pointer, look at the data pointed to
and watch until it changes. If expression1 is not of type
pointer, look at the 32 bits at that address (assume the
expression evaluates to an address).
trace [expression1|variable] in procedure if expression2
Whenever the variable changes within the procedure that
you specify, dbx prints the old and new values of that
variable, if the given expression is true.
If expression1 is of type pointer, look at the data pointed to
66
Tracing Program Execution
and watch until it changes. If expression1 is not of type
pointer, look at the 32 bits at that address (assume the
expression evaluates to an address).
To examine the parameters passed to and values returned from a function,
you can trace that function. For example, if the function name is foo, set the
trace by entering:
(dbx) trace foo
When you execute your program, dbx prints the values of the parameters
passed to foo whenever your program calls it. Upon return from foo, dbx
prints the return value:
(dbx) run
[3] calling foo(text = 0x10000484 = "Processing...\n", i =
4) from function main
[4] foo returning -1 from foo
In the example shown above, foo receives two parameters: a character string
variable named text containing the value “Processing...\n” and an integer
variable named i containing the value 4. The trace also indicates that foo
returns a value of -1.
You can also examine a variable as it changes values. For example, you can
monitor the value of a string variable named curarg as you use it to process
an argument list. To set the trace, enter:
(dbx) trace curarg
Process 2395: [6] trace .test.main.curarg in main
When you set a trace on a variable, examine the confirmation that dbx prints.
If you use the same variable name in multiple functions in your program,
dbx may not set the trace on the variable that you want. If dbx sets the trace
on an incorrect variable, delete the trace and set a new trace using a qualified
variable format as described in “Qualifying Variable Names” on page 39.
For more information on deleting traces, see “Deleting Breakpoints, Traces,
and Conditional Commands” on page 73.
So, in this example, if you use the variable curarg in both main and a function
called arg_process, and you want to trace the curarg in arg_process, first
delete this trace and then set a new trace:
(dbx) delete 6
67
Chapter 6: Controlling Program Execution
(dbx) trace arg_process.curarg
Process 2395: [7] trace .test.arg_process.curarg in
arg_process
When you execute your program, whenever curarg changes, dbx prints its
old and new values:
(dbx) run
[7] curarg changed before
new value
[7] curarg changed before
old value
new value
[7] curarg changed before
old value
new value
[7] curarg changed before
old value
new value
[arg_process: line 53]:
= (nil);
[arg_process: line 86]:
= 0;
= 0x7fffc7e5 = "-i";
[arg_process: line 86]:
= 2147469285;
= 0x7fffc7eb = "names.out";
[arg_process: line 86]:
= 2147469291;
= 0x7fffc7f5 = "names.in";
Writing Conditional Commands
A conditional command created with the when command is similar to a
breakpoint set with the stop command, except that rather than stopping
when certain conditions are met, dbx executes a list of commands. The
command list can consist of any dbx commands, separated by semicolons if
you include more than one command in the command list. Additionally, you
can use the keyword stop in the command list to stop execution, just like a
breakpoint.
Each conditional command is assigned a number when you create it. You use
this number to reference the conditional command in the various commands
provided for manipulating conditional commands (for example, disable,
enable, and delete, all described in “Managing Breakpoints, Traces, and
Conditional Commands” on page 70).
The syntax of the when command is:
when [expression|variable] {command-list}
Inspects the value before executing each source line. If it has
changed, executes the command list.
68
Writing Conditional Commands
If the expression is of type pointer, look at the data pointed
to and watch until it changes. If the expression is not of type
pointer, look at the 32 bits at that address (assume the
expression evaluates to an address).
when [expression|variable] at line {command-list}
Inspects the value at the given source line. If it has changed,
executes the command list.
If the expression is of type pointer, look at the data pointed
to and watch until it changes. If the expression is not of type
pointer, look at the 32 bits at that address (assume the
expression evaluates to an address).
when [expression|variable] in procedure {command-list}
Inspects the value at every source line within a given
procedure. If it has changed, executes the command list.
If the expression is of type pointer, look at the data pointed
to and watch until it changes. If the expression is not of type
pointer, look at the 32 bits at that address (assume the
expression evaluates to an address).
when if expression {command-list}
Evaluates the expression before executing each source line.
If it is true, executes the command list. Note that execution
is slow if you choose this type of conditional command
execution.
when at line if expression {command-list}
Evaluates the expression at the given line. If it is true,
executes the command list.
when in procedure if expression {command-list}
Evaluates the expression at every source line within a given
procedure. If it is true, executes the command list.
when [expression1|variable] if expression2 {command-list}
Checks if the value of the variable has changed. If it has
changed and the expression is true, executes the command
list.
If expression1 is of type pointer, look at the data pointed to
69
Chapter 6: Controlling Program Execution
and watch until it changes. If expression1 is not of type
pointer, look at the 32 bits at that address (assume the
expression evaluates to an address).
when [expression1|variable] at line if expression2 {command-list}
Checks if the value of the variable has changed each time
the line is executed. If the value has changed and the
expression is true, executes the command list.
If expression1 is of type pointer, look at the data pointed to
and watch until it changes. If expression1 is not of type
pointer, look at the 32 bits at that address (assume the
expression evaluates to an address).
when [expression1|variable] in procedure if expression2 {commandlist}
Checks if the value of variable has changed at each source
line of the given procedure. If the value has changed and the
expression is true, executes the command list.
If expression1 is of type pointer, look at the data pointed to
and watch until it changes. If expression1 is not of type
pointer, look at the 32 bits at that address (assume the
expression evaluates to an address).
Managing Breakpoints, Traces, and Conditional Commands
dbx provides commands that allow you to disable, enable, delete, and
examine the status of the breakpoints, traces, and conditional commands
that you set in your programs.
Each breakpoint, trace, and conditional command is assigned a number
when you create it. Use these numbers as identifiers in the various
commands provided for manipulating these debugging controls.
70
Managing Breakpoints, Traces, and Conditional Commands
Listing Breakpoints, Traces, and Conditional Commands
The status command lists all of the breakpoints, traces, and conditional
commands that you have set and indicates whether they are enabled or
disabled.
For example, consider executing the following commands while debugging
a program called test:
(dbx) stop in foo
Process
0: [3] stop in foo
(dbx) r
Process 22631 (test) started
[3] Process 22631 (test) stopped at [foo:38 ,0x10001050]
38 r = foo2(i+1);
(dbx) trace total
Process 22631: [4] trace total in foo
(dbx) when at 60 {print i,j }
Process 22631: [5] when at “/usr/var/tmp/dbx_examples/
test.c”:60 { print i, j }
If you enter status, you see the following:
(dbx) status
Process 22631: [3]
Process 22631: [4]
Process 22631: [5]
test.c”:60 { print
stop in foo
trace total in foo
when at “/usr/var/tmp/dbx_examples/
i, j }
Disabling Breakpoints, Traces, and Conditional
Commands
The disable command allows you to temporarily disable a breakpoint, trace,
or conditional command so that it is inoperative and has no effect on
program execution. dbx remembers all information about a disabled
breakpoint, trace, or conditional command, and you may enable it using the
enable command described in “Enabling Breakpoints, Traces, and
Conditional Commands” on page 72.
71
Chapter 6: Controlling Program Execution
The syntax of the disable command is:
disable item [, item ... ]
Disables the specified breakpoint(s), trace(s), or conditional
command(s). This command has no effect if the item you
specify is already disabled.
For example, to disable the conditional command set in “Listing
Breakpoints, Traces, and Conditional Commands” on page 71 enter:
(dbx) disable 4
If you enter status, you see the following:
(dbx) status
Process 22631: [3]
Process 22631: [4]
Process 22631: [5]
test.c”:60 { print
stop in foo
(disabled) trace total in foo
when at “/usr/var/tmp/dbx_examples/
i, j
Enabling Breakpoints, Traces, and Conditional
Commands
The enable command reverses the effects of a disable command: The
breakpoint, trace, or conditional command that you specify is enabled and
once again affects the execution of your program. The syntax of the enable
command is:
enable item [, item ...]
Enables the specified breakpoint(s), trace(s), or conditional
command(s).
For example, to enable the conditional command disabled in “Disabling
Breakpoints, Traces, and Conditional Commands” on page 71, enter:
(dbx) enable 4
Executing the status command shows that the condition command is now
enabled:
(dbx) status
Process 22631: [3] stop in foo
Process 22631: [4] trace total in foo
72
Using Signal Processing
Process 22631: [5] when at “/usr/var/tmp/dbx_examples/
test.c”:60 { print i, j
Deleting Breakpoints, Traces, and Conditional Commands
The delete command allows you to delete breakpoints, traces, and
conditional commands:
delete {item [, item ...] | all}
Deletes the item or items specified. If you use the keyword
all instead of listing individual items, dbx deletes all
breakpoints, traces, and conditional commands.
For example, to delete the breakpoint and trace set in “Listing Breakpoints,
Traces, and Conditional Commands” on page 71, enter:
(dbx) delete 3, 4
If you enter status, you see the following:
(dbx) status
Process 22631: [5] when at “/usr/var/tmp/dbx_examples/
test.c”:60 { print i, j }
To delete all breakpoints, traces, and conditional commands, enter:
(dbx) delete all
Using Signal Processing
dbx can detect any signals sent to your program while it is running and, at
your option, stop the program.
Catching and Ignoring Signals
With the catch command, you can instruct dbx to stop your program when it
receives any specified signal. The ignore command undoes the effects of a
catch command.
73
Chapter 6: Controlling Program Execution
The catch and ignore commands have the following syntax:
catch {signal | all}
Instructs dbx to stop your program whenever it receives the
specified signal. If you use the keyword all rather than
giving a specific signal, dbx catches all signals.
ignore {signal | all}
Instructs dbx to ignore the specified signal. All ignored
signals are passed to your program normally. If you use the
keyword all rather than giving a specific signal, dbx ignores
all signals.
catch
Prints a list of all signals caught.
ignore
Prints a list of all signals ignored.
You can use the signal names and numbers as listed in the signal(2) reference
page. You can also abbreviate the signal names by omitting the “SIG”
portion of the name. You can use uppercase or lowercase for the signal
names.
Note: Because “int” (in lowercase) is a dbx keyword, you cannot use it as an
abbreviation for the SIGINT signal. You must use uppercase (“INT”), the full
signal name (“SIGINT” or “sigint”), or the signal number (“2”). SIGINT is
the only signal name with such a restriction.
If you instruct dbx to catch a signal, whenever that signal is directed to your
program, dbx intercepts it and stops your program. Your program does not
see this signal until you continue your program with the cont command. If
your program did not declare a signal handler for a signal, your program
does not see the signal when dbx continues it.
If you issue a SIGINT signal at the keyboard (usually by pressing <Ctrl-C>)
while you are running an application under dbx, what happens depends on
the circumstances:
74
•
If the process is in the same IRIX process group as dbx, the interrupt
signal is sent to both dbx and the process. Both dbx and the process stop
running. You are left at the dbx command line.
•
If the process was added with addproc, dbx –P, or dbx –p, it is not in
the same IRIX process group as dbx. In this case, the signal interrupt is
sent to dbx but not to the process. dbx stops running, but the process
Using Signal Processing
continues to run. Use the showproc command to see whether the process
is still running. Then use the suspend command to stop the process.
Continuing After Catching a Signal
The cont command allows you to continue execution after catching a signal.
You can also use the cont command to specify a different signal to send to
your program than the one that dbx caught. Using the same syntax, you can
also send a signal to your program when you continue, even if your program
did not stop because of a caught signal.
Use the following forms of the cont command when handling signals. In
each case, if you do not provide a signal, but your program stopped because
dbx caught a signal intended for your program, then dbx sends that signal to
your program when you continue execution:
cont [signal]
Continues execution with the current line and sends the
specified signal to your program.
cont [signal] {at | to} line
Sets a temporary breakpoint at the specified source line,
then resumes execution with the current line and sends the
specified signal to your program.
cont [signal] in procedure
Sets a temporary breakpoint to stop execution upon
entering the specified procedure, then resumes execution
with the current line and sends the specified signal to your
program.
For example, if your program stopped because dbx caught a SIGINT signal,
dbx will automatically send that signal to your program, if you enter:
(dbx) cont
Suppose you have a procedure called alarm_handler to handle an alarm
signal sent to your program. If you want to test this procedure by singlestepping through it, you can execute the following command:
(dbx) cont SIGALRM in alarm_handler
This sets a temporary breakpoint to stop your program upon entering
alarm_handler, continues execution of your program, and sends a
75
Chapter 6: Controlling Program Execution
SIGALRM signal to your program. Your program then enters the
alarm_handler procedure and stops. You can then single-step through the
procedure and observe execution.
Debugging a program that attempts to catch signals can be awkward if you
also catch the signal in dbx. For example, if your program wants to catch
SIGFPEs and you issue the command:
(dbx) catch sigfpe
Then, after dbx catches the signal, you must execute the command:
(dbx) ignore sigfpe
This prevents dbx from catching the signal again when you resume execution
of your program.
If you want to catch further instances of that signal in your program, you
must regain dbx control (the best way is to set a breakpoint before executing
the cont) to re-execute the catch sigfpe command.
Stopping at System Calls
Because system calls are part of the operating system and their source is
generally not available for debugging purposes, you cannot set breakpoints
in system calls using the same method that you use for your program’s
procedures. Instead, dbx provides the syscall command to allow you to stop
your program when it executes system calls. With the syscall command you
can catch (breakpoint) system calls either at the entry to the system call or at
the return from the system call.
The syntax of the syscall command is:
syscall catch {call | return} {system_call | all}
Sets a breakpoint to stop execution upon entering (call) or
returning from (return) the specified system call. Note that
you can set dbx to catch both the call and the return of a
system call.
If you use the keyword all rather than giving a specific
system call, dbx catches all system calls.
76
Stopping at System Calls
syscall ignore {call | return} {system_call | all}
Clears the breakpoint to stop execution upon entering (call)
or returning from (return) the specified system call.
If you use the keyword all rather than giving a specific
system call, dbx clears the breakpoints to stop execution
upon entering (call) or returning from (return) all system
calls.
syscall catch [{call | return}]
Prints a list of all system calls caught upon entry (call) or
return (return). If you provide neither the call nor return
keyword, dbx lists all system calls that are caught.
syscall ignore [{call | return}]
Prints a list of all system calls not caught upon entry (call)
or return (return). If you provide neither the call nor return
keyword, dbx lists all system calls that are ignored.
syscall
Prints a summary of the catch and ignore status of all
system calls. The summary is divided into four sections:
1) caught at call, 2) caught at return, 3) ignored at call, and
4) ignored at return.
Note: The fork and sproc system calls are treated specially as they invoke
new processes. The returns from these system calls are controlled by the dbx
variables $promptonfork and $mp_program, not by syscall. This is discussed in
“Handling fork System Calls” on page 104 and “Handling sproc System
Calls and Process Group Debugging” on page 107.The execv and execve
system calls are treated specially as they change a process into a new
program. For more information, see “Handling exec System Calls” on
page 106.
The system calls are listed in /usr/include/sys.s. dbx ignores the case of the
system call names in all syscall commands; therefore, you can use uppercase
or lowercase in these commands.
A particularly useful setting is:
(dbx) syscall catch call exit
This stops your program upon entry to exit. With your program stopped,
you can do a stack trace before the termination to see why exit was called.
77
Chapter 6: Controlling Program Execution
Stepping Through Your Program
Stepping is a process of executing your program for a fixed number of lines
and then automatically returning control to dbx. dbx provides two
commands for stepping through lines of code: step and next.
For both step and next, dbx counts only those source lines that actually
contain code; for the purposes of stepping, dbx ignores blank lines and lines
consisting solely of comments.
The next and step commands differ in their treatment of procedure calls.
When step encounters a procedure call, it usually “steps into” the procedure
and continues stepping through the procedure (counting each line of
source). On the other hand, when next encounters a procedure call, it “steps
over” the procedure—executing it without stopping but not counting lines
in the procedure—and continues stepping through the current procedure.
The following code fragment illustrates the difference between step and next:
55
56
57
58
...
78
79
...
211
212
foo( arg1, arg2 )
int arg1, arg2;
{
if ( arg1 < arg2 ) {
...
return( 0 );
}
x = foo( i, j );
y = 2 * x;
In this example, if at line 211 you execute a step command to advance one
line, dbx allows the process to proceed to line 58 (the first code line of the foo
procedure). However, if you execute a next command, dbx executes line
211—calling foo—and advances the process to line 212.
78
Stepping Through Your Program
Stepping Using the step Command
The format of the step command is:
step [integer]
Executes the specified number of lines of source code,
stepping into procedures. If you do not provide an
argument, step executes one line. If step encounters any
breakpoints, it immediately stops execution.
By default, step steps into only those procedures that are compiled with the
debugging option –g. Note that this does not include standard library
routines because they are not compiled using debugging options.
You can modify this behavior, even force dbx to step into procedures not
compiled with full debugging information, by changing the value of the dbx
variable $stepintoall. Table 6-1 summarizes how the value of $stepintoall
affects dbx’s treatment of the step command.
Table 6-1
Effect of $stepintoall Variable on the step Command
$stepintoall
value
Effect on step Command
0 (default)
step steps into only those procedures that are compiled with the
debugging option –g. step steps over all other procedures.
1 or 2
step steps into all procedures. Note that when you debug a
source file compiled without symbols or compiled with
optimization, the line numbers may sometimes jump erratically.
Also note that if dbx cannot locate a source file, then it cannot
display source lines as you step through a procedure.
Stepping Using the next Command
The format of the next command is:
next [integer]
Executes the specified number of lines of source code,
stepping over procedures. If you do not provide an
argument, next executes one line. If next encounters any
breakpoints, even in procedures that it steps over, it
immediately stops execution.
79
Chapter 6: Controlling Program Execution
Using the return Command
If you step into a procedure and then decide you don’t want to step through
the rest of it, use return to finish executing the procedure and return to the
calling procedure.
The format of the return command is:
return
Continues execution until control returns to the procedure
that invoked the return command.
return proc
Continues execution until control returns to the named
procedure. Execution continues, unless stopped by a
breakpoint, until the latest invocation of the procedure
named by proc at the time the command was issued is
reached. Execution doesn’t stop at subsequent invocations
of the same procedure. The search for the frame to return to
starts with the previous frame, because the current frame is
skipped in looking for a frame whose name matches proc. If
execution is stopped for any reason, this command is
cancelled.
Starting at a Specified Line
When you continue your program, you typically do so at the place where it
stopped using the cont command. However, you can also force your
program to continue at a different address by using the goto command:
goto line
80
Begins execution at the specified line. You may not use the
goto command to resume execution with a line outside of
the current procedure.
Chapter 7
7.
Debugging Machine Language Code
This chapter explains how to debug machine language code by:
•
“Examining and Changing Register Values”
•
“Examining Memory and Disassembling Code”
•
“Setting Machine-Level Breakpoints”
•
“Continuing Execution After a Machine-Level Breakpoint”
•
“Tracing Execution at the Machine Level”
•
“Writing Conditional Commands at the Machine Level”
•
“Stepping Through Machine Code”
Examining and Changing Register Values
Using dbx, you can examine and change the hardware registers during
execution of your program. Table 7-1 lists the machine form of the register
names and the alternate software names as defined in the include file
regdef.h.
Table 7-1
Hardware Registers and Aliases
Register
Software Name
Description
$r0
$zero
Always 0
$r1
$at
Reserved for assembler
$r2... $r3
$v0... $v1
Expression evaluations, function return
values, static links
$r4... $r7
$a0... $a3
Arguments
81
Chapter 7: Debugging Machine Language Code
Table 7-1 (continued)
Hardware Registers and Aliases
Register
Software Name
Description
$r8... $r11
$t0... $t7
Temporaries (32 bit)
$a4... $a7,
$ta0... $ta3
Arguments (64 bit)
$t4... $t7,
$t0... $t3
$ta0... $ta3
Temporaries (32 bit)
$r16... $r23
$s0... $s7
Saved across procedure calls
$r24... $r25
$t8... $t9
Temporaries
$r26... $r27
$k0... $k1
Reserved for kernel
$r28
$gp
Global pointer
$r29
$sp
Stack pointer
$r30
$s8
Saved across procedure calls
$r31
$ra
Return address
$r12... $r15
Temporaries (64 bit)
$mmhi
Most significant multiply/divide result
register
$mmlo
Least significant multiply/divide result
register
$fcsr
Floating point control and status register
$feir
Floating point exception instruction register
$cause
Exception cause register
$d0, $d2, ... $d30
Double precision floating point registers
(32 bit)
(64 bit)
$d0, $d2, ... $d31
$f0, $f2, ... $f30
$f0, $f1, ... $f31
Single precision floating point registers
(32 bit)
(64 bit)
For registers with alternate names, the dbx variable $regstyle controls which
name is displayed when you disassemble code (as described in “Examining
82
Examining and Changing Register Values
Memory and Disassembling Code” on page 85). If $regstyle is set to 0, then
dbx uses the alternate form of the register name (for example, “zero” instead
of “r0,” and “t1” instead of “r9”); if $regstyle is anything other than 0, the
machine names are used (“r0” through “r31”).
Printing Register Values
Use the printregs command to print the values stored in all registers.
The base in which the register values are displayed depends on the values of
the dbx variables $octints and $hexints. By default, dbx prints the register
values in decimal. You can set the output base to octal by setting the dbx
variable $octints to a nonzero value. You can set the output base to
hexadecimal by setting the dbx variable $hexints to a nonzero value. If you
set both $octints and $hexints to nonzero values, $hexints takes precedence.
To examine the register values in hexadecimal, enter the following:
(dbx) set $hexints = 1
(dbx) printregs
r0/zero=0x0
r1/at=0x19050
r2/v0=0x8
r3/v1=0x100120e0
r4/a0=0x4
r5/a1=0xffffffad78
r6/a2=0xffffffad88
r7/a3=0x0
r8/a4=0x10
r9/a5=0x20
r10/a6=0x0
r11/a7=0xfbd5990
r12/t0=0x0
r13/t1=0x0
r14/t2=0x65
r15/t3=0x0
r16/s0=0x1
r17/s1=0xffffffad78
r18/s2=0xffffffad88
r19/s3=0xffffffaf70
r20/s4=0x0
r21/s5=0x0
r22/s6=0x0
r23/s7=0x0
r24/t8=0x0
r25/t9=0x10001034
r26/k0=0x0
r27/k1=0x20
r28/gp=0x1001a084
r29/sp=0xffffffaca0
r30/s8=0x0
r31/ra=0x1000110c
mdhi=0x0
mdlo=0xe0
cause=0x24
pc=0x10001050
fpcsr=0x0
f0=0.0000000e+00
f1=0.0000000e+00
f3=0.0000000e+00
f4=0.0000000e+00
f2=0.0000000e+00
f5=0.0000000e+00
83
Chapter 7: Debugging Machine Language Code
f6=0.0000000e+00
f7=0.0000000e+00
f8=0.0000000e+00
f9=0.0000000e+00
f10=0.0000000e+00
f11=0.0000000e+00
f12=0.0000000e+00
f13=0.0000000e+00
f14=0.0000000e+00
f15=0.0000000e+00
f16=0.0000000e+00
f17=0.0000000e+00
f18=0.0000000e+00
f19=0.0000000e+00
f20=0.0000000e+00
f21=0.0000000e+00
f22=0.0000000e+00
f23=0.0000000e+00
f24=0.0000000e+00
f25=0.0000000e+00
f26=0.0000000e+00
f27=0.0000000e+00
f28=0.0000000e+00
f29=0.0000000e+00
f30=0.0000000e+00
f31=0.0000000e+00
d0=0.000000000000000e+00
d1=0.000000000000000e+00
d2=0.000000000000000e+00
d3=0.000000000000000e+00
d4=0.000000000000000e+00
d5=0.000000000000000e+00
d6=0.000000000000000e+00
d7=0.000000000000000e+00
d8=0.000000000000000e+00
d9=0.000000000000000e+00
d10=0.000000000000000e+00
d11=0.000000000000000e+00
d12=0.000000000000000e+00
d13=0.000000000000000e+00
d14=0.000000000000000e+00
d15=0.000000000000000e+00
d16=0.000000000000000e+00
d17=0.000000000000000e+00
d18=0.000000000000000e+00
d19=0.000000000000000e+00
d20=0.000000000000000e+00
d21=0.000000000000000e+00
d22=0.000000000000000e+00
d23=0.000000000000000e+00
d24=0.000000000000000e+00
d25=0.000000000000000e+00
d26=0.000000000000000e+00
d27=0.000000000000000e+00
d28=0.000000000000000e+00
d29=0.000000000000000e+00
d30=0.000000000000000e+00
d31=0.000000000000000e+00
(Note that there are twice as many floating point registers with 64-bit
programs.) You can also use the value of a single register in an expression by
typing the name of the register preceded by a dollar sign ($).
For example, to print the current value of the program counter (the pc
register), enter:
(dbx) printx $pc
0x10001050
Changing Register Values
In the same way you change the values of program variables, you can use
the assign command to change the value of registers:
84
Examining Memory and Disassembling Code
assign register = expression
Assigns the value of expression to register. You must precede
the name of the register with a dollar sign ($).
For example:
(dbx) assign $f0 = 3.14159
3.1415899999999999
(dbx) assign $t3 = 0x5a
0x5a
By default, the assign register command changes the register value in the
current activation level, which is a typical operation. To force the hardware
register to be updated regardless of the current activation level, use the $ set
$framereg command.
Examining Memory and Disassembling Code
The forward slash (/) and question mark (?) commands allow you to
examine the contents of memory. Depending on the format you specify, you
can display the values as numbers, characters, or disassembled machine
code. Note that all common forms of address are supported. Some unusual
expressions may not be accepted unless enclosed in parentheses, as in
(address)/count format.
The commands for examining memory have the following syntax:
address / count format
Prints the contents of the specified address, or disassembles
the code for the instruction at the specified address. Repeat
for a total of count addresses in increasing address—in other
words, an “examine forward” command. The format codes
are listed in Table 7-2.
address ? count format
Prints the contents of the specified address or, disassembles
the code for the instruction at the specified address. Repeat
for a total of count addresses in decreasing address—in
other words, an “examine backward” command. The
format codes are listed in Table 7-2.
85
Chapter 7: Debugging Machine Language Code
address / count L value mask
Examines count 32-bit words in increasing addresses; prints
those 32-bit words which, when ORed with mask, equals
value. This command searches memory for specific patterns.
./
Repeats the previous examine command with increasing
address.
.?
Repeats the previous examine command with decreasing
address.
Table 7-2
86
Memory Display Format Codes
Format Code
Displays Memory in the Format
i
print machine instructions (disassemble)
d
print a 16-bit word in signed decimal
D
print a 32-bit word in signed decimal
dd
print a 64-bit word in signed decimal
o
print a 16-bit word in octal
O
print a 32-bit word in octal
oo
print a 64-bit word in octal
x
print a 16-bit word in hexadecimal
X
print a 32-bit word in hexadecimal
xx
print a 64-bit word in hexadecimal
v
print a 16-bit word in unsigned decimal
V
print a 32-bit word in unsigned decimal
vv
print a 64-bit word in unsigned decimal
L
like X but use with val mask
b
print a byte in octal
c
print a byte as character
s
print a string of characters that ends in a null byte
Examining Memory and Disassembling Code
Table 7-2 (continued)
Memory Display Format Codes
Format Code
Displays Memory in the Format
f
print a single-precision real number
g
print a double-precision real number
For example, to display 10 disassembled machine instructions starting at the
current address of the program counter, enter:
(dbx) $pc/10i
*[main:26, 0x400290]
[main:27, 0x400294]
[main:29, 0x400298]
[main:29, 0x40029c]
[main:29, 0x4002a0]
[main:29, 0x4002a4]
[main:29, 0x4002a8]
[main:29, 0x4002ac]
[main:31, 0x4002b0]
[main:31, 0x4002b4]
sw
sw
lw
lw
nop
slt
beq
nop
lw
nop
zero,28(sp)
zero,24(sp)
t1,28(sp)
t2,32(sp)
at,t1,t2
at,zero,0x4002ec
t3,28(sp)
To disassemble another 10 lines, enter:
(dbx) ./
[main:31,
[main:31,
[main:32,
[main:32,
[main:32,
[main:32,
[main:32,
[main:33,
[main:33,
[main:33,
0x4002b8]
0x4002bc]
0x4002c0]
0x4002c4]
0x4002c8]
0x4002cc]
0x4002d0]
0x4002d4]
0x4002d8]
0x4002dc]
addiu
sw
lw
lw
nop
addu
sw
lw
lw
nop
t4,t3,1
t4,28(sp)
t5,24(sp)
t6,28(sp)
t7,t5,t6
t7,24(sp)
t8,28(sp)
t9,32(sp)
To examine ten 32-bit words starting at address 0x7fffc754, and print those
whose least significant byte is hexadecimal 0x19, enter:
(dbx) 0x7fffc754 / 10 L 0x19 0xff
7fffc758: 00000019
87
Chapter 7: Debugging Machine Language Code
Consider a single-precision floating point array named array. You can
examine the six consecutive elements, beginning with the fifth element, by
entering:
(dbx) &array[4] / 6f
7fffc748: 0.2500000 0.2000000 0.1666667 0.1428571
7fffc758: 0.1250000 0.1111111
Setting Machine-Level Breakpoints
dbx allows you to set breakpoints while debugging machine code just as you
can while debugging source code. You set breakpoints at the machine code
level using the stopi command.
The conditional and unconditional versions of the stopi commands work in
the same way as the stop command described in “Setting Breakpoints” on
page 59, with these exceptions:
•
The stopi command checks its breakpoint conditions on a machineinstruction level instead of a source-code level.
•
The stopi at command requires an address rather than a line number.
Each breakpoint is assigned a number when you create it. Use this number
to reference the breakpoint in the various commands provided for
manipulating breakpoints (for example, disable, enable, and delete, all
described in “Managing Breakpoints, Traces, and Conditional Commands”
on page 70).
Syntax of the stopi Command
The syntax of the stopi command is:
stopi at
Sets an unconditional breakpoint at the current instruction.
stopi at address
Sets an unconditional breakpoint at the specified address.
stopi in procedure
Sets an unconditional breakpoint to stop execution upon
entering the specified procedure.
88
Setting Machine-Level Breakpoints
stopi [expression|variable]
Inspects the value before executing each machine
instruction and stops if the value has changed.
If the expression is of type pointer, look at the data pointed
to and watch until it changes. If the expression is not of type
pointer, look at the 32 bits at that address (assume the
expression evaluates to an address).
stopi [expression|variable] at address
Inspects the value when the program is at the given address
and stops if the value has changed (for machine-level
debugging).
If the expression is of type pointer, look at the data pointed
to and watch until it changes. If the expression is not of type
pointer, look at the 32 bits at that address (assume the
expression evaluates to an address).
stopi [expression|variable] in procedure
Inspects the value at every machine instruction within a
given procedure and stops if the value has changed.
If the expression is of type pointer, look at the data pointed
to and watch until it changes. If the expression is not of type
pointer, look at the 32 bits at that address (assume the
expression evaluates to an address).
stopi if expression
Evaluates the expression before executing each instruction
and stops if the expression is true. Note that execution is
very slow if you choose this type of conditional breakpoint.
stopi at address if expression
Evaluates the expression at the given address and stops if
the expression is true.
stopi in procedure if expression
Evaluates the expression at every instruction within a given
procedure and stops if the expression is true.
stopi [expression1|variable] if expression2
Tests both conditions before executing each machine
instruction. Stops if both conditions are true.
89
Chapter 7: Debugging Machine Language Code
If expression1 is of type pointer, look at the data pointed to
and watch until it changes. If expression1 is not of type
pointer, look at the 32 bits at that address (assume the
expression evaluates to an address).
stopi [expression1|variable] at address if expression2
Tests both conditions at the given address (for machinelevel debugging). Stops if both conditions are true.
If expression1 is of type pointer, look at the data pointed to
and watch until it changes. If expression1 is not of type
pointer, look at the 32 bits at that address (assume the
expression evaluates to an address).
stopi [expression1|variable] in procedure if expression2
Tests the expression each time that the given variable
changes within the given procedure.
If expression1 is of type pointer, look at the data pointed to
and watch until it changes. If expression1 is not of type
pointer, look at the 32 bits at that address (assume the
expression evaluates to an address).
Note: When you stop execution because of a machine-level breakpoint set
by one of the stopi in commands, a where command at the point of stop may
yield an incorrect stack trace. This is because the stack for the function is not
completely set up until several machine instructions have been executed. dbx
attempts to account for this, but is sometimes unsuccessful.
Linking With DSOs
If you link with a DSO, be careful when you use the stopi at command. For
example, suppose you enter:
dbx() stopi at functionx
The breakpoint at functionx is hit only if the gp_prolog instruction is executed.
(gp_prolog is a short sequence of instructions at the beginning of the routine.)
90
Continuing Execution After a Machine-Level Breakpoint
To avoid this problem, use the stopi in command:
dbx() stopi in functionx
If you really want to use stopi at, a safe alternative is to disassemble functionx
and put the breakpoint after the gp_prolog. For more information on
gp_prolog, see the MIPSpro Assembly Language Programmer’s Guide.
The tracei at, wheni at, and conti at commands described in the following
sections also follow this pattern. Use their “in” versions to ensure that the
function breakpoint is hit.
Continuing Execution After a Machine-Level Breakpoint
The conti command continues executing assembly code after a breakpoint.
As with the cont command, if your program stops because dbx catches a
signal intended for your program, then dbx sends that signal to your
program when you continue execution. You can also explicitly send a signal
to your program when you continue execution. Signal processing and
sending signals to your program is discussed in “Using Signal Processing”
on page 73.
The syntax of the conti command is:
conti [signal] Continues execution with the current instruction.
conti [signal] {at | to} address
Sets a temporary breakpoint at the specified address, then
resumes execution with the current instruction. When your
program reaches the breakpoint at address, dbx stops your
program and deletes the temporary breakpoint.
conti [signal] in procedure
Sets a temporary breakpoint to stop execution upon
entering the specified procedure, then resumes execution
with the current instruction. When your program reaches
the breakpoint in procedure, dbx stops your program and
deletes the temporary breakpoint.
See also “Linking With DSOs” on page 90 for a description on using the
conti in and conti at commands with DSOs.
91
Chapter 7: Debugging Machine Language Code
Tracing Execution at the Machine Level
The tracei command allows you to observe the progress of your program
while debugging machine code, just as you can with the trace command
while debugging source code. The tracei command traces in units of machine
instructions instead of in lines of code.
Each trace is assigned a number when you create it. Use this number to
reference the breakpoint in the various commands provided for
manipulating breakpoints (for example, disable, enable, and delete, all
described in “Managing Breakpoints, Traces, and Conditional Commands”
on page 70).
The syntax of the tracei command is:
tracei [expression|variable]
Whenever the specified variable changes, dbx prints the old
and new values of that variable. (For machine-level
debugging.) Note that execution is very slow if you choose
this type of trace.
If the expression is of type pointer, look at the data pointed
to and watch until it changes. If the expression is not of type
pointer, look at the 32 bits at that address (assume the
expression evaluates to an address).
tracei procedure
This command is equivalent to entering trace procedure.
dbx prints the values of the parameters passed to the
specified procedure whenever your program calls it. Upon
return, dbx prints the return value.
tracei [expression|variable] at address
Prints the value of the variable whenever your program
reaches the specified address. (For machine-level
debugging.)
If the expression is of type pointer, look at the data pointed
to and watch until it changes. If the expression is not of type
pointer, look at the 32 bits at that address (assume the
expression evaluates to an address).
92
Writing Conditional Commands at the Machine Level
tracei [expression|variable] in procedure
Whenever the variable changes within the procedure that
you specify, dbx prints the old and new values of that
variable. (For machine-level debugging.)
If the expression is of type pointer, look at the data pointed
to and watch until it changes. If the expression is not of type
pointer, look at the 32 bits at that address (assume the
expression evaluates to an address).
tracei [expression1|variable] at address if expression2
Prints the value of the variable whenever your program
reaches the specified address and the given expression is
true. (For machine-level debugging.)
If expression1 is of type pointer, look at the data pointed to
and watch until it changes. If expression1 is not of type
pointer, look at the 32 bits at that address (assume the
expression evaluates to an address).
tracei [expression1|variable] in procedure if expression2
Whenever the variable changes within the procedure that
you specify, dbx prints the old and new values of that
variable, if the given expression is true. (For machine-level
debugging.)
If expression1 is of type pointer, look at the data pointed to
and watch until it changes. If expression1 is not of type
pointer, look at the 32 bits at that address (assume the
expression evaluates to an address).
See also “Linking With DSOs” on page 90 for a description on using the
tracei in and tracei at commands with DSOs.
Writing Conditional Commands at the Machine Level
Use the wheni command to write conditional commands for use in
debugging machine code. The wheni command works in the same way as the
when command described in “Writing Conditional Commands” on page 68.
The command list is a list of dbx commands, separated by semicolons. When
93
Chapter 7: Debugging Machine Language Code
the specified conditions are met, the command list is executed. If one of the
commands in the list is stop (with no operands), then the process stops when
the command list is executed.
wheni if expression {command-list}
Evaluates the expression before executing each machine
instruction. If the expression is true, executes the command
list.
wheni at address if expression {command-list}
Evaluates the expression at the given address. If the
expression is true, executes the command list.
wheni in procedure if expression {command-list}
Evaluates the expression in the given procedure. If the
expression is true, executes the command list.
wheni variable at address if expression {command-list}
Tests both conditions at the given address. If the conditions
are true, executes the command list. (For machine-level
debugging.)
If the expression is of type pointer, look at the data pointed
to and watch until it changes. If the expression is not of type
pointer, look at the 32 bits at that address (assume the
expression evaluates to an address).
wheni variable in procedure if expression {command-list}
Tests both conditions at every machine instruction within a
given procedure. If they are true, executes the command list.
See also “Linking With DSOs” on page 90 for a description on using the
wheni in and wheni at commands with DSOs.
Stepping Through Machine Code
The stepi and nexti commands allow you to step through machine code in
much the same way as you can with the step and next commands while
debugging source code. The step and next commands step in units of
machine instructions instead of in lines of code.
94
Stepping Through Machine Code
The formats of the nexti and stepi commands are:
nexti [integer] Executes the specified number of machine instructions,
stepping over procedures. If you do not provide an
argument, nexti executes one instruction. If nexti encounters
any breakpoints, even in procedures that it steps over, it
immediately stops execution.
stepi
Single steps one machine instruction, stepping into
procedures (as called by jal and jalr). If stepi encounters any
breakpoints, it immediately stops execution.
stepi [n]
Executes the specified number of machine instructions,
stepping into procedures (as called by jal and jalr).
The values of the dbx variable $stepintoall affects the stepi and nexti
commands just as they do the step and next commands. See “Stepping
Through Your Program” on page 78 for a discussion of these variables.
For the stepj command, dbx determines the next jump by reading through the
instructions until it finds a jump or jal machine instruction. Because it ignores
conditional branches, it does not necessarily follow the sequence of the
program’s execution to find the “next” jump. This means that it may not stop
where you expect.
95
Appendix A
A.
dbx Commands
All dbx commands are listed below along with a brief description. For more
information about a command, refer to its description in the main text of this
guide.
;
Use the semicolon (;) as a separator to include multiple
commands on the same command line.
\
Use the backslash (\) at the end of a line of input to dbx to
indicate that the command is continued on the next line.
./
Repeats the previous examine command by incrementing
the address.
/[reg_exp]
Searches forward through the current source file from the
current line for the regular expression reg_exp. If dbx reaches
the end of the file without finding the regular expression, it
wraps around to the beginning of the file. dbx prints the first
source line containing a match of the search expression.
If you do not supply reg_exp, dbx searches forward, based
on the last regular expression you searched for.
.?
Repeats the previous examine command by decrementing
the address.
?[reg_exp]
Searches backward through the current source file from the
current line for the regular expression reg_exp. If dbx reaches
the beginning of the file without finding the regular
expression, it wraps around to the end of the file. dbx prints
the first source line containing a match of the search
expression.
If you do not supply a regular expression, dbx searches
backward, based on the last regular expression you
searched for.
111
Appendix A: dbx Commands
!!
Repeats the previous command. If the value of the dbx
variable $repeatmode is set to 1, then entering a carriage
return at an empty line is equivalent to executing !!. By
default, $repeatmode is set to 0.
!string
Repeats the most recent command that starts with the
specified string.
!integer
Repeats the command associated with the specified integer
in the history list.
!-integer
Repeats the command that occurred integer times before the
most recent command. Entering !-1 executes the previous
command, !-2 the command before that, and so forth.
active [pid]
Selects a process, pid, from dbx process pool as the active
process. If you do not provide a process ID, dbx prints the
currently active process ID.
addpgrp pid [ ... ]
Adds the process IDs specified to the group list. Only
processes in the process pool can be added to the group list.
addproc pid [ ... ]
Adds the specified process(es) to the pool of dbx controlled
processes.
address / count format
Prints the contents of the specified address or disassembles
the code for the machine instruction at the specified
address. Repeats for a total of count addresses in increasing
address—in other words, an examine forward command. The
format codes are listed in Table 7-2.
address ? count format
Prints the contents of the specified address or disassembles
the code for the machine instruction at the specified
address. Repeats for a total of count addresses in decreasing
address—in other words, an “examine backward”
command. The format codes are listed in Table 7-2.
address / count L value mask
Examines count 32-bit words in increasing address and print
those 32-bit words which, when ORed with mask, equal
value. This command searches memory for specific patterns.
112
alias
Lists all existing aliases.
alias name
Lists the alias definition for name.
alias name command
Defines name as an alias for command.
alias name “string”
Defines name as an alias for string. With this form of the alias
command, you can provide command arguments in the
alias definition.
alias name(arg1 [, ... argN]) “string”
Defines name as an alias for string. arg1 through argN are
arguments to the alias, appearing in the string definition.
When you use the alias, you must provide values for the
arguments, which dbx then substitutes in string.
assign register = expression
Assigns the value of expression to register. You must precede
the name of the register with a dollar sign ($).
assign variable = expression
Assigns the value of expression to the program variable,
variable.
catch
Prints a list of all signals caught.
catch {signal | all}
Instructs dbx to stop your program whenever it receives the
specified signal. If you use the keyword all rather than
giving a specific signal, dbx catches all signals.
ccall func(arg1, arg2, ... , argn)
Calls a function with the given arguments.
clearcalls
Clears all stopped interactive calls.
cont
Continues execution with the current line.
cont {at | to} line
Sets a temporary breakpoint at the specified source line,
then resumes execution with the current line. When your
program reaches the breakpoint at line, dbx stops your
program and deletes the temporary breakpoint. The
keywords at and to are equivalent.
113
Appendix A: dbx Commands
cont in procedure
Sets a temporary breakpoint to stop execution upon
entering the specified procedure, then resumes execution
with the current line. When your program reaches the
breakpoint in procedure, dbx stops your program and
deletes the temporary breakpoint.
cont [signal]
Continues execution with the current line and sends the
specified signal to your program. If you do not provide a
signal, but your program stopped because dbx caught a
signal intended for your program, then dbx sends that signal
to your program when you continue execution.
cont [signal] {at | to} line
Sets a temporary breakpoint at the specified source line,
then resumes execution with the current line and sends the
specified signal to your program. If you do not provide a
signal, but your program stopped because dbx caught a
signal intended for your program, then dbx sends that signal
to your program when you continue execution.
cont [signal] in procedure
Sets a temporary breakpoint to stop execution upon
entering the specified procedure, then resumes execution
with the current line and sends the specified signal to your
program. If you do not provide a signal, but your program
stopped because dbx caught a signal intended for your
program, then dbx sends that signal to your program when
you continue execution.
conti [signal] Continues execution with the current machine instruction.
If you specify a signal, dbx sends the signal to your program.
If you do not provide a signal, but your program stopped
because dbx caught a signal intended for your program,
then dbx sends that signal to your program when you
continue execution.
conti [signal] {at | to} address
Sets a temporary breakpoint at the specified address, then
resumes execution with the current machine instruction.
When your program reaches the breakpoint at address, dbx
stops your program and deletes the temporary breakpoint.
114
If you specify a signal, then dbx sends the signal to your
program. If you do not provide a signal, but your program
stopped because dbx caught a signal intended for your
program, then dbx sends that signal to your program when
you continue execution.
conti [signal] in procedure
Sets a temporary breakpoint to stop execution upon
entering the specified procedure, then resumes execution
with the current machine instruction. When your program
reaches the breakpoint in procedure, dbx stops your
program and deletes the temporary breakpoint.
If you specify a signal, then dbx sends the signal to your
program. If you do not provide a signal, but your program
stopped because dbx caught a signal intended for your
program, then dbx sends that signal to your program when
you continue execution.
corefile [file] If you provide a filename, dbx uses the program data stored
in the core dump file.
If you do not provide a filename, dbx displays the name of
the current core file.
delete {item [, item ...] | all}
Deletes the item(s) specified. If you use the keyword all
instead of listing individual items, dbx deletes all
breakpoints, traces, and conditional commands.
delpgrp pid [ ... ]
Deletes the process IDs specified from the group list.
delproc pid [ ... ]
Deletes the specified process(es) from the pool of dbx
controlled processes.
dir [dir ...]
If you provide one or more directories, dbx adds those
directories to the end of the source directory list.
If you do not provide any directories, dbx displays the
current source directory list.
115
Appendix A: dbx Commands
disable item [, item ... ]
Disables the item(s) listed. The specified breakpoint(s),
trace(s), or conditional command(s) no longer affect
program execution. This command has no effect if the item
you specify is already disabled.
down [num]
Moves down the specified number of activation levels in the
stack. The default is one level.
dump
Prints information about the variables in the current
procedure.
dump procedure Prints information about the variables in the specified
procedure. The procedure must be active.
dump .
Prints information about the variables in all procedures
currently active.
edit [file | procedure]
Edits a file. If you set the dbx variable $editor to the name of
an editor, the edit command invokes that editor on the
source file. If you do not set the dbx variable $editor, dbx
checks whether you have set the environment variable
EDITOR and, if so, invokes that editor. If you do not set
either the dbx variable or the environment variable, dbx
invokes the vi editor. When you exit the editor, you return
to the dbx prompt.
If you supply a filename, edit invokes the editor on that file.
If you supply the name of a procedure, edit invokes the
editor on the file that contains the source for that
procedure. If you do not supply a filename or a procedure
name, edit invokes the editor on the current source file.
edit pid pid
Edits the process ID pid clause.
enable item [, item ... ]
Enables the item(s) specified. This command activates the
specified breakpoint(s), trace(s), or conditional
command(s), reversing the effects of a disable command, so
that they affect program execution.
116
file [file]
Changes the current source file to file. The new file becomes
the current source file, on which you can search, list, and
perform other operations.
func
Displays the name of the procedure corresponding to the
current activation level.
func {activation_level | procedure}
Changes the current activation level. If you specify an
activation level by number, dbx changes to that activation
level. If you specify procedure, dbx changes to the activation
level of that procedure. If you specify a procedure name and
that procedure has called itself recursively, dbx changes to
the most recently called instance of that procedure. If you
specify procedure, dbx changes the current source file to be
that procedure, even if the procedure is not active.
givenfile [file]
If you provide a filename, dbx kills the currently running
processes and loads the executable code and debugging
information found in file.
If you do not provide a filename, dbx displays the name of
the program that it is currently debugging.
goto line
Begins execution at the specified line. You may not use the
goto command to resume execution with a line outside of
the current procedure.
hed
Edits only the last line of the history list (the last command
executed).
hed num1
Edits line num1 in the history list.
hed num1,num2
Edits the lines in the history list from num1 to num2.
hed all
Edits the entire history list.
help
Shows the list of available help sections.
help all
Displays the entire dbx help file. dbx displays the file using
the command name given by the dbx $pager variable. The
dbx help file is large and can be difficult to use if you use a
simple paging program like more(1). A useful technique is to
set the $pager variable to a text editor like vi(1).
117
Appendix A: dbx Commands
help help
Explains how to display the help file in your favorite editor.
help section
Shows this help section. dbx displays the file using the
command name given by the dbx $pager variable. (By
default, it uses more.) A useful technique is to set the $pager
variable to a text editor like vi(1).
history
Prints the commands in the history list.
ignore
Prints a list of all signals ignored.
ignore {signal | all}
Instructs dbx to ignore the specified signal. All ignored
signals are passed to your program normally. If you use the
keyword all rather than giving a specific signal, dbx ignores
all signals.
kill
Kills the active process.
kill pid ...
Kills the active process(es) whose PIDs are specified.
list
Lists $listwindow lines beginning at the current line.
list exp
Lists $listwindow lines starting with the line number given
by the expression exp. The expression may be any valid
expression that evaluates to an integer value.
list exp1:exp2 Lists exp2 lines, beginning at line exp1.
list exp1,exp2 Lists all source between line exp1 and line exp2 inclusive.
118
list func
Lists $listwindow lines starting at procedure func.
list func:exp
Lists exp2 lines, beginning at func.
list func,exp
Lists all source between func and exp, inclusive.
listobj
Lists dynamic shared objects being used. The base
application is first in the list.
next [n]
Executes the specified number of lines of source code,
stepping over procedures. If you do not provide an
argument, next executes one line. If next encounters any
breakpoints, even in procedures that it steps over, it
immediately stops execution.
nexti [n]
Executes the specified number of machine instructions,
stepping over procedures. If you do not provide an
argument, nexti executes one line. If nexti encounters any
breakpoints, even in procedures which it steps over, it
immediately stops execution.
playback input [file]
Executes the commands from file. The default file is the
current temporary file created for the record input command.
If the dbx variable $pimode is nonzero, the commands are
printed out as they are played back.
playback output [file]
Prints the commands from file. The default file is the current
temporary file created for the record output command.
print [exp1 [, exp2, ... ] ]
Prints the value(s) of the specified expression(s).
printd [exp1 [, exp2, ... ] ]
Prints the value(s) of the specified expression(s) in decimal.
printf string [, exp1 [, exp2, ... ] ]
Prints the value(s) of the specified expression(s) in the
format specified by the string, string. The printf command
supports all formats except “%s”. For a list of formats, see
the printf(3S) reference page.
printo [exp1 [, exp2, ... ] ]
Prints the value(s) of the specified expression(s) in octal.
printregs
Prints all register values.
printx [exp1 [, exp2, ... ] ]
Prints the value(s) of the specified expression(s) in
hexadecimal.
quit
Quits dbx.
record
Displays the current input and output recording sessions.
record input [file]
Records everything you type to dbx in file. The default file is
a temporary dbx file in the /tmp directory. The name of the
temporary file is stored in the dbx variable $defaultin.
119
Appendix A: dbx Commands
record output [file]
Records all dbx output in file. The default file is a temporary
dbx file in the /tmp directory. The name of the temporary file
is stored in the dbx variable $defaultout. If the dbx variable
$rimode is nonzero, dbx also records the commands you
enter.
rerun run-arguments
Without any arguments, repeats the last run command, if
applicable. Otherwise, rerun is equivalent to the run
command without any arguments.
resume
Resumes execution of the program, and returns
immediately to the dbx command interpreter.
resume [signal] Resumes execution of the process, sending it the specified
signal, and returns immediately to the dbx command
interpreter.
return
Continues execution until control returns to the next
procedure on the stack.
return proc
Continues execution until control returns to the named
procedure.
run run-arguments
Starts your program and passes to it any arguments that
you provide. All shell processing is accepted, such as
unglobbing of * and ? in filenames. Redirection of the
program’s standard input and standard output, and/or
standard error is also done by the shell. In other words, the
run command does exactly what typing target run-arguments
does. You can specify a target, either on dbx invocation or in
a prior givenfile command. dbx passes ./target as argv[0] to
target when you specify it as a relative pathname. You can
specify target either on dbx invocation or in a prior givenfile
command. dbx passes ./target as argv[0] to target when you
specify it as a relative pathname.
A run command must appear on a line by itself and cannot
be followed by another dbx command. Terminate the
command line with a return (new-line). Note that you
cannot include a run command in the command list of a
when command.
120
set
Displays a list of predefined and user defined variables.
set var = exp
Defines (or redefines) the specified dbx variable, setting its
value to that of the expression you provide.
sh
Invokes a subshell. To return to dbx from the subshell, enter
exit at the command line, or otherwise terminate the
subshell.
sh com
Executes the specified shell command. dbx interprets the
remainder of the line as a command to pass to the spawned
shell process, unless you enclose the command in doublequotes or you terminate your shell command with a
semicolon (;).
showpgrp
Shows the group process list and the group history.
showproc [pid | all]
Shows processes already in the dbx process pool or
processes that dbx can control. If you provide no arguments,
dbx lists the processes it already controls. If you provide a
pid, dbx displays the status of the specified process. If you
use argument “all,” dbx lists all the processes it controls as
well as all those processes it could control but that are not
yet added to the process pool.
source [file]
Executes dbx commands from file.
status
Displays all breakpoints, traces, and conditional
commands.
step [n]
Executes the specified number of lines of source code,
stepping into procedures. If you do not provide an
argument, step executes one line. If step encounters any
breakpoints, it immediately stops execution.
stepi
Single steps one machine instruction, stepping into
procedures (as called by jal and jalr). If stepi encounters any
breakpoints, it immediately stops execution.
stepi [n]
Executes the specified number of machine instructions,
stepping into procedures (as called by jal and jalr).
stop at
Set a breakpoint at the current source line.
stop at line
Sets a breakpoint at the specified source line.
121
Appendix A: dbx Commands
stop expression
Inspects the expression. If the expression is type pointer,
checks the data being pointed at. Otherwise, checks the 32
bits at the address given by the expression.
stop in procedure
Sets a breakpoint to stop execution upon entering the
specified procedure.
stop [expression|variable]
Inspects the value before executing each source line. If the
expression is of type pointer, look at the data pointed to and
watch until it changes.
If the expression is not of type pointer, look at the 32 bits at
that address (assume the expression evaluates to an
address).
stop [expression|variable] at line
Inspects the value at the given source line. Stops if the value
has changed.
If the expression is of type pointer, look at the data pointed
to and watch until it changes. If the expression is not of type
pointer, look at the 32 bits at that address (assume the
expression evaluates to an address).
stop [expression|variable] in procedure
Inspects the value at every source line within a given
procedure. Stops if the value has changed.
If the expression is of type pointer, look at the data pointed
to and watch until it changes.
If the expression is not of type pointer, look at the 32 bits at
that address (assume the expression evaluates to an
address).
stop if expression
Evaluates the expression before executing each source line.
Stops if the expression is true.
122
stop at line if expression
Evaluates the expression at the given source line. Stops if
the expression is true.
stop in procedure if expression
Evaluates the expression at every source line within a given
procedure. Stops if the expression is true.
stop [expression1|variable] if expression2
Tests both conditions before executing each source line.
Stops if both conditions are true.
If expression1 is of type pointer, look at the data pointed to
and watch until it changes. If expression1 is not of type
pointer, look at the 32 bits at that address (assume the
expression evaluates to an address).
stop [expression1|variable] at line if expression2
Tests both conditions at the given source line. Stops if both
conditions are true.
If expression1 is of type pointer, look at the data pointed to
and watch until it changes. If expression1 is not of type
pointer, look at the 32 bits at that address (assume the
expression evaluates to an address).
stop [expression1|variable] in procedure if expression2
Tests both conditions at every source line within a given
procedure. Stops if both conditions are true.
If expression1 is of type pointer, look at the data pointed to
and watch until it changes. If expression1 is not of type
pointer, look at the 32 bits at that address (assume the
expression evaluates to an address).
stopi at
Sets an unconditional breakpoint at the current machine
instruction.
stopi at address
Sets an unconditional breakpoint at the specified address
(for machine-level debugging).
123
Appendix A: dbx Commands
stopi in procedure
Sets an unconditional breakpoint to stop execution upon
entering the specified procedure (for machine-level
debugging).
stopi [expression|variable]
Inspects the value before executing each machine
instruction and stops if the value has changed.
If the expression is of type pointer, look at the data pointed
to and watch until it changes. If the expression is not of type
pointer, look at the 32 bits at that address (assume the
expression evaluates to an address).
stopi [expression|variable] at address
Inspects the value when the program is at the given address
and stops if the value has changed (for machine-level
debugging).
If the expression is of type pointer, look at the data pointed
to and watch until it changes. If the expression is not of type
pointer, look at the 32 bits at that address (assume the
expression evaluates to an address).
stopi [expression|variable] in procedure
Inspects the value at every machine instruction within a
given procedure and stops if the value has changed.
If the expression is of type pointer, look at the data pointed
to and watch until it changes. If the expression is not of type
pointer, look at the 32 bits at that address (assume the
expression evaluates to an address).
stopi if expression
Evaluates the expression before executing each machine
instruction and stops if the expression is true.
stopi at address if expression
Evaluates the expression at the given address and stops if
the expression is true (for machine-level debugging).
stopi in procedure if expression
Evaluates the expression at every machine instruction
within a given procedure and stops if the expression is true.
124
stopi [expression1|variable] if expression2
Tests both conditions before executing each machine
instruction. Stops if both conditions are true.
If expression1 is of type pointer, look at the data pointed to
and watch until it changes. If expression1 is not of type
pointer, look at the 32 bits at that address (assume the
expression evaluates to an address).
stopi [expression1|variable] at address if expression2
Tests both conditions at the given address (for machinelevel debugging). Stops if both conditions are true.
If expression1 is of type pointer, look at the data pointed to
and watch until it changes. If expression1 is not of type
pointer, look at the 32 bits at that address (assume the
expression evaluates to an address).
stopi [expression1|variable] in procedure if expression2
Tests the expression each time that the given variable
changes within the given procedure.
If expression1 is of type pointer, look at the data pointed to
and watch until it changes. If expression1 is not of type
pointer, look at the 32 bits at that address (assume the
expression evaluates to an address).
suspend
Suspends the active process if it is running. If it is not
running, this command does nothing. If you use the
keyword all, suspends all active processes.
suspend pgrp
Suspends all the processes in pgrp.
suspend pid pid
Suspends the process pid if it is in the dbx process pool. If it
is not running, this command does nothing.
syscall
Prints a summary of the catch and ignore status of all
system calls. The summary is divided into four sections:
1) caught at call, 2) caught at return, 3) ignored at call, and
4) ignored at return.
125
Appendix A: dbx Commands
syscall catch [{call | return}]
Prints a list of all system calls caught upon entry (call) or
return (return). If you provide neither the call nor return
keyword, dbx lists all system calls that are caught.
syscall ignore [{call | return}]
Prints a list of all system calls not caught upon entry (call)
or return (return). If you provide neither the call nor return
keyword, dbx lists all system calls that are ignored.
syscall catch {call | return} {system_call | all}
Sets a breakpoint to stop execution upon entering (call) or
returning from (return) the specified system call. Note that
you can set dbx to catch both the call and the return of a
system call.
If you use the keyword all rather than giving a specific
system call, dbx catches all system calls.
syscall ignore {call | return} {system_call | all}
Clears the breakpoint to stop execution upon entering (call)
or returning from (return) the specified system call.
If you use the keyword all rather than giving a specific
system call, dbx clears the breakpoints to stop execution
upon entering (call) or returning from (return) all system
calls.
tag procedure
Searches the tag file for the given procedure.
trace variable Whenever the specified variable changes, dbx prints the old
and new values of that variable.
trace procedurePrints the values of the parameters passed to the specified
procedure whenever your program calls it. Upon return,
dbx prints the return value.
trace [expression|variable] at line
Whenever your program reaches the specified line, dbx
prints the value of the variable if its value has changed.
If the expression is of type pointer, look at the data pointed
to and watch until it changes. If the expression is not of type
pointer, look at the 32 bits at that address (assume the
expression evaluates to an address).
126
trace [expression|variable] in procedure
Whenever the variable changes within the procedure, dbx
prints the old and new values of that variable.
If the expression is of type pointer, look at the data pointed
to and watch until it changes. If the expression is not of type
pointer, look at the 32 bits at that address (assume the
expression evaluates to an address).
trace [expression1|variable] at line if expression2
Prints the value of the variable (if changed) whenever your
program reaches the specified line and the given expression
is true.
If expression1 is of type pointer, look at the data pointed to
and watch until it changes. If expression1 is not of type
pointer, look at the 32 bits at that address (assume the
expression evaluates to an address).
trace [expression1|variable] in procedure if expression2
Whenever the variable changes within the procedure that
you specify, dbx prints the old and new values of that
variable, if the given expression is true.
If expression1 is of type pointer, look at the data pointed to
and watch until it changes. If expression1 is not of type
pointer, look at the 32 bits at that address (assume the
expression evaluates to an address).
tracei [expression|variable]
Whenever the specified variable changes, dbx prints the old
and new values of that variable. (For machine-level
debugging.)
If the expression is of type pointer, look at the data pointed
to and watch until it changes. If the expression is not of type
pointer, look at the 32 bits at that address (assume the
expression evaluates to an address).
tracei procedure
This command is equivalent to entering trace procedure.
(For machine-level debugging.)
127
Appendix A: dbx Commands
tracei [expression|variable] at address
Prints the value of the variable whenever your program
reaches the specified address. (For machine-level
debugging.)
If the expression is of type pointer, look at the data pointed
to and watch until it changes. If the expression is not of type
pointer, look at the 32 bits at that address (assume the
expression evaluates to an address).
tracei [expression|variable] in procedure
Whenever the variable changes within the procedure that
you specify, dbx prints the old and new values of that
variable. (For machine-level debugging.)
If the expression is of type pointer, look at the data pointed
to and watch until it changes. If the expression is not of type
pointer, look at the 32 bits at that address (assume the
expression evaluates to an address).
tracei [expression1|variable] at address if expression2
Prints the value of the variable whenever your program
reaches the specified address and the given expression is
true. (For machine-level debugging.)
If expression1 is of type pointer, look at the data pointed to
and watch until it changes. If expression1 is not of type
pointer, look at the 32 bits at that address (assume the
expression evaluates to an address).
tracei [expression1|variable] in procedure if expression2
Whenever the variable changes within the procedure that
you specify, dbx prints the old and new values of that
variable, if the given expression is true. (For machine-level
debugging.)
If expression1 is of type pointer, look at the data pointed to
and watch until it changes. If expression1 is not of type
pointer, look at the 32 bits at that address (assume the
expression evaluates to an address).
unalias alias
128
Removes the specified alias.
unrecord session1 [, session2 ... ]
Turns off the specified recording session(s) and closes the
file(s) involved.
unrecord all Turns off all recording sessions and closes all files involved.
unset var
Removes the specified dbx variable.
up [num]
Moves up the specified number of activation levels in the
stack. The default is one level.
use [dir ...]
If you provide one or more directories, dbx replaces the
source directory list with the directories that you provide.
If you do not provide any directories, dbx displays the
current source directory list.
wait
Waits for the active process to stop for an event.
wait pid pid
Waits for the process pid to stop for an event.
waitall
Waits for any process currently running to breakpoint or
stop for any reason.
whatis variable Prints the type declaration for the specified variable or
procedure.
when [expression|variable] {command-list}
Inspects the value before executing each source line. If it has
changed, executes the command list.
If the expression is of type pointer, look at the data pointed
to and watch until it changes. If the expression is not of type
pointer, look at the 32 bits at that address (assume the
expression evaluates to an address).
when [expression|variable] at line {command-list}
Inspects the value at the given source line. If it has changed,
executes the command list.
If the expression is of type pointer, look at the data pointed
to and watch until it changes. If the expression is not of type
pointer, look at the 32 bits at that address (assume the
expression evaluates to an address).
129
Appendix A: dbx Commands
when [expression|variable] in procedure {command-list}
Inspects the value at every source line within a given
procedure. If it has changed, executes the command list.
If the expression is of type pointer, look at the data pointed
to and watch until it changes. If the expression is not of type
pointer, look at the 32 bits at that address (assume the
expression evaluates to an address).
when if expression {command-list}
Evaluates the expression before executing each source line.
If it is true, executes the command list.
when at line if expression {command-list}
Evaluates the expression at the given source line. If it is true,
executes the command list.
when in procedure if expression {command-list}
Evaluates the expression at every source line within a given
procedure. If it is true, executes the command list.
when [expression1|variable] if expression2 {command-list}
Checks if the value of the variable has changed. If it has
changed and the expression is true, executes the command
list.
If expression1 is of type pointer, look at the data pointed to
and watch until it changes. If expression1 is not of type
pointer, look at the 32 bits at that address (assume the
expression evaluates to an address).
when [expression1|variable] at line if expression2 {command-list}
Checks if the value of the variable has changed each time
the line is executed. If the value has changed and the
expression is true, executes the command list.
If expression1 is of type pointer, look at the data pointed to
and watch until it changes. If expression1 is not of type
pointer, look at the 32 bits at that address (assume the
expression evaluates to an address).
when [expression1|variable] in procedure if expression2 {commandlist}
Checks if the value of variable has changed at each source
130
line of the given procedure. If the value has changed and the
expression is true, executes the command list.
If expression1 is of type pointer, look at the data pointed to
and watch until it changes. If expression1 is not of type
pointer, look at the 32 bits at that address (assume the
expression evaluates to an address).
wheni if expression {command-list}
Evaluates the expression before executing each machine
instruction. If the expression is true, executes the command
list.
wheni at address if expression {command-list}
Evaluates the expression at the given address. If the
expression is true, executes the command list. (For machinelevel debugging.)
wheni in procedure if expression {command-list}
Evaluates the expression in the given procedure. If the
expression is true, executes the command list. (For machinelevel debugging.)
wheni variable at address if expression {command-list}
Tests both conditions at the given address. If the conditions
are true, executes the command list. (For machine-level
debugging.)
If the expression is of type pointer, look at the data pointed
to and watch until it changes. If the expression is not of type
pointer, look at the 32 bits at that address (assume the
expression evaluates to an address).
wheni variable in procedure if expression {command-list}
Tests both conditions at every machine instruction within a
given procedure. If they are true, executes the command list.
where
Print a stack trace.
which variable
Prints the fully qualified name of the active version of the
specified variable.
whichobj variable
Lists the dynamic shared objects that contain the named
variable.
131
Appendix B
B.
Predefined Aliases
Table B-1 lists all predefined dbx aliases. You can override any predefined
alias by redefining it with the alias command or by removing it with the
unalias command.
Table B-1
Predefined Aliases
Alias
Definition
Description
a
assign
Assigns the specified expression to the
specified program variable or register.
b
stop at
Sets a breakpoint at the specified line.
bp
stop in
Sets a breakpoint in the specified procedure.
c
cont
Continues program execution after a
breakpoint.
d
delete
Deletes the specified item from the status list.
dir
directory
Displays the current source directory list. If
you specify one or more directories, those
directories are added to the end of the source
directory list.
e
file
Displays the name of the currently selected
source file. If you specify a file, this command
makes the specified file the currently selected
source file.
f
func
Moves to the specified procedure (activation
level) on the stack. If you specify no procedure
or expression, dbx prints the current activation
level.
g
goto
Goes to the specified source line.
h
history
Lists all the items currently in the history list.
133
Appendix B: Predefined Aliases
Table B-1 (continued)
134
Predefined Aliases
Alias
Definition
Description
j
status
Lists all the currently set stop, trace, and when
commands.
l
list
Lists the next $listwindow lines of source code
beginning at the current line.
li
$curpc/10i; \
set $curpc=$curpc+40
Lists the next 40 bytes of machine instructions
(approximately 10 instructions).
n
next
Executes the specified number of lines of
source code, stepping over procedures. If you
do not provide an argument, dbx executes only
one line.
ni
nexti
Executes the specified number of lines of
machine code, stepping over procedures. If
you do not provide an argument, dbx executes
only one instruction.
p
print
Prints the value of the specified variable or
expression.
pd
printd
Prints the value of the specified variable in
decimal.
pi
playback input
Replays dbx commands saved in the specified
file. If you do not specify a file, dbx uses the
temporary file specified by $defaultin.
po
printo
Prints the value of the specified variable or
expression in octal.
pr
printregs
Prints values contained in all registers.
px
printx
Prints the value of the specified variable or
expression in hexadecimal.
q
quit
Quits dbx.
r
rerun
Runs the program again using the arguments
specified for the last run command executed.
Table B-1 (continued)
Predefined Aliases
Alias
Definition
Description
ri
record input
Records to the specified file all the input you
give to dbx. If you do not specify a file, dbx
creates a temporary file. The name of the file is
specified by $defaultin.
ro
record output
Records all dbx output to the specified file. If
no file is specified, records output to a
temporary file. The name of the file is specified
by $defaultout.
s
step
Executes the specified number of lines of
source code, stepping into procedures. If you
do not provide an argument, dbx executes only
one line.
S
next
Executes the specified number of lines of
source code, stepping over procedures. If you
do not provide an argument, dbx executes only
one line.
si
stepi
Executes the specified number of lines of
machine code, stepping into procedures. If
you do not provide an argument, dbx executes
only one instruction.
Si
nexti
Executes the specified number of lines of
machine code, stepping over procedures. If
you do not provide an argument, dbx executes
only one instruction.
source
playback input (pi)
Replays dbx commands saved in the specified
file. If no file is specified, dbx uses the
temporary file specified by $defaultin.
t
where
Does a stack trace to show the current
activation levels.
u
list $curline-9:10
Lists a window of source code showing the
nine lines before the current code line and the
current code line. This command does not
change the current code line.
135
Appendix B: Predefined Aliases
Table B-1 (continued)
136
Predefined Aliases
Alias
Definition
Description
w
list $curline-5:10
Lists a window of source code around the
current line. This command shows the four
lines before the current code line, the current
code line, and five lines after the current code
line. This command does not change the
current code line.
W
list $curline-10:20
Lists a window of source code around the
current line. This command shows the nine
lines before the current code line, the current
code line, and 10 lines after the current code
line. This command does not change the
current code line.
wi
$curpc-20/10i
Lists a window of assembly code around the
program counter.
Appendix C
C.
Predefined dbx Variables
Predefined dbx variables are listed in Table C-1. The predefined variable
names begin with “$” so that they do not conflict with variable, command,
or alias names.
Table C-1
Predefined dbx Variables
Variable
Default
Description
$addrfmt
“0x%x”
Specifies the format for addresses. This can be
set to any format valid for the C language
printf(3S) function.
$addrfmt64
“0x%x”
Specifies the format for 64-bit addresses. This
can be set to any format valid for the C
language printf(3S) function.
$assignverify
Prints the new value of a variable after an
assign.
$casesense
2
If 0, symbol names are case sensitive. If 1,
symbol names are not case sensitive. If 2, the
case sensitivity of symbol names depends on
the case sensitivity of the language in which
the symbol was defined.
$ctypenames
1
If 1, the words “unsigned,” “short,” “long,”
“int,” “char,” “struct,” “union,” and “enum”
are keywords usable only in type casts. If 0,
“struct,” “union,” and “enum” are ordinary
words with no predefined meaning (in C
modules, the others are still known as C
types).
$curevent
The last event number as seen by the status
command.
$curline
The current line in the source code being
executed.
137
Appendix C: Predefined dbx Variables
Table C-1 (continued)
Variable
Default
Description
$curpc
The current program counter.
$cursrcline
The current source listing line plus one.
$debugrld
138
Predefined dbx Variables
0
If the value is 1, dbx allows you to set traps in
rld code, so you can debug bugs in run-time
initialization of C++ global variables and the
like.
$defaultin
The name of the file that dbx uses when the
record input or the playback input command is
executed with no argument.
$defaultout
The name of the file that dbx uses when the
record output or the playback output command
is executed with no argument.
$editor
vi
The name of the editor to invoke (with the edit
command). Default value is set to the value of
the EDITOR environment variable. If EDITOR
missing, it defaults to vi.
$fp_precise
0
(Systems with floating-point precise mode
only.) A nonzero value specifies that the run
command instructs the operating system to
run the program in floating-point precise
mode (a nondebug mode). The debugged
process performs SGI_SET_FP_PRECISE and
SGI_SET_FP_PRESERVE syssgi system calls.
$framereg
1
If 1, all references to registers are to the
registers of the current activation level. If 0, all
references are to the hardware registers (the
registers of activation level 0).
$groupforktoo
0
If 0, adds only processes created with the
sproc(2) system call to the process group list
automatically. If 1, then adds processes
created with either the fork(2) or sproc system
calls to process group list.
Table C-1 (continued)
Predefined dbx Variables
Variable
Default
Description
$hexchars
0
If nonzero, outputs characters in hexadecimal,
using C format “%x”. This affects char type
variables, including those in structures. It
does not affect arrays of characters, which are
printed using the “%.*s” format.
$hexdoubles
0
If nonzero, float and double values print as
normal, with a trailing output of hex
ffffffff and hex ffffffff 00000000,
respectively. These are hex representations of
the bits of the float and double.
$hexin
0
If nonzero, input constants are assumed to be
in hexadecimal. This overrides $octin.
$hexints
0
If nonzero, outputs integers in hexadecimal
format. This overrides $octints.
$hexstrings
0
If nonzero, outputs strings and arrays in
hexadecimal. For character arrays, if nonzero,
the null byte is not taken as a terminator.
Instead, prints the entire array (or $maxlen
values, whichever is less). If 0, then a null byte
in a C or C++ character array is taken as the
end of the array (the length of the array and
$maxstrlen can terminate the array printing
before a null byte is found).
$historyevent
The current history line number.
$lastchild
The process ID of the last child process created
by a fork or sproc system call.
$lines
100
The number of lines in the history list.
$listwindow
10
Specifies how many lines the list command
lists.
$maxstrlen
128
Maximum length printed for zero-terminated
char strings and arrays. Prints char arrays for
array-length, $maxstrlen bytes, or up to a null
byte, whichever comes first (see $hexstrings).
139
Appendix C: Predefined dbx Variables
Table C-1 (continued)
140
Predefined dbx Variables
Variable
Default
Description
$mp_program
0
If 0, dbx treats calls to sproc in the same way as
it treats calls to fork. If 1, child processes
created by calls to sproc are allowed to run;
they block on multiprocessor synchronization
code emitted by mp Fortran code. When you
set $mp_program to 1, mp Fortran code is
easier to debug.
$newevent
After every command creating an event, this
variable is set to the event’s number. The
$newevent variable is useful in writing scripts
that do not use hard-coded event numbers.
$newpgrpevent
Displays the value of the latest pgrp event
created by stop[i], trace[i], and when[i]... pgrp.
Useful when writing scripts that then do delete
pgrp# pgrp with a symbolic (dbx variable)
pgrp#.
$octin
0
If nonzero, assumes input constants are in
octal ($hexin overrides $octin).
$octints
0
If nonzero, outputs integers in octal format
($hexints takes precedence).
$page
1
Specifies whether or not to page when dbx
output scrolls information off the current
screen. A nonzero value turns on paging; a 0
turns it off.
$pager
more
The name of the program used to display
output from dbx.
$pagewidth
80
The width of the window in characters
(assumes a fixed-width font). Used by dbx to
calculate how many screen lines are output.
dbx never inserts newlines; the window
software wraps the lines.
$pagewindow
23
Specifies how many lines print when
information is longer than one screen. This
can be changed to match the number of lines
on any terminal. If set to 0, 1 is used.
Table C-1 (continued)
Predefined dbx Variables
Variable
Default
Description
$pendingtraps
0
Uses no pending traps. If nonzero, allows
traps that cannot be satisfied immediately to
pend until they can be satisfied. This is useful
for debugging programs that use dlopen() to
load symbols as it allows setting breakpoints
before the dlopen() call. Similar to $debugrld,
but $pendingtraps does not allow setting
breakpoints in rld. When set to nonzero,
mistyped procedure names cause a pending
trap to be set.
$piaddtohist
1
If 1, adds commands read from files using the
playback input command to the command
history. If 0, does not add the commands to the
history.
$pid
The current process for kernel debugging (k).
$pid0
Set by dbx to the process ID of the running
process (also called the object file).
$pimode
0
If 1, dbx prints the commands read from files
using the playback input command. If 0, dbx
does not print the commands. In either case,
dbx prints the output resulting from such
commands.
$printdata
0
Used when disassembling. If 1, prints register
contents alongside disassembled instructions.
If 0, just prints disassembled instructions.
$printwhilestep
0
If 0, prints only the next line to be executed. If
nonzero, prints each line that is executed
while it single steps.
$printwide
0
If 0, prints arrays one element per line. If
nonzero, prints arrays compactly (wide).
141
Appendix C: Predefined dbx Variables
Table C-1 (continued)
Variable
Predefined dbx Variables
Default
$procaddr
Description
This variable applies only if you invoke dbx
with the -k option (that is, it is not available
unless you are doing kernel debugging).
Whenever $pid is set, dbx sets $procaddr to the
address of the process table entry for that
process.
$prompt
dbx
The prompt for dbx.
$promptonfork
0
If 0, dbx does not add the child process to the
process pool. Both the child process and the
parent process continue to run.
If 1, dbx stops the parent process and asks if
you want to add the child process to the
process pool. If you answer yes, then dbx adds
the child process to the pool and stops the
child process; if you answer no, dbx allows the
child process to run and does not place it in
the process pool.
If 2, dbx automatically stops both the parent
and child processes and adds the child
process to the process pool.
142
$regstyle
0
If 0, dbx uses the alternate form of the register
name (for example, “zero” instead of “r0” and
“t1” instead of “r9”). If nonzero, dbx uses the
machine name (“r0” through “r31”).
$repeatmode
0
If nonzero, entering a null line (entering a
newline on an empty line) repeats the last
command. If 0, dbx performs no action.
$rimode
0
If 1, dbx records commands you enter in
addition to output when using the record
output command. If 0, dbx does not copy the
commands.
Table C-1 (continued)
Predefined dbx Variables
Variable
Default
Description
$showbreakaddrs
0
If nonzero, show the address of each
breakpoint placed in the code each time it is
placed. Removal of the breakpoints is not
shown. If multiple breakpoints are placed at
one location, only one of the placements is
shown. Since breakpoints are frequently
placed and removed by dbx, the volume of
output can be annoying when tracing.
$stacktracelimit
$stepintoall
Limits to the depth of the stack trace.
0
If 0, step steps into only those procedures that
are compiled with the debugging option -g.
step steps over all other procedures.
If 1 or 2, step steps into all procedures. Note
that when you debug a source file compiled
without symbols or compiled with
optimization, the line numbers may
sometimes jump erratically.
Also note that if dbx cannot locate a source file,
then it cannot display source lines as you step
through a procedure.
$tagfile
tags
The name of a file of tags, as created by
ctags(1). Used by the tag command.
143
Index
Symbols
!! command, 22, 112
!-integer command, 22, 112
!integer command, 22, 112
!string command, 22, 112
# characters, 7, 32, 35
#define declarations, 36
// (division) operator, 35, 36
; (command separator), 11, 111
? command, 17, 18, 85, 111, 112
\ (command continuation), 11, 111
Numbers
16-bit word, 86
32-bit word, 86
64-bit word, 86
active process
wait for, 103, 129
adding processes to the process group list, 107, 112
addpgrp command, 107, 112
addproc command, 100, 112
add processes to process pool, 100, 112
address of line numbers, 32, 34, 35
$addrfmt, 137
$addrfmt64, 137
alias command, 25, 112, 113, 133
aliases, 24
creating, 25, 113
deleting, 27, 128
displaying, 25, 113
predefined. See predefined dbx aliases
arrays
examining, 42
assign command, 43, 84, 85, 113
assign to register command, 85
$assignverify, 137
A
activation levels, 46
changing, 50, 117
current, 85
moving down, 49, 116
moving up, 49, 129
printing information, 52, 116
registers and, 85
active command, 101, 112
B
breakpoints, 2, 59
and interactive function calls, 55
conditional, 2, 59
continuing after, 3, 64, 91
disabling, 72, 116
enabling, 72, 116
machine-level, 88, 123
145
Index
breakpoints
process groups, 108
setting, 3, 60, 121, 122
status, 71, 121
test clause, 63
unconditional, 2, 59
variable clause, 61, 62, 63, 64, 89, 122
C
C++
considerations, 56
global functions, 57
member functions, 57
member variables, 56
non-C++ functions, 57
overloaded functions, 57
static member variables, 56
$casesense, 45, 137
case sensitivity of program variable names, 45, 137
casts, 27
catch command, 113
catching signals, 74, 113
catching system calls, 76, 126
ccall command, 53, 113
-c flag, 7
changing program variable values, 43, 113
C keyword conflicts, 44, 137
clearcalls command, 54, 113
code missing, 4
/ command, 17, 42, 85, 111, 112
command continuation, 11, 111
commands
/, 17, 42, 85, 111, 112
!!, 22, 112
!-integer, 22, 112
!integer, 22, 112
146
commands
!string, 22, 112
?, 17, 18, 85, 111, 112
active, 101, 112
addpgrp, 107, 112
addproc, 100, 112
alias, 25, 112, 113, 133
assign, 43, 84, 85, 113
assign register, 85
catch, 113
ccall, 53, 113
clearcalls, 54, 113
cont, 64, 75, 80, 91, 102, 113
conti, 91, 114
corefile, 8, 9, 115
delete, 60, 65, 73, 88, 92, 115
delpgrp, 108, 115
delproc, 100, 115
dir, 7, 14, 15, 115
disable, 60, 65, 71, 88, 92, 116
down, 49, 116
dump, 52, 116
edit, 18, 116, 138
enable, 60, 65, 72, 88, 92, 116
file, 15, 117
func, 50, 51, 117
givenfile, 8, 9, 117
goto, 80, 117
hed, 24, 117
help, 11, 117
history, 22, 118
ignore, 73, 74, 118
kill, 104, 118
list, 16, 118
listobj, 6, 118
next, 3, 78, 79, 118
nexti, 94, 95, 119
playback input, 29, 32, 119, 137, 141
playback output, 119, 137
print, 3, 20, 37, 41, 119
printd, 37, 41, 119
Index
commands
printf, 39, 41, 119
printo, 37, 41, 119
printregs, 83, 119
printx, 37, 41, 119
quit, 12, 119
record, 31, 119
record input, 29, 30, 119, 138
record output, 30, 120, 137
rerun, 3, 9, 10, 120
resume, 65, 102, 120
return, 80, 120
run, 3, 9, 120
search backward (?), 17, 18, 111
search forward (/), 17, 111
set, 20, 21, 37, 121
sh, 12, 121
showpgrp, 108, 121
showproc, 99, 121
status, 30, 71, 121
step, 3, 78, 79, 121
stepi, 94, 95, 121
stop, 3, 60, 61, 62, 63, 121
stopi, 88, 123
suspend, 101, 125
syscall, 76, 77, 125
tag, 126
trace, 4, 66, 126
tracei, 92, 93, 127
unalias, 27, 128, 133
unrecord, 29, 129
unset, 21, 129
up, 49, 129
use, 7, 14, 129
wait, 103, 129
waitall, 103, 129
whatis, 45, 129
when, 68, 129
wheni, 93, 94, 131
where, 2, 47, 90, 131
commands
which, 45, 131
whichobj, 6, 131
command scripts
comments, 32, 35
command separator (;), 11, 111
comments, command scripts, 32, 35
common pitfalls, 4
compiling a program for dbx debugging, 5
conditional breakpoints, 2, 59
setting, 60
test clause, 63
variable clause, 61, 62, 63, 64, 89, 122
conditional commands
deleting, 73, 115
disabling, 72, 116
enabling, 72, 116
setting, 68
status, 71, 121
stop keyword, 68
test clause, 69, 130
variable clause, 68, 129
conflicts between program variable names and C
keywords, 44, 137
conflicts between program variable names and
keywords, 44
constants
numeric, 36
string, 36, 37
cont command, 64, 75, 80, 91, 102, 113
conti command, 91, 114
continuing after a breakpoint, 3, 64, 91
continuing after catching signals, 75
core dump, 1, 8
corefile command, 8, 9, 115
core files, 1
specifying, 8, 115
C preprocessor, 36
147
Index
crashes, diagnosing, 1
creating aliases, 25, 113
$ctypenames, 44, 137
$curevent, 137
$curline, 137
$curpc, 138
current directory, 13
current source file, 15, 49, 111, 117
$cursrcline, 138
D
dbx
-c flag, 7
command scripts, 32
-e flag, 7
-I flag, 7, 13
-i flag, 7
invoking, 2, 6
-k flag, 7
-P flag, 7
-p flag, 7
quitting, 12, 119
-r flag, 7
dbx aliases. See aliases
.dbxinit file, 7, 10
dbx variables, 19, 33
listing, 21, 121
predefined. See predefined dbx variables
removing, 21, 129
setting, 20, 121
debugging
a program, 2
C++ programs, 56
Fortran multiprocess programs, 107
multiprocess application. See multiprocess
debugging
running processes, 7
148
$debugrld, 138
decimal input, 36
decimal output, 36
$defaultin, 29, 119, 138
default input base, 36
$defaultout, 31, 120, 138
default output base, 36
delete command, 60, 65, 73, 88, 92, 115
delete processes from process pool, 100, 115
deleting
aliases, 27, 128
conditional commands, 73, 115
processes from the process group list, 108, 115
tracing, 73, 115
delpgrp command, 108, 115
delproc command, 100, 115
determining scope of program variables, 45, 131
dir
alias, 133
path remapping, 15
dir command, 7, 14, 15, 115
disable command, 60, 65, 71, 88, 92, 116
disabling
breakpoints, 72, 116
conditional commands, 72, 116
tracing, 72, 116
disassemble code, 82, 85, 112
display
active process in process pool, 101, 112
processes in process pool, 99, 121
displaying aliases, 25, 113
displaying caught signals, 74, 113
displaying caught system calls, 77, 126
displaying ignored signals, 74, 118
displaying ignored system calls, 77, 126
displaying recording sessions, 31, 119
displaying register values, 48
Index
down command, 49, 116
DSOs, 6
dump command, 52, 116
E
edit command, 18, 116, 138
edit history list, 24, 117
editing files, 18, 116
$editor, 18, 24, 116, 138
EDITOR environment variable, 18, 24, 116, 137
-e flag, 7
enable command, 60, 65, 72, 88, 92, 116
enabling
breakpoints, 72, 116
conditional commands, 72, 116
tracing, 72, 116
ending recording, 29, 129
environment variables
EDITOR, 18, 24, 116, 137
HOME, 10
evaluation stack, increasing, 7
examining a new program, 3
examining arrays, 42
examining core dumps, 1
examining program variables, 3
examining stack, 3
exec, 106
executing a shell command, 12, 121
execv, 77
execve, 77
exit, 77
expressions
printing, 37, 119
printing formatted, 39, 119
F
file command, 15, 117
fork, 77, 97, 104, 107, 137
Fortran
multiprocess debugging, 107
$fp_precise, 138
$framereg, 138
func command, 50, 51, 117
function calls, interactive, 53, 54, 113
G
-g flag, 2, 4, 5, 13, 47, 79
givenfile command, 8, 9, 117
goto command, 80, 117
$groupforktoo, 107, 138
group history, 108
H
hed command, 24, 117
help, 11, 117, 140
help command, 11, 117
hexadecimal input, 36, 137
hexadecimal output, 36, 83, 137
$hexchars, 139, 141
$hexdoubles, 139
$hexin, 36, 139, 140
$hexints, 37, 83, 139, 140
$hexstrings, 139
history command, 22, 118
history editor, 24
$historyevent, 139
history feature, 21
149
Index
history list, 22
editing, 24, 117
print, 22
HOME environment variable, 10
I
-I flag, 7, 13
-i flag, 7
ignore command, 73, 74, 118
ignoring signals, 74, 118
ignoring system calls, 77, 126
include files, 4
input
playing back, 28, 30, 119
recording, 28, 119
input base
decimal, 36
hexadecimal, 36, 137
octal, 36, 140
interactive function calls, 37, 53
breakpoints, 55
calling, 53, 113
clearing, 54, 113
nesting, 55
unstacking, 54
invoking a shell, 12, 121
invoking dbx, 2, 6
L
$lastchild, 99, 139
line numbers, address, 32, 34, 35
$lines, 139
linked list, 27
list command, 16, 118
listing dbx variables, 21, 121
listobj command, 6, 118
$listwindow, 16, 118, 139
M
machine-level breakpoints, 88, 123
machine-level debugging, 1
machine-level single-stepping, 94
macros, 4
mapping pathnames, 15
$maxstrlen, 139
memory
print contents, 85, 112
memory, print contents, 85, 86, 112
missing code, 4
$mp_program, 77, 107, 140
mp Fortran, 107, 137
multiprocess debugging, 97
multiprocess programs, 65
K
N
kernel debugging, 7
-k flag, 7
kill active process, 104, 118
kill command, 104, 118
kill process in process pool, 104, 118
nesting interactive function calls, 55
$newevent, 140
$newpgrpevent, 140
next command, 3, 78, 79, 118
150
Index
nexti command, 94, 95, 119
numeric constants, 36
O
object files, 13
specifying, 8, 117
octal input, 36, 140
octal output, 36, 83, 140
$octin, 36, 140
$octints, 36, 83, 140
on-line help, 11, 117, 140
operators, 33
# operator, 32, 34, 35
// (division), 35, 36
precedence, 34
output
playing back, 28, 119
recording, 28, 30, 120
output base
decimal, 36
hexadecimal, 36, 83, 137
octal, 36, 83, 140
overloaded C++ functions, 57
P
$page, 140
$pager, 11, 117, 118, 140
$pagewidth, 140
$pagewindow, 140
pathnames, 15
path remapping, 15
pd, 37, 41
-P flag, 7
-p flag, 7
pgrp clause, 108
$piaddtohist, 141
pi command, 30
$pid, 141, 142
$pid0, 99, 141
pid clause, 98
$pimode, 24, 30, 119, 141
playback input command, 29, 32, 119, 137, 141
playback output command, 119, 137
playing back input, 28, 30, 119
playing back output, 28, 119
po, 37, 41
precedence, operators, 34
predefined dbx aliases, 24, 133
a, 133
b, 133
bp, 133
c, 133
d, 133
dir, 133
e, 133
f, 133
g, 133
h, 133
j, 134
l, 134
li, 134
n, 134
ni, 134
p, 134
pd, 37, 41, 134
pi, 30, 32, 134
po, 37, 41, 134
pr, 134
px, 37, 41, 134
q, 134
r, 134
ri, 135
ro, 135
151
Index
predefined dbx aliases
S, 135
s, 135
Si, 135
si, 135
source, 121, 135
t, 135
u, 135
W, 136
w, 136
wi, 136
predefined dbx variables, 19, 137
$addrfmt, 137
$addrfmt64, 137
$assignverify, 137
$casesense, 45, 137
$ctypenames, 44, 137
$curevent, 137
$curline, 137
$curpc, 138
$cursrcline, 138
$debugrld, 138
$defaultin, 29, 119, 138
$defaultout, 31, 120, 138
$editor, 18, 24, 116, 138
$fp_precise, 138
$framereg, 85, 138
$groupforktoo, 107, 138
$hexchars, 139, 141
$hexdoubles, 139
$hexin, 36, 139, 140
$hexints, 37, 83, 139, 140
$hexstrings, 139
$historyevent, 139
$lastchild, 99, 139
$lines, 139
$listwindow, 16, 118, 139
$maxstrlen, 139
$mp_program, 77, 107, 140
$newevent, 140
$newpgrpevent, 140
152
predefined dbx variables
$octin, 36, 140
$octints, 36, 83, 140
$page, 140
$pager, 11, 117, 118, 140
$pagewidth, 140
$pagewindow, 140
$piaddtohist, 141
$pid, 141, 142
$pid0, 99, 141
$pimode, 24, 30, 119, 141
$printdata, 141
$printwhilestep, 141
$printwide, 141
$procaddr, 142
$prompt, 8, 142
$promptonfork, 77, 105, 142
$regstyle, 82, 142
$repeatmode, 22, 112, 142
$rimode, 30, 120, 142
$showbreakaddrs, 143
$stacktracelimit, 143
$stepintoall, 79, 95, 143
$tagfile, 143
print
byte in octal, 86
word in decimal, 86
word in hexadecimal, 86
word in octal, 86
print command, 3, 20, 37, 41, 119
$printdata, 141
printd command, 37, 41, 119
printf command, 39, 41, 119
print history list, 22
printing expressions, 37, 119
printing formatted expressions, 39, 119
printing program variables, 41
printing register values, 48
print memory contents, 85, 86, 112
Index
printo command, 37, 41, 119
printregs command, 83, 119
$printwhilestep, 141
$printwide, 141
printx command, 37, 41, 119
problems
confused listing, 4
include files, 4
macros, 4
source and code do not match, 4
variables do not display, 4
$procaddr, 142
procedures, tracing, 4
processes
wait for, 103, 129
process group list
adding processes, 107, 112
deleting processes, 108, 115
showing processes, 108, 121
process groups, 107
breakpoints, 108
group history, 108
tracing, 108
process identification number (PID), 98
process pool, 97
add processes, 100, 112
delete processes, 100, 115
display active process, 101, 112
display processes, 99, 121
kill active process, 104, 118
kill processes, 104, 118
resume active process, 102, 120
select active process, 101, 112
suspend active process, 101
suspend processes, 101, 125
program stack. See stack
program variables. See variables, program
$prompt, 8, 142
prompt, 8, 142
$promptonfork, 77, 105, 142
px, 37, 41
Q
qualifying program variable names, 39, 46, 67
quit command, 12, 119
quitting dbx, 12, 119
R
record command, 31, 119
recording, displaying sessions, 31, 119
recording, ending, 29, 129
recording input, 28, 119
recording output, 28, 30, 120
record input command, 29, 30, 119, 138
record output command, 30, 120, 137
register names, 81, 142
registers, 81
changing values, 85, 113
displaying values, 48
printing values, 48, 83, 119
using values in expressions, 84
$regstyle, 82, 142
removing dbx variables, 21, 129
repeating commands, 21, 22, 112, 142
$repeatmode, 22, 112, 142
rerun command, 3, 9, 10, 120
resume active process, 102, 120
resume command, 65, 102, 120
return command, 80, 120
-r flag, 7
$rimode, 30, 120, 142
153
Index
run command, 3, 9, 120
running process, wait for, 103, 129
running programs, 7, 9, 10, 120
S
scope of program variables, 41, 46, 49, 51
scripts, 32
search backward (?) command, 17, 18, 111
search forward (/) command, 17, 111
searching source code, 17, 111
select active process from process pool, 101, 112
sending signals, 65, 91, 102, 120
set command, 20, 21, 37, 121
setting breakpoints, 3
setting conditional breakpoints, 60
setting conditional commands, 68
setting dbx variables, 20, 121
setting unconditional breakpoints, 60, 121, 122
sh command, 12, 121
shell, invoking from dbx, 12, 121
shell command, executing, 12, 121
$showbreakaddrs, 143
showing processes in the process group list, 108, 121
showpgrp command, 108, 121
showproc command, 99, 121
signals
catching, 74, 113
continuing after catching, 75
displaying caught, 74, 113
displaying ignored, 74, 118
ignoring, 74, 118
sending, 65, 91, 102, 120
single-stepping, 4, 78, 118, 121
single-stepping at the machine-code level, 94
source, 121, 135
154
source code
searching, 17, 111
source command, 30
source directories
specifying, 13, 14, 15, 115, 129
source files, 13
dbx, 15
editing, 18, 116
locating, 15
specifying, 7, 13, 14, 15, 115, 117, 129
source lines, tracing, 4
sproc, 77, 97, 107, 137
stack
examining, 3, 46, 48
printing, 48
trace, 2, 47, 131
$stacktracelimit, 143
standard error, 9, 120
standard input, 9, 120
standard output, 9, 120
status command, 30, 71, 121
step command, 3, 78, 79, 121
stepi command, 94, 95, 121
$stepintoall, 79, 95, 143
stop command, 3, 60, 61, 62, 63, 121
stopi command, 88, 123
string constants, 36, 37
escape sequences, 37
stripped symbol table, 2
suspend active process, 101
suspend command, 101, 125
suspend process in process pool, 101, 125
symbol table
stripped, 2
syscall command, 76, 77, 125
Index
system calls
catching, 76, 126
displaying caught, 77, 126
displaying ignored, 77, 126
exec, 106
execv, 77
execve, 77
exit, 77
fork, 77, 97, 104, 107, 137
ignoring, 77, 126
sproc, 77, 97, 107, 137
T
tag command, 126
$tagfile, 143
trace command, 4, 66, 126
tracei command, 92, 93, 127
tracing
deleting, 73, 115
disabling, 72, 116
enabling, 72, 116
procedures, 4, 66, 126, 127
process groups, 108
source lines, 4
status, 71, 121
variables, 4, 66, 92, 93, 126, 127, 128
troubleshooting, 4
type casting, 39
type conversion, 39
type declarations of program variable names, 45, 129
U
unalias command, 27, 128, 133
unconditional breakpoints, 2, 59
setting, 60, 121, 122
unrecord command, 29, 129
unset command, 21, 129
unstacking interactive function calls, 54
up command, 49, 129
use
path remapping, 15
use command, 7, 14, 129
V
variables
dbx. See dbx variables
do not display, 4
variables, predefined dbx. See predefined dbx
variables
variables, program, 33, 39
case sensitivity, 45, 137
changing values, 43, 113
determining scope, 45, 131
examining, 3
examining arrays, 42
names and C keyword conflicts, 44, 137
names and keyword conflicts, 44
printing, 41
qualifying variable names, 39, 46, 67
scope, 39, 41, 46, 49, 51
tracing, 4
type declarations, 45, 129
W
W, 136
waitall command, 103, 129
wait command, 103, 129
wait for active process, 103, 129
wait for process, 103, 129
wait for running process, 103, 129
155
Index
whatis command, 45, 129
when command, 68, 129
wheni command, 93, 94, 131
where command, 2, 47, 90, 131
which command, 45, 131
whichobj command, 6, 131
156
We'd Like to Hear From You
As a user of Silicon Graphics documentation, your comments are important
to us. They help us to better understand your needs and to improve the
quality of our documentation.
Any information that you provide will be useful. Here is a list of suggested
topics to comment on:
•
General impression of the document
•
Omission of material that you expected to find
•
Technical errors
•
Relevance of the material to the job you had to do
•
Quality of the printing and binding
Please include the title and part number of the document you are
commenting on. The part number for this document is
007-0906-090.
Thank you!
Three Ways to Reach Us
GE
NO POSTA
SARY
NECES D
IF MAILE
IN THE
S
D STATE
UNITE
BUSINES
S REPLY
MAIL
Inc.
Graphics, Blvd.
Silicon
Shoreline
2011 N. View, CA 94043
Mountain
The postcard opposite this page has space for your comments. Write your
comments on the postage-paid card for your country, then detach and mail
it. If your country is not listed, either use the international card and apply the
necessary postage or use electronic mail or FAX for your reply.
If electronic mail is available to you, write your comments in an e-mail
message and mail it to either of these addresses:
•
If you are on the Internet, use this address: [email protected]
•
For UUCP mail, use this address through any backbone site:
[your_site]!sgi!techpubs
You can forward your comments (or annotated copies of manual pages) to
Technical Publications at this FAX number:
415 965-0964


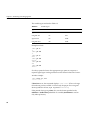


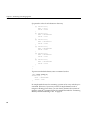
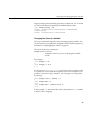

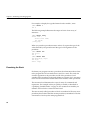

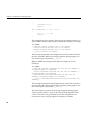
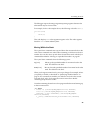
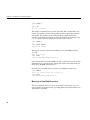


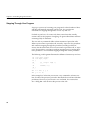


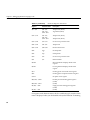

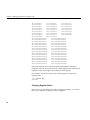

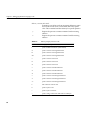
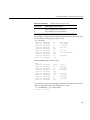
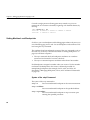


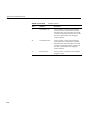


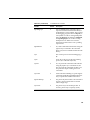
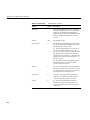


![v .] jCg _ 1l(_ `o,C..NN EinCOR `1_11E1](http://vs1.manualzilla.com/store/data/005961751_1-73960e1521729271050e00b8575619b8-150x150.png)
