1
User Guide
Anritsu PowerXpert™ and
USB Power Sensors
MA24104A, Inline High Power Sensor, 600 MHz to 4 GHz
MA24105A, Inline Peak Power Sensor, 350 MHz to 4 GHz
MA24106A, True-RMS Power Sensor, 10 MHz to 6 GHz
MA24108A, True-RMS Power Sensor, 10 MHz to 8 GHz
MA24118A, True-RMS Power Sensor, 10 MHz to 18 GHz
MA24126A, True-RMS Power Sensor, 10 MHz to 26 GHz
Anritsu Company
490 Jarvis Drive
Morgan Hill, CA 95037-2809
USA
PN: 10585-00020
Revision: C
Printed: November 2011
Copyright 2011 Anritsu Company
WARRANTY
The Anritsu products listed on the title page are warranted against defects in materials and workmanship for one (1)
year from the date of shipment.
Anritsu’s obligation covers repairing or replacing products which prove to be defective during the warranty period.
Buyers shall prepay transportation charges for equipment returned to Anritsu for warranty repairs. Obligation is
limited to the original purchaser. Anritsu is not liable for consequential damages.
LIMITATION OF WARRANTY
The foregoing warranty does not apply to Anritsu connectors that have failed due to normal wear. Also, the warranty
does not apply to defects resulting from improper or inadequate maintenance, unauthorized modification or misuse,
or operation outside of the environmental specifications of the product. No other warranty is expressed or implied,
and the remedies provided herein are the Buyer’s sole and exclusive remedies.
DISCLAIMER OF WARRANTY
DISCLAIMER OF WARRANTIES. TO THE MAXIMUM EXTENT PERMITTED BY APPLICABLE LAW, ANRITSU
COMPANY AND ITS SUPPLIERS DISCLAIM ALL WARRANTIES, EITHER EXPRESSED OR IMPLIED,
INCLUDING, BUT NOT LIMITED TO, IMPLIED WARRANTIES OF MERCHANTABILITY AND FITNESS FOR A
PARTICULAR PURPOSE, WITH REGARD TO THE PRODUCT. THE USER ASSUMES THE ENTIRE RISK OF
USING THE PRODUCT. ANY LIABILITY OF PROVIDER OR MANUFACTURER WILL BE LIMITED
EXCLUSIVELY TO PRODUCT REPLACEMENT.
NO LIABILITY FOR CONSEQUENTIAL DAMAGES. TO THE MAXIMUM EXTENT PERMITTED BY
APPLICABLE LAW, IN NO EVENT SHALL ANRITSU COMPANY OR ITS SUPPLIERS BE LIABLE FOR ANY
SPECIAL, INCIDENTAL, INDIRECT, OR CONSEQUENTIAL DAMAGES WHATSOEVER (INCLUDING,
WITHOUT LIMITATION, DAMAGES FOR LOSS OF BUSINESS PROFITS, BUSINESS INTERRUPTION, LOSS
OF BUSINESS INFORMATION, OR ANY OTHER PECUNIARY LOSS) ARISING OUT OF THE USE OF OR
INABILITY TO USE THE PRODUCT, EVEN IF ANRITSU COMPANY HAS BEEN ADVISED OF THE
POSSIBILITY OF SUCH DAMAGES. BECAUSE SOME STATES AND JURISDICTIONS DO NOT ALLOW THE
EXCLUSION OR LIMITATION OF LIABILITY FOR CONSEQUENTIAL OR INCIDENTAL DAMAGES, THE
ABOVE LIMITATION MAY NOT APPLY TO YOU.
TRADEMARK ACKNOWLEDGMENTS
Windows, Windows 7, Windows XP, Windows Vista, Windows 2000, Microsoft Excel and Microsoft Visual Basic are all
registered trademarks of Microsoft Corporation.
Acrobat Reader is a registered trademark of Adobe Corporation.
NOTICE
Anritsu Company has prepared this manual for use by Anritsu Company personnel and customers as a guide for the
proper installation, operation and maintenance of Anritsu Company equipment and computer programs. The
drawings, specifications, and information contained herein are the property of Anritsu Company, and any
unauthorized use or disclosure of these drawings, specifications, and information is prohibited; they shall not be
reproduced, copied, or used in whole or in part as the basis for manufacture or sale of the equipment or software
programs without the prior written consent of Anritsu Company.
UPDATES
Updates, if any, can be downloaded from the Documents area of the Anritsu Website at:
http://www.anritsu.com
For the latest service and sales contact information in your area, please visit:
http://www.anritsu.com/contact.asp
PowerXpert UG
PN: 10585-00020 Rev. C
Title-3
END-USER LICENSE AGREEMENT FOR ANRITSU SOFTWARE
IMPORTANT-READ CAREFULLY: This End-User License Agreement ("EULA") is a legal agreement between you
(either an individual or a single entity) and Anritsu for the Anritsu software product identified above, which includes
computer software and associated media and printed materials, and may include “online” or electronic documentation
(“SOFTWARE PRODUCT” or “SOFTWARE”). By receiving or otherwise using the SOFTWARE PRODUCT, you agree
to be bound by the terms of this EULA.
SOFTWARE PRODUCT LICENSE
The SOFTWARE PRODUCT is protected by copyright laws and international copyright treaties, as well as other
intellectual property laws and treaties. The SOFTWARE PRODUCT is licensed, not sold.
1. GRANT OF LICENSE. This EULA grants you the following rights:
a. You may use ONE copy of the Software Product identified above only on the hardware product (Anritsu instrument
and its internal computer) which it was originally installed. The SOFTWARE is in “use” on a computer when it is
loaded into temporary memory (for example, RAM) or installed into permanent memory (for example, hard disk,
CD-ROM, or other storage device) of that computer. However, installation on a network server for the sole purpose of
internal distribution to one or more other computer(s) shall not constitute “use.”
b. Solely with respect to electronic documents included with the SOFTWARE, you may make an unlimited number of
copies (either in hardcopy or electronic form), provided that such copies shall be used only for internal purposes and
are not republished or distributed to any third party.
2. OWNERSHIP. Except as expressly licensed to you in this Agreement, Anritsu retains all right, title, and interest in
and to the SOFTWARE PRODUCT; provided, however, that, subject to the license grant in Section 1.a and Anritsu's
ownership of the underlying SOFTWARE PRODUCT, you shall own all right, title and interest in and to any
Derivative Technology of the Product created by or for you.
3. COPYRIGHT. All title and copyrights in and to the SOFTWARE PRODUCT (including but not limited to any
images, photographs, animations, video, audio, music, text, and “applets” incorporated into the SOFTWARE
PRODUCT), the accompanying printed materials, and any copies of the SOFTWARE PRODUCT are owned by
Anritsu or its suppliers. The SOFTWARE PRODUCT is protected by copyright laws and international treaty
provisions. Therefore, you must treat the SOFTWARE PRODUCT like any other copyrighted material except that you
may make one copy of the SOFTWARE PRODUCT solely for backup or archival purposes. You may not copy any
printed materials accompanying the SOFTWARE PRODUCT.
4. DESCRIPTION OF OTHER RIGHTS AND LIMITATIONS.
a. Limitations on Reverse Engineering, Decompilation, and Disassembly. You may not reverse engineer, decompile, or
disassemble the SOFTWARE, except and only to the extent that such activity is expressly permitted by applicable law
notwithstanding this limitation.
b. Rental. You may not rent or lease the SOFTWARE PRODUCT.
c. Software Transfer. You may permanently transfer all of your rights under this EULA, provided that you retain no
copies, you transfer all of the SOFTWARE PRODUCT (including the Anritsu instrument, all component parts, the
media and printed materials, any upgrades, this EULA, and, if applicable, the Certificate of Authenticity), and the
recipient agrees to the terms of this EULA.
d. Termination. Without prejudice to any other rights, Anritsu may terminate this EULA if you fail to comply with the
terms and conditions of this EULA. In such event, you must destroy all copies of the SOFTWARE PRODUCT.
5. U.S. GOVERNMENT RESTRICTED RIGHTS. THE SOFTWARE PRODUCT AND DOCUMENTATION ARE
PROVIDED WITH RESTRICTED RIGHTS. USE, DUPLICATION, OR DISCLOSURE BY THE GOVERNMENT IS
SUBJECT TO RESTRICTIONS AS SET FORTH IN SUBPARAGRAPH (C)(1)(II) OF THE RIGHTS IN TECHNICAL
DATA AND COMPUTER SOFTWARE CLAUSE AT DFARS 252.227-7013 OR SUBPARAGRAPHS (C)(1) AND (2) OF
THE COMMERCIAL COMPUTER SOFTWARE-RESTRICTED RIGHTS AT 48 CFR 52.227-19, AS APPLICABLE.
MANUFACTURER IS ANRITSU COMPANY, 490 JARVIS DRIVE, MORGAN HILL, CALIFORNIA 95037-2809.
The Anritsu software is copyright © 2011, Anritsu Company. All rights are reserved by all parties.
Title-4
PN: 10585-00020 Rev. C
PowerXpert UG
Chinese RoHS Compliance Statements
MA24104A:
MA24105A, MA24106A, MA24108A, MA24118A, MA24126A:
PowerXpert UG
PN: 10585-00020 Rev. C
Title-5
European Parliament and Council Directive 2002/96/EC
Equipment Marked with the crossed-out Wheelie
Bin symbol complies with the European
Parliament and Council Directive 2002/96/EC (the
“WEEE Directive”) in the European Union.
For Products placed on the EU market after
August 13, 2005, please contact your local Anritsu
representative at the end of the product’s useful
life to arrange disposal in accordance with your
initial contract and the local law.
Title-6
PN: 10585-00020 Rev. C
PowerXpert UG
PowerXpert UG
PN: 10585-00020 Rev. C
Title-7
Title-8
PN: 10585-00020 Rev. C
PowerXpert UG
PowerXpert UG
PN: 10585-00020 Rev. C
Title-9
Title-10
PN: 10585-00020 Rev. C
PowerXpert UG
PowerXpert UG
PN: 10585-00020 Rev. C
Title-11
Notes On Export Management
This product and its manuals may require an Export License or approval by the government of the product
country of origin for re-export from your country.
Before you export this product or any of its manuals, please contact Anritsu Company to confirm whether or
not these items are export-controlled.
When disposing of export-controlled items, the products and manuals need to be broken or shredded to such a
degree that they cannot be unlawfully used for military purposes.
CE Conformity Marking
Anritsu affixes the CE Conformity marking onto its conforming products in accordance with Council Directives
of The Council Of The European Communities in order to indicate that these products conform to the EMC and
LVD directive of the European Union (EU).
C-tick Conformity Marking
Anritsu affixes the C-tick marking onto its conforming products in accordance with the electromagnetic
compliance regulations of Australia and New Zealand in order to indicate that these products conform to the
EMC regulations of Australia and New Zealand.
Title-12
PN: 10585-00020 Rev. C
PowerXpert UG
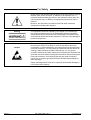
Safety Symbols
To prevent the risk of personal injury or loss related to equipment malfunction, Anritsu Company uses the
following symbols to indicate safety-related information. For your own safety, please read the information
carefully before operating the equipment.
Symbols Used in Manuals
Danger
This indicates a risk from a very dangerous condition or procedure that
could result in serious injury or death and possible loss related to
equipment malfunction. Follow all precautions and procedures to minimize
this risk.
Warning
This indicates a risk from a hazardous condition or procedure that could
result in light-to-severe injury or loss related to equipment malfunction.
Follow all precautions and procedures to minimize this risk.
Caution
This indicates a risk from a hazardous procedure that could result in loss
related to equipment malfunction. Follow all precautions and procedures to
minimize this risk.
Safety Symbols Used on Equipment and in Manuals
The following safety symbols are used inside or on the equipment near operation locations to provide
information about safety items and operation precautions. Ensure that you clearly understand the meanings of
the symbols and take the necessary precautions before operating the equipment. Some or all of the following
five symbols may or may not be used on all Anritsu equipment. In addition, there may be other labels attached
to products that are not shown in the diagrams in this manual.
This indicates a prohibited operation. The prohibited operation is indicated symbolically in or near
the barred circle.
This indicates a compulsory safety precaution. The required operation is indicated symbolically in or
near the circle.
This indicates a warning or caution. The contents are indicated symbolically in or near the triangle.
This indicates a note. The contents are described in the box.
These indicate that the marked part should be recycled.
PowerXpert UG
PN: 10585-00020 Rev. C
Safety-1
For Safety
Warning
Always refer to the operation manual when working near locations at which
the alert mark, shown on the left, is attached. If the operation, etc., is
performed without heeding the advice in the operation manual, there is a
risk of personal injury. In addition, the equipment performance may be
reduced.
Moreover, this alert mark is sometimes used with other marks and
descriptions indicating other dangers.
Warning
Caution
This equipment cannot be repaired by the operator. Do not attempt to
remove the equipment covers or to disassemble internal components.
Only qualified service technicians with a knowledge of electrical fire and
shock hazards should service this equipment. There is a risk of damage to
precision components.
Electrostatic Discharge (ESD) can damage the highly sensitive circuits in
the instrument. ESD is most likely to occur as test devices are being
connected to, or disconnected from, the instrument’s front and rear panel
ports and connectors. You can protect the instrument and test devices by
wearing a static-discharge wristband. Alternatively, you can ground
yourself to discharge any static charge by touching the outer chassis of the
grounded instrument before touching the instrument’s front and rear panel
ports and connectors. Avoid touching the test port center conductors
unless you are properly grounded and have eliminated the possibility of
static discharge.
Repair of damage that is found to be caused by electrostatic discharge is
not covered under warranty.
Safety-2
PN: 10585-00020 Rev. C
PowerXpert UG
Table of Contents
Chapter 1—General Information
1-3
Description . . . . . . . . . . . . . . . . . . . . . . . . . . . . . . . . . . . . . . . . . . . . . . . . . . . . . . . . . . . . . . . . 1-1
1-4
CD-ROM Contents . . . . . . . . . . . . . . . . . . . . . . . . . . . . . . . . . . . . . . . . . . . . . . . . . . . . . . . . . .
PowerXpert Installation Program. . . . . . . . . . . . . . . . . . . . . . . . . . . . . . . . . . . . . . . . . . . . .
Microsoft® .NET Framework Version 2.0 Installation Program . . . . . . . . . . . . . . . . . . . . . .
User Guide . . . . . . . . . . . . . . . . . . . . . . . . . . . . . . . . . . . . . . . . . . . . . . . . . . . . . . . . . . . . .
Product Brochures. . . . . . . . . . . . . . . . . . . . . . . . . . . . . . . . . . . . . . . . . . . . . . . . . . . . . . . .
Measurement Uncertainty Calculator . . . . . . . . . . . . . . . . . . . . . . . . . . . . . . . . . . . . . . . . .
Sample Visual Basic Program Folder . . . . . . . . . . . . . . . . . . . . . . . . . . . . . . . . . . . . . . . . .
1-5
Initial Inspection . . . . . . . . . . . . . . . . . . . . . . . . . . . . . . . . . . . . . . . . . . . . . . . . . . . . . . . . . . . . 1-2
1-6
Sensor Identification . . . . . . . . . . . . . . . . . . . . . . . . . . . . . . . . . . . . . . . . . . . . . . . . . . . . . . . . . 1-3
Customer Asset Tag Placement . . . . . . . . . . . . . . . . . . . . . . . . . . . . . . . . . . . . . . . . . . . . . 1-3
1-7
Preparation for Storage/Shipment . . . . . . . . . . . . . . . . . . . . . . . . . . . . . . . . . . . . . . . . . . . . . . 1-4
1-8
Contacting Anritsu . . . . . . . . . . . . . . . . . . . . . . . . . . . . . . . . . . . . . . . . . . . . . . . . . . . . . . . . . . 1-4
1-1
1-1
1-1
1-1
1-2
1-2
1-2
Chapter 2—Installation (PC Only)
2-2
Hardware and Software Requirements. . . . . . . . . . . . . . . . . . . . . . . . . . . . . . . . . . . . . . . . . . . 2-1
2-3
PowerXpert Application and Power Sensor Drivers . . . . . . . . . . . . . . . . . . . . . . . . . . . . . . . . . 2-1
Installing PowerXpert. . . . . . . . . . . . . . . . . . . . . . . . . . . . . . . . . . . . . . . . . . . . . . . . . . . . . . 2-2
Installing Power Sensor Drivers . . . . . . . . . . . . . . . . . . . . . . . . . . . . . . . . . . . . . . . . . . . . . 2-5
Chapter 3—Using PowerXpert™
3-2
PowerXpert Settings . . . . . . . . . . . . . . . . . . . . . . . . . . . . . . . . . . . . . . . . . . . . . . . . . . . . . . . . . 3-2
3-3
PowerXpert™ Overview . . . . . . . . . . . . . . . . . . . . . . . . . . . . . . . . . . . . . . . . . . . . . . . . . . . . . .
Numerical Display Area . . . . . . . . . . . . . . . . . . . . . . . . . . . . . . . . . . . . . . . . . . . . . . . . . . . .
Sensor Information Area . . . . . . . . . . . . . . . . . . . . . . . . . . . . . . . . . . . . . . . . . . . . . . . . . . .
Graticule Settings and Graphical Display Area . . . . . . . . . . . . . . . . . . . . . . . . . . . . . . . . . .
3-4
Continuous Mode . . . . . . . . . . . . . . . . . . . . . . . . . . . . . . . . . . . . . . . . . . . . . . . . . . . . . . . . . .
Duty Cycle . . . . . . . . . . . . . . . . . . . . . . . . . . . . . . . . . . . . . . . . . . . . . . . . . . . . . . . . . . . . .
Relative . . . . . . . . . . . . . . . . . . . . . . . . . . . . . . . . . . . . . . . . . . . . . . . . . . . . . . . . . . . . . . .
Units . . . . . . . . . . . . . . . . . . . . . . . . . . . . . . . . . . . . . . . . . . . . . . . . . . . . . . . . . . . . . . . . .
Forward Measurement . . . . . . . . . . . . . . . . . . . . . . . . . . . . . . . . . . . . . . . . . . . . . . . . . . .
Reverse Measurement . . . . . . . . . . . . . . . . . . . . . . . . . . . . . . . . . . . . . . . . . . . . . . . . . . .
Video Bandwidth . . . . . . . . . . . . . . . . . . . . . . . . . . . . . . . . . . . . . . . . . . . . . . . . . . . . . . . .
Aperture Time . . . . . . . . . . . . . . . . . . . . . . . . . . . . . . . . . . . . . . . . . . . . . . . . . . . . . . . . . .
Measurement Hold . . . . . . . . . . . . . . . . . . . . . . . . . . . . . . . . . . . . . . . . . . . . . . . . . . . . . .
Apply Above Settings Button . . . . . . . . . . . . . . . . . . . . . . . . . . . . . . . . . . . . . . . . . . . . . . .
3-10
3-10
3-10
3-10
3-11
3-11
3-11
3-11
3-12
3-12
3-5
Time Slot Mode. . . . . . . . . . . . . . . . . . . . . . . . . . . . . . . . . . . . . . . . . . . . . . . . . . . . . . . . . . . .
Number of Slots. . . . . . . . . . . . . . . . . . . . . . . . . . . . . . . . . . . . . . . . . . . . . . . . . . . . . . . . .
Slot Width . . . . . . . . . . . . . . . . . . . . . . . . . . . . . . . . . . . . . . . . . . . . . . . . . . . . . . . . . . . . .
Start and End Exclusion . . . . . . . . . . . . . . . . . . . . . . . . . . . . . . . . . . . . . . . . . . . . . . . . . .
Apply Above Settings Button . . . . . . . . . . . . . . . . . . . . . . . . . . . . . . . . . . . . . . . . . . . . . . .
3-12
3-12
3-13
3-13
3-13
PowerXpert UG
PN: 10585-00020 Rev. C
3-4
3-6
3-6
3-7
Contents-1
Table of Contents (Continued)
3-6
Scope Mode . . . . . . . . . . . . . . . . . . . . . . . . . . . . . . . . . . . . . . . . . . . . . . . . . . . . . . . . . . . . . .
Capture Time . . . . . . . . . . . . . . . . . . . . . . . . . . . . . . . . . . . . . . . . . . . . . . . . . . . . . . . . . . .
Data Points . . . . . . . . . . . . . . . . . . . . . . . . . . . . . . . . . . . . . . . . . . . . . . . . . . . . . . . . . . . .
Gate and Fence . . . . . . . . . . . . . . . . . . . . . . . . . . . . . . . . . . . . . . . . . . . . . . . . . . . . . . . . .
Apply Above Settings Button . . . . . . . . . . . . . . . . . . . . . . . . . . . . . . . . . . . . . . . . . . . . . . .
3-13
3-13
3-14
3-16
3-17
3-7
General Settings . . . . . . . . . . . . . . . . . . . . . . . . . . . . . . . . . . . . . . . . . . . . . . . . . . . . . . . . . . .
Zero Sensor . . . . . . . . . . . . . . . . . . . . . . . . . . . . . . . . . . . . . . . . . . . . . . . . . . . . . . . . . . . .
Frequency . . . . . . . . . . . . . . . . . . . . . . . . . . . . . . . . . . . . . . . . . . . . . . . . . . . . . . . . . . . . .
Auto Average . . . . . . . . . . . . . . . . . . . . . . . . . . . . . . . . . . . . . . . . . . . . . . . . . . . . . . . . . . .
Auto Averaging Source . . . . . . . . . . . . . . . . . . . . . . . . . . . . . . . . . . . . . . . . . . . . . . . . . . .
Averaging Method . . . . . . . . . . . . . . . . . . . . . . . . . . . . . . . . . . . . . . . . . . . . . . . . . . . . . . .
Averages . . . . . . . . . . . . . . . . . . . . . . . . . . . . . . . . . . . . . . . . . . . . . . . . . . . . . . . . . . . . . .
Offset . . . . . . . . . . . . . . . . . . . . . . . . . . . . . . . . . . . . . . . . . . . . . . . . . . . . . . . . . . . . . . . . .
Range . . . . . . . . . . . . . . . . . . . . . . . . . . . . . . . . . . . . . . . . . . . . . . . . . . . . . . . . . . . . . . . .
Apply Above Settings Button . . . . . . . . . . . . . . . . . . . . . . . . . . . . . . . . . . . . . . . . . . . . . . .
3-17
3-17
3-17
3-18
3-18
3-18
3-19
3-19
3-19
3-19
3-8
Trigger Settings. . . . . . . . . . . . . . . . . . . . . . . . . . . . . . . . . . . . . . . . . . . . . . . . . . . . . . . . . . . .
Trigger Source . . . . . . . . . . . . . . . . . . . . . . . . . . . . . . . . . . . . . . . . . . . . . . . . . . . . . . . . . .
Trigger Arm Type. . . . . . . . . . . . . . . . . . . . . . . . . . . . . . . . . . . . . . . . . . . . . . . . . . . . . . . .
Trigger Level . . . . . . . . . . . . . . . . . . . . . . . . . . . . . . . . . . . . . . . . . . . . . . . . . . . . . . . . . . .
Trigger Edge . . . . . . . . . . . . . . . . . . . . . . . . . . . . . . . . . . . . . . . . . . . . . . . . . . . . . . . . . . .
Trigger Delay . . . . . . . . . . . . . . . . . . . . . . . . . . . . . . . . . . . . . . . . . . . . . . . . . . . . . . . . . . .
Noise Immunity . . . . . . . . . . . . . . . . . . . . . . . . . . . . . . . . . . . . . . . . . . . . . . . . . . . . . . . . .
Arm Trigger Button . . . . . . . . . . . . . . . . . . . . . . . . . . . . . . . . . . . . . . . . . . . . . . . . . . . . . .
3-20
3-20
3-20
3-21
3-21
3-21
3-22
3-22
3-9
Tools . . . . . . . . . . . . . . . . . . . . . . . . . . . . . . . . . . . . . . . . . . . . . . . . . . . . . . . . . . . . . . . . . . . .
Zero All Sensors . . . . . . . . . . . . . . . . . . . . . . . . . . . . . . . . . . . . . . . . . . . . . . . . . . . . . . . .
Capture Screen . . . . . . . . . . . . . . . . . . . . . . . . . . . . . . . . . . . . . . . . . . . . . . . . . . . . . . . . .
Log Data . . . . . . . . . . . . . . . . . . . . . . . . . . . . . . . . . . . . . . . . . . . . . . . . . . . . . . . . . . . . . .
Multiple Sensor Display . . . . . . . . . . . . . . . . . . . . . . . . . . . . . . . . . . . . . . . . . . . . . . . . . . .
View Summary. . . . . . . . . . . . . . . . . . . . . . . . . . . . . . . . . . . . . . . . . . . . . . . . . . . . . . . . . .
Offset Table . . . . . . . . . . . . . . . . . . . . . . . . . . . . . . . . . . . . . . . . . . . . . . . . . . . . . . . . . . . .
Updating the Firmware . . . . . . . . . . . . . . . . . . . . . . . . . . . . . . . . . . . . . . . . . . . . . . . . . . .
3-23
3-23
3-23
3-24
3-25
3-26
3-27
3-27
3-10 Settings . . . . . . . . . . . . . . . . . . . . . . . . . . . . . . . . . . . . . . . . . . . . . . . . . . . . . . . . . . . . . . . . . .
Saving and Recalling Settings . . . . . . . . . . . . . . . . . . . . . . . . . . . . . . . . . . . . . . . . . . . . . .
Resetting to Factory Settings. . . . . . . . . . . . . . . . . . . . . . . . . . . . . . . . . . . . . . . . . . . . . . .
Sensor Time Out Setting . . . . . . . . . . . . . . . . . . . . . . . . . . . . . . . . . . . . . . . . . . . . . . . . . .
Secure Mode . . . . . . . . . . . . . . . . . . . . . . . . . . . . . . . . . . . . . . . . . . . . . . . . . . . . . . . . . . .
3-28
3-28
3-28
3-28
3-30
3-11 Help . . . . . . . . . . . . . . . . . . . . . . . . . . . . . . . . . . . . . . . . . . . . . . . . . . . . . . . . . . . . . . . . . . . . 3-31
Contents-2
PN: 10585-00020 Rev. C
PowerXpert UG
Table of Contents (Continued)
Chapter 4—Power Sensor Care
4-2
Power Sensor Precautions . . . . . . . . . . . . . . . . . . . . . . . . . . . . . . . . . . . . . . . . . . . . . . . . . . . . 4-1
4-3
RF Connector Precautions . . . . . . . . . . . . . . . . . . . . . . . . . . . . . . . . . . . . . . . . . . . . . . . . . . . . 4-2
4-4
Connection Techniques . . . . . . . . . . . . . . . . . . . . . . . . . . . . . . . . . . . . . . . . . . . . . . . . . . . . . . 4-3
Connection Procedure. . . . . . . . . . . . . . . . . . . . . . . . . . . . . . . . . . . . . . . . . . . . . . . . . . . . . 4-3
Disconnection Procedure . . . . . . . . . . . . . . . . . . . . . . . . . . . . . . . . . . . . . . . . . . . . . . . . . . 4-3
4-5
RF Connector Preventive Care. . . . . . . . . . . . . . . . . . . . . . . . . . . . . . . . . . . . . . . . . . . . . . . . .
Visual Inspection . . . . . . . . . . . . . . . . . . . . . . . . . . . . . . . . . . . . . . . . . . . . . . . . . . . . . . . . .
Pin Depth Measurement . . . . . . . . . . . . . . . . . . . . . . . . . . . . . . . . . . . . . . . . . . . . . . . . . . .
Pin Depth Dimensions . . . . . . . . . . . . . . . . . . . . . . . . . . . . . . . . . . . . . . . . . . . . . . . . . . . . .
Pin Depth Gauge . . . . . . . . . . . . . . . . . . . . . . . . . . . . . . . . . . . . . . . . . . . . . . . . . . . . . . . . .
Pin Depth Tolerances . . . . . . . . . . . . . . . . . . . . . . . . . . . . . . . . . . . . . . . . . . . . . . . . . . . . .
4-4
4-4
4-4
4-5
4-6
4-6
4-6
Connector Cleaning . . . . . . . . . . . . . . . . . . . . . . . . . . . . . . . . . . . . . . . . . . . . . . . . . . . . . . . . .
Required Cleaning Items . . . . . . . . . . . . . . . . . . . . . . . . . . . . . . . . . . . . . . . . . . . . . . . . . . .
Important Cleaning Tips . . . . . . . . . . . . . . . . . . . . . . . . . . . . . . . . . . . . . . . . . . . . . . . . . . .
Cleaning Procedure. . . . . . . . . . . . . . . . . . . . . . . . . . . . . . . . . . . . . . . . . . . . . . . . . . . . . . .
4-7
4-7
4-7
4-7
Chapter 5—Using the MA24104A
5-1
Sensor Overview . . . . . . . . . . . . . . . . . . . . . . . . . . . . . . . . . . . . . . . . . . . . . . . . . . . . . . . . . . . 5-1
5-2
Making Measurements . . . . . . . . . . . . . . . . . . . . . . . . . . . . . . . . . . . . . . . . . . . . . . . . . . . . . . .
Basic Power Measurement . . . . . . . . . . . . . . . . . . . . . . . . . . . . . . . . . . . . . . . . . . . . . . . . .
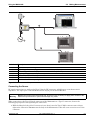
Connecting the Sensor . . . . . . . . . . . . . . . . . . . . . . . . . . . . . . . . . . . . . . . . . . . . . . . . . . . .
Zeroing the Sensor . . . . . . . . . . . . . . . . . . . . . . . . . . . . . . . . . . . . . . . . . . . . . . . . . . . . . . .
Calibrating the Sensor . . . . . . . . . . . . . . . . . . . . . . . . . . . . . . . . . . . . . . . . . . . . . . . . . . . . .
Applying a Calibration Factor Correction. . . . . . . . . . . . . . . . . . . . . . . . . . . . . . . . . . . . . . .
Optimizing the Readings . . . . . . . . . . . . . . . . . . . . . . . . . . . . . . . . . . . . . . . . . . . . . . . . . . .
5-1
5-2
5-3
5-4
5-4
5-4
5-4
5-3
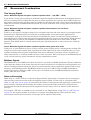
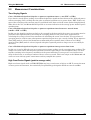
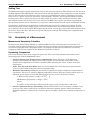
Measurement Considerations. . . . . . . . . . . . . . . . . . . . . . . . . . . . . . . . . . . . . . . . . . . . . . . . . .
Time Varying Signals. . . . . . . . . . . . . . . . . . . . . . . . . . . . . . . . . . . . . . . . . . . . . . . . . . . . . .
Multitone Signals . . . . . . . . . . . . . . . . . . . . . . . . . . . . . . . . . . . . . . . . . . . . . . . . . . . . . . . . .
Noise and Averaging . . . . . . . . . . . . . . . . . . . . . . . . . . . . . . . . . . . . . . . . . . . . . . . . . . . . . .
Settling Time . . . . . . . . . . . . . . . . . . . . . . . . . . . . . . . . . . . . . . . . . . . . . . . . . . . . . . . . . . . .
Maximum Power . . . . . . . . . . . . . . . . . . . . . . . . . . . . . . . . . . . . . . . . . . . . . . . . . . . . . . . . .
5-6
5-6
5-6
5-6
5-7
5-7
5-4
Uncertainty of a Measurement . . . . . . . . . . . . . . . . . . . . . . . . . . . . . . . . . . . . . . . . . . . . . . . . .
Measurement Uncertainty Calculator . . . . . . . . . . . . . . . . . . . . . . . . . . . . . . . . . . . . . . . . .
Uncertainty Components . . . . . . . . . . . . . . . . . . . . . . . . . . . . . . . . . . . . . . . . . . . . . . . . . . .
Uncertainty Examples . . . . . . . . . . . . . . . . . . . . . . . . . . . . . . . . . . . . . . . . . . . . . . . . . . . . .
5-8
5-8
5-8
5-9
5-5
Error States. . . . . . . . . . . . . . . . . . . . . . . . . . . . . . . . . . . . . . . . . . . . . . . . . . . . . . . . . . . . . . . 5-10
PowerXpert UG
PN: 10585-00020 Rev. C
Contents-3
Table of Contents (Continued)
Chapter 6—Operational Testing for the MA24104A
6-2
Precautions . . . . . . . . . . . . . . . . . . . . . . . . . . . . . . . . . . . . . . . . . . . . . . . . . . . . . . . . . . . . . . . 6-1
6-3
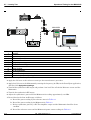
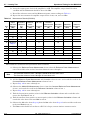
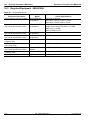
Required Equipment - MA24104A . . . . . . . . . . . . . . . . . . . . . . . . . . . . . . . . . . . . . . . . . . . . . . 6-2
6-4
VSWR Pretest. . . . . . . . . . . . . . . . . . . . . . . . . . . . . . . . . . . . . . . . . . . . . . . . . . . . . . . . . . . . . . 6-3
6-5
Directivity Test . . . . . . . . . . . . . . . . . . . . . . . . . . . . . . . . . . . . . . . . . . . . . . . . . . . . . . . . . . . . . 6-4
6-6
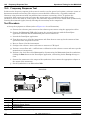
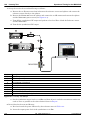
Frequency Response Test . . . . . . . . . . . . . . . . . . . . . . . . . . . . . . . . . . . . . . . . . . . . . . . . . . . . 6-6
6-7
Linearity Test . . . . . . . . . . . . . . . . . . . . . . . . . . . . . . . . . . . . . . . . . . . . . . . . . . . . . . . . . . . . . . 6-8
Chapter 7—Using the MA24105A
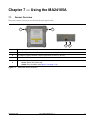
7-1
Sensor Overview. . . . . . . . . . . . . . . . . . . . . . . . . . . . . . . . . . . . . . . . . . . . . . . . . . . . . . . . . . . . 7-1
7-2
Making Measurements . . . . . . . . . . . . . . . . . . . . . . . . . . . . . . . . . . . . . . . . . . . . . . . . . . . . . . .
Basic Power Measurement . . . . . . . . . . . . . . . . . . . . . . . . . . . . . . . . . . . . . . . . . . . . . . . . .
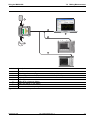
Connecting the Sensor . . . . . . . . . . . . . . . . . . . . . . . . . . . . . . . . . . . . . . . . . . . . . . . . . . . .
Zeroing the Sensor . . . . . . . . . . . . . . . . . . . . . . . . . . . . . . . . . . . . . . . . . . . . . . . . . . . . . . .
Calibrating the Sensor . . . . . . . . . . . . . . . . . . . . . . . . . . . . . . . . . . . . . . . . . . . . . . . . . . . . .
Applying a Calibration Factor Correction . . . . . . . . . . . . . . . . . . . . . . . . . . . . . . . . . . . . . . .
Optimizing the Readings . . . . . . . . . . . . . . . . . . . . . . . . . . . . . . . . . . . . . . . . . . . . . . . . . . .
7-2
7-2
7-4
7-4
7-4
7-4
7-4
7-3
Measurement Considerations . . . . . . . . . . . . . . . . . . . . . . . . . . . . . . . . . . . . . . . . . . . . . . . . . .
Multitone Signals . . . . . . . . . . . . . . . . . . . . . . . . . . . . . . . . . . . . . . . . . . . . . . . . . . . . . . . . .
Noise and Averaging . . . . . . . . . . . . . . . . . . . . . . . . . . . . . . . . . . . . . . . . . . . . . . . . . . . . . .
Settling Time . . . . . . . . . . . . . . . . . . . . . . . . . . . . . . . . . . . . . . . . . . . . . . . . . . . . . . . . . . . .
Maximum Power . . . . . . . . . . . . . . . . . . . . . . . . . . . . . . . . . . . . . . . . . . . . . . . . . . . . . . . . .
7-6
7-6
7-6
7-6
7-6
7-4
Uncertainty of a Measurement . . . . . . . . . . . . . . . . . . . . . . . . . . . . . . . . . . . . . . . . . . . . . . . . . 7-8
Measurement Uncertainty Calculator . . . . . . . . . . . . . . . . . . . . . . . . . . . . . . . . . . . . . . . . . 7-8
Uncertainty Examples . . . . . . . . . . . . . . . . . . . . . . . . . . . . . . . . . . . . . . . . . . . . . . . . . . . . . 7-9
7-5
Error States. . . . . . . . . . . . . . . . . . . . . . . . . . . . . . . . . . . . . . . . . . . . . . . . . . . . . . . . . . . . . . . 7-10
Chapter 8—Operational Testing for the MA24105A
8-2
Precautions . . . . . . . . . . . . . . . . . . . . . . . . . . . . . . . . . . . . . . . . . . . . . . . . . . . . . . . . . . . . . . . 8-1
8-3
Required Equipment - MA24105A . . . . . . . . . . . . . . . . . . . . . . . . . . . . . . . . . . . . . . . . . . . . . . 8-2
8-4
VSWR Pretest. . . . . . . . . . . . . . . . . . . . . . . . . . . . . . . . . . . . . . . . . . . . . . . . . . . . . . . . . . . . . . 8-3
8-5
Directivity Test . . . . . . . . . . . . . . . . . . . . . . . . . . . . . . . . . . . . . . . . . . . . . . . . . . . . . . . . . . . . . 8-4
8-6
Frequency Response Test . . . . . . . . . . . . . . . . . . . . . . . . . . . . . . . . . . . . . . . . . . . . . . . . . . . . 8-7
8-7
Linearity Test . . . . . . . . . . . . . . . . . . . . . . . . . . . . . . . . . . . . . . . . . . . . . . . . . . . . . . . . . . . . . . 8-9
Chapter 9—Using the MA24106A
9-1
Sensor Overview. . . . . . . . . . . . . . . . . . . . . . . . . . . . . . . . . . . . . . . . . . . . . . . . . . . . . . . . . . . . 9-1
9-2
Making Measurements . . . . . . . . . . . . . . . . . . . . . . . . . . . . . . . . . . . . . . . . . . . . . . . . . . . . . . .
Basic Power Measurement . . . . . . . . . . . . . . . . . . . . . . . . . . . . . . . . . . . . . . . . . . . . . . . . .
Connecting the DUT . . . . . . . . . . . . . . . . . . . . . . . . . . . . . . . . . . . . . . . . . . . . . . . . . . . . . .
Zeroing the Sensor . . . . . . . . . . . . . . . . . . . . . . . . . . . . . . . . . . . . . . . . . . . . . . . . . . . . . . .
Calibrating the Sensor . . . . . . . . . . . . . . . . . . . . . . . . . . . . . . . . . . . . . . . . . . . . . . . . . . . . .
Applying a Calibration Factor Correction . . . . . . . . . . . . . . . . . . . . . . . . . . . . . . . . . . . . . . .
Optimizing the Readings . . . . . . . . . . . . . . . . . . . . . . . . . . . . . . . . . . . . . . . . . . . . . . . . . . .
Contents-4
PN: 10585-00020 Rev. C
9-1
9-1
9-2
9-3
9-3
9-3
9-3
PowerXpert UG
Table of Contents (Continued)
9-3
Measurement Considerations. . . . . . . . . . . . . . . . . . . . . . . . . . . . . . . . . . . . . . . . . . . . . . . . . .
Time Varying Signals. . . . . . . . . . . . . . . . . . . . . . . . . . . . . . . . . . . . . . . . . . . . . . . . . . . . . .
High Crest Factor Signals (peak to average ratio) . . . . . . . . . . . . . . . . . . . . . . . . . . . . . . .
Multitone Signals . . . . . . . . . . . . . . . . . . . . . . . . . . . . . . . . . . . . . . . . . . . . . . . . . . . . . . . . .
Noise and Averaging . . . . . . . . . . . . . . . . . . . . . . . . . . . . . . . . . . . . . . . . . . . . . . . . . . . . . .
Settling Time . . . . . . . . . . . . . . . . . . . . . . . . . . . . . . . . . . . . . . . . . . . . . . . . . . . . . . . . . . . .
9-5
9-5
9-5
9-6
9-6
9-7
9-4
Uncertainty of a Measurement . . . . . . . . . . . . . . . . . . . . . . . . . . . . . . . . . . . . . . . . . . . . . . . . . 9-7
Measurement Uncertainty Calculator . . . . . . . . . . . . . . . . . . . . . . . . . . . . . . . . . . . . . . . . . 9-7
Uncertainty Example . . . . . . . . . . . . . . . . . . . . . . . . . . . . . . . . . . . . . . . . . . . . . . . . . . . . . . 9-8
9-5
Error States. . . . . . . . . . . . . . . . . . . . . . . . . . . . . . . . . . . . . . . . . . . . . . . . . . . . . . . . . . . . . . . . 9-9
Chapter 10—Operational Testing for the MA24106A
10-2 Precautions . . . . . . . . . . . . . . . . . . . . . . . . . . . . . . . . . . . . . . . . . . . . . . . . . . . . . . . . . . . . . . 10-1
10-3 Required Equipment - MA24106A . . . . . . . . . . . . . . . . . . . . . . . . . . . . . . . . . . . . . . . . . . . . . 10-2
10-4 VSWR Pretest. . . . . . . . . . . . . . . . . . . . . . . . . . . . . . . . . . . . . . . . . . . . . . . . . . . . . . . . . . . . . 10-3
10-5 Frequency Response Test . . . . . . . . . . . . . . . . . . . . . . . . . . . . . . . . . . . . . . . . . . . . . . . . . . . 10-4
10-6 Linearity Test . . . . . . . . . . . . . . . . . . . . . . . . . . . . . . . . . . . . . . . . . . . . . . . . . . . . . . . . . . . . . 10-6
Chapter 11—Using the MA24108A, MA24118A, and MA24126A
11-1 Sensor Overview . . . . . . . . . . . . . . . . . . . . . . . . . . . . . . . . . . . . . . . . . . . . . . . . . . . . . . . . . . 11-1
11-2 Making Measurements . . . . . . . . . . . . . . . . . . . . . . . . . . . . . . . . . . . . . . . . . . . . . . . . . . . . . .
Basic Power Measurement . . . . . . . . . . . . . . . . . . . . . . . . . . . . . . . . . . . . . . . . . . . . . . . .
Connecting the DUT . . . . . . . . . . . . . . . . . . . . . . . . . . . . . . . . . . . . . . . . . . . . . . . . . . . . .
Zeroing the Sensor . . . . . . . . . . . . . . . . . . . . . . . . . . . . . . . . . . . . . . . . . . . . . . . . . . . . . .
Calibrating the Sensor . . . . . . . . . . . . . . . . . . . . . . . . . . . . . . . . . . . . . . . . . . . . . . . . . . . .
Applying a Calibration Factor Correction. . . . . . . . . . . . . . . . . . . . . . . . . . . . . . . . . . . . . .
Optimizing the Readings . . . . . . . . . . . . . . . . . . . . . . . . . . . . . . . . . . . . . . . . . . . . . . . . . .
11-1
11-1
11-2
11-2
11-3
11-3
11-3
11-3 Measurement Considerations. . . . . . . . . . . . . . . . . . . . . . . . . . . . . . . . . . . . . . . . . . . . . . . . .
High Crest Factor Signals (peak to average ratio) . . . . . . . . . . . . . . . . . . . . . . . . . . . . . .
Multitone Signals . . . . . . . . . . . . . . . . . . . . . . . . . . . . . . . . . . . . . . . . . . . . . . . . . . . . . . . .
Noise and Averaging . . . . . . . . . . . . . . . . . . . . . . . . . . . . . . . . . . . . . . . . . . . . . . . . . . . . .
Average Value of Time Varying Signals . . . . . . . . . . . . . . . . . . . . . . . . . . . . . . . . . . . . . .
Settling Time . . . . . . . . . . . . . . . . . . . . . . . . . . . . . . . . . . . . . . . . . . . . . . . . . . . . . . . . . . .
Noise and Time Resolution in Scope Mode . . . . . . . . . . . . . . . . . . . . . . . . . . . . . . . . . . .
Optimizing Internal Triggering . . . . . . . . . . . . . . . . . . . . . . . . . . . . . . . . . . . . . . . . . . . . . .
Noise Floor in Scope Mode . . . . . . . . . . . . . . . . . . . . . . . . . . . . . . . . . . . . . . . . . . . . . . . .
11-5
11-5
11-5
11-6
11-6
11-6
11-7
11-7
11-7
11-4 Uncertainty of a Measurement . . . . . . . . . . . . . . . . . . . . . . . . . . . . . . . . . . . . . . . . . . . . . . . . 11-8
Measurement Uncertainty Calculator . . . . . . . . . . . . . . . . . . . . . . . . . . . . . . . . . . . . . . . . 11-8
Uncertainty Examples . . . . . . . . . . . . . . . . . . . . . . . . . . . . . . . . . . . . . . . . . . . . . . . . . . . . 11-9
11-5 Error States. . . . . . . . . . . . . . . . . . . . . . . . . . . . . . . . . . . . . . . . . . . . . . . . . . . . . . . . . . . . . . 11-11
PowerXpert UG
PN: 10585-00020 Rev. C
Contents-5
Chapter 12—Operational Testing for the MA24108A, MA24118A, and MA24126A
12-2 Precautions . . . . . . . . . . . . . . . . . . . . . . . . . . . . . . . . . . . . . . . . . . . . . . . . . . . . . . . . . . . . . . 12-1
12-3 Required Equipment - MA24108A/118A/126A . . . . . . . . . . . . . . . . . . . . . . . . . . . . . . . . . . . . 12-2
12-4 VSWR Pretest. . . . . . . . . . . . . . . . . . . . . . . . . . . . . . . . . . . . . . . . . . . . . . . . . . . . . . . . . . . . . 12-3
12-5 Frequency Response Test . . . . . . . . . . . . . . . . . . . . . . . . . . . . . . . . . . . . . . . . . . . . . . . . . . . 12-4
12-6 Linearity Test . . . . . . . . . . . . . . . . . . . . . . . . . . . . . . . . . . . . . . . . . . . . . . . . . . . . . . . . . . . . . 12-7
Chapter 13—Remote Operation
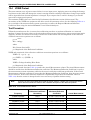
13-2 Programming the Sensor . . . . . . . . . . . . . . . . . . . . . . . . . . . . . . . . . . . . . . . . . . . . . . . . . . . .
Send and Receive Format . . . . . . . . . . . . . . . . . . . . . . . . . . . . . . . . . . . . . . . . . . . . . . . . .
HyperTerminal . . . . . . . . . . . . . . . . . . . . . . . . . . . . . . . . . . . . . . . . . . . . . . . . . . . . . . . . . .
Time Resolution. . . . . . . . . . . . . . . . . . . . . . . . . . . . . . . . . . . . . . . . . . . . . . . . . . . . . . . . .
Sampling Rate . . . . . . . . . . . . . . . . . . . . . . . . . . . . . . . . . . . . . . . . . . . . . . . . . . . . . . . . . .
Error Responses . . . . . . . . . . . . . . . . . . . . . . . . . . . . . . . . . . . . . . . . . . . . . . . . . . . . . . . .
Default Sensor Settings . . . . . . . . . . . . . . . . . . . . . . . . . . . . . . . . . . . . . . . . . . . . . . . . . . .
13-1
13-1
13-1
13-2
13-2
13-2
13-2
13-3 General Purpose Commands . . . . . . . . . . . . . . . . . . . . . . . . . . . . . . . . . . . . . . . . . . . . . . . . . 13-4
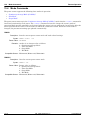
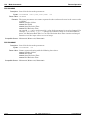
13-4 Mode Commands . . . . . . . . . . . . . . . . . . . . . . . . . . . . . . . . . . . . . . . . . . . . . . . . . . . . . . . . .
Continuous Average Mode (CA Mode) . . . . . . . . . . . . . . . . . . . . . . . . . . . . . . . . . . . . . .
Slot Mode. . . . . . . . . . . . . . . . . . . . . . . . . . . . . . . . . . . . . . . . . . . . . . . . . . . . . . . . . . . . .
Scope Mode. . . . . . . . . . . . . . . . . . . . . . . . . . . . . . . . . . . . . . . . . . . . . . . . . . . . . . . . . . .
13-18
13-19
13-19
13-21
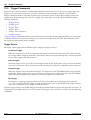
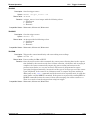
13-5 Trigger Commands . . . . . . . . . . . . . . . . . . . . . . . . . . . . . . . . . . . . . . . . . . . . . . . . . . . . . . . .
Trigger Source . . . . . . . . . . . . . . . . . . . . . . . . . . . . . . . . . . . . . . . . . . . . . . . . . . . . . . . . .
Trigger Level . . . . . . . . . . . . . . . . . . . . . . . . . . . . . . . . . . . . . . . . . . . . . . . . . . . . . . . . . .
Trigger Edge . . . . . . . . . . . . . . . . . . . . . . . . . . . . . . . . . . . . . . . . . . . . . . . . . . . . . . . . . .
Trigger Delay . . . . . . . . . . . . . . . . . . . . . . . . . . . . . . . . . . . . . . . . . . . . . . . . . . . . . . . . . .
Trigger Noise Immunity . . . . . . . . . . . . . . . . . . . . . . . . . . . . . . . . . . . . . . . . . . . . . . . . . .
Trigger Arming . . . . . . . . . . . . . . . . . . . . . . . . . . . . . . . . . . . . . . . . . . . . . . . . . . . . . . . . .
13-24
13-24
13-26
13-26
13-27
13-28
13-29
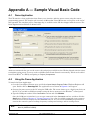
Appendix A—Sample Visual Basic Code
A-2
Using the Demo Application . . . . . . . . . . . . . . . . . . . . . . . . . . . . . . . . . . . . . . . . . . . . . . . . . . . A-1
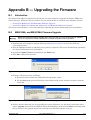
Appendix B—Upgrading the Firmware
B-2
MA24104A, and MA24106A Firmware Upgrade . . . . . . . . . . . . . . . . . . . . . . . . . . . . . . . . . . . B-1
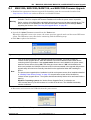
B-3
MA24105A, MA24108A, MA24118A, and MA24126A Firmware Upgrade . . . . . . . . . . . . . . . . B-5
Removing Old Upgrade Driver. . . . . . . . . . . . . . . . . . . . . . . . . . . . . . . . . . . . . . . . . . . . . . . B-7
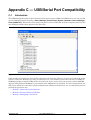
Appendix C—USB/Serial Port Compatibility
C-2
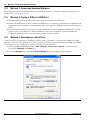
Method 1–Download Updated Software . . . . . . . . . . . . . . . . . . . . . . . . . . . . . . . . . . . . . . . . . . C-2
Index
Alphabetical Index of Programming Commands
Contents-6
PN: 10585-00020 Rev. C
PowerXpert UG
Chapter 1 — General Information
1-1
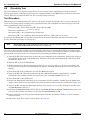
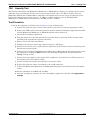
Scope of Manual
This manual provides general information, installation, and operating information for the Anritsu MA24104A,
MA24105A, MA24106A, MA24108A, MA24118A, and MA24126A USB Power Sensors and the Anritsu
PowerXpert™ application. Throughout this manual, the terms MA24104A, MA24105A, MA24106A,
MA24108A, MA24118A, MA24126A, and power sensor are used interchangeably to refer to the device. Manual
organization is shown in the table of contents.
1-2
Introduction
This chapter contains general information about the Anritsu USB power sensors. It includes a general
description of the device and information on its identification number, information on initial inspection, and
preparation for storage and shipment.
1-3
Description
The Anritsu USB power sensors are highly accurate, standalone instruments that communicate with a PC
via USB. The power sensors also communicate with many Anritsu handheld instruments such as Spectrum
Master, BTS Master, VNA Master, Cell Master, and Site Master (Option 19 required in these instruments).
The sensors are ideal for measuring the average power of CW or modulated RF waveforms such as 3G, 4G,
OFDM, and multitone signals. In other words, they measure true-RMS power regardless of the type of input
signal.
The MA24104A and MA24106A have a USB 2.0 interface with a USB Type Mini-B port.
Note
The MA24105A, MA24108A, MA24118A, and MA24126A have a USB 2.0 interface with a USB Type
Micro-B port. These interfaces are USB 2.0 compatible, but with an interface speed of 12 Mbps, and
they also supply power to the sensors.
The power sensors can be remotely programmed over this USB interface.
1-4
CD-ROM Contents
The PowerXpert CD-ROM contains the following programs, documents and accessories, all of which are
accessible from the CD-ROM startup page (startup.htm):
PowerXpert Installation Program
Provides the user interface to the power sensor via USB connection to a PC.
Microsoft® .NET Framework Version 2.0 Installation Program
Available for installation if .NET Framework does not already exist on your PC. The PowerXpert installation
program will detect whether or not this is already on your PC and will provide a message if it is not installed.
User Guide
The User Guide contains instructions for installation, operation and operational testing for all the USB power
sensors and the PowerXpert application.
PowerXpert UG
PN: 10585-00020 Rev. C
1-1
1-5
Initial Inspection
General Information
Product Brochures
Links to product brochures provide complete operational specifications and features for your power sensor.
Measurement Uncertainty Calculator
A Microsoft Excel tool for calculating power uncertainty is provided. It contains two tabs; one that provides
measurement uncertainty for each sensor (selectable from a drop-down menu), and another tab that provides
additional uncertainty components and calculated values for the MA24105A Peak Power Sensor.
Sample Visual Basic Program Folder
Provides a link to a folder containing a sample application (DemoApp.exe) written in Microsoft Visual
Basic® 6.0. This application and its code are provided as an example so the user can develop custom
applications for use with the power sensor. Instructions for use, and the code for DemoApp is included in
Appendix A.
1-5
Initial Inspection
Inspect the shipping container for damage. If the shipping container is damaged, retain it until the contents of
the shipment have been checked against the packing list and the power sensor has been checked for
mechanical and electrical operation. The following items are included with every shipment:
MA24104A:
• MA24104A, Inline High Power Sensor
• 2300-526, Installation CD
• Quick Start Guide
• 2000-1566-R, USB 2.0A to Mini-B Cable
• 800-441, RS232 Cable
• 40-168-R, External Power Supply
• 69747, AA Alkaline Batteries (qty 3)
MA24105A:
• MA24105A, Inline Peak Power Sensor
• 2300-526, Installation CD
• Quick Start Guide
• 2000-1606-R, 1.8 meter USB A to Micro-B Cable with Latch
MA24106A:
• MA24106A, USB Power Sensor
• 2300-526, Installation CD
• Quick Start Guide
• 2000-1566-R, USB 2.0 A to Mini-B Cable
MA24108A, MA24118A, and MA24126A:
• MA24108A, MA24118A, or MA24126A USB Power Sensor
• 2300-526, Installation CD
• Quick Start Guide
• 2000-1606-R, 1.8 meter USB A to Micro-B Cable with Latch
• 2000-1605-R, 1.5 meter BNC(M) to MCX(M) Cable
1-2
PN: 10585-00020 Rev. C
PowerXpert UG
General Information
1-6
Sensor Identification
If the shipment is incomplete or if the power sensor is damaged mechanically or electrically, notify your local
sales representative or Anritsu Customer Service. If the shipping container is damaged or shows signs of
stress, notify the carrier as well as Anritsu. Keep the shipping materials for the carrier's inspection.
1-6
Sensor Identification
All Anritsu power sensors are assigned a unique seven digit serial number, such as “0701012”. The serial
number is printed on a label that is affixed to the unit. When ordering parts or corresponding with Anritsu
Customer Service, please use the correct serial number with reference to the specific instrument's model
number (for example, model MA24126A power sensor, serial number: 0701012).
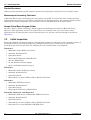
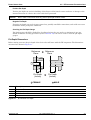
Customer Asset Tag Placement
When affixing an asset tag to the power sensors, please use an area on the cover plate as indicated below to
ensure that the asset tag is retained with the product during service.
Figure 1-1.
Customer Asset Tag Placement
PowerXpert UG
PN: 10585-00020 Rev. C
1-3
1-7
Preparation for Storage/Shipment
1-7
General Information
Preparation for Storage/Shipment
Preparing the power sensor for storage consists of cleaning the unit, packing the inside with
moisture-absorbing desiccant crystals, and storing the unit in the recommended temperature environment.
Please refer to the data sheet for storage temperature recommendations.
To provide maximum protection against damage in transit, the power sensor should be repackaged in the
original shipping container. If this container is no longer available and the unit is being returned to Anritsu for
repair, please advise Anritsu Customer Service; they will send a new shipping container free of charge. In the
event neither of these two options is possible, instructions for packaging and shipment are given below:
Note
Disconnect any USB and Trigger cables before packaging the power sensor.
• Use a Suitable Container: Obtain a corrugated cardboard carton. This carton should have inside
dimensions of no less than 15 cm larger than the unit dimensions to allow for cushioning.
• Protect the Instrument: Surround the unit with polyethylene sheeting to protect the finish.
• Cushion the Instrument: Cushion the instrument on all sides by tightly packing urethane foam
between the carton and the unit. Provide at least three inches of dunnage on all sides.
• Seal the Container: Seal the carton by using either shipping tape or an industrial stapler.
• Address the Container: If the instrument is being returned to Anritsu for service, mark the address of
the appropriate Anritsu service center and your return address on the carton in one or more prominent
locations.
1-8
Contacting Anritsu
To contact Anritsu, please visit:
http://www.anritsu.com/contact.asp
From here, you can select the latest sales, service and support contact information in your country or region,
provide online feedback, complete a “Talk to Anritsu” form to get your questions answered, or obtain other
services offered by Anritsu.
1-9
Product Update Information
Updated product information can be found via the Anritsu Power Meters and Sensors product page:
The URL to this page is:
http://www.anritsu.com/en-US/Products-Solutions/Test-Measurement/RF-Microwave/Power-Meters-and-Senso
rs/index.aspx
Selecting your product model from the product page will lead you to a Library tab that contains links to all of
the latest documentation and downloads related to your Anritsu product.
1-4
PN: 10585-00020 Rev. C
PowerXpert UG
Chapter 2 — Installation (PC Only)
2-1
Introduction
This chapter provides information on installing the Anritsu PowerXpert™ application and the MA24104A,
MA24105A, MA24106A, MA24108A, MA24118A, or MA24126A power sensor drivers. It contains the following:
• “Hardware and Software Requirements” for the Anritsu PowerXpert Application
• “Installing PowerXpert” procedure
• “Installing Power Sensor Drivers” procedure
2-2
Hardware and Software Requirements
Please make sure that the following minimum requirements are met for installing and using the software:
• Intel® Pentium® III with 1 GB RAM or Intel® Pentium® IV with 512 MB RAM, or equivalent
(Intel® Pentium® IV with 1 GB RAM recommended; a dual core processor with 2 GB RAM is
recommended for use with the multisensor feature.)
• All versions of Microsoft® Windows 7 and Windows Vista®, Windows XP or Windows 2000
• 100 MB hard-disk free space
• Display resolution 1024 × 768
• USB 2.0 full speed (compatible with USB 1.0 and 1.1) interface
• CD-ROM drive
2-3
PowerXpert Application and Power Sensor Drivers
Both the PowerXpert application and power sensor drivers must be installed before using the power sensor.
Follow the steps below as a guide for proper installation.
Earlier versions of PowerXpert and the ATMEL SAM-BA software must first be uninstalled from the
PC before installing PowerXpert.
Note
Earlier versions of the MA24108A, MA24118A, or MA24126A power sensors must be upgraded with
firmware version 2.0 or later to use all of the features of PowerXpert (firmware must be upgraded
using PowerXpert). Refer to Appendix B, “Upgrading the Firmware” for information about upgrading
the power sensor firmware.
PowerXpert UG
PN: 10585-00020 Rev. C
2-1
2-3
PowerXpert Application and Power Sensor Drivers
Installation (PC Only)
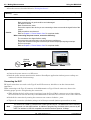
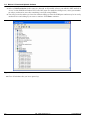
Installing PowerXpert
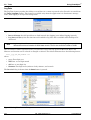
1. Insert the installation CD in the drive of your computer. If the menu does not open automatically, open
the file named Startup.htm located on the CD.
Figure 2-1.
Anritsu PowerXpert CD Menu
2. Click Install Anritsu PowerXpert™ and select Run to start the installation.
Note
The PowerXpert application installation will halt if the Microsoft® .Net Framework version 2.0 is not
installed. If required, please install this from the menu.
3. Click Next in the following screen to begin the installation process.
Figure 2-2.
2-2
Installing Anritsu PowerXpert Application
PN: 10585-00020 Rev. C
PowerXpert UG
Installation (PC Only)
2-3
PowerXpert Application and Power Sensor Drivers
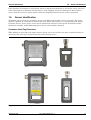
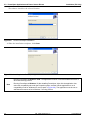
4. Read the license agreement and select “I Agree” to continue, then click Next.
Figure 2-3.
PowerXpert License
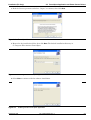
5. Browse for the installation folder, then click Next. The default installation directory is:
C:\Program Files\Anritsu\PowerXpert
Figure 2-4.
Installing Anritsu PowerXpert Application
6. Select Next to continue with the software installation.
Figure 2-5.
Installing Anritsu PowerXpert Application
PowerXpert UG
PN: 10585-00020 Rev. C
2-3
2-3
PowerXpert Application and Power Sensor Drivers
Installation (PC Only)
The software installs to the selected location.
Figure 2-6.
Anritsu PowerXpert Installation
7. When the installation completes, click Close.
Figure 2-7.
Installing Anritsu PowerXpert Application
Running PowerXpert in Windows Vista: The application must be run as administrator because of
strict Vista security policies.
Note
2-4
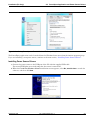
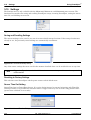
Running PowerXpert in Windows 7: After installing PowerXpert, right click the application icon,
select the compatibility tab under the Properties option, and then set the application to run in
compatibility mode for Windows XP service pack 3 (Figure 2-8). The application must be run as
administrator because of strict Windows 7 security policies.
PN: 10585-00020 Rev. C
PowerXpert UG
Installation (PC Only)
Figure 2-8.
2-3
PowerXpert Application and Power Sensor Drivers
Setting PowerXpert to Run in Windows XP Compatibility Mode
The PowerXpert application can be launched from the Windows Start menu from the Anritsu program group.
If you are installing a new power sensor, continue to the next section, “Installing Power Sensor Drivers”.
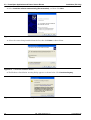
Installing Power Sensor Drivers
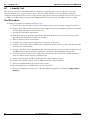
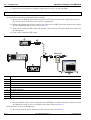
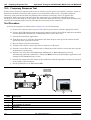
1. Connect the power sensor to the USB port of the PC with the supplied USB cable.
The status LED lights green indicating that the sensor is turned ON.
2. When the Found New Hardware Wizard installation screen appears, select No, not this time to search for
software, and then click Next.
Figure 2-9.
Found New Hardware Wizard
PowerXpert UG
PN: 10585-00020 Rev. C
2-5
2-3
PowerXpert Application and Power Sensor Drivers
Installation (PC Only)
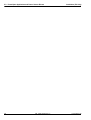
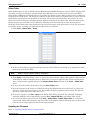
3. Select Install the software automatically (Recommended), and then click Next.
Figure 2-10. Found New Hardware Wizard
4. Select the sensor being installed from the list, then click Next as shown below.
Figure 2-11. Found New Hardware Wizard
5. The Hardware Installation warning dialog appears as shown below. Click Continue Anyway.
Figure 2-12. Hardware Installation Warning
2-6
PN: 10585-00020 Rev. C
PowerXpert UG
Installation (PC Only)
2-3
PowerXpert Application and Power Sensor Drivers
The hardware driver installs automatically.
Figure 2-13. Found New Hardware Wizard
6. When the installation is complete, click Finish to close the wizard.
Figure 2-14. Found New Hardware Wizard
7. The power sensor is now ready for use. Launch the Anritsu PowerXpert application from the new desktop
icon or from the Start | Programs | Anritsu menu. Refer to Chapter 3, “Using PowerXpert™” for
information about using the Anritsu PowerXpert application.
PowerXpert UG
PN: 10585-00020 Rev. C
2-7
2-3
2-8
PowerXpert Application and Power Sensor Drivers
PN: 10585-00020 Rev. C
Installation (PC Only)
PowerXpert UG
Chapter 3 — Using PowerXpert™
3-1
Introduction
This chapter provides information and instructions on using the Anritsu PowerXpert™ application, a data
analysis and control software for use with Anritsu’s USB power sensors. PowerXpert provides a graphical user
interface (GUI), making the PC appear like a traditional power meter that facilitates average power, time slot,
and scope-like measurements. PowerXpert is capable of simultaneous operation of up to eight power sensors
and, depending on which power sensors are connected to the PC, the PowerXpert application operates in three
distinct modes as follows:
• “Continuous Mode” available with all power sensors
• “Time Slot Mode” available with the MA24108A, MA24118A, and MA24126A only
• “Scope Mode” available with the MA24108A, MA24118A, and MA24126A only
For information about using your power sensor, refer to one of the following Chapters for your power sensor:
• Chapter 5, “Using the MA24104A”
• Chapter 7, “Using the MA24105A”
• Chapter 9, “Using the MA24106A”
• Chapter 11, “Using the MA24108A, MA24118A, and MA24126A”
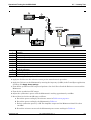
The power sensors are also compatible with the Option 19 enabled Site Master™, Cell Master™,
Spectrum Master™, BTS Master™, VNA Master™, and the MS271xB Economy Microwave Spectrum Analyzer
family of instruments. The power sensor easily connects to these instruments via a USB A to Mini-/Micro-B
cable, turning them into a virtual power meter. Please refer to instrument-specific user guides for operation of
the sensors.
PowerXpert UG
PN: 10585-00020 Rev. C
3-1
3-2
3-2
Using PowerXpert™
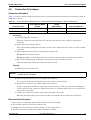
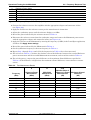
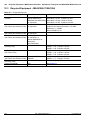
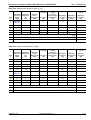
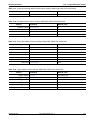
PowerXpert Settings
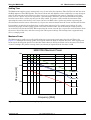
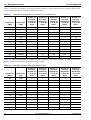
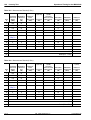
PowerXpert Settings
PowerXpert always starts up in the default state of the connected sensor. Upon disconnection from
PowerXpert, the power sensor resets and, after reconnection, restarts in the default state. Some features and
settings offered by PowerXpert are only available with select power sensor models.
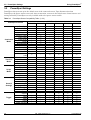
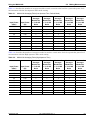
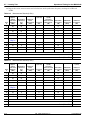
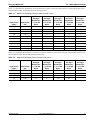
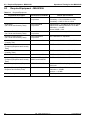
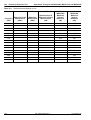
Table 3-1.
PowerXpert Sensor Compatibility Table (1 of 2)
PowerXpert Features
Duty Cycle
Relative Mode
Units
Aperture time
Forward Power
Reverse Power
Peak Power
Crest Factor
Continuous
Mode
CCDF
Burst Average
Reflection Coeff
Return-loss
VSWR
Video BW
Measurement
hold
Number of slots
Slot width
Time Slot
Mode
Start exclusion
End exclusion
Capture time
Data points
Gate start
Scope
Mode
Gate end
Fence start
Fence end
Zero sensor
Frequency
Auto average
Auto avgsrc
General
Settings
Averaging method
Averages
Offset
Range
Source
Arm Type
Level
Trigger
Edge
Delay
Noise immunity
3-2
USB Power Sensors
MA24104A MA24105A MA24106A MA24108A MA24118A MA24126A
x
x
x
x
-
x
x
x
x
x
x
x
x
x
x
x
x
x
x
x
x
x
-
x
x
x
x
x
-
x
x
x
x
x
-
x
x
x
x
x
-
x
-
x
x
x
x
x
x
x
x
-
x
x
x
x
x
-
x
x
x
x
-
x
x
x
x
x
x
x
x
x
x
x
x
x
x
x
x
x
x
x
x
x
x
x
x
x
x
x
x
x
x
x
x
x
x
x
x
x
x
x
x
x
x
x
x
x
x
x
x
x
x
x
x
x
x
x
x
x
x
x
x
x
x
x
x
x
x
x
x
x
x
x
x
PN: 10585-00020 Rev. C
PowerXpert UG
Using PowerXpert™
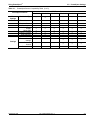
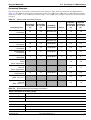
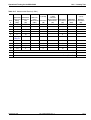
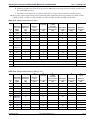
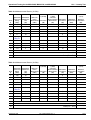
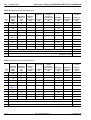
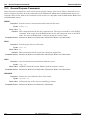
Table 3-1.
3-2
PowerXpert Settings
PowerXpert Sensor Compatibility Table (2 of 2)
PowerXpert Features
USB Power Sensors
MA24104A MA24105A MA24106A MA24108A MA24118A MA24126A
More
Settings
Modulation Type
Tools
Zero all sensors
x
x
x
x
x
x
Capture Screen
Log data
Multiple sensor
display
Offset table
Update Firmware
View Summary
Save/Recall setup
Reset to factory
settings
Set sensor
timeout
Secure Mode
x
x
x
x
x
x
x
x
x
x
x
x
x
x
x
x
x
x
x
x
-
x
x
-
x
x
-
x
x
x
x
x
x
-
-
-
x
x
x
-
-
-
x
x
x
-
-
-
x
x
x
Settings
PowerXpert UG
-
x
-
PN: 10585-00020 Rev. C
-
-
-
3-3
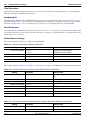
PowerXpert™ Overview
3-3
Using PowerXpert™
PowerXpert™ Overview
3-3
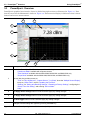
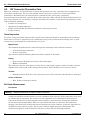
PowerXpert’s graphical user interface layout is divided into eight sections as illustrated in Figure 3-1. Note
that the screen for the MA24105A is shown in Figure 3-2. This numerical display is different in that it shows
forward and reverse measurements.
8
7
1
2
3
4
5
Index
6
Description
The Anritsu PowerXpert Tool Bar selects one of the following three modes:
“Continuous Mode” available with all power sensors
“Time Slot Mode” available with the MA24108A, MA24118A, and MA24126A only
“Scope Mode” available with the MA24108A, MA24118A, and MA24126A only
1
2
3
4
5 and 6
Figure 3-1.
3-4
The tool bar also provides access to:
“Tools” to “Zero All Sensors”, “Capture Screen”, “Log Data”, show the “Multiple Sensor Display”,
set up an “Offset Table”, and for “Updating the Firmware”
“Settings” for “Saving and Recalling Settings”, “Resetting to Factory Settings”, configuring the
“Sensor Time Out Setting”, and entering “Secure Mode”
“Help”
Displays the selected “Continuous Mode”, “Time Slot Mode”, or “Scope Mode” Settings.
The Apply above settings button must be clicked to apply any setting changes.
“General Settings”
The Apply above settings button must be clicked to apply any setting changes.
“Trigger Settings” available with the MA24108A, MA24118A, and MA24126A only
The Arm trigger button must be clicked to apply any setting changes.
“Graticule Settings and Graphical Display Area”
Changes to these settings are applied by pressing the Enter key.
Anritsu PowerXpert Application GUI Overview (1 of 2)
PN: 10585-00020 Rev. C
PowerXpert UG
Using PowerXpert™
7
8
Figure 3-1.
3-3
PowerXpert™ Overview
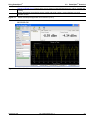
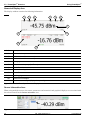
“Numerical Display Area” (Note that the screen shown for MA24105A displays two values, forward and
reverse).
Sensor Information Area showing sensor model and serial number, communications port, and
firmware version.
Anritsu PowerXpert Application GUI Overview (2 of 2)
MA24105A GUI
Figure 3-2.
MA24105A GUI
PowerXpert UG
PN: 10585-00020 Rev. C
3-5
3-3
PowerXpert™ Overview
Using PowerXpert™
Numerical Display Area
The display window contains the following information:
1
2
3
4
5
6
7
9
8
10
11
Index
Description
1
Communications port to which the sensor is connected
2
Model number of the connected power sensor
3
Serial number of the connected power sensor
4
Averaging count
5
Measurement frequency (Cal Factor)
6
Fixed offset value
7
Numerical reading with units of measure
8
Sensor Zero status
9
Data Logging status
10
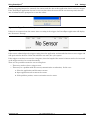
Sensor error messages
11
Sensor status messages (displayed temporarily)
Figure 3-3.
Anritsu PowerXpert Numerical Display Area
Sensor Information Area
When using multiple sensors, the sensor parameters and numerical and graphical displays are associated with
the selected sensor in the Sensor Information area.
Figure 3-4.
3-6
Selecting Sensor
PN: 10585-00020 Rev. C
PowerXpert UG
Using PowerXpert™
3-3
PowerXpert™ Overview
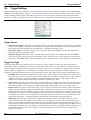
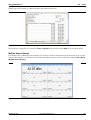
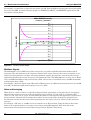
Graticule Settings and Graphical Display Area
This section provides a brief overview of the graticule settings and graphical display areas that are presented
in the different operating modes of PowerXpert. The Power versus Time graph is used in all modes and
provides the ability to plot measured power with respect to time (or time slots). This feature can be used for
drift testing, tuning circuits, and for monitoring circuit behaviors to external stimuli. The graph starts
automatically and updates continuously in real time.
The following Power versus Time graph is used in “Continuous Mode”:
2
4
5
1
3
Index
Description
Graticule settings area:
Time Span (min): Sets the current time span setting from 0.1 minutes up to a maximum of
1440 minutes.
Power Max (dBm): Sets the upper power level for the vertical scale.
Power Min (dBm): Sets the lower power level for the vertical scale.
Scale Mode: Sets the vertical scaling to Automatic or Manual (Power Max (dBm) and
Power Min (dBm) settings are not available when set to Automatic).
1
2
3
Changes to these settings are applied by pressing the Enter key.
The vertical scale displays the power level in dBm, regardless of the Units settings of dBm, µW, mW,
or W from the “Continuous Mode” settings area.
The horizontal scale displays the time in minutes and may be increased or decreased from the
graticule settings area. This scale increases up to a maximum of 1440 minutes.
4
Graphical trace display showing the power level as a function of time.
5
Marker showing as a vertical blue line with an x on the marker point and numerical values for the time
(in minutes) and power level (in dBm). The marker is available for reading power at an instant of time.
It can be dragged with the mouse and can be centered in the display via the Center marker button.
Figure 3-5.
Anritsu PowerXpert Graphical Display Area (Continuous Average Mode)
PowerXpert UG
PN: 10585-00020 Rev. C
3-7
3-3
PowerXpert™ Overview
Using PowerXpert™
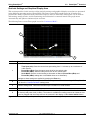
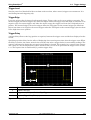
The following Power versus Time graph is used in “Time Slot Mode” and is available only with the MA24108A,
MA24118A, and MA24126A power sensors.
7
2
6
4
5
1
3
Index
Description
Graticule Settings:
1
Number of Slots: Displays the current number of slots setting. This setting is changed via the
“Time Slot Mode” settings area.
Power Max (dBm): Sets the upper power level for the vertical scale.
Power Min (dBm): Sets the lower power level for the vertical scale.
Scale Mode: Sets the vertical scaling to Automatic or Manual (Power Max (dBm) and
Power Min (dBm) settings are not available when set to Automatic).
Changes to these settings are applied by pressing the Enter key.
2
The vertical scale displays the power level in dBm.
3
The horizontal scale displays the time slots and may be increased or decreased from the “Time Slot
Mode” settings area.
4
Graphical slot display showing the slot power level as a function of time slot number.
5
6
7
Figure 3-6.
3-8
Marker showing as a vertical blue line with an x on the marker point and numerical values for the time
slot number and power level (in dBm). The marker is available for reading power at an instant of time.
It can be dragged with the mouse and can be centered in the display via the Center marker button.
Trigger Level Marker: Shows the current trigger level position. The trigger level is set via the “Trigger
Settings” area.
Trigger Delay Time: Shows the current trigger delay position. The trigger delay is set via the “Trigger
Settings” area. Note that the trigger marker will not be visible for positive trigger delays.
Anritsu PowerXpert Graphical Display Area (Time Slot Mode)
PN: 10585-00020 Rev. C
PowerXpert UG
Using PowerXpert™
3-3
PowerXpert™ Overview
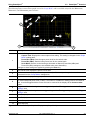
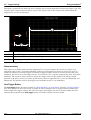
The following Power versus Time graph is used in “Scope Mode” and is available only with the MA24108A,
MA24118A, and MA24126A power sensors.
5
4
7
6
2
8
9
10
11
1
Index
3
Description
Graticule Settings:
Capture Time: Displays the current capture time setting. This setting is changed via the “Scope
Mode” settings area.
Power Max (dBm): Sets the upper power level for the vertical scale.
Power Min (dBm): Sets the lower power level for the vertical scale.
Scale Mode: Sets the vertical scaling to Automatic or Manual (Power Max (dBm) and
Power Min (dBm) settings are not available when set to Automatic).
1
Changes to these settings are applied by pressing the Enter key.
2
The vertical scale displays the power level in dBm.
3
The horizontal scale displays the total capture time (in milliseconds) and may be increased or
decreased from the “Scope Mode” settings area
4
Graphical trace display showing the power level as a function of time.
5
6
7
Marker showing as a vertical blue line with an x on the marker point and numerical values for the time
(in milliseconds) and power level (in dBm). The marker is available for reading power at an instant of
time. It can be dragged with the mouse and can be centered in the display via the Center marker
button.
Trigger Level Marker showing the current trigger level position. The trigger level is set in the “Trigger
Settings” area.
Trigger Delay Time showing the current trigger delay position. The trigger delay is set in the “Trigger
Settings” area.
8
Gate Start (ms)
9
Gate End (ms)
10
Fence Start (ms)
11
Fence End (ms)
Figure 3-7.
Anritsu PowerXpert Graphical Display Area (Scope Mode)
PowerXpert UG
PN: 10585-00020 Rev. C
3-9
3-4
Using PowerXpert™
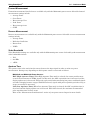
Continuous Mode
3-4
Continuous Mode
Continuous Mode is the default mode in which the PowerXpert starts and displays the average power of the
input signal. In this mode, the sensor is “continuously triggered” and collects data at all times. The description
of the Continuous Mode settings are given below:
1
2
All Other Models
MA24105A
3
Must be clicked to
Apply above settings
Index Description
1
2
3
All Models except MA24105A
Model MA24105A Only
Must be clicked to apply above settings.
Figure 3-8.
Continuous Mode Settings (Aperture time settings vary depending on sensor model)
Duty Cycle
Duty cycle is available only with the MA24108A, MA24118A, and MA24126A power sensors. Duty cycle
correction is applied (as a percentage) to the measured average power of a pulse modulated signal to obtain the
pulse power. The duty cycle correction is used to find the power during the pulse, given a measurement of the
average power of a pulse modulated signal for which the duty cycle is known, and is calculated as follows:
Linear units: Pulse power = Average power / (duty cycle % / 100)
dBm: Pulse power = Average power – 10 x Log (duty cycle % / 100)
Note
On the MA24105A sensor, Duty Cycle is only used for dedicated burst average measurement.
Relative
Relative measurement displays power changes with respect to the displayed power when relative mode is
turned on. To reset the power reference, turn relative mode Off, and then back on. This mode is particularly
useful to study drift or measure (loss of) attenuator and (gain of) amplifiers.
Units
Displays units of power in linear or log scale (dBm, µW, mW, or W).
3-10
PN: 10585-00020 Rev. C
PowerXpert UG
Using PowerXpert™
3-4
Continuous Mode
Forward Measurement
Forward measurements listed below are available only with the MA24105A power sensor. Selectable forward
measurement settings include:
• Average Power
• Crest Factor
• Burst Average User
• Peak Power
• Burst Average Auto
• CCDF
Reverse Measurement
Reverse measurements are available only with the MA24105A power sensor. Selectable reverse measurement
settings include:
• Average Power
• Reflection Coefficient
• Return Loss
• VSWR
Video Bandwidth
Video Bandwidth settings are available only with the MA24105A power sensor. Selectable peak measurement
video bandwidths include:
• Full
• 200 KHz
• 4 KHz
Aperture Time
The aperture time is the total time the sensor observes the input signal in order to make one power
measurement. Settings vary depending on which power sensor is connected as follows:
MA24104A and MA24106A Power Sensors:
HAT (High Aperture Time): When High Aperture Time mode is selected, the sensor provides more
accurate measurements of TDMA signals. In this mode, the ADC acquisition time is increased and the
display update rate is decreased. This mode can be useful when measuring low power, modulated signals
and when changing between ranges. With HAT selected, signals with pulse repetition periods as long as
50 ms can usually be measured.
LAT (Low Aperture Time): When Low Aperture Time mode is selected, the ADC acquisition time is
decreased and the display update rate is increased. With LAT selected, the maximum recommended
pulse repetition time is about 10 ms.
Refer to the “Measurement Considerations” section of your power sensor chapter for more details.
PowerXpert UG
PN: 10585-00020 Rev. C
3-11
3-5
Using PowerXpert™
Time Slot Mode
MA24108A, MA24118A, and MA24126A Power Sensors
If external averaging is selected, two or more of these measurements are averaged together to form the
displayed power. PowerXpert automatically uses a default aperture time based upon the connected
sensor. For example, when using MA24118A with a 20 ms aperture time, the sensor collects 2860
samples (with ~142 KHz sampling rate), and averages them together to compute the measurement
value. Depending upon the measurement speed requirements or signal type, aperture time can be
increased or decreased. For slow moving modulated signals, higher aperture time setting may be
required to obtain stable readings. Refer to the “Measurement Considerations” section of your power
sensor chapter for more details.
Note
Aperture Time is not available on the MA24105A sensor.
Measurement Hold
When set to On, holds the last sensor readings. When set to Off, the sensor continues to sample measurements.
Measurement hold is not used on the MA24105A.
Apply Above Settings Button
The Apply Above Settings button applies all changes made to the “Continuous Mode” settings. Changes to
these settings do not take effect until this button is clicked.
3-5
Time Slot Mode
Time Slot mode is only available with power sensor models MA24108A, MA24118A, and MA24126A. Time Slot
mode is generally used for performing measurements on TDMA waveforms like GSM/EDGE. The slot mode
breaks up the measurement into equal time slots and calculates the average power reading for each individual
slot. The measurements need to be triggered internally or externally. Unwanted portions in the transition from
one time slot to the next can be masked by user-definable exclusion periods. It is necessary that the waveform
under test consists of equally spaced time slots and that the settings exactly match the waveform.
The descriptions of the Time Slot mode settings are given below:
1
Index
1
Must be clicked to
Apply above settings
Description
Button must be clicked to apply above settings
Figure 3-9.
Time Slot Mode Settings
Number of Slots
The number of time slots that make a single frame. PowerXpert can support up to 128 slots. A single marker
can be set on a particular slot to read average power in that slot. The power reading is the average power of all
the samples falling within that slot.
3-12
PN: 10585-00020 Rev. C
PowerXpert UG
Using PowerXpert™
3-6
Scope Mode
Slot Width
Slot width is the width of each slot in milliseconds. All slots in a single frame should have exactly the same
width.
Start and End Exclusion
Start exclusion is the time in milliseconds to be excluded from the beginning of each slot for power calculation.
End exclusion is the time in milliseconds to be excluded at the end of each slot for power calculation. This
feature is generally used to define spacing between slots, although it may not be evident from the Time Slot
mode graph. the following are general guidelines for Time Slot mode settings:
• The exclusions should not eclipse the entire slot width:
Start Exclusion + End exclusion < Slot width
• The maximum capture time is limited by the sensor:
Slot width x Number of slots = Total capture time
Apply Above Settings Button
The Apply above settings button applies all changes made to the “Time Slot Mode” settings. Changes to these
settings do not take effect until clicking this button.
3-6
Scope Mode
Scope mode is only available with power sensor models MA24108A, MA24118A, and MA24126A. In Scope
mode, the sensor acts similarly to an oscilloscope in that it can be used to measure power as a function of time.
There are two parameters needed to define the scope mode operation: the capture time and the number of data
points. Operation in scope mode proceeds as follows: sensor first waits for a trigger. Upon receiving a trigger,
the sensor starts collecting data at its sample rate for the duration of the capture time. This will typically
result in a number of samples that exceed the number of displayed data points. In this case, individual samples
are averaged together to display the requested number of data points. The descriptions of the Scope mode
settings are given below:
1
Index
1
Must be clicked to
Apply above settings
Description
Button must be clicked to apply above settings
Figure 3-10. Time Slot Mode Settings
Capture Time
The Capture Time represents the time displayed on the screen at any one time. If a positive delay is specified
for the trigger delay item, the capture time will commence once the specified delay has been reached.
PowerXpert UG
PN: 10585-00020 Rev. C
3-13
3-6
Using PowerXpert™
Scope Mode
Data Points
Scope mode can be used to look at very fine structures of a signal. When using marker, gate, and fence, the
power of any specific time can be accurately measured. To better observe these fine signal structures, a graph
capture time can be reduced to get better resolution. However, as capture time shrinks, the time intervals
between data points on the graph also decrease. The capture time can continue to shrink until it approaches
the absolute resolution limit.
The sampling rate of the sensors is approximately 142 kHz, or 7 µs per sample. When the capture time divided
by the number of points is at 7 µs, the resolution has reached its maximum. Any more reduction in capture
time must be accompanied by a reduction in the number of data points such that:
(capture time)/(data point) > 7 µs
For example, in case of a MA24118A with 20 ms of capture time, there are 2860 samples. If there were 10 data
points, then each data point consists of an average of 286 samples. The number of data points should not be
less than the total number of samples. For a given capture time, the lower the number of data points the more
samples that are averaged per point, thus the lower the trace noise.
When there is a large number of points in a graph, the points are plotted at the beginning of the given time
interval. For example, if a graph has a capture time of 100 ms and data points of 1000, then the first time
interval is from time 0 µs to 100 µs (100 ms/1000). The power measured during this time interval is plotted as
a point at time 0 µs. Subsequent intervals are plotted the same way until time interval 1000, where data is
plotted as a point at time 99.9 ms. When there are many data points in a graph, not having a point at exactly
100 ms is not noticeable. However, when there are fewer points, then the graph seems incomplete (missing the
last data point). One may perceive this as a time inaccuracy if not aware of how the graph is plotted.
When the number of points reaches 100, PowerXpert implements a different type of graphing that is more
technically correct. Instead of plotting each time interval as a point, time intervals are plotted as a horizontal
line between the start and the end of the time interval. For example, if a graph has a capture time of 1 ms and
data points of 100, then the first time interval will be from 0 µs to 10 µs (1 ms/100). The power measured
during this time interval is a horizontal line representing the measured power plotted between time 0 µs to
1 µs. Subsequent time intervals are plotted the same way until time interval 100, where a horizontal line is
plotted between time 990 µs and 1 ms. The resulting power graph will look different as seen in Figure 3-11
on page 3-15:
3-14
PN: 10585-00020 Rev. C
PowerXpert UG
Using PowerXpert™
3-6
1
Scope Mode
2
Data Points > 100
Data Points ≤ 100
3
Time
Interval
#2
Time
Interval
#3
Time
Interval
#1
Time
Interval
#2
Time
Interval
#3
Power (dBm)
Time
Interval
#1
4
Time (ms)
5
Power data point
plotted at the left end
of the time interval
Index
1
2
3
4
5
6
7
8
9
6
Time (ms)
Note missing trace
7
at last time interval
8 Power data plotted as
horizontal line across
full time interval
9 Note step
responses
Description
Data Points > 100
Data Points 100
Time Intervals (#1, #2, #3)
Power (dBm)
Power data point plotted at the left end of the time interval
Time (ms)
Note missing trace at last time interval
Power data plotted as horizontal line across full time interval
Note step responses
Figure 3-11. Time Slot Mode Settings
1
2
Data Points > 100
3
Index
1
2
3
Description
Data Points >100
Data Points 100
Note the missing trace at the last time interval in the plot on the left.
Figure 3-12. Data Points Plot Differences
PowerXpert UG
PN: 10585-00020 Rev. C
3-15
3-6
Using PowerXpert™
Scope Mode
Gate and Fence
The Gate and Fence feature enables measurement of the desired portion of the waveform. A Gate is a
specification for extracting an averaged power reading measurement between two defined points on a pulsed
waveform. A fence must be set up within the boundaries of a gate, unless the fence is disabled by setting the
Fence start and end to zero, or to the same value. All data sampled between the fence start and end positions
are excluded from the average power calculations for the gate. This is useful for purposes such as excluding a
training sequence from an EDGE measurement.
1
3
Index
Description
1
2
3
4
Fence Start
Fence End
Gate Start
Gate End
Fence
Start
Gate
Start
Fence
End
2
Gate
End
4
Figure 3-13. Time Slot Mode Settings
Checking the Enable gate and fence box enables the feature in PowerXpert. All of the gate and fence settings
are relative to the triggering event (start of capture). The fence must reside entirely within the gate, unless the
fence is disabled by setting the Fence start and Fence end to zero. The gate and fence start and end points can
be dragged by the mouse or directly entered (the Apply above settings button must be clicked to enable the
changes to the gate and fence parameters made to the start and end points, even when dragging them with the
mouse).
Certain restrictions and conditions apply when setting up gating and fence settings as listed below:
• Gate start cannot be negative and it cannot exceed the capture time.
• Gate end value cannot be less than gate start and cannot exceed the capture time.
• Fence start should be between Gate start and Gate end.
• Fence end should be between Fence start and Gate end.
• If the Fence start and Fence end values are the same, then the fence is disabled.
• Fence is disabled if both fence start and fence end are set to zero.
• The Fence start and Fence end positions cannot be set outside of the area defined by the Gate start and
Gate end positions.
• The Gate start and Gate end points are included in the measurement.
• The Fence start and Fence end points are excluded from the measurement and have priority over the
Gate start and Gate end points if they coincide.
3-16
PN: 10585-00020 Rev. C
PowerXpert UG
Using PowerXpert™
3-7
General Settings
Apply Above Settings Button
The Apply above settings button applies all changes made to the “Scope Mode” settings. Changes to these
settings do not take affect until clicking this button.
3-7
General Settings
The PowerXpert general settings are common to all three modes and power sensors.
1
Must be clicked to
Apply above settings
Index
1
Description
Button must be clicked to apply above settings
Figure 3-14. Time Slot Mode Settings
Zero Sensor
Zero the sensor before making power measurements. If frequent low-level measurements are being made, it is
advised to check the sensor zeroing often and repeat as necessary. Before zeroing the sensor, connect it to the
DUT (device under test) test port and remove RF power from the connection to a level 20 dB below the noise
floor of the power sensor. For the MA24104A and MA24105A power sensors, this level is less than –20 dBm.
For the MA24106A power sensor, this level is less than –60 dBm. For the MA24108A, MA24118A, and
MA24126A, this level is less than –70 dBm. It is preferable to leave the sensor connected to the DUT test port
so that ground noise and thermal EMF (electro-magnetic fields) are zeroed out of the measurement. The sensor
may also be connected to a grounded connector on the DUT or disconnected from any signal source.
Frequency
Entering the frequency of measurement applies frequency correction to the measured power. The power sensor
has an internal EEPROM containing frequency calibration factors that were programmed into the sensor at
the factory. The power sensor has an internal temperature sensor that reports its readings periodically to the
microprocessor. The sensor makes all of the required calculations on the measurement once entering the
measurement frequency.
PowerXpert UG
PN: 10585-00020 Rev. C
3-17
3-7
Using PowerXpert™
General Settings
Auto Average
Auto average is only available with the MA24108A, MA24118A, and MA24126A power sensors. Auto average
sets the auto averaging status and count. When an auto averaging resolution is selected, the sensor chooses an
averaging number that is a compromise between stabilizing the power reading and providing reasonable
settling time. It does this by choosing an averaging number based on the power level currently being measured.
For most power levels, selecting auto averaging results in the power reading fluctuating by no more than twice
the selected auto average resolution setting. However, near the low end of the measurement range, the power
reading may fluctuate by more than this as the averaging number has been limited to maintain reasonable
settling response time. Auto averaging only stabilizes the readings due to noise contributed by the power
sensor electronics. Power variations that are the result of measuring modulated signals are not taken into
account by the sensor in auto averaging. Setting Auto average to Off enables manual averaging.
Note
Auto averaging source is only available with the MA24108A, MA24118A, and MA24126A power
sensors.
Auto Averaging Source
Auto averaging source is only available with the MA24108A, MA24118A, and MA24126A power sensors. Auto
averaging source sets which display point or slot number to use for auto averaging. The auto averaging
algorithm can only use one averaging number at a time and this point or slot number must be specified when
“Auto Average” is enabled. Auto averaging source is only available in “Scope Mode” (to specify which point to
use) and in “Time Slot Mode” (to specify which slot number to use).
Averaging Method
Averaging method is only available with the MA24108A, MA24118A, and MA24126A power sensors.
Moving: Averaging is continuously performed over the number of specified measurements. When the specified
number is reached the average is calculated and as the next measurement is finished the average is
recalculated from the new start and end positions. Refer to the figure below that shows moving averaging
performed over eight measurements.
Figure 3-15. Moving Averaging
Repeat: Averaging is performed over the number of measurements specified. The displayed power is not
updated until the next entire batch of measurements is complete. Refer to the figure below that shows repeat
averaging performed over 8 measurements.
Figure 3-16. Repeat Averaging
3-18
PN: 10585-00020 Rev. C
PowerXpert UG
Using PowerXpert™
3-7
General Settings
Averages
The Averages setting allows you to specify the number of measurements that are averaged to calculate the
displayed power. A setting of 1 disables averaging. This setting is only available when “Auto Average” is Off.
Offset
A fixed value (in dB) specified by the user is applied as a power offset to the sensor. A positive offset adds a
value to the power readings and can be used to compensate for attenuators, couplers, limiters, and other lossy
devices. A negative value subtracts a value from the power reading and can be used to compensate for
amplification in the measurement path.
Range
Range allows the operating power range of the sensor to be set to the desired range. Setting to “Auto” means
that sensor firmware determines the appropriate range for it to operate. Setting to Range 1 covers the power
range from +20 dBm to –7 dBm. Setting to Range 2 covers the power range from –7 dBm to –40 dBm.
For model MA24105A, setting to Range 1 covers the power range from +3 dBm to +38 dBm. Setting to Range 2
covers the power range from +38 dBm to +51.76 dBm (150 W).
In some instances, setting the range manually improves the measurement. For example, a low duty cycle, high
crest factor signal, where average power may fall in one range and the peak power in another, may result in
erroneous readings when the sensor is set to auto range. In this case, setting the range manually closer to the
anticipated average power will increase the accuracy.
Apply Above Settings Button
The Apply above settings button applies all changes made to the “Continuous Mode” settings. Changes to
these settings do not take affect until clicking this button.
PowerXpert UG
PN: 10585-00020 Rev. C
3-19
3-8
3-8
Using PowerXpert™
Trigger Settings
Trigger Settings
Trigger settings are only available in Time Slot Mode and Scope Mode with power sensor models MA24108A,
MA24118A, and MA24126A. Trigger is an event that initiates a measurement run. When the sensor is armed,
it starts looking for the trigger. Once the trigger occurs, the sensor starts collecting data and measurement
commences. Before arming the sensor, the sensor must be set up with the following trigger related parameters:
Figure 3-17. Trigger Settings
Trigger Source
• Continuous Trigger: The sensor continuously collects data when the trigger source is set to continuous
and does not look for any trigger event. Continuous trigger does not depend on any other trigger related
parameters and these settings are unavailable for a Continuous trigger source.
• Internal Trigger: If internal trigger source is selected, the sensor triggers based on the signal level,
edge/slope and noise immunity factor.
• External Trigger: When the sensor is setup with external trigger, it is triggered by the TTL/CMOS
signal on the external trigger pin. In this trigger source, sensor can be set up to trigger at a particular
edge of the TTL/CMOS signal. External trigger does not depend on any other trigger related parameter.
Trigger Arm Type
The trigger parameters are effective only if the sensor is armed. “Armed” is the state when the sensor is
looking for a trigger. By default, the sensor is in Standby mode, it has to be armed before it starts looking for
trigger. Trigger arming is effective only when the trigger source is set to internal or external. It does not play
any role when the trigger source is continuous. An armed sensor returns the power automatically after a
trigger has occurred and data has been collected and processed. The trigger can be armed in following ways:
• StandBy: This is the default arming state of the sensor. If the trigger source is internal or external, and
the arm type is stand by, then the sensor will not make measurements or update the trace data. This is
similar to the “stop” acquisition function of a digital oscilloscope. However, if the trigger source is
continuous, then the sensor continuously collects and updates trace data.
• Auto Arm: In this state, the sensor rearms automatically after a trigger event has occurred and power is
displayed. It is generally used to evaluate periodic waveforms. In other words, the sensor rearms after
every measurement run. The power is displayed/updated automatically after every trigger event.
• Single Arm: The trigger is first armed and, once the trigger event occurs, the data is collected and the
display updated, then the trigger is unarmed. Thus, only one measurement run and display update is
performed. This mode is generally used to evaluate non-periodic waveforms. If averaging is selected, the
results will not usually be very meaningful because all of the measurement runs commence with only the
one trigger event and occur successively. The individual measurement runs are not synchronized to the
input signal; therefore, averaging should not normally be used with the single arming type.
• Multiarm: Multiarming is used when averaging is needed, but continuous display updates are not
needed. In this mode the trigger is armed, then once the trigger event occurs, the measurement data is
taken and the display is updated (for the moving average method). Then the trigger is rearmed. This
cycle repeats N times where N is the current averaging number. If the averaging method is Moving, then
the display is updated after each trigger and measurement run. If the averaging method is Repeat, then
the display is updated only after N triggers and measurement runs. Once N runs are complete, the
trigger is unarmed.
3-20
PN: 10585-00020 Rev. C
PowerXpert UG
Using PowerXpert™
3-8
Trigger Settings
Trigger Level
Sets the power level threshold of the waveform under test that, when crossed, triggers a measurement. It is
used during internal triggering only.
Trigger Edge
It sets the trigger edge for internal and external trigger. Trigger edge can be set to positive or negative. For
internal trigger, the sensor triggers only when the signal crosses the trigger level from high to low when set to
negative edge; the sensor triggers only when the signal crosses the trigger level from low to high when set to
positive. For external trigger, the sensor triggers when the TTL signal on the external trigger pin falls from
high to low when set to negative; the sensor triggers when the TTL signal on the external trigger pin rises from
low to high when set to positive.
Trigger Delay
A trigger delay allows a time lag (positive or negative) between the trigger event and the data displayed on the
screen.
Specifying a positive delay has the affect of displaying data occurring some time after the trigger event. When
the delay is positive, the sensor waits for the set delay time after a trigger before it starts taking readings. The
sensor is unresponsive during the wait period and cannot be aborted. For example, for a capture time of 20 ms
and a delay of 1 ms, the length of the capture would be from 1 ms to 21 ms given that the trigger occurs at time,
t = 0. The capture time is unaffected by a positive trigger delay.
1
2
3
Index
Description
1
Capture Time (ms)
2
Trigger Level (dBm) and Positive Edge Trigger
3
Negative Trigger Delay Time (ms)
Figure 3-18. Trigger Parameters
PowerXpert UG
PN: 10585-00020 Rev. C
3-21
3-8
Using PowerXpert™
Trigger Settings
Specifying a negative delay allows the user to display data occurring immediately before the trigger event. The
negative delay cannot be greater than or equal to the capture time. If the capture time conflicts with the
trigger delay, an error is generated.
1
2
3
Index
Description
1
Capture Time (ms)
2
Trigger Level (dBm) and Positive Edge Trigger
3
Positive Trigger Delay Time (ms)
Figure 3-19. Trigger Parameters
Noise Immunity
This feature is available during internal triggering. For very noisy signals, the sensor can trigger at an
undesired point or edge. To provide immunity against such situations, the sensor can be set to wait for N
number of samples to cross the trigger level before it triggers. Higher values of N result in increased noise
immunity, but also increase the trigger latency. It is advised to use a negative trigger delay when using noise
immunity. The negative delay required to reduce the trigger latency is the product of N and the sample
duration of the power sensor (see sensor specifications), which is approximately 7 µs for the MA24108A and
MA24118A. The default value for the trigger noise immunity factor is 1 (no immunity).
Arm Trigger Button
The Arm trigger button becomes available in “Time Slot Mode” or “Scope Mode” when the “Trigger Settings”
have been changed. It may also become available in other conditions such as trigger timeout. Clicking the
button applies the trigger settings and arms the trigger. PowerXpert may not be actively taking data and
updating the graph when the Arm trigger button is available and has not been clicked.
3-22
PN: 10585-00020 Rev. C
PowerXpert UG
Using PowerXpert™
3-9
3-9
Tools
Tools
The Tools menu provides the option of zeroing all sensors, capturing the PowerXpert screen display, enabling
the log data and offset table features, and updating the sensor firmware.
Figure 3-20. Tools Menu
Zero All Sensors
Zero All Sensors provides a convenient method of zeroing all connected sensors. Zero all sensors before making
power measurements. If frequent low-level measurements are being made, it is advised to check the sensor
zeroing often and repeat as necessary. Before zeroing the sensor, connect it to the DUT (device under test) test
port and remove RF power from the connection to a level 20 dB below the noise floor of the power sensor. For
the MA24104A and MA24105A power sensors, this level is less than –20 dBm. For the MA24106A power
sensor, this level is less than –60 dBm. For the MA24108A, MA24118A, and MA24126A, this level is less than
–70 dBm. It is preferable to leave the sensor connected to the DUT test port so that ground noise and thermal
EMF (electro-magnetic fields) are zeroed out of the measurement. The sensor may also be connected to a
grounded connector on the DUT or disconnected from any signal source.
Capture Screen
The Capture Screen utility captures a PowerXpert screenshot and launches the Save image dialog that allows
you to save the image in BMP, JPEG, PNG, or GIF file formats.
Figure 3-21. Save Image Dialog
PowerXpert UG
PN: 10585-00020 Rev. C
3-23
3-9
Using PowerXpert™
Tools
Log Data
The Log Data feature provides the ability to record data in a comma separated value file and is accessed from
the Tools | Log Data toolbar. This feature is available only when the application is in Continuous Average
mode. Data logging is set up in the dialog below:
Figure 3-22. Log Data Dialog
• Interval Setup: Sets full speed data or fixed interval data logging (user defined logging interval).
• Log Interval (sec.): Sets the time interval in which to log data and is available when Full Speed is
deselected.
Note
Log Interval should be set to reduce the number of data points when capturing long time periods as
Microsoft Excel has a limitation of 65536 data records. The file size should be limited to 10 MB.
Data is stored as comma separated value (.csv) files that can be directly opened in Microsoft Excel. The
filename and location can be selected or changed as desired. The default filenames have the following format:
Test_yyyy_mm_dd_hhmmss.csv
where:
• yyyy: Four-digit year
• mm: One- or two-digit month
• dd: One- or two-digit day
• hhmmss: Two digit hours (24-hour clock), minutes, and seconds
The Save As dialog is shown when the Start button is pressed.
Figure 3-23. Log Data Save As Dialog
3-24
PN: 10585-00020 Rev. C
PowerXpert UG
Using PowerXpert™
3-9
Tools
Sample log data is shown in a Microsoft Excel spreadsheet file below:
Figure 3-24. Log Data
Data logging is stopped by accessing the Tools | Log Data toolbar and pressing Stop in the Log data dialog.
Multiple Sensor Display
PowerXpert offers a Multiple Sensor Display screen that can show simultaneous measurements of up to eight
sensors. This display is in addition to the normal PowerXpert display and is enabled by clicking Tools | Show
Multiple Sensor Display.
Figure 3-25. PowerXpert Multiple Sensor Display
PowerXpert UG
PN: 10585-00020 Rev. C
3-25
3-9
Using PowerXpert™
Tools
When using multiple sensors, the sensor parameters are applied to the selected sensor in the Sensor
Information area.
Figure 3-26. Selecting Sensor
View Summary
For the MA24105A, PowerXpert offers a View Summary Display screen (Figure 3-27) that can show
simultaneous forward and reverse measurements including:
• Forward Average Power
• Forward Crest Factor
• Forward Burst Average
• Forward Peak Power
• Reverse Average Power
• Reverse Refection Coefficient
• Reverse Return Loss
• Reverse VSWR.
This display, in addition to the normal PowerXpert display, is enabled by clicking Tools | View Summary.
Figure 3-27. View Summary Screen
3-26
PN: 10585-00020 Rev. C
PowerXpert UG
Using PowerXpert™
3-9
Tools
Offset Table
Offset Table feature is only available with the MA24104A and MA24106A power sensors. Offset table provides
the ability to apply corrections to measurements when RF devices are used between the sensor and DUT.
Offset Table is different from Fixed Offset as it provides the ability to enter different offset values at different
frequencies for an RF device. The frequency response of that device needs to be known before it can be entered.
Offset Table employs linear interpolation to determine offset values for intermediate frequencies. In cases
where the cal factor frequency is higher than the highest frequency in the offset table, then the offset for the
highest frequency in the table is used. Similarly, when the cal factor frequency is lower than the lowest
frequency in the offset table, then the offset for the lowest frequency in the offset table is used. The procedure
for setting, saving, recalling, and applying the offset table is as follows:
1. Click Tools | Offset Table | Setup.
Figure 3-28. Offset Table
2. In the resulting dialog enter the frequency response of the RF device manually or by importing an S2P
file used to measure the DUT.
Note
Positive values in dB are used for attenuation.
3. Click Apply in the Offset Entry screen to correct the measurement. “Offset table applied” appears briefly
in the display window indicating that an offset table correction is applied to the current measurement.
Also, a check mark is applied in front of the Enable Offset Table selection in the Tools | Offset Table
menu.
4. To clear all of the entries in the table, click the Clear Table button.
5. Save the response of the device by clicking Save from the Offset Entry Screen and save as a file in the
directory of your choice (see Figure 3-16). Any number of device responses can be stored. The files are
stored as comma separated value files (.csv).
6. To recall a response, click File | Open in the Offset Table dialog, select the file, and then click Apply.
Similarly, S2P files can be imported by selecting File | Import S2P file in the Offset Table dialog.
7. To remove the offset table correction, click Tools | Offset Table | Enable Offset Table. to remove the
check mark. “Offset table disabled” appears briefly in the display window indicating that an offset table
correction is no longer applied to the current measurement.
Updating the Firmware
Refer to ‘Upgrading the Firmware” in Appendix B.
PowerXpert UG
PN: 10585-00020 Rev. C
3-27
3-10
Using PowerXpert™
Settings
3-10
Settings
The Settings menu is only available with the MA24108A, MA24118A, and MA24126A power sensors. The
Settings menu provides for saving and recalling PowerXpert setups, resetting PowerXpert, setting the sensor
time out, and enabling secure mode.
Figure 3-29. Settings Menu
Saving and Recalling Settings
The current settings can be saved to any one of ten non-volatile storage locations. If the storage location was
already in use, the previously stored settings are automatically overwritten.
Figure 3-30. Save/Recall Setup Dialog
Any of the sensor settings that were saved in the manner described above can be recalled for use at any time.
Note
Trigger Arm Type, Units, and a fixed Offset value are not stored as part of the saved setup and will
not be recalled.
Resetting to Factory Settings
This selection resets PowerXpert and the power sensor to their default state.
Sensor Time Out Setting
Sensor Time Out is a PowerXpert feature. It is active during internal or external triggering only (Time Slot
and Scope modes). It is provided for situations where a trigger event may not occur for a long period of time
(greater than a default of 10 seconds).
Figure 3-31. Sensor TimeOut Dialog
3-28
PN: 10585-00020 Rev. C
PowerXpert UG
Using PowerXpert™
3-10
Settings
During triggering (internal or external), the sensor sends the data to the application after it receives a trigger.
If the PowerXpert application does not receive any data from the sensor for the set timeout period, then the
user is informed and is prompted to re-arm the sensor.
Figure 3-32. Trigger Timed Out Dialog
If there is no response from the sensor after re-arming of the trigger, the PowerXpert application will display
the “No sensor” message.
Figure 3-33. No Sensor Connected
If the sensor acknowledges the trigger arming, then the application understands that there was no trigger and
will again wait for the data. If the data still does not come, the cycle repeats.
If the trigger event does not occur for a long time, then the length of the sensor’s timeout needs to be increased
or the trigger needs to be re-armed manually.
There are two possible reasons for not receiving data:
• There may not have been a trigger event.
• There may be a problem with the sensor (communication or otherwise). In this case:
1. Close the application and disconnect sensor.
2. Open application and reconnect the sensor.
3. If the problem persists, contact an Anritsu service center.
PowerXpert UG
PN: 10585-00020 Rev. C
3-29
3-10
Using PowerXpert™
Settings
Secure Mode
The MA24104A and MA24106A USB power sensors have two different types of memory devices:
• Non-Volatile 32 KB FLASH memory within the PIC18F4550 micro-controller. This contains firmware
for the sensor. This memory is not accessible by the user.
• Non-Volatile 8 KB EEPROM. This contains sensor factory calibration data and sensor information like
Serial no, Model no etc. This memory is not accessible by the user.
The MA24104A and MA24106A are inherently secure devices and can be moved in and out of the secure
facilities as there are no user accessible locations in these sensors.
The MA24105A, MA24108A, MA24118A, and MA24126A USB power sensors have three different types of
memory devices:
• Non-Volatile 512 KB FLASH memory within the AT91SAM7SE512 micro-controller. This contains
firmware for the sensor. User cannot write to or access this memory.
• Volatile 32MB SDRAM. This contains program variables, buffers and calibration data information while
sensor is in operation. This is initialized on power up and wiped clean when powered down. The user
cannot write to this memory directly, and it is completely cleared during power down. This memory is
not accessible by the user.
• Non-Volatile 4MB Data FLASH. Contains sensor factory calibration data, user setups (user setups are
not used on MA24105A) and sensor information like Serial no, Model no etc. The user cannot write to
this memory directly.
In the MA24108A, MA24118A, and MA24126A, the user can store and retrieve instrument set ups in
this memory. It can be completely cleared using the secure mode procedure. (The MA24105A does not
use this feature because it is an inherently secure device.)
Clearing the Non-Volatile Data Flash
Information such as a user-defined setup saved in the sensor needs to be removed from the USB power
sensors if it is moved out of a secure facility. This can be accomplished by using the secure mode to
completely wipe the non-volatile, 4 MB DATA FLASH of all user-saved information. The user sets the
secure mode via PowerXpert. When PowerXpert is next started, the non-volatile flash is completely
purged of all user-saved information. The power sensor then sets the factory defaults for the current
settings.
Click Settings | Secure Mode. A warning dialog box appears.
Figure 3-34. Secure Mode Warning
Click OK. Shut down and then restart PowerXpert. The power sensor now powers up with the
non-volatile memory completely purged. The secure state can also be set over the USB using the
“DELETE” remote command.
3-30
PN: 10585-00020 Rev. C
PowerXpert UG
Using PowerXpert™
3-11
3-11
Help
Help
The Help menu provides options to launch the online documentation and provides an informational About
dialog.
Figure 3-35. About PowerXpert
PowerXpert UG
PN: 10585-00020 Rev. C
3-31
3-11
3-32
Using PowerXpert™
Help
PN: 10585-00020 Rev. C
PowerXpert UG
Chapter 4 — Power Sensor Care
4-1
Introduction
Anritsu Power Sensors are high quality precision laboratory instruments and should receive the same care and
respect afforded such instruments. Follow the precautions listed below when handling or connecting these
devices. Complying with these precautions will guarantee longer component life and less equipment downtime
due to connector or device failure. This will ensure that power sensor failures are not due to misuse or abuse –
two failure modes not covered under the Anritsu warranty.
Warning
Beware of destructive pin depth of mating connectors.
Based on RF components returned for repair, destructive pin depth of mating connectors is the major cause of
failure in the field. When an RF component connector is mated with a connector having a destructive pin
depth, damage will usually occur to the RF component connector. A destructive pin depth is one that is too long
in respect to the reference plane of the connector (see Figure 4-1 on page 4-5).
Warning
Beware of RF components that may not have precision type connectors.
The center pin of a precision RF component connector has a precision tolerance measured in mils (1/1000 inch).
The mating connectors of various RF components may not be precision types. Consequently, the center pins of
these devices may not have the proper pin depth. The pin depth of DUT connectors should be measured to
assure compatibility before attempting to mate them with Power Sensor connectors. An Anritsu Pin Depth
Gauge (Figure 4-2 on page 4-6), or equivalent, can be used for this purpose.
4-2
Power Sensor Precautions
Avoid Over Torquing Connectors
Over torquing connectors is destructive; it may damage the connector center pin. A torque wrench
(12 lbf·in or 1.35 N· m) is recommended for tightening N connectors. Always use a torque wrench
(8 lbf·in or 0.90 N· m) for K type connectors. Never use pliers to tighten connectors. Refer to
Section 4-4 “Connection Techniques” on page 4-3 for detailed instructions.
Avoid Mechanical Shock
Power Sensors are designed to withstand years of normal bench handling. However, do not drop or
otherwise treat them roughly. Mechanical shock will significantly reduce their service life.
Avoid Applying Excessive Power
Exceeding the specified maximum input power level will permanently damage power sensor internal
components and render it useless.
Observe Proper ESD Precautions
Power sensors contain components that can be destroyed by electrostatic discharge (ESD). Therefore,
power sensors should be treated as ESD-sensitive devices. To prevent ESD damage, do not handle,
transport or store a power sensor except in a static safe environment. A static control wrist strap MUST
be worn when handling power sensors. Do not use torn or punctured static-shielding bags for storage of
sensors. Do not place any paper documents such as instructions, customer orders or repair tags inside
the protective packaging with the sensors.
PowerXpert UG
PN: 10585-00020 Rev. C
4-1
4-3
RF Connector Precautions
Power Sensor Care
Clean the Connectors
The precise geometry that makes the RF component’s high performance possible can easily be disturbed
by dirt and other contamination adhering to the connector interfaces. When not in use, keep the
connectors covered. Connectors must be cleaned using a lint-free cotton swab that has been dampened
with isopropyl alcohol (IPA). Refer to Section 4-6 “Connector Cleaning” on page 4-7 for specific details.
Avoid Damage to Communication Connector and Cable
Use care when connecting the USB cable to the sensor. Ensure it is properly secured to avoid damage
from connector movement while in its receptacle.
4-3
RF Connector Precautions
Handle With Care
RF connectors are designed to withstand years of normal bench handling. However, do not drop or
otherwise treat them roughly. They are laboratory-quality devices, and like other such devices, they
require careful handling.
Keep Connectors Clean
Avoid touching connector mating planes with bare hands. Natural skin oils and microscopic dirt
particles are very hard to remove.
When using cotton swabs to clean connectors, make sure that you don’t damage the center conductor.
Refer to Section 4-6.
Check the Pin Depth
Always check the pin depth of a new connector before use to determine if it is out of spec. One bad
connector can damage many. The connector can be damaged by turning in the wrong direction. Turning
right tightens and turning left loosens.
Teflon Tuning Washers
The center conductor on most RF components contains a small teflon tuning washer located near the
point of mating (interface). This washer compensates for minor impedance discontinuities at the
interface. The washer’s location is critical to the RF component’s performance. Do not disturb it.
Align Before Connecting
To avoid center conductor damage, ensure the connectors you are joining are properly aligned.
Torque Properly
Over torquing connectors is destructive; it may damage the connector center pin. Never use pliers to
tighten connectors. For other connectors, use the correct torque wrench.
Cover the Connectors
Put ESD-safe dust caps on the connector after use.
Store Properly
Never store adapters loose in a box, in a desk, or in a drawer.
4-2
PN: 10585-00020 Rev. C
PowerXpert UG
Power Sensor Care
4-4
4-4
Connection Techniques
Connection Techniques
Connection Procedure
Table 4-1 lists the Anritsu Company torque wrench and open end wrench part numbers for connectors used on
USB power sensors.
Table 4-1.
Connector Wrench Requirements – Torque Wrenches and Settings – Open End Wrenches
Torque Wrench Model
Number
Torque
Specification
Open End Wrench
K (2.92 mm)
01-201
8 lbf·in (0.90 N·m)
01-204
N
01-200
12 lbf·in (1.35 N·m)
01-202
Connector Type
Connecting
1. Carefully align the connectors.
The male connector center pin must slip concentrically into the contact fingers of the female
connector.
2. Push connectors straight together.
Do not twist while pushing them together. As the center conductors mate, there is usually a slight
resistance.
3. Finger tighten the connection by turning the connector nut.
Do not turn the connector body.
Do not pre-tighten so much that there is no rotation of the nut when using the torque wrench.
4. Back off the connection by turning the connector nut counter clockwise 1/4 turn.
The final tightening will be done using the torque wrench.
Torquing
1. Hold torque wrench at the end.
Caution
Holding the torque wrench elsewhere applies an unknown amount of torque and could damage
contacts and/or connectors.
2. Rotate only the connector nut as you tighten the connector.
Use an open-end wrench to keep the body of the connector from turning.
3. Keep the two wrenches at a relative angle of less than 90°.
Using an angle greater than 90° causes the connector devices to lift up and tends to misalign the
devices and stress the connectors. This becomes more of a problem when there are several devices
connected to each other.
4. Tighten the connection until the torque wrench handle just breaks.
Breaking the handle fully can cause the wrench to kick back and may loosen the connection.
Disconnection Procedure
1. Use an open end wrench to prevent the connector body from turning.
2. Use another wrench to loosen the connector nut.
3. Complete the disconnection by hand, turning only the connector nut.
4. Pull the connectors straight apart without twisting or bending.
PowerXpert UG
PN: 10585-00020 Rev. C
4-3
4-5
4-5
RF Connector Preventive Care
Power Sensor Care
RF Connector Preventive Care
Most coax connectors are assembled into a system and forgotten, but some, especially on test equipment are
used almost continuously. The care and cleaning of these connectors is critical to accurate and reliable
performance. Remember that all connectors have a limited life time and usually a maximum
connect/disconnect specification, typically about 5,000 connections. Most will last well beyond this number, but
poor usage and poor care can destroy a connector well before that number. Good connector performance can be
achieved with the following:
• Periodic visual inspection
• Appropriate gauging techniques
• Proper connection and disconnection techniques using torque wrench
• Proper cleaning
Visual Inspection
To ensure a long and reliable connector life, careful visual inspection should be performed on the connectors
before they are used on a particular job at a minimum of once per day when the item is being used. A “good”
connector may get damaged if it is mated with a “bad” one.
Magnification
The minimum magnification for connector inspection for damage varies with the connector:
• 7X for K (2.92 mm) connectors
• 2X for N connectors
Any connector with the following defects should be repaired or discarded:
Plating
• Deep scratches showing bare metal on the mating plane
• Bubbles and blisters
The connectors may lose some gloss over time due to usage. Light scratches, marks and other cosmetic
imperfections can be found on the mating plane surfaces. These should be of no cause for concern.
Threads
• Damaged threads. Don’t force the connectors to mate with each other if the threads are damaged.
Center conductors
• Bent, broken or damaged contacts.
Pin Depth Measurement
Precautions
Warning
Beware of destructive pin depth of mating connectors.
A connector should be checked before it is used a minimum of once per day. If the connector is to be used
on another item of equipment, the connector on the equipment to be tested should also be gauged.
Connectors should never be forced together when making a connection since forcing often indicates
incorrectness and incompatibility. There are some dimensions that are critical for the mechanical
integrity, non-destructive mating and electrical performance of the connector. Connector gauge kits are
available for many connector types. Please refer to Anritsu Application Note 10200-00040. The
mechanical gauging of coaxial connectors will detect and prevent the following problems:
4-4
PN: 10585-00020 Rev. C
PowerXpert UG
Power Sensor Care
4-5
RF Connector Preventive Care
Positive Pin Depth
Positive pin depth can result in buckling of the fingers of the female center conductor or damage to the
internal structure of a device due to the axial forces generated.
Caution
Never make a connection when any positive pin depth condition exists.
Negative Pin Depth
Negative pin depth can result in poor return loss, possibly unreliable connections, and could even cause
breakdown under peak power conditions.
Checking the Pin Depth Gauge
Pin depth gauges should be checked for cleanliness before they are used at a minimum of once per
month. Connector cleaning procedures (refer to Section 4-6) can also be used to clean the pin depth
gauges.
Pin Depth Dimensions
Before mating, measure the pin depth of the device that will mate with the RF component. The dimensions
measured are shown in Figure 4-1.
Reference
Plane
Pin Depth
(Inches)
3
Index
1
2
3
4
FEMALE
1
Reference
Plane
2
Pin Depth
(Inches)
4
MALE
Description
Reference Plane
Pin Depth (Inches)
Female
Male
Figure 4-1.
N Connector Pin Depth
PowerXpert UG
PN: 10585-00020 Rev. C
4-5
4-5
RF Connector Preventive Care
Power Sensor Care
Pin Depth Gauge
Use an Anritsu Pin Depth Gauge or equivalent as shown in Figure 4-2 on page 4-6 to accurately measure pin
depths. Based on RF components returned for repair, destructive pin depth of mating connectors is the major
cause of failure in the field.
When an RF component is mated with a connector having a destructive pin depth, damage will likely occur to
the RF component connector.
Note
A destructive pin depth has a center pin that is too long in respect to the connector’s reference plane.
2
3
1
0
1
2
2
2
1
1
2
3
3
4
5
4
1
Index Description
1
2
3
Pin Depth Gauge with needle setting at zero
Positive needle direction clockwise to right
Negative needle direction counter-clockwise to left
Figure 4-2.
Pin Depth Gauge
Pin Depth Tolerances
The center pin of RF component connectors has a precision tolerance measured in “mils” which is equal to
1/1000 inch (0.001”) or approximately 0.02540 mm.
Connectors on test devices that mate with RF components may not be precision types and may not have the
proper depth. They must be measured before mating to ensure suitability and to avoid connector damage.
When gauging pin depth, if the test device connector measures out of tolerance (see Table 4-2) in the “+” region
of the gauge (see Figure 4-2 on page 4-6), the center pin is too long. Mating under this condition will likely
damage the termination connector.
On the other hand, if the test device connector measures out of tolerance in the “–” region, the center pin is too
short. While this will not cause any damage, it will result in a poor connection and degradation in performance.
Table 4-2.
Pin Depth Tolerances and Gauge Settings for USB Power Sensor Connectors
Connector Type
Pin Depth (Inches)
Anritsu Gauge Setting
+0.003
N Male
N Female
–0.207
0.000
–0.207
0.000
–0.003
0.000
0.000
–0.207
–0.207
–0.003
–0.003
K Male
+0.000
K Female
–0.003
4-6
PN: 10585-00020 Rev. C
Same as pin depth
PowerXpert UG
Power Sensor Care
4-6
4-6
Connector Cleaning
Connector Cleaning
Connector interfaces should be kept clean and free of dirt and other debris. Clean connectors with lint-free
cotton swabs. Isopropyl alcohol is the recommended solvent. Figure 4-3 on page 4-8 illustrates the cleaning
procedures for male and female connectors.
Note
Most cotton swabs are too large to fit into the ends of the smaller connector types. In these cases it
is necessary to peel off most of the cotton and then twist the remaining cotton tight. Be sure that the
remaining cotton does not get stuck in the connector.
With continuous use, the outer conductor mating interface will build up a layer of dirt and metal chips that can
severely degrade connector electrical and mechanical performance. It can also increase the coupling torque
which can damage the mating interface. Cleaning connectors is essential for maintaining good electrical
performance so check them for cleanliness before making any measurements (or calibration).
Required Cleaning Items
• Low pressure compressed air (solvent free)
• Lint-free cotton swabs
• Isopropyl alcohol (IPA)
• Microscope
Important Cleaning Tips
Use the following important tips when cleaning connectors:
• Use only isopropyl alcohol as a solvent.
• Use only lint-free cotton swabs
• Use an appropriate size of cotton swab.
• Gently move the cotton swab around the center conductor.
• Never put lateral pressure on the connector center pin.
• Verify that no cotton strands or other foreign material remain in the connector after cleaning.
• Only dampen the cotton swab. Do NOT saturate it.
• Compressed air may be used to remove foreign particles and to dry the connector.
• Inspect after cleaning to verify that the center pin has not been bent or damaged.
Cleaning Procedure
1. Remove loose particles on the mating surfaces, threads, and similar surfaces using low-pressure
compressed air.
2. The threads of the connector should be cleaned with a lint-free cotton swab. When connector threads are
clean, the connections can be hand-tightened to within approximately one-half turn of the proper torque.
3. Clean mating plane surfaces using alcohol on lint-free cotton swabs (Figure 4-3 on page 4-8).
• Make sure that the cotton swab is not too large.
• Use only enough solvent to clean the surface.
• Use the least possible pressure to avoid damaging connector surfaces.
• Do not spray solvents directly on to connector surfaces
4. After cleaning with swabs, again use low-pressure compressed air to remove any remaining small
particles and to dry the connector surfaces.
5. Inspect the connectors for cotton strands or other debris after cleaning.
PowerXpert UG
PN: 10585-00020 Rev. C
4-7
4-6
Connector Cleaning
Power Sensor Care
3
ISOPROPYL
ALCOHOL
2
WATER
INDUSTRIAL
SOLVENTS
1
4 Do NOT use Industrial Solvents or Water on connector. Use only Isopropyl Alcohol.
Dampen only, DO NOT saturate.
FEMALE
MALE
5
Use only isopropyl alcohol and the proper size of cotton swab. Gently rotate the
swab around the center pin being careful not to stress or bend the pin or you will
damage the
connector.
6
Do NOT put cotton swabs in at an angle, or you will damage the connectors.
7 Do NOT use too large of cotton swab, or you will damage the connectors.
Index
1
2
3
4
5
6
7
No industrial solvents
No Water
Use Isopropyl Alcohol
Do NOT use Industrial Solvents or Water on connector. Use only Isopropyl Alcohol. Dampen only,
Do NOT saturate.
Use only isopropyl alcohol and the proper size of cotton swab. Gently rotate the swab around the center
pin being careful not to stress or bend the pin or you will damage the connector.
Do NOT put cotton swabs in at an angle, or you will damage the connectors.
Do NOT use too large of cotton swab, or you will damage the connectors.
Figure 4-3.
4-8
Connector Cleaning
PN: 10585-00020 Rev. C
PowerXpert UG
Chapter 5 — Using the MA24104A
5-1
Sensor Overview
The power sensor’s connectors are illustrated in the figure below:
2
3
4
5
1
7
6
8
Index
Description
1
RF Input: N Type Connector (Torque connector at 12 lbf·in (1.35 N·m)
2
Power ON/OFF
3
USB Mini-B Port (for connection with a PC or Anritsu Handheld instrument)
2-color LED (reports functional status of the sensor)
Green: Sensor ON, Status OK
Amber: Error Condition (see Table 5-5 on page 5-10)
Blinking: Low Battery
4
5
RF Output: N Type Connector (Torque connector at 12 lbf·in (1.35 N·m)
6
RS-232 Port (for connection with Anritsu handheld instruments; requires batteries or external power)
7
DC Input (for RS232 use without batteries)
Battery Compartment (supports 3AA size batteries)
Note: When using battery power with the RS232 interface, the MA24104A enables an auto shutdown
(sleep) feature. If the RS232 bus is disconnected or becomes inactive, the power sensor shuts down
(sleeps) to preserve battery power. The sensor automatically powers up (wakes up) when the host is
reconnected or becomes active. Zeroing is then required before taking measurements.
8
Figure 5-1.
5-2
MA24104A Sensor Overview
Making Measurements
This section presents common procedures for using the MA24104A power sensor with a PC. These procedures
refer to the MA24104A sensor and Anritsu PowerXpert PC application buttons and menus that were
previously described. Before attempting these procedures, you should be familiar with the Anritsu PowerXpert
PC application. If an Anritsu Master™ series handheld instrument is being used with the power sensor, refer
to the user documentation that came with the handheld instrument for procedures on operating external
power sensors.
PowerXpert UG
PN: 10585-00020 Rev. C
5-1
5-2
Making Measurements
Using the MA24104A
Basic Power Measurement
Caution
The supplied USB cable with the screw-in connector should be securely fastened to the sensor to
avoid damage to the mini-USB connector.
1. Connect the sensor to a computer or Anritsu Master™ series instrument as shown in Figure 5-2
on page 5-3 and turn the power sensor ON by pressing the sensor’s power button for 1 second.
Note
Operation with the RS232 port requires an external power supply or batteries installed in the sensor.
A USB connection does not require an external power supply or batteries. When changing
connection methods (USB/RS232), the sensor must be powered off and back on, and re-zeroed. If
the sensor goes into sleep mode, the sensor must be re-zeroed before taking measurements.
2. Open the Anritsu Power Meter application.
3. Zero the sensor as described below in “Zeroing the Sensor”.
Warning
Do not connect or apply power outside of the MA24104A specifications or permanent damage may
result.
Before connecting the power sensor to another device, ensure the following:
Caution
Both connectors are in good condition and undamaged
Pin depth is verified
Both connectors are clean
Ensure the output of the device you are connecting to does not exceed the signal limits of the
sensor.
ESD precautions are observed.
Refer to Chapter 4, “Power Sensor Care” for complete details.
When connecting the power sensor, ensure the following:
The connectors are aligned before mating
Do not turn the connector body–only the connector coupling nut.
Torque the connection using the correct torque wrench and proper torquing technique.
Do not over torque.
Refer to Chapter 4, “Power Sensor Care” for complete details.
4. Connect the load to the RF OUT port of the sensor. Connecting the load first protects the power sensor as
well as the source/DUT from excessive mismatch.
5. Connect the RF source to the RF IN port of the power sensor.
6. Read the power measurement from the Anritsu Power Meter application window (power readings are
continuous with the default setting).
5-2
PN: 10585-00020 Rev. C
PowerXpert UG
Using the MA24104A
5-2
Making Measurements
4
7
3
3
5
2
1
6
Index
1
2
3
4
5
6
7
Figure 5-2.
Description
Source
RF In: N type Connector (Torque connector at 12 lbf·in (1.35 N·m)
RF Out: N type Connector (Torque connector at 12 lbf·in (1.35 N·m)
Load
USB to PC or BTS, VNA, or Spectrum Master
RS-232 to SiteMaster or Cell Master
PC with Anritsu PowerXpert Application
Measurement Setup
Connecting the Sensor
RF signal connections are made to the Type N female RF connectors, which have a 50 characteristic
impedance. The input port is labeled RF IN and the output port is labeled RF OUT.
Warning
Do not connect the sensor backwards (RF IN and RF OUT reversed) or apply power outside of the
MA24104A specifications or permanent damage may result.
When connecting to the Type N female connector of the MA24104A to a Type N connector, observe the
following proper practice for tightening the connection:
1. While holding the body of the N connector in one hand, turn the Type N Male connector nut to finger
tighten the connection. Do not turn the body of the MA24104A as this will cause excessive wear to the
connector.
PowerXpert UG
PN: 10585-00020 Rev. C
5-3
5-2
Making Measurements
Using the MA24104A
2. Back off the connection by turning the connector nut counter clockwise ¼ turn.
3. Tighten the connection (clockwise) using a 12 in-lb torque wrench (Anritsu part number: 01-200).
Note
The Sensor has a USB 2.0 interface with a USB Type Mini-B port. The MA24104A can be remotely
programmed over this USB interface. In addition to programming, the MA24104A is powered by the
USB. The interface is USB 2.0 compatible, but with an interface speed of 12 Mbps.
Zeroing the Sensor
Zero the sensor before making power measurements. If frequent low-level measurements are being made, it is
advised to check the sensor zeroing often and repeat as necessary. If the sensor goes into sleep mode, the
sensor must be re-zeroed before taking measurements. Before zeroing the sensor, connect it to the DUT (device
under test) test port and remove RF power from the connection to a level 20 dB below the noise floor of the
power sensor. For the MA24104A power sensor, this level is less than –20 dBm. It is preferable to leave the
sensor connected to the DUT test port so that ground noise and thermal EMF (electro-magnetic fields) are
zeroed out of the measurement. The sensor may also be connected to a grounded connector on the DUT or
disconnected from any signal source.
To zero the sensor, click the Zero button on the application. If the sensor fails the zeroing operation, the
message box states “Sensor zero failed” and “ZERO_ERROR” will be displayed on the application screen until
the problem is corrected. If RF is detected, a reminder message will pop up asking to remove the RF source.
Calibrating the Sensor
The signal channel/analog signal acquisition hardware is integrated along with the RF front end of the power
sensor. All of the necessary frequency and temperature corrections take place within the sensor. Therefore,
there is no need for a reference calibration with the MA24104A.
Applying a Calibration Factor Correction
The MA24104A power sensor has an internal EEPROM containing correction and calibration factors that were
programmed into the sensor at the factory. The power sensor has an internal temperature sensor that reports
its readings periodically to the microprocessor. The sensor makes all of the required calculations on the
measurement once the measurement frequency has been entered by the user.
Optimizing the Readings
This section presents information on how to get the fastest readings from the MA24104A power sensor when
using the Anritsu Power Meter application or operating under remote control (refer to Chapter 13 for specific
remote programming command descriptions). Measurement speed depends greatly on the type of
measurement, the power level, and stability of the signal. Stability of a measurement is influenced by noise
and signal modulation. If high resolution is required, averaging must be increased.
Note
5-4
The values in the following tables are typical and should be used as a reference only.
PN: 10585-00020 Rev. C
PowerXpert UG
Using the MA24104A
5-2
Making Measurements
Table 5-1 describes the number of averages needed to attain a certain noise level for a particular power level
measurement with the Low Aperture Time mode setting.
Table 5-1.
MA24104A Averaging Table (Low Aperture Time, Default Mode)
Input Power
(dBm)
Input Power
(W)
Number of
Averages
Needed for
< 0.20 dB
Noise
50
100
1
1
1
1
2
45
31.6
1
1
1
4
16
40
10.0
1
1
1
20
78
35
3.16
1
1
1
1
1
30
1.00
1
1
1
1
1
25
0.316
1
1
1
1
7
20
0.100
1
1
1
3
61
15
0.0316
2
3
7
25
–
10
0.0100
16
28
62
245
–
5
0.00316
158
–
–
–
–
Number of
Averages
Needed for
< 0.15 dB
Noise
Number of
Averages
Needed for
< 0.10 dB
Noise
Number of
Averages
Needed for
< 0.05 dB
Noise
Number of
Averages
Needed for
< 0.01 dB
Noise
Table 5-2, describes the number of averages needed to attain a certain noise level for a particular power level
measurement with the High Aperture Time mode setting.
Table 5-2.
MA24104A Averaging Table (High Aperture Time)
Input Power
(dBm)
Input Power
(W)
Number of
Averages
Needed for
< 0.20 dB
Noise
50
100
1
1
1
1
1
45
31.6
1
1
1
1
1
40
10.0
1
1
1
2
5
35
3.16
1
1
1
1
1
30
1.00
1
1
1
1
1
25
0.316
1
1
1
1
1
20
0.100
1
1
1
1
4
15
0.0316
1
1
1
2
38
10
0.0100
1
2
4
16
–
5
0.00316
10
18
39
153
–
PowerXpert UG
Number of
Averages
Needed for
< 0.15 dB
Noise
Number of
Averages
Needed for
< 0.10 dB
Noise
Number of
Averages
Needed for
< 0.05 dB
Noise
Number of
Averages
Needed for
< 0.01 dB
Noise
PN: 10585-00020 Rev. C
5-5
5-3
5-3
Measurement Considerations
Using the MA24104A
Measurement Considerations
Time Varying Signals
Case 1: Modulated signals with pulse or pattern repetition times 1 ms (PRF 1 KHz)
If you obtain a steady power reading of a modulated signal (no significant fluctuations of the displayed power)
with no averaging, then it is likely that the pulse or pattern repetition rate is greater than 1 KHz. In this case,
most of the averaging of the envelope power is performed in the front end of the sensor (before being digitized).
When this is the case, the MA24104A will provide an accurate indication of the average power with no special
considerations.
Case 2: Modulated signals with pulse or pattern repetition times between 1 ms and 50 ms
(100 Hz < PRF < 1 KHz)
In this case, the signal is varying too slowly to be averaged in the front end of the sensor, so averaging must be
performed after digitalization by increasing the averaging number in the power meter application (or
calculating the average of several measurements if controlling the sensor over the bus). A large amount of
averaging must be used for some pulse/pattern repetition frequencies to get a steady reading. If Low Aperture
Time (LAT) mode is selected, the maximum recommended pulse repetition time is about 10 ms. If High
Aperture Time (HAT) mode is selected, signals with pulse repetition periods as long as 50 ms can usually be
measured.
Case 3: Modulated signals with pulse or pattern repetition times greater than 50 ms
In this case, it can be difficult to get an accurate average power reading even by averaging many readings. The
sample rate of the sensor and the pulse repetition rate of the signal may be close enough that they can “beat”
together resulting in low frequency modulation of the power indication. If averages are not calculated over
many of these beats, or an integer number of beats, errors can result. This is not unique to the MA24104A and
can be an issue with any power sensor/meter and any sampled data system.
Multitone Signals
The MA24104A is a True-RMS sensor that can measure very wide bandwidth modulation. The only limitation
is the frequency flatness of the sensor. Because the sensor’s sensitivity is not identical for all frequencies and
when measuring multitone signals, the frequency entered into the sensor’s application should be the average
frequency of all significant tones. The MA24104A has an error of 0.1 dB for every 100 MHz bandwidth at
frequencies between 1 GHz and 3 GHz, and an error of 0.5 dB for every 100 MHz bandwidth at frequencies
below 1 GHz and above 3 GHz.
Noise and Averaging
When there is a need to achieve a required reading resolution, particularly at low power levels, averaging is
often needed to reduce noise and steady the displayed power reading. Use the noise vs. resolution tables
(Table 5-1 and Table 5-2 on page 5-5) to determine the number of averages that will typically be required for a
given resolution. Alternatively, determine the number of averages through calculation by using the noise
specifications and the fact that noise will be proportional to the square root of N, where N is the number of
averages.
For example, a CW tone at +40 dBm is to be measured to 0.01 dB resolution. Using Table 5-1 and Table 5-2
on page 5-5, the required number of averages is 5 averages using High Aperture Time mode (the same
measurement would require more than 78 averages in Low Aperture Time mode).
5-6
PN: 10585-00020 Rev. C
PowerXpert UG
Using the MA24104A
5-3
Measurement Considerations
Settling Time
The MA24104A samples power continuously every 70 ms in the Low Aperture Time (LAT) mode and 700 ms in
the High Aperture Time (HAT) mode. The sensor’s front end and digitizer settles completely to a step change in
power in this amount of time. However, there is no way to synchronize the sensor’s sampling to any other
event, such as a power step or bus request for a measurement. Therefore, the first measurement requested
from the sensor after a power step may not be fully settled. To ensure a fully settled measurement when
operating the sensor over the bus, wait 70 ms (700 ms if in HAT) after a power step before requesting the
measurement from the sensor. Alternatively, request two measurements from the sensor and discard the first.
If averaging is required as described above, settling time increases by N × sample period, where N is the
number of averages and the sample period is the time in milliseconds. The measurement sample period is
70 ms for LAT and 700 ms for HAT. When operating the sensor over the bus, request N+1 measurements from
the sensor, discard the first, and then average the subsequent readings. The settling time is approximately
(N+1) × sample period.
Maximum Power
The MA24104A is rated to meet all specifications up to an average input power level of 150 Watts. See
Figure 5-3. Although the average power of all signals should be kept at or below this level, time varying and
burst signals having peak powers less than the limits shown in the figure below can be measured. To ensure
accurate readings, the peak-to-average ratio (crest factor) of signals must be less than 12 dB.
MA24104A Maximum Power
1000
RF power [W]
500
VSWR = 1.0
VSWR <= 1.2
VSWR <= 1.5
200
VSWR <= 3.0
100
500
1000
2000
5000
Frequency [MHz]
Figure 5-3.
Maximum Power Handling Capacity
PowerXpert UG
PN: 10585-00020 Rev. C
5-7
5-4
Uncertainty of a Measurement
5-4
Using the MA24104A
Uncertainty of a Measurement
Measurement Uncertainty Calculator
Included on the Power Expert CD-Rom is a Microsoft Excel tool for calculating power uncertainty. It is
accessible from the Startup.htm page. It contains two tabs; one that provides measurement uncertainty for
each sensor (selectable from a drop-down menu), and another tab that provides additional uncertainty
components and calculated values for the MA24105A Peak Power Sensor.
Uncertainty Components
Power measurements have many component parts that affect overall measurement uncertainty when
measuring power with the MA24104A sensor:
• Measurement Uncertainty: Measurement uncertainty includes the uncertainty associated with the
correction of frequency and the linearity response of the sensor over the entire dynamic range. Anritsu
follows the industry standard condition of calibrating the power-sensing element at a reference power of
0 dBm (1 mW) and an ambient temperature of 25° C.
• Temperature Compensation: Sensor Temperature Compensation describes the relative power level
response over the dynamic range of the sensor. Temperature Compensation should be considered when
operating the sensor at other than room temperature.
• Noise, Zero Set, and Zero Drift: These are factors within the sensor that impact measurement
accuracy at the bottom of the power sensor’s dynamic range.
• Mismatch Uncertainty: Mismatch uncertainty is typically the largest component of measurement
uncertainty. The error is caused by the differing impedances between the power sensor and the devices
to which the power sensor is connected. Mismatch uncertainty can be calculated as follows:
• Source Mismatch:
% Source Mismatch Uncertainty = 1001 + 122 – 1
dB Mismatch Uncertainty = 20log1 + 12
• Load Mismatch (not considering inline power sensor insertion loss):
% Load Mismatch Uncertainty = 1001 + 232 – 1
dB Load Mismatch Uncertainty = 20log1 + 23
• Load Mismatch (considering inline power sensor insertion loss):
% Load Mismatch Uncertainty = 1001 + t2232 – 1
dB Load Mismatch Uncertainty = 20log1 + t223
• Directivity Uncertainty:
% Uncertainty due to Finite Directivity = 100(1 + 3 /D)2 – 1
where:
D is the directivity of the inline power sensor expressed in linear units
1 is the reflection coefficient of the inline power sensor
2 is the reflection coefficient of the source
3 is the reflection coefficient of the load
t is the inline power sensor’s transmission coefficient
t = 10(IL/20)
IL = Insertion Loss of the inline power sensor
5-8
PN: 10585-00020 Rev. C
PowerXpert UG
Using the MA24104A
5-4
Uncertainty of a Measurement
Uncertainty Examples
Two measurement uncertainty calculations for Low Aperture Time mode are shown for the MA24104A in
Table 5-3. The MA24104A is used to measure the power of a 1 GHz, +50.0 dBm and +10 dBm CW signal from a
signal source with a 1.5:1 VSWR and a load having a 1.2:1 VSWR. The example is based on 128 measurement
averages.
Table 5-3.
Measurement Uncertainty Examples
Divisor
Adjusted
Uncertainty
at +50 dBm
(%)
Adjusted
Uncertainty
at +10 dBm
(%)
Normal at 2
2
1.9
1.9
1.0
Normal at 2
2
0.0
0.5
0.1
4.0
Rectangular
0.0
2.3
Zero Drift
0.0
1.2
Normal at 2
2
0.0
0.7
Directivity Induced
Uncertainty
0.6
0.6
Rectangular
0.3
0.3
Source Mismatch
Uncertainty
1.4
1.4
Rectangular
0.8
0.8
Load Mismatch
Uncertainty
3.7
3.7
Rectangular
2.1
2.1
Effect of Digital
Modulation
0
0
Rectangular
0
0
Combined Uncertainty
(RSS)
Room Temperature
3.0
3.9
Expanded Uncertainty
with K=2
Room Temperature
6.0
7.7
0.8
0.8
Combined Uncertainty
(RSS, 0 to 50 °C)
3.1
3.9
Expanded Uncertainty
with K=2
(RSS, 0 to 50 °C)
6.2
7.9
Uncertainty
at +50 dBm
(%)
Uncertainty
at +10 dBm
(%)
Probability
Distribution
Measurement
Uncertainty
3.8
3.8
Noise
0.0
Zero Set
Uncertainty Term
Temperature
Compensation
Table 5-4.
1.4
1.4
Rectangular
Noise Measurement Uncertainty Calculations
Noise Calculations at 50 dBm (100 W):
Noise 24 mW/100 W = 0.0 %
Zero Set 68 mW/100 W = 0.1 %
Zero Drift 20 mW/100 W = 0.0 %
Noise Calculations at +10 dBm (10 mW):
Noise 100 W/10 mW = 1.0 %
Zero Set 398 W/10 mW = 4.0 %
Zero Drift 119 W/10 mW = 1.2 %
PowerXpert UG
PN: 10585-00020 Rev. C
5-9
5-5
5-5
Error States
Using the MA24104A
Error States
This section details some of the error messages that may appear on the application screen. In most cases, the
error condition can be easily corrected. The status LED will light amber when an error state occurs. If not, note
the error message and contact an Anritsu Service Center.
Table 5-5.
Error Messages
Message
Description
Resolution
Zero invalid as temperature
changed by more than
10 Degrees C
The sensor’s ambient temperature has changed
by more than 10 ºC since the last zero
operation.
Perform the zero operation again.
Temperature out of
operating range
The sensor is operating outside of its specified
range of 0 ºC to 55 ºC.
Operate the sensor within its
specified range.
Sensor zero failed
This message box appears if the zero operation Turn off the RF input to the sensor
is unsuccessful. The reason could be the
or disconnect the sensor from the
presence of RF power at the input of the sensor. RF source and try the zero
operation again.
ZERO_ERROR
This message appears on the application
screen if the zero operation is unsuccessful. The
reason could be the presence of RF power at
the input of the sensor.
Turn off the RF input to the sensor
or disconnect the sensor from the
RF source and try the zero
operation again.
ADC_TEMP_OVERRNGE
This message appears on the application
screen if the sensor is being operated in
extremely high temperatures and has
overheated.
Remove the sensor from the USB
connection and allow to cool to
the operating range of the sensor:
0 ºC to 55 ºC
5-10
PN: 10585-00020 Rev. C
PowerXpert UG
Chapter 6 — Operational Testing for the
MA24104A
6-1
Introduction
The test methodology and equipment described here can be used to gain some confidence in the measurement
accuracy of the MA24104A Power Sensor. This is accomplished by comparing the sensor to another sensor with
a specified cal factor and linearity performance or uncertainty. General commercially available equipment is
used for these tests; however, these procedures are not sufficiently accurate to verify sensors to factory
specification. Therefore, sensor test limits in these procedures are set appropriately to the specified comparison
equipment. All tests should be performed at an ambient temperature of 20 ºC to 25 ºC.
Calibration and verification of high accuracy power sensors requires substantial investment in both
skill and equipment. For calibration, calibration verification, and to maintain the factory specifications
of your power sensor, please send sensors to a qualified Anritsu Customer Service Center.
Note
Refer to the following sections for required equipment and test procedures:
• “Required Equipment - MA24104A”
• “VSWR Pretest”
• “Directivity Test”
• “Frequency Response Test”
• “Linearity Test”
6-2
Precautions
Warning
Do not connect or apply power outside of the power sensor specifications or permanent damage
may result.
Before connecting the power sensor to another device, ensure the following:
Both connectors are in good condition and undamaged
Pin depth is verified
Both connectors are clean
Ensure the output of the device you are connecting to does not exceed the signal limits of the
sensor.
ESD precautions are observed.
Refer to Chapter 4, “Power Sensor Care” for complete details.
Caution
When connecting the power sensor, ensure the following:
The connectors are aligned before mating
Do not turn the connector body–only the connector coupling nut.
Torque the connection using the correct torque wrench and proper torquing technique.
Do not over torque.
Refer to Chapter 4, “Power Sensor Care” for complete details.
PowerXpert UG
PN: 10585-00020 Rev. C
6-1
6-3
6-3
Required Equipment - MA24104A
Operational Testing for the MA24104A
Required Equipment - MA24104A
Table 6-1.
Required Equipment
Equipment Description
Manufacturer and Model
Critical Specifications
Vector Network Analyzer (Pretest)
Anritsu MS4642A
or equivalent
Reflection Coefficient
Uncertainty 0.013, 600 MHz to 2 GHz
Uncertainty 0.020, 2 GHz to 4 GHz
Synthesizer
(Cal. Factor and Linearity Tests)
Anritsu MG3692B
or equivalent
Output Power: +20 dBm 0.05 GHz to 4 GHz
Output Power Setting Resolution: 0.01 dBm
Harmonics: –40 dBc
Source VSWR 2.00
Reference Power Meter
(Cal. Factor and Linearity Tests)
Anritsu ML2438A
or equivalent
Instrumentation Accuracy 0.5 %
Reference Power Sensor
(Cal. Factor and Linearity Tests)
Anritsu MA24002A
or equivalent
NIST Calibration or equivalent
10 dB N Attenuator
(Linearity Test)
Aeroflex Model 1433
VSWR 1.15, 600 MHz to 4 GHz, 250 W min.
10 dB K Attenuator
(Frequency Response and Linearity
Tests)
Anritsu 41KC-10
VSWR 1.15, 600 MHz to 4 GHz, 2 W min.
Low Power 30 dB N Attenuator
(Linearity Tests)
42N50A-30
VSWR 1.2, 600 MHz to 4 GHz, 30 W min.
50 ohm Termination
Aeroflex Model 1433
VSWR 1.15, 600 MHz to 4 GHz, 250 W min.
Adapter N(f) to K(f)
(Frequency Response and Linearity
Tests)
Anritsu 34ANF50, 34AS50, VSWR 1.05, 600 MHz to 4 GHz
34AN50, and 34ASF50
Power Coupler (Linearity Test)
MITEQ CD2-522-30N
600 MHz to 4.0 GHz, Coupling = 30 dB,
250 W min.
Amplifier (Directivity, Frequency
Response and Linearity Tests)
Ophir 5163, 5125
600 MHz to 4.0 GHz, 250 W min.
Harmonics < –20 dBc
Spurious < –20 dBc
Personal Computer
Any
See Chapter 2
6-2
PN: 10585-00020 Rev. C
PowerXpert UG
Operational Testing for the MA24104A
6-4
6-4
VSWR Pretest
VSWR Pretest
Excessive mechanical shock can cause a failure in the MA24104A. Excessive shock may cause permanent
internal mechanical displacements that results in impedance change. Input match will be degraded when the
coupling element impedance is changed. If you suspect that a sensor is damaged, you should start with an
input match pretest.
The maximum VSWR values are listed in the Performance Specification section of this manual. The
uncertainty of the VSWR test equipment will affect actual measurement values. Table 6-2 shows how
measurement system uncertainty can affect the Expected Maximum Reflection Coefficient when using the
Anritsu MS4642A Vector Network Analyzer.
Test Procedure
Follow the manufacturers S11 (or return loss) calibration procedure to perform calibration on a network
analyzer. Connect the power sensor to the network analyzer test port and measure power sensor input match.
Typically, matches are measured in terms of return loss in dB. Return loss and magnitude of the reflection
coefficient conversion equations are as follows:
= 10–RL/20
RL = –20log
where
RL = Return Loss in dB
= Magnitude of the Reflection Coefficient
VSWR and magnitude of the reflection coefficient conversion equations are as follows:
VSWR = (1 + ) / (1 – )
= (VSWR – 1) / (VSWR + 1)
where
VSWR = Voltage Standing Wave Ratio
= Magnitude of the Reflection Coefficient
Record the measured data to Table 6-2 in the Actual Measurement column. The Actual Measurement should
be smaller than the Maximum Reflection coefficient. The Maximum Reflection Coefficient is the measurement
system uncertainty added to the sensor’s reflection coefficient specification. If the Actual Measurement
reflection coefficient is larger than the Maximum Reflection Coefficient, then the power sensor may be
defective. If the actual reflection coefficient is significantly larger than the maximum values in Table 6-2, then
the sensor is damaged and it is not necessary to perform further testing.
Note
Table 6-2.
There are no user-serviceable parts inside the power sensors. Contact your local Anritsu Service
Center and return defective sensors with a detailed description of the observed problem.
Pretest Measurement Result
Frequency
MS4642A Reflection
Coefficient Uncertainty
Maximum Reflection
Coefficient
600 MHz to 3 GHz
0.013
0.033 + 0.013 = 0.046
3 GHz to 4 GHz
0.020
0.047 + 0.020 = 0.067
PowerXpert UG
PN: 10585-00020 Rev. C
Actual Measurement
6-3
6-5
Directivity Test
6-5
Operational Testing for the MA24104A
Directivity Test
The most common cause of power sensor failure is excess input power. Applying power that exceeds the
damage level shown on the label will damage MA24104A’s coupling element resulting in directivity change.
Excessive mechanical shock can also cause directivity to change.
Test Procedure
Directivity tests an MA24104A for how selective the sensor is when measuring power in a given direction of
travel and rejecting signals traveling in the opposite direction. The simplified equations below give the first
order approximation of this parameter:
Directivity (dB) = Power Forward (dB) – Power Reverse (dB)
Directivity Coefficient = 10(–Directivity (dB) / 20)
Directivity (dB) = –20 log(Directivity Coefficient)
Directivity (dB) = 10 log(Power Forward / Power Reverse), where power is in watts.
In this test, the MA24104A is tested first with power in the forward direction and then with power in the
reverse direction. The ratio of the two power readings are the directivity of the device assuming that both the
termination and source are perfect 50 ohm matches. Since the termination and source are not perfect matches,
residual effects from multiple reflections need to be accounted for by performing the following procedure.
1. Turn off the RF of the synthesizer. Connect the power amplifier to the synthesizer. Connect the output of
the amplifier to the input of the MA24104A. Terminate the output of the MA24104A with the specified
termination (Figure 6-1).
2. With the RF off, zero the MA24104A.
3. Set the synthesizer to the first frequency in Table 6-3 on page 6-5 and to a very low power setting and
slowly increase the power until the MA24104A displays +30 dBm. Allow the devices to warm up for 30
minutes.
4. Turn off the RF of the synthesizer and zero the MA24104A again.
5. Turn on the RF and adjust the synthesizer until the MA24104A displays approximately +44 dBm.
Confirm that the reading is stable and record this value as Power Forward in Table 6-3.
6. Turn off the RF on the synthesizer.
7. Reverse the MA24104A connections to the termination and the amplifier. Confirm that the MA24104A
output is now connected to the amplifier and that the input is connected to the termination (Figure 6-1).
8. Turn on the RF. Change the MA24104A averages if necessary to see a steady reading. Record the value
as Power Reverse in Table 6-3.
9. Calculate the Actual Directivity in dB by subtracting Power Reverse from Power Forward. If the power is in
watts, use the formula noted above to calculate the Actual Directivity in dB.
10. If the actual directivity is larger than the minimum allowable directivity in Table 6-3, contact Anritsu
customer service.
11. Repeat the steps above for the next frequency in Table 6-3.
6-4
PN: 10585-00020 Rev. C
PowerXpert UG
Operational Testing for the MA24104A
6-5
Directivity Test
MA24104A 3
“Power Forward”
2
6
3
4
5
1
MA24104A 7
“Power Reverse”
9
8
3
Index
1
2
3
4
5
6
7
8
9
10
11
Figure 6-1.
Table 6-3.
11
10
Description
Amplifier
Synthesizer
MA24104A “Power Forward” Measurement
RF In: N Type Connector (Torque connector at 12 lbf·in (1.35 N·m)
RF Out: N Type Connector (Torque connector at 12 lbf·in (1.35 N·m)
50 ohm Termination
MA24104A “Power Reverse” Measurement
RF Out
RF In
50 ohm Termination
PC with Anritsu PowerXpert Application
Directivity Test Set Up for Power Forward and Power Reverse
Directivity Test Measured Results
Reflective
Frequency Coefficient of
(GHz)
Termination
Maximum
Directivity
Coefficient
A
Power
Forward
(dB)
B
Power
Reverse
(dB)
A–B
Actual
Directivity
(dB)
Minimum
Allowable
Directivity
(dB)
0.6
0.048
0.079
22.0
1.0
0.048
0.079
22.0
1.5
0.048
0.079
22.0
2.0
0.048
0.079
22.0
2.5
0.048
0.101
19.9
3.0
0.048
0.101
19.9
3.5
0.048
0.120
18.4
4.0
0.048
0.120
18.4
PowerXpert UG
PN: 10585-00020 Rev. C
6-5
6-6
Frequency Response Test
6-6
Operational Testing for the MA24104A
Frequency Response Test
In this test the frequency response of the sensor is tested at one low power level against a reference sensor of
known measurement uncertainty. The reference sensor should be calibrated by a reputable standards
laboratory using instruments with low published measurement uncertainty values. To perform the
comparison, both sensors are used to measure the output power of a synthesizer with a high quality
attenuator, such as the 41KC-10 (with appropriate adapters), on the output. The attenuator improves the
source match of the synthesizer by lowering the mismatch ripples, thereby lowering the uncertainty in the
comparison.
Test Procedure
1. Set up the equipment as follows (refer to Figure 6-2 for an illustration):
a. Connect the reference power sensor to the reference power meter using the appropriate cables.
b. Connect the USB cable between the personal computer with the PowerXpert application installed
and the MA24104A power sensor under test.
c. Launch the PowerXpert application.
d. Turn the power on to all of the instruments and allow them to warm up for the amount of time
specified in their respective manuals.
e. Reset or Preset all of the instruments.
f. Configure the reference meter and sensor to measure a CW signal.
g. Perform a sensor Zero and a 1 mW reference calibration on the reference sensor and meter per the
manufacturer’s instructions.
h. Perform a low-level Zero of the MA24104A by disconnecting the MA24104A from the synthesizer,
clicking the Zero button on the PowerXpert application, and waiting for the Zeroing message to
close.
i. Connect the synthesizer to the amplifier input. Connect the attenuator to the amplifier output,
then connect the appropriate adapter to the output of the attenuator.
j. Set the synthesizer to 50 MHz and a very low power output.
3
4
MA24104A
3
7
2
5
6
1
Index
Description
1
2
Amplifier
Synthesizer
Figure 6-2.
6-6
8
Frequency Response Test Set Up (1 of 2)
PN: 10585-00020 Rev. C
PowerXpert UG
Operational Testing for the MA24104A
3
4
5
6
7
8
6-6
Frequency Response Test
Reference Power Meter
Reference Power Sensor
K to N Adapter
Attenuator
50 ohm Termination
PC with Anritsu PowerXpert Application
Figure 6-2.
Frequency Response Test Set Up (2 of 2)
2. Connect the reference sensor to the amplifier with the appropriate adapter and attenuator in-line
(see Figure 6-2).
3. Apply the Cal factor to the reference sensor per the manufacturer’s instruction.
4. Adjust the synthesizer power until the reference displays +15 dBm.
5. Record the power indicated by the reference meter in Table 6-4.
6. Disconnect the reference sensor from the synthesizer output and connect the MA24104A power sensor
with the appropriate adapter and attenuator in-line (see Figure 6-2).
7. Apply the Cal factor to the MA24104A by entering the frequency (in GHz) in the PowerXpert application,
and then click Apply above settings.
8. Record the power indicated by the MA24104A in Table 6-4.
9. Set the synthesizer frequency to the next frequency in Table 6-4.
10. Repeat Step 2 through Step 9 until all of the frequencies in Table 6-4 have been measured.
11. For each row in Table 6-4, calculate the absolute value of the difference between the recorded Reference
power measurement and the recorded MA24104A measurement, and record the result in Table 6-4.
12. For each frequency, compare the power difference to the maximum allowed difference specified in
Table 6-4. If the difference is higher than the maximum allowed difference, contact Anritsu customer
service.
Table 6-4.
Test Measurement Results
Frequency
(GHz)
A
B
Reference Power
Measurement
(dBm)
MA24104A
Measurement
(dBm)
A-B
Absolute Value of
Difference in Power
Measurements
(dB)
Maximum Allowed
Difference
(dB)
0.6
0.33
1.0
0.33
1.5
0.33
2.0
0.33
2.5
0.36
3.0
0.36
3.5
0.37
4.0
0.37
PowerXpert UG
PN: 10585-00020 Rev. C
6-7
6-7
Linearity Test
6-7
Operational Testing for the MA24104A
Linearity Test
The linearity correction of the MA24104A is compared to a thermal power sensor, which has very good
inherent linearity over a power range of about –20 to +10 dBm. For this reason, the MA24104A will be
compared to the thermal sensor in two ranges, keeping the power levels to the thermal sensor in the range of
–17 dBm to +5 dBm, while the power to the MA24104A will vary from about –26 dBm to about +14 dBm.
Test Procedure
1. Set up the equipment as follows (see Figure 6-3):
a. Connect the reference power sensor to the reference power meter using the appropriate cables.
b. Connect the USB cable between the personal computer with the PowerXpert application installed
and the MA24104A power sensor under test.
c. Launch the PowerXpert application.
d. Turn the power on to all of the instruments and allow them to warm up for the amount of time
specified in the instrument’s respective manuals.
e. Reset or Preset all of the instruments.
f. Configure the reference meter and sensor to measure a CW signal.
g. Perform a sensor Zero and a 1 mW reference calibration on the reference sensor and meter per the
manufacturer’s instructions.
h. Perform a low-level Zero of the MA24104A by disconnecting the sensor from the synthesizer, click
the Zero button in the PowerXpert application, and wait for the Zeroing message to close.
i. Connect the power coupler to the output of the synthesizer and connect the 10 dB K attenuator
using an adapter to the coupler’s coupling output.
j. Connect the low power 30 dB N attenuator to the other coupling output.
k. Connect the reference sensor to the 10 dB K attenuator using an adapter.
l. Connect the MA24104A to the output of the coupler.
m. Set the synthesizer to 50 MHz and a very low power level.
n. Increase averaging by entering “16” in the PowerXpert application, and then click Apply above
settings.
6-8
PN: 10585-00020 Rev. C
PowerXpert UG
Operational Testing for the MA24104A
6-7
3
Linearity Test
4
5
6
2
7
8
MA24104A
3
10
9
1
11
Index
Description
1
2
3
4
5
6
7
8
9
10
11
Amplifier
Synthesizer
Reference Power Meter
Reference Power Sensor
K to N Adapter
10 dB K Attenuator
K to N Adapter
Power Coupler
30 dB N Attenuator
50 ohm Termination
PC with Anritsu PowerXpert Application
Figure 6-3.
Linearity Test Setup 1
2. Apply the Cal factor to the reference sensor per the manufacturer’s procedure.
3. Apply the Cal factor to the MA24104A by entering the frequency (in GHz) in the PowerXpert application,
and then click Apply above settings.
4. Turn Off the synthesizer’s RF output and perform a low-level Zero of both the Reference sensor and the
MA24104A.
5. Turn On the synthesizer’s RF output.
6. Adjust the synthesizer’s power until the MA24104A is reading approximately +45 dBm.
7. Record data for the first 20 dB range as follows:
a. Record the power reading by the reference meter in Table 6-5 on page 6-11.
b. Record the power reading by the MA24104A in Table 6-5.
c. Reduce synthesizer power by 5 dB. The Amplifier output and the MA24104A should be about
+40 dBm.
d. Record the reference meter and the MA24104A power sensor readings in Table 6-5.
PowerXpert UG
PN: 10585-00020 Rev. C
6-9
6-7
Linearity Test
Operational Testing for the MA24104A
e. Repeat the measurement for amplifier output levels of +35, +30, and +25 dBm.
Note
The MA24104A power measured at +25 dBm will be used in Step 8e, below.
8. Set up the test for the second 20 dB range as follows:
a. Remove the 10 dB K attenuator from in between the reference sensor and coupler, then connect
the reference sensor directly to the coupler’s coupling port.
b. Remove the MA24104A from the coupler and connect the 10 dB N attenuator between the coupler
and the MA24104A power sensor (see Figure 6-4).
c. Turn off the synthesizer RF output and perform a low-level Zero of both the Reference sensor and
the MA24104A.
d. Turn on the synthesizer RF output.
3
4
2
5
MA24104A
3
8
7
6
1
9
Index Description
1
2
3
4
5
6
7
8
9
Amplifier
Synthesizer
Reference Power Meter
Reference Power Sensor
Power Coupler
30 dB N Attenuator
10 dB N Attenuator
50 ohm Termination
PC with Anritsu PowerXpert Application
Figure 6-4.
Linearity Test Setup 2
e. Set the amplifier output level to approximately 5 dB higher and then adjust the output level until
the MA24104A reads as close as possible to the value obtained in Step 7e.
9. Record data for the next 20 dB range:
a. Read and record the power indicated by the reference meter in Table 6-5.
6-10
PN: 10585-00020 Rev. C
PowerXpert UG
Operational Testing for the MA24104A
6-7
Linearity Test
b. Lower the output power level of the amplifier by 5 dB. The amplifier output should be about
+30 dBm and the MA24104A should be about +20 dBm.
c. Record the reference meter and the MA24104A power sensor readings in Table 6-5.
d. Repeat the measurement for amplifier output levels of +25, +20, and +15 dBm.
Table 6-5.
Measurement Results (50 MHz)
A
Reference
Power
Measurement
(dBm)
B=
(A6 – A5)
C = (A + B)
Corrected
Reference Power
Measurement
(dB)
Row
#
Approx.
Output
Power of the
Amplifier
(dBm)
Attenuation
in Reference
Arm
(dB)
1
45
10
0
2
40
10
0
3
35
10
0
4
30
10
0
5
25
10
0
6
adjust per
Step 8e
0
0
10
7
30
0
0
10
8
25
0
0
10
9
20
0
0
10
10
15
0
0
10
Correction
(dB)
Attenuation
in Test Arm
(dB)
D
E = (C–D)
MA24104A
Measurement
(dBm)
Difference
Calculation
(dB)
11
Max:
12
Min:
13
Delta (E11 – E12):
10. Perform the calculations and operational check as follows:
a. Subtract the Reference Power Measurement of row 5 from the Reference Power Measurement of
row 6. Record this value in the Correction column of rows 1 through 5.
Note
The Correction column of rows 1 through 5 should all have the same value.
The Correction column of rows 6 through 10 have values of 0.
b. Add the Reference Power Measurement and Correction values of row 1 and record the result in the
Corrected Reference Power Measurement column of row 1.
c. Repeat Step 10b for rows 2 through 10.
d. Subtract the MA24104A Measurement of row 1 from the Corrected Reference Power Measurement
of row 1 and record the result in the Difference Calculation column of row 1.
e. Repeat Step 10d for rows 2 through 10.
f. Find the largest (most positive) value in the Difference Calculation column and record this value
next to the word Max in row 11.
g. Find the smallest (least positive or most negative) value in the Difference Calculation column and
record this value next to the word Min in row 12.
h. Subtract the Min value from Step 10g from the Max value from Step 10f and record the result next
to the word Delta in row 13.
i. The Delta result should be less than 0.3 dB. If it is larger, contact Anritsu customer service.
PowerXpert UG
PN: 10585-00020 Rev. C
6-11
6-7
Linearity Test
Operational Testing for the MA24104A
11. Repeat the entire measurement and calculations with synthesizer frequency settings of 2 GHz and
4 GHz.
Table 6-6.
Measurement Results (2 GHz)
A
B
= (A6–A5)
C
= (A+B)
Corrected
Reference Power
Measurement
(dB)
Row
#
Approx.
Output
Power of the
Amplifier
(dBm)
Attenuation
in Reference
Arm
(dB)
1
45
10
0
2
40
10
0
3
35
10
0
4
30
10
0
5
25
10
0
6
adjust per
Step 8e
0
0
10
7
30
0
0
10
8
25
0
0
10
9
20
0
0
10
10
15
0
0
10
Reference
Power
Measurement
(dBm)
Correction
(dB)
Attenuation
in Test Arm
(dB)
D
C–D
MA24104A
Measurement
(dBm)
Difference
Calculation
(dB)
11
Max:
12
Min:
13
Delta (E11 – E12):
Table 6-7.
Measurement Results (4 GHz)
A
B
= (A6–A5)
C
= (A+B)
Corrected
Reference Power
Measurement
(dB)
Row
#
Approx.
Output
Power of the
Amplifier
(dBm)
Attenuation
in Reference
Arm
(dB)
1
45
10
0
2
40
10
0
3
35
10
0
4
30
10
0
5
25
10
0
6
adjust per
Step 8e
0
0
10
7
30
0
0
10
8
25
0
0
10
9
20
0
0
10
10
15
0
0
10
Reference
Power
Measurement
(dBm)
Correction
(dB)
Attenuation
in Test Arm
(dB)
D
E
= (C–D)
MA24104A
Measurement
(dBm)
Difference
Calculation
(dB)
11
Max:
12
Min:
13
Delta (E11 – E12):
6-12
PN: 10585-00020 Rev. C
PowerXpert UG
Chapter 7 — Using the MA24105A
7-1
Sensor Overview
The power sensor’s connectors are illustrated in the figure below:
1
2
3
Index
4
Description
1
RF Input: N Type Connector (Torque connector at 12 lbf·in (1.35 N·m)
2
RF Output: N Type Connector (Torque connector at 12 lbf·in (1.35 N·m)
3
USB Micro-B Port (for connection with a PC or Anritsu Handheld instrument)
2-color LED (reports functional status of the sensor)
4
Figure 7-1.
Green: Sensor ON, Status OK
Amber: Error Condition (see Table 7-6 on page 7-10)
MA24105A Sensor Overview
PowerXpert UG
PN: 10585-00020 Rev. C
7-1
7-2
Making Measurements
7-2
Using the MA24105A
Making Measurements
This section presents common procedures for using the MA24105A power sensor with a PC. These procedures
refer to the MA24105A sensor and Anritsu PowerXpert PC application buttons and menus that were
previously described. Before attempting these procedures, you should be familiar with the Anritsu PowerXpert
PC application. If an Anritsu Master™ series handheld instrument is being used with the power sensor, refer
to the user documentation that came with the handheld instrument for procedures on operating external
power sensors.
Basic Power Measurement
1. Connect the sensor to a computer or Anritsu Master™ series instrument as shown in Figure 7-2
on page 7-3.
2. Open the Anritsu Power Meter application.
3. Zero the sensor as described below in “Zeroing the Sensor”.
Warning
Do not connect or apply power outside of the MA24105A specifications or permanent damage may
result.
Before connecting the power sensor to another device, ensure the following:
Caution
Both connectors are in good condition and undamaged
Pin depth is verified
Both connectors are clean
Ensure the output of the device you are connecting to does not exceed the signal limits of the
sensor.
ESD precautions are observed.
Refer to Chapter 4, “Power Sensor Care” for complete details.
When connecting the power sensor, ensure the following:
The connectors are aligned before mating
Do not turn the connector body–only the connector coupling nut.
Torque the connection using the correct torque wrench and proper torquing technique.
Do not over torque.
Refer to Chapter 4, “Power Sensor Care” for complete details.
4. Connect the load to the RF OUT port of the sensor. Connecting the load first protects the power sensor as
well as the source/DUT from excessive mismatch.
5. Connect the RF source to the RF IN port of the power sensor.
6. Read the power measurement from the Anritsu Power Meter application window (power readings are
continuous with the default setting).
7-2
PN: 10585-00020 Rev. C
PowerXpert UG
Using the MA24105A
7-2
Making Measurements
4
3
5
8
6
2
1
7
Index
1
2
3
4
5
6
7
8
Figure 7-2.
Description
Source
RF In: N type Connector (Torque connector at 12 lbf·in (1.35 N·m)
RF Out: N type Connector (Torque connector at 12 lbf·in (1.35 N·m)
Load
USB to PC
USB to BTS or Spectrum Master
USB to Site Master or Cell Master
PC with Anritsu PowerXpert Application
Measurement Setup
PowerXpert UG
PN: 10585-00020 Rev. C
7-3
7-2
Making Measurements
Using the MA24105A
Connecting the Sensor
RF signal connections are made to the Type N female RF connectors, which have a 50 characteristic
impedance. The input port is labeled RF IN and the output port is labeled RF OUT.
When connecting to the Type N female connector of the MA24105A to a Type N connector, observe the
following proper practice for tightening the connection:
1. While holding the body of the N connector in one hand, turn the Type N Male connector nut to finger
tighten the connection. Do not turn the body of the MA24105A as this will cause excessive wear to the
connector.
2. Back off the connection by turning the connector nut counter clockwise ¼ turn.
3. Tighten the connection (clockwise) using a 12 in-lb torque wrench (Anritsu part number: 01-200).
Note
The Sensor has a USB 2.0 interface with a USB Type Micro-B port. The MA24105A can be remotely
programmed over this USB interface. In addition to programming, the MA24105A is powered by the
USB. The interface is USB 2.0 compatible, but with an interface speed of 12 Mbps.
Zeroing the Sensor
Zero the sensor before making power measurements. If frequent low-level measurements are being made, it is
advised to check the sensor zeroing often and repeat as necessary. If the sensor goes into sleep mode, the
sensor must be re-zeroed before taking measurements. Before zeroing the sensor, connect it to the DUT (device
under test) test port and remove RF power from the connection to a level 20 dB below the noise floor of the
power sensor. For the MA24105A power sensor, this level is less than –20 dBm. It is preferable to leave the
sensor connected to the DUT test port so that ground noise and thermal EMF (electro-magnetic fields) are
zeroed out of the measurement. The sensor may also be connected to a grounded connector on the DUT or
disconnected from any signal source.
To zero the sensor, click the Zero button on the application. If the sensor fails the zeroing operation, the
message box states “Sensor zero failed” and “ZERO_ERROR” will be displayed on the application screen until
the problem is corrected. If RF is detected, a reminder message will pop up asking to remove the RF source.
Calibrating the Sensor
The signal channel/analog signal acquisition hardware is integrated along with the RF front end of the power
sensor. All of the necessary frequency and temperature corrections take place within the sensor. Therefore,
there is no need for a reference calibration with the MA24105A.
Applying a Calibration Factor Correction
The MA24105A power sensor has an internal EEPROM containing correction and calibration factors that were
programmed into the sensor at the factory. The power sensor has an internal temperature sensor that reports
its readings periodically to the microprocessor. The sensor makes all of the required calculations on the
measurement once the measurement frequency has been entered by the user.
Optimizing the Readings
This section presents information on how to get the fastest readings from the MA24105A power sensor when
using the Anritsu Power Meter application or operating under remote control (refer to Chapter 13 for specific
remote programming command descriptions). Measurement speed depends greatly on the type of
measurement, the power level, and stability of the signal. Stability of a measurement is influenced by noise
and signal modulation. If high resolution is required, averaging must be increased.
Note
7-4
The values in the following tables are typical and should be used as a reference only.
PN: 10585-00020 Rev. C
PowerXpert UG
Using the MA24105A
7-2
Making Measurements
Table 7-1 describes the number of averages needed to attain a certain noise level for a particular power level
measurement when measuring forward average power.
Table 7-1.
MA24105A Averaging Table (Forward Average Power)
Input Power
(dBm)
Input Power
(W)
Number of
Averages
Needed for
< 0.20 dB
Noise
50
100
1
1
1
1
1
45
31.6
1
1
1
1
1
40
10.0
1
1
1
1
1
35
3.16
1
1
1
1
1
30
1.00
1
1
1
1
1
25
0.316
1
1
1
1
7
20
0.100
1
1
1
3
69
15
0.0316
2
4
7
28
–
10
0.0100
18
32
70
276
–
5
0.00316
179
314
–
–
–
Number of
Averages
Needed for
< 0.15 dB
Noise
Number of
Averages
Needed for
< 0.10 dB
Noise
Number of
Averages
Needed for
< 0.05 dB
Noise
Number of
Averages
Needed for
< 0.01 dB
Noise
Table 7-2, describes the number of averages needed to attain a certain noise level for a particular power level
measurement when measuring forward peak power.
Table 7-2.
MA24105A Averaging Table (Forward Peak Power)
Input Power
(dBm)
Input Power
(W)
Number of
Averages
Needed for
< 0.20 dB
Noise
50
100
1
1
1
1
2
45
31.6
1
1
1
1
13
40
10.0
1
1
2
6
126
35
3.16
4
6
13
51
–
PowerXpert UG
Number of
Averages
Needed for
< 0.15 dB
Noise
Number of
Averages
Needed for
< 0.10 dB
Noise
Number of
Averages
Needed for
< 0.05 dB
Noise
Number of
Averages
Needed for
< 0.01 dB
Noise
PN: 10585-00020 Rev. C
7-5
7-3
7-3
Measurement Considerations
Using the MA24105A
Measurement Considerations
Multitone Signals
The MA24105A is a True-RMS sensor that can measure very wide bandwidth modulation. The only limitation
is the frequency flatness of the sensor. Because the sensor’s sensitivity is not identical for all frequencies and
when measuring multitone signals, the frequency entered into the sensor’s application should be the average
frequency of all significant tones.
The MA24105A has an error of 0.05 dB for every 100 MHz bandwidth at frequencies between 0.5 GHz and
4 GHz, and an error of 0.5 dB for every 100 MHz bandwidth at frequencies below 0.6 GHz.
Noise and Averaging
When there is a need to achieve a required reading resolution, particularly at low power levels, averaging is
often needed to reduce noise and steady the displayed power reading. Use the noise vs. resolution tables
(Table 7-1 and Table 7-2 on page 7-5) to determine the number of averages that will typically be required for a
given resolution. Alternatively, determine the number of averages through calculation by using the noise
specifications and the fact that noise will be proportional to the square root of N, where N is the number of
averages.
For example, a CW tone at +25 dBm is to be measured to 0.01 dB resolution. Using Table 7-1, the required
number of averages is seven averages when measuring average power in the forward direction.
Settling Time
The MA24105A samples power continuously every 150 ms. The sensor’s front end and digitizer settles
completely to a step change in power in this amount of time. However, there is no way to synchronize the
sensor’s sampling to any other event, such as a power step or bus request for a measurement. Therefore, the
first measurement requested from the sensor after a power step may not be fully settled. To ensure a fully
settled measurement when operating the sensor over the bus, wait 150 ms after a power step before requesting
the measurement from the sensor. Alternatively, request two measurements from the sensor and discard the
first.
If averaging is required as described above, settling time increases by N × sample period, where N is the
number of averages and the sample period is the time in milliseconds. The measurement sample period is
150 ms. When operating the sensor over the bus, request N+1 measurements from the sensor, discard the first,
and then average the subsequent readings. The settling time is approximately (N+1) × sample period.
Maximum Power
The MA24105A is rated to meet all specifications up to an average input power level of 150 Watts. Although
the average power of all signals should be kept at or below this level, time varying and burst signals having
peak powers less than 300 W can be measured. To ensure accurate readings, the peak-to-average ratio (crest
factor) of signals must be less than 12 dB.
Warning
7-6
Power in excess of that shown in Figure 7-3 on page 7-7 may damage the sensor.
PN: 10585-00020 Rev. C
PowerXpert UG
Using the MA24105A
7-3
Measurement Considerations
MA24105A Maximum Power
1000
RF power [W]
500
VS WR ≤ 1.5
200
100
VS WR ≤ 3.0
500
1000
2000
5000
Frequency [MHz]
Figure 7-3.
Maximum Power Handling Capacity
PowerXpert UG
PN: 10585-00020 Rev. C
7-7
7-4
Uncertainty of a Measurement
7-4
Using the MA24105A
Uncertainty of a Measurement
Measurement Uncertainty Calculator
Included on the Power Expert CD-Rom is a Microsoft Excel tool for calculating power uncertainty. It is
accessible from the Startup.htm page. It contains two tabs; one that provides measurement uncertainty for
each sensor (selectable from a drop-down menu), and another tab that provides additional uncertainty
components and calculated values for the MA24105A Peak Power Sensor.
Uncertainty Components
Power measurements have many component parts that affect overall measurement uncertainty when
measuring power with the MA24105A sensor:
• Measurement Uncertainty: Measurement uncertainty includes the uncertainty associated with the
correction of frequency and the linearity response of the sensor over the entire dynamic range. Anritsu
follows the industry standard condition of calibrating the power-sensing element at a reference power of
0 dBm (1 mW) and an ambient temperature of 25° C.
• Temperature Compensation: Sensor Temperature Compensation describes the relative power level
response over the dynamic range of the sensor. Temperature Compensation should be considered when
operating the sensor at other than room temperature.
• Noise, Zero Set, and Zero Drift: These are factors within the sensor that impact measurement
accuracy at the bottom of the power sensor’s dynamic range.
• Mismatch Uncertainty: Mismatch uncertainty is typically the largest component of measurement
uncertainty. The error is caused by the differing impedances between the power sensor and the devices
to which the power sensor is connected. Mismatch uncertainty can be calculated as follows:
• Source Mismatch:
% Source Mismatch Uncertainty = 1001 + 122 – 1
dB Mismatch Uncertainty = 20log1 + 12
• Load Mismatch (not considering inline power sensor insertion loss):
% Load Mismatch Uncertainty = 1001 + 232 – 1
dB Load Mismatch Uncertainty = 20log1 + 23
• Load Mismatch (considering inline power sensor insertion loss):
% Load Mismatch Uncertainty = 1001 + t2232 – 1
dB Load Mismatch Uncertainty = 20log1 + t223
• Directivity Uncertainty:
% Uncertainty due to Finite Directivity = 100(1 + 3 /D)2 – 1
where:
D is the directivity of the inline power sensor expressed in linear units
1 is the reflection coefficient of the inline power sensor
2 is the reflection coefficient of the source
3 is the reflection coefficient of the load
t is the inline power sensor’s transmission coefficient
t = 10(IL/20)
IL = Insertion Loss of the inline power sensor
7-8
PN: 10585-00020 Rev. C
PowerXpert UG
Using the MA24105A
7-4
Uncertainty of a Measurement
Uncertainty Examples
Two measurement uncertainty calculations for the MA24105A are shown in Table 7-3. The MA24105A is used
to measure the power of a 1 GHz, +50.0 dBm and +10 dBm CW signal from a signal source with a 1.5:1 VSWR
and a load having a 1.2:1 VSWR. The example is based on 128 measurement averages.
Table 7-3.
Measurement Uncertainty Examples
Divisor
Adjusted
Uncertainty
at +50 dBm
(%)
Adjusted
Uncertainty
at +10 dBm
(%)
Normal at 2
2
1.9
1.9
1.7
Normal at 2
2
0.0
0.9
0.0
2.5
Rectangular
0.0
1.4
Zero Drift
0.0
2.3
Normal at 2
2
0.0
1.3
Directivity Induced
Uncertainty
0.6
0.6
Rectangular
0.3
0.3
Source Mismatch
Uncertainty
1.4
1.4
Rectangular
0.8
0.8
Load Mismatch
Uncertainty
3.7
3.7
Rectangular
2.1
2.1
Effect of Digital
Modulation
0
0
Rectangular
0
0
Combined Uncertainty
(RSS)
Room Temperature
3.0
3.7
Expanded Uncertainty
with K=2
Room Temperature
6.0
7.3
1.1
1.1
Combined Uncertainty
(RSS, 0 to 50 °C)
3.2
3.8
Expanded Uncertainty
with K=2
(RSS, 0 to 50 °C)
6.3
7.6
Uncertainty
at +50 dBm
(%)
Uncertainty
at +10 dBm
(%)
Probability
Distribution
Measurement
Uncertainty
3.8
3.8
Noise
0.0
Zero Set
Uncertainty Term
Temperature
Compensation
Table 7-4.
1.9
1.9
Rectangular
Noise Measurement Uncertainty Calculations
Noise Calculations at 50 dBm (100 W):
Noise 1.9 mW/100 W = 0.0 %
Zero Set 3 mW/100 W = 0.0 %
Zero Drift 2.7 mW/100 W = 0.0 %
Noise Calculations at +10 dBm (10 mW):
Noise 170 W/10 mW = 1.7 %
Zero Set 250 W/10 mW = 2.5 %
Zero Drift 230 W/10 mW = 2.3 %
PowerXpert UG
PN: 10585-00020 Rev. C
7-9
7-5
Error States
Using the MA24105A
Table 7-5 shows another example measuring a pulse signal of +50dBm at a repetition rate of 80/S with a duty
cycle of 8 %.
Table 7-5.
Uncertainty Example - Pulse Signal (MA24105A)
PEP Uncertainty Components
Uncertainty at
+50 dBm
(%)
Power Sensor
Probability
Distribution
Divisor
Adjusted
Uncertainty
at +50 dBm
(%)
Base Unc (Average Power Uncertainty)
6.3
Normal
2
3.2
Peak Circuit Contribution
7.3
Rectangular
4.2
Burst Repetition Rate
1.8
Rectangular
1.0
Burst Width
0.0
Rectangular
0.0
Burst Duty Cycle
0.1
Rectangular
0.1
PEP Measurement Uncertainty
7-5
Combined Uncertainty (%)
(Base Unc + RSS)
7.5
Expanded Uncertainty (%)
with K=2
15.0
Error States
This section details some of the error messages that may appear on the application screen. In most cases, the
error condition can be easily corrected. The status LED will light amber when an error state occurs. If not, note
the error message and contact an Anritsu Service Center.
Table 7-6.
Error Messages
Message
Description
Resolution
Zero invalid as temperature
changed by more than
10 Degrees C
The sensor’s ambient temperature has changed
by more than 10 ºC since the last zero
operation.
Perform the zero operation again.
Temperature out of
operating range
The sensor is operating outside of its specified
range of 0 ºC to 55 ºC.
Operate the sensor within its
specified range.
Sensor zero failed
This message box appears if the zero operation Turn off the RF input to the sensor
is unsuccessful. The reason could be the
or disconnect the sensor from the
presence of RF power at the input of the sensor. RF source and try the zero
operation again.
ZERO_ERROR
This message appears on the application
screen if the zero operation is unsuccessful. The
reason could be the presence of RF power at
the input of the sensor.
Turn off the RF input to the sensor
or disconnect the sensor from the
RF source and try the zero
operation again.
ADC_TEMP_OVERRNGE
This message appears on the application
screen if the sensor is being operated in
extremely high temperatures and has
overheated.
Remove the sensor from the USB
connection and allow to cool to
the operating range of the sensor:
0 ºC to 55 ºC
7-10
PN: 10585-00020 Rev. C
PowerXpert UG
Chapter 8 — Operational Testing for the
MA24105A
8-1
Introduction
The test methodology and equipment described here can be used to gain some confidence in the measurement
accuracy of the MA24105A Power Sensor. This is accomplished by comparing the sensor to another sensor with
a specified cal factor and linearity performance or uncertainty. General commercially available equipment is
used for these tests; however, these procedures are not sufficiently accurate to verify sensors to factory
specification. Therefore, sensor test limits in these procedures are set appropriately to the specified comparison
equipment. All tests should be performed at an ambient temperature of 20 ºC to 25 ºC.
Calibration and verification of high accuracy power sensors requires substantial investment in both
skill and equipment. For calibration, calibration verification, and to maintain the factory specifications
of your power sensor, please send sensors to a qualified Anritsu Customer Service Center.
Note
Refer to the following sections for required equipment and test procedures:
• “Required Equipment - MA24105A”
• “VSWR Pretest”
• “Directivity Test”
• “Frequency Response Test”
• “Linearity Test”
8-2
Precautions
Warning
Do not connect or apply power outside of the power sensor specifications or permanent damage
may result.
Before connecting the power sensor to another device, ensure the following:
Both connectors are in good condition and undamaged
Pin depth is verified
Both connectors are clean
Ensure the output of the device you are connecting to does not exceed the signal limits of the
sensor.
ESD precautions are observed.
Refer to Chapter 4, “Power Sensor Care” for complete details.
Caution
When connecting the power sensor, ensure the following:
The connectors are aligned before mating
Do not turn the connector body–only the connector coupling nut.
Torque the connection using the correct torque wrench and proper torquing technique.
Do not over torque.
Refer to Chapter 4, “Power Sensor Care” for complete details.
PowerXpert UG
PN: 10585-00020 Rev. C
8-1
8-3
8-3
Required Equipment - MA24105A
Operational Testing for the MA24105A
Required Equipment - MA24105A
Table 8-1.
Required Equipment
Equipment Description
Manufacturer and Model
Critical Specifications
Vector Network Analyzer (Pretest)
Anritsu MS4642A
or equivalent
Reflection Coefficient
Uncertainty 0.013, 350 MHz to 2 GHz
Uncertainty 0.020, 2 GHz to 4 GHz
Synthesizer
(Cal. Factor and Linearity Tests)
Anritsu MG3692B
or equivalent
Output Power: +20 dBm 0.05 GHz to 4 GHz
Output Power Setting Resolution: 0.01 dBm
Harmonics: –40 dBc
Source VSWR 2.00
Reference Power Meter
(Cal. Factor and Linearity Tests)
Anritsu ML2438A
or equivalent
Instrumentation Accuracy 0.5 %
Reference Power Sensor
(Cal. Factor and Linearity Tests)
Anritsu MA24002A
or equivalent
NIST Calibration or equivalent
10 dB N Attenuator
(Linearity Test)
Aeroflex Model 1433
VSWR 1.15, 350 MHz to 4 GHz, 250 W min.
10 dB K Attenuator
(Frequency Response and Linearity
Tests)
Anritsu 41KC-10
VSWR 1.15, 350MHz to 4 GHz, 2 W min.
Low Power 30 dB N Attenuator
(Linearity Tests)
42N50A-30
VSWR 1.2, 350 MHz to 4 GHz, 30 W min.
50 ohm Termination
Aeroflex Model 1433
VSWR 1.15, 350 MHz to 4 GHz, 250 W min.
Adapter N(f) to K(f)
(Frequency Response and Linearity
Tests)
Anritsu 34ANF50, 34AS50, VSWR 1.05, 350 MHz to 4 GHz
34AN50, and 34ASF50
Power Coupler (Linearity Test)
MITEQ CD2-522-30N
350 MHz to 4.0 GHz, Coupling = 30 dB,
250 W min.
Amplifier (Directivity, Frequency
Response and Linearity Tests)
Ophir 5163, 5125
350 MHz to 4.0 GHz, 250 W min.
Harmonics < –20 dBc
Spurious < –20 dBc
Personal Computer
Any
See Chapter 2
8-2
PN: 10585-00020 Rev. C
PowerXpert UG
Operational Testing for the MA24105A
8-4
8-4
VSWR Pretest
VSWR Pretest
Excessive mechanical shock can cause a failure in the MA24105A. Excessive shock may cause permanent
internal mechanical displacements that results in impedance change. Input match will be degraded when the
coupling element impedance is changed. If you suspect that a sensor is damaged, you should start with an
input match pretest.
The maximum VSWR values are listed in the Performance Specification section of this manual. The
uncertainty of the VSWR test equipment will affect actual measurement values. Table 8-2 shows how
measurement system uncertainty can affect the Expected Maximum Reflection Coefficient when using the
Anritsu MS4642A Vector Network Analyzer.
Test Procedure
Follow the manufacturers S11 (or return loss) calibration procedure to perform calibration on a network
analyzer. Connect the power sensor to the network analyzer test port and measure power sensor input match.
Typically, matches are measured in terms of return loss in dB. Return loss and magnitude of the reflection
coefficient conversion equations are as follows:
= 10–RL/20
RL = –20log
where
RL = Return Loss in dB
= Magnitude of the Reflection Coefficient
VSWR and magnitude of the reflection coefficient conversion equations are as follows:
VSWR = (1 + ) / (1 – )
= (VSWR – 1) / (VSWR + 1)
where
VSWR = Voltage Standing Wave Ratio
= Magnitude of the Reflection Coefficient
Record the measured data to Table 8-2 in the Actual Measurement column. The Actual Measurement should
be smaller than the Maximum Reflection Coefficient. The Maximum Reflection Coefficient is the measurement
system uncertainty added to the sensor’s reflection coefficient specification. If the Actual Measurement
reflection coefficient is larger than the Maximum Reflection Coefficient, then the power sensor may be
defective. If the actual reflection coefficient is significantly larger than the maximum values in Table 8-2, then
the sensor is damaged and it is not necessary to perform further testing.
Note
Table 8-2.
There are no user-serviceable parts inside the power sensors. Contact your local Anritsu Service
Center and return defective sensors with a detailed description of the observed problem.
Pretest Measurement Result
Frequency
MS4642A Reflection
Coefficient Uncertainty
Maximum Reflection
Coefficient
350 MHz to 3 GHz
0.013
0.033 + 0.013 = 0.046
3 GHz to 4 GHz
0.020
0.047 + 0.020 = 0.067
PowerXpert UG
PN: 10585-00020 Rev. C
Actual Measurement
8-3
8-5
Directivity Test
8-5
Operational Testing for the MA24105A
Directivity Test
The most common cause of power sensor failure is excess input power. Applying power that exceeds the
damage level shown on the label will damage the coupling element in the MA24105A, resulting in directivity
change. Excessive mechanical shock can also cause directivity to change.
Test Procedure
Directivity tests an MA24105A for how selective the sensor is when measuring power in a given direction of
travel and rejecting signals traveling in the opposite direction. The simplified equations below give the first
order approximation of this parameter:
Directivity (dB) = Power Forward (dB) – Power Reverse (dB)
Directivity Coefficient = 10(–Directivity (dB) / 20)
Directivity (dB) = –20 log(Directivity Coefficient)
Directivity (dB) = 10 log(Power Forward / Power Reverse), where power is in watts.
In this test, the MA24105A is tested first with power in the forward direction and then with power in the
reverse direction. See Figure 8-1 on page 8-5.
Note
Both forward and reverse readings are taken from the Forward Average Power window on the
PowerXpert display as shown in Figure 8-2 on page 8-5.
The ratio of the two power readings are the directivity of the device assuming that both the termination and
source are perfect 50 ohm matches. Since the termination and source are not perfect matches, residual effects
from multiple reflections need to be accounted for by performing the following procedure.
1. Turn off the RF of the synthesizer. Connect the power amplifier to the synthesizer. Connect the output of
the amplifier to the input of the MA24105A. Terminate the output of the MA24105A with the specified
termination (Figure 8-1).
2. With the RF off, zero the MA24105A.
3. Set the synthesizer to the first frequency in Table 8-3 on page 8-6 and to a very low power setting and
slowly increase the power until the MA24105A displays +30 dBm. Allow the devices to warm up for 30
minutes.
4. Turn off the RF of the synthesizer and zero the MA24105A again.
5. Turn on the RF and adjust the synthesizer until the MA24105A displays approximately +44 dBm.
Confirm that the reading is stable and record this value as Power Forward in Table 8-3.
6. Turn off the RF on the synthesizer.
7. Reverse the MA24105A connections to the termination and the amplifier. Confirm that the MA24105A
output is now connected to the amplifier and that the input is connected to the termination (Figure 8-1).
8. Turn on the RF. Change the MA24105A averages if necessary to see a steady reading. Record the value
as Power Reverse in Table 8-3.
9. Calculate the Actual Directivity in dB by subtracting Power Reverse from Power Forward. If the power is in
watts, use the formula noted above to calculate the Actual Directivity in dB.
10. If the actual directivity is larger than the minimum allowable directivity in Table 8-3, contact Anritsu
customer service.
11. Repeat the steps above for the next frequency in Table 8-3.
8-4
PN: 10585-00020 Rev. C
PowerXpert UG
Operational Testing for the MA24105A
8-5
2
Directivity Test
3
MA24105A
“Power Forward”
6
4
5
1
MA24105A 7
“Power Reverse”
8
10
9
6
Index
1
2
3
4
5
6
7
8
9
10
Figure 8-1.
Description
Amplifier
Synthesizer
MA24105A “Power Forward” Measurement
RF In: N Type Connector (Torque connector at 12 lbf·in (1.35 N·m)
RF Out: N Type Connector (Torque connector at 12 lbf·in (1.35 N·m)
50 ohm Termination
MA24105A “Power Reverse” Measurement
RF Out
RF In
PC with Anritsu PowerXpert Application
Directivity Test Set Up for Power Forward and Power Reverse
Note
1
Note 1: Take both the forward reading and the reverse reading from the Forward Average Power window.
Figure 8-2.
Forward and Reverse Power Reading Location
PowerXpert UG
PN: 10585-00020 Rev. C
8-5
8-5
Directivity Test
Table 8-3.
Directivity Test Measured Results
Reflective
Frequency Coefficient of
(GHz)
Termination
8-6
Operational Testing for the MA24105A
Maximum
Directivity
Coefficient
A
Power
Forward
(dB)
B
Power
Reverse
(dB)
A–B
Actual
Directivity
(dB)
Minimum
Allowable
Directivity
(dB)
0.35
0.048
0.088
21.1
1.0
0.048
0.079
22.0
1.5
0.048
0.079
22.0
2.0
0.048
0.079
22.0
2.5
0.048
0.101
19.9
3.0
0.048
0.101
19.9
3.5
0.048
0.120
18.4
4.0
0.048
0.120
18.4
PN: 10585-00020 Rev. C
PowerXpert UG
Operational Testing for the MA24105A
8-6
8-6
Frequency Response Test
Frequency Response Test
In this test the frequency response of the sensor is tested at one low power level against a reference sensor of
known measurement uncertainty. The reference sensor should be calibrated by a reputable standards
laboratory using instruments with low published measurement uncertainty values. To perform the
comparison, both sensors are used to measure the output power of a synthesizer with a high quality
attenuator, such as the 41KC-10, on the output. The attenuator improves the source match of the synthesizer
by lowering the mismatch ripples, thereby lowering the uncertainty in the comparison.
Test Procedure
1. Set up the equipment as follows (see Figure 8-3):
a. Connect the reference power sensor to the reference power meter using the appropriate cables.
b. Connect the USB cable between the personal computer with the PowerXpert application installed
and the MA24105A power sensor under test.
c. Launch the PowerXpert application.
d. Turn the power on to all of the instruments and allow them to warm up for the amount of time
specified in their respective manuals.
e. Reset or Preset all of the instruments.
f. Configure the reference meter and sensor to measure a CW signal.
g. Perform a sensor Zero and a 1 mW reference calibration on the reference sensor and meter per the
manufacturer’s instructions.
h. Perform a low-level Zero of the MA24105A by disconnecting the MA24105A from the synthesizer,
clicking the Zero button on the PowerXpert application, and waiting for the Zeroing message to
close.
i. Connect the synthesizer to the amplifier input. Connect the attenuator to the amplifier output,
then connect the appropriate adapter to the output of the attenuator.
j. Set the synthesizer to 350 MHz and a very low power output.
3
MA24105A
4
7
2
5
6
1
Index
1
2
3
8
Description
Amplifier
Synthesizer
Reference Power Meter
Figure 8-3.
Frequency Response Test Set Up (1 of 2)
PowerXpert UG
PN: 10585-00020 Rev. C
8-7
8-6
Frequency Response Test
4
5
6
7
8
Operational Testing for the MA24105A
Reference Power Sensor
K to N Adapter
Attenuator
50 ohm Termination
PC with Anritsu PowerXpert Application
Figure 8-3.
Frequency Response Test Set Up (2 of 2)
2. Connect the reference sensor to the amplifier with the appropriate adapter and attenuator in-line
(see Figure 8-3).
3. Apply the Cal factor to the reference sensor per the manufacturer’s instruction.
4. Adjust the synthesizer power until the reference displays +15 dBm.
5. Record the power indicated by the reference meter in Table 8-4.
6. Disconnect the reference sensor from the synthesizer output and connect the MA24105A power sensor
with the appropriate adapter and attenuator in-line (see Figure 8-3).
7. Apply the Cal factor to the MA24105A by entering the frequency (in GHz) in the PowerXpert application,
and then click Apply above settings.
8. Record the power indicated by the MA24105A in Table 8-4.
9. Set the synthesizer frequency to the next frequency in Table 8-4.
10. Repeat Step 2 through Step 9 until all of the frequencies in Table 8-4 have been measured.
11. For each row in Table 8-4, calculate the absolute value of the difference between the recorded Reference
power measurement and the recorded MA24105A measurement, and record the result in Table 8-4.
12. For each frequency, compare the power difference to the maximum allowed difference specified in
Table 8-4. If the difference is higher than the maximum allowed difference, contact Anritsu customer
service.
Table 8-4.
Test Measurement Results
Frequency
(GHz)
8-8
A
B
Reference Power
Measurement
(dBm)
MA24105A
Measurement
(dBm)
A-B
Absolute Value of
Difference in Power
Measurements
(dB)
Maximum Allowed
Difference
(dB)
0.35
0.33
1.0
0.33
1.5
0.33
2.0
0.33
2.5
0.36
3.0
0.36
3.5
0.37
4.0
0.37
PN: 10585-00020 Rev. C
PowerXpert UG
Operational Testing for the MA24105A
8-7
8-7
Linearity Test
Linearity Test
The linearity correction of the MA24105A is compared to a thermal power sensor, which has very good
inherent linearity over a power range of about –20 dBm to +10 dBm. For this reason, the MA24105A will be
compared to the thermal sensor in two ranges, keeping the power levels to the thermal sensor in the range of
–17 dBm to +5 dBm, while the power to the MA24105A will vary from about –26 dBm to about +14 dBm.
Test Procedure
1. Set up the equipment as follows (refer to Figure 8-4 for an illustration):
a. Connect the reference power sensor to the reference power meter using the appropriate cables.
b. Connect the USB cable between the personal computer with the PowerXpert application installed
and the MA24105A power sensor under test.
c. Launch the PowerXpert application.
d. Turn the power on to all of the instruments and allow them to warm up for the amount of time
specified in the instrument’s respective manuals.
e. Reset or Preset all of the instruments.
f. Configure the reference meter and sensor to measure a CW signal.
g. Perform a sensor Zero and a 1 mW reference calibration on the reference sensor and meter per the
manufacturer’s instructions.
h. Perform a low-level Zero of the MA24105A by disconnecting the sensor from the synthesizer, click
the Zero button in the PowerXpert application, and wait for the Zeroing message to close.
i. Connect the power coupler to the output of the synthesizer and connect the 10 dB K attenuator
using an adapter to the coupler’s coupling output.
j. Connect the low power 30 dB N attenuator to the other coupling output.
k. Connect the reference sensor to the 10 dB K attenuator using an adapter.
l. Connect the MA24105A to the output of the coupler.
m. Set the synthesizer to 350 MHz and a very low power level.
n. Increase averaging by entering “16” in the PowerXpert application, and then click Apply above
settings.
PowerXpert UG
PN: 10585-00020 Rev. C
8-9
8-7
Linearity Test
Operational Testing for the MA24105A
3
4
5
6
2
7
8
MA24105A
10
9
1
11
Index
Description
1
2
3
4
5
6
7
8
9
10
11
Amplifier
Synthesizer
Reference Power Meter
Reference Power Sensor
K to N Adapter
10 dB Attenuator N Type
K to N Adapter
Power Coupler
30 dB N Attenuator
50 ohm Termination
PC with Anritsu PowerXpert Application
Figure 8-4.
Linearity Test Setup 1
2. Apply the Cal factor to the reference sensor per the manufacturer’s procedure.
3. Apply the Cal factor to the MA24105A by entering the frequency (in GHz) in the PowerXpert application,
and then click Apply above settings.
4. Turn Off the synthesizer’s RF output and perform a low-level Zero of both the Reference sensor and the
MA24105A.
5. Turn On the synthesizer’s RF output.
6. Adjust the synthesizer’s power until the MA24105A is reading approximately +45 dBm.
7. Record data for the first 20 dB range as follows:
a. Record the power reading by the reference meter in Table 8-5.
b. Record the power reading by the MA24105A in Table 8-5.
c. Reduce synthesizer power by 5 dB. The Amplifier output and the MA24105A should be about
+40 dBm.
d. Record the reference meter and the MA24105A power sensor readings in Table 8-5.
8-10
PN: 10585-00020 Rev. C
PowerXpert UG
Operational Testing for the MA24105A
8-7
Linearity Test
e. Repeat the measurement for amplifier output levels of +35 dBm, +30 dBm, and +25 dBm.
Note
The MA24105A power measured at +25 dBm will be used in Step 8e, below.
8. Set up the test for the second 20 dB range as follows:
a. Remove the 10 dB K attenuator from in between the reference sensor and coupler, then connect
the reference sensor directly to the coupler’s coupling port.
b. Remove the MA24105A from the coupler and connect the 10 dB N attenuator between the coupler
and the MA24105A power sensor (see Figure 8-5).
c. Turn off the synthesizer RF output and perform a low-level Zero of both the Reference sensor and
the MA24105A.
d. Turn on the synthesizer RF output.
3
4
2
MA24105A
5
8
7
6
1
9
Index Description
1
2
3
4
5
6
7
8
9
Amplifier
Synthesizer
Reference Power Meter
Reference Power Sensor
Power Coupler
30 dB N Attenuator
10 dB N Attenuator
50 ohm Termination
PC with Anritsu PowerXpert Application
Figure 8-5.
Linearity Test Setup 2
e. Set the amplifier output level to approximately 5 dB higher and then adjust the output level until
the MA24105A reads as close as possible to the value obtained in Step 7e.
9. Record data for the next 20 dB range:
a. Read and record the power indicated by the reference meter in Table 8-5.
PowerXpert UG
PN: 10585-00020 Rev. C
8-11
8-7
Linearity Test
Operational Testing for the MA24105A
b. Lower the output power level of the amplifier by 5 dB. The amplifier output should be about
+30 dBm and the MA24105A should be about +20 dBm.
c. Record the reference meter and the MA24105A power sensor readings in Table 8-5.
d. Repeat the measurement for amplifier output levels of +25, +20, and +15 dBm.
Table 8-5.
Measurement Results (350 MHz)
A
Reference
Power
Measurement
(dBm)
B=
(A6 – A5)
C = (A + B)
Corrected
Reference Power
Measurement
(dB)
Row
#
Approx.
Output
Power of the
Amplifier
(dBm)
Attenuation
in Reference
Arm
(dB)
1
45
10
0
2
40
10
0
3
35
10
0
4
30
10
0
5
25
10
0
6
adjust per
Step 8e
0
0
10
7
30
0
0
10
8
25
0
0
10
9
20
0
0
10
10
15
0
0
10
Correction
(dB)
Attenuation
in Test Arm
(dB)
D
E = (C–D)
MA24105A
Measurement
(dBm)
Difference
Calculation
(dB)
11
Max:
12
Min:
13
Delta (E11 – E12):
10. Perform the calculations and operational check as follows:
a. Subtract the Reference Power Measurement of row 5 from the Reference Power Measurement of
row 6. Record this value in the Correction column of rows 1 through 5.
Note
The Correction column of rows 1 through 5 should all have the same value.
The Correction column of rows 6 through 10 have values of 0.
b. Add the Reference Power Measurement and Correction values of row 1 and record the result in the
Corrected Reference Power Measurement column of row 1.
c. Repeat Step 10b for rows 2 through 10.
d. Subtract the MA24105A Measurement of row 1 from the Corrected Reference Power Measurement
of row 1 and record the result in the Difference Calculation column of row 1.
e. Repeat Step 10d for rows 2 through 10.
f. Find the largest (most positive) value in the Difference Calculation column and record this value
next to the word Max in row 11.
g. Find the smallest (least positive or most negative) value in the Difference Calculation column and
record this value next to the word Min in row 12.
h. Subtract the Min value from Step 10g from the Max value from Step 10f and record the result next
to the word Delta in row 13.
i. The Delta result should be less than 0.3 dB. If it is larger, contact Anritsu customer service.
8-12
PN: 10585-00020 Rev. C
PowerXpert UG
Operational Testing for the MA24105A
8-7
Linearity Test
11. Repeat the entire measurement and calculations with synthesizer frequency settings of 2 GHz and
4 GHz.
Table 8-6.
Measurement Results (2 GHz)
A
B
= (A6–A5)
C
= (A+B)
Corrected
Reference Power
Measurement
(dB)
Row
#
Approx.
Output
Power of the
Amplifier
(dBm)
Attenuation
in Reference
Arm
(dB)
1
45
10
0
2
40
10
0
3
35
10
0
4
30
10
0
5
25
10
0
6
adjust per
Step 8e
0
0
10
7
30
0
0
10
8
25
0
0
10
9
20
0
0
10
10
15
0
0
10
Reference
Power
Measurement
(dBm)
Correction
(dB)
Attenuation
in Test Arm
(dB)
D
C–D
MA24105A
Measurement
(dBm)
Difference
Calculation
(dB)
11
Max:
12
Min:
13
Delta (E11 – E12):
Table 8-7.
Measurement Results (4 GHz)
A
B
= (A6–A5)
C
= (A+B)
Corrected
Reference Power
Measurement
(dB)
Row
#
Approx.
Output
Power of the
Amplifier
(dBm)
Attenuation
in Reference
Arm
(dB)
1
45
10
0
2
40
10
0
3
35
10
0
4
30
10
0
5
25
10
0
6
adjust per
Step 8e
0
0
10
7
30
0
0
10
8
25
0
0
10
9
20
0
0
10
10
15
0
0
10
Reference
Power
Measurement
(dBm)
Correction
(dB)
Attenuation
in Test Arm
(dB)
D
E
= (C–D)
MA24105A
Measurement
(dBm)
Difference
Calculation
(dB)
11
Max:
12
Min:
13
Delta (E11 – E12):
PowerXpert UG
PN: 10585-00020 Rev. C
8-13
8-7
8-14
Linearity Test
Operational Testing for the MA24105A
PN: 10585-00020 Rev. C
PowerXpert UG
Chapter 9 — Using the MA24106A
9-1
Sensor Overview
The MA24106A power sensor is illustrated in the figure below:
1
2
Index
3
Description
1
RF Input: N Type Connector (Torque connector at 12 lbf·in (1.35 N·m)
2-color LED (reports functional status of the sensor)
2
Green: Sensor ON, Status OK
Amber: Error or Programming Condition
3
USB Mini-B Port (for connection with a PC or Anritsu handheld instrument)
Figure 9-1.
9-2
MA24106A Sensor Overview
Making Measurements
This section presents common procedures for using the MA24106A power sensor with a PC. These procedures
refer to the MA24106A sensor and Anritsu PowerXpert PC application buttons and menus that were
previously described. Before attempting these procedures, you should be familiar with the Anritsu PowerXpert
PC application. If an Anritsu Master™ series handheld instrument is being used with the power sensor, refer
to the user documentation that came with the handheld instrument for procedures on operating external
power sensors.
Basic Power Measurement
Caution
The supplied USB cable with the screw-in connector should be securely fastened to the sensor to
avoid damage to the mini-USB connector.
To perform a power measurement:
1. Connect the sensor to a computer as shown in Figure 9-2.
2. Open the Anritsu Power Meter application.
PowerXpert UG
PN: 10585-00020 Rev. C
9-1
9-2
Making Measurements
Using the MA24106A
3. Zero the sensor as described below in “Zeroing the Sensor”.
Warning
Do not connect or apply power outside of the MA24106A specifications or permanent damage may
result.
Before connecting the power sensor to another device, ensure the following:
Caution
Both connectors are in good condition and undamaged
Pin depth is verified
Both connectors are clean
Ensure the output of the device you are connecting to does not exceed the signal limits of the
sensor.
ESD precautions are observed.
Refer to Chapter 4, “Power Sensor Care” for complete details.
When connecting the power sensor, ensure the following:
The connectors are aligned before mating
Do not turn the connector body–only the connector coupling nut.
Torque the connection using the correct torque wrench and proper torquing technique.
Do not over torque.
Refer to Chapter 4, “Power Sensor Care” for complete details.
Optional
Attenuator
Figure 9-2.
3
Measurement Setup
4. Connect the power sensor to an RF source.
5. Read the power measurement from the Anritsu PowerXpert application window (power readings are
continuous with the default setting).
Connecting the DUT
RF signal connections are made to the Type N male RF connector, which has a 50 ohm characteristic
impedance.
When connecting to the Type N connector of the MA24106A to a Type N female connector, observe the
following proper practice for tightening the connection:
1. While holding the body of the sensor in one hand, turn the Type N Male connector nut to finger tighten
the connection. Do not turn the body of the MA24106A as this will cause excessive wear to the connector.
2. Back off the connection by turning the connector nut counter clockwise ¼ turn.
3. Tighten the connection (clockwise) using a 12 in-lb torque wrench (Anritsu part number: 01-200).
Note
9-2
The Sensor has a USB 2.0 interface with a USB Type Mini-B port. The MA24106A can be remotely
programmed over this USB interface. In addition to programming, the MA24106A is powered by the
USB. The interface is USB 2.0 compatible, but with an interface speed of 12 Mbps.
PN: 10585-00020 Rev. C
PowerXpert UG
Using the MA24106A
9-2
Making Measurements
Zeroing the Sensor
Zero the sensor before making power measurements, particularly when operating within the lower 20 dB
dynamic range of the power sensor. If frequent low-level measurements are being made, it is advised to check
the sensor zeroing often and repeat as necessary. Before zeroing the sensor, connect it to the DUT (device
under test) test port and remove RF power from the connection to a level 20 dB below the noise floor of the
power sensor. For the MA24106A power sensor, this level is less than –60 dBm. It is preferable to leave the
sensor connected to the DUT test port so that ground noise and thermal EMF (electro-magnetic fields) are
zeroed out of the measurement. The sensor may also be connected to a grounded connector on the DUT or
disconnected from any signal source.
To zero the sensor, click the Zero button on the application. If the sensor fails the zeroing operation, the
message box states “Sensor zero failed” and “ZERO_ERROR” will be displayed on the application screen until
the problem is corrected. If RF is detected, a reminder message will pop up asking to remove the RF source.
Calibrating the Sensor
The signal channel/analog signal acquisition hardware is integrated along with the RF front end of the power
sensor. All of the necessary frequency and temperature corrections take place within the sensor. Therefore,
there is no need for a reference calibration (at 50 MHz and 1 mW) with the MA24106A.
Applying a Calibration Factor Correction
The MA24106A power sensor has an internal EEPROM containing correction and calibration factors that were
programmed into the sensor at the factory. The power sensor has an internal temperature sensor that reports
its readings periodically to the microprocessor. The sensor makes all of the required calculations on the
measurement once the measurement frequency has been entered by the user.
Optimizing the Readings
This section presents information on how to get the fastest readings from the MA24106A power sensor when
using the Anritsu Power Meter application or operating under remote control (refer to Chapter 13 for specific
remote programming command descriptions). Measurement speed depends greatly on the type of
measurement, the power level, and stability of the signal. Stability of a measurement is influenced by noise
and signal modulation. If high resolution is required, averaging must be increased.
Note
The values in the following tables are typical and should be used as a reference only.
PowerXpert UG
PN: 10585-00020 Rev. C
9-3
9-2
Making Measurements
Using the MA24106A
Table 9-1 describes the number of averages needed to attain a certain noise level for a particular power level
measurement with the Low Aperture Time mode setting.
Table 9-1.
MA24106A Averaging Table (Low Aperture Time, Default Mode)
Input Power
(dBm)
Input Power
(mW)
Number of
Averages
Needed for
< 0.20 dB
Noise
20
100
1
1
1
1
1
15
31.6
1
1
1
1
1
10
10.0
1
1
1
1
1
5
3.16
1
1
1
1
2
0
1.00
1
1
1
4
16
-5
0.316
1
1
1
20
78
-10
0.100
1
1
1
1
1
-15
0.0316
1
1
1
1
1
-20
0.0100
1
1
1
1
7
-25
0.00316
1
1
1
3
61
-30
0.00100
2
3
7
25
–
-35
0.000316
16
28
62
245
–
-40
0.000100
158
–
–
–
–
Number of
Averages
Needed for
< 0.15 dB
Noise
Number of
Averages
Needed for
< 0.10 dB
Noise
Number of
Averages
Needed for
< 0.05 dB
Noise
Number of
Averages
Needed for
< 0.01 dB
Noise
Table 9-2, describes the number of averages needed to attain a certain noise level for a particular power level
measurement with the High Aperture Time mode setting.
Table 9-2.
MA24106A Averaging Table (High Aperture Time)
Input Power
(dBm)
Input Power
(mW)
Number of
Averages
Needed for
< 0.20 dB
Noise
20
100
1
1
1
1
1
15
31.6
1
1
1
1
1
10
10.0
1
1
1
1
1
5
3.16
1
1
1
1
1
0
1.00
1
1
1
1
1
-5
0.316
1
1
1
2
5
-10
0.100
1
1
1
1
1
-15
0.0316
1
1
1
1
1
-20
0.0100
1
1
1
1
1
-25
0.00316
1
1
1
1
4
-30
0.00100
1
1
1
2
38
-35
0.000316
1
2
4
16
–
-40
0.000100
10
18
39
153
–
9-4
Number of
Averages
Needed for
< 0.15 dB
Noise
Number of
Averages
Needed for
< 0.10 dB
Noise
Number of
Averages
Needed for
< 0.05 dB
Noise
Number of
Averages
Needed for
< 0.01 dB
Noise
PN: 10585-00020 Rev. C
PowerXpert UG
Using the MA24106A
9-3
9-3
Measurement Considerations
Measurement Considerations
Time Varying Signals
Case 1: Modulated signals with pulse or pattern repetition times 1 ms (PRF 1 KHz)
If you obtain a steady power reading of a modulated signal (no significant fluctuations of the displayed power)
with no averaging, then it is likely that the pulse or pattern repetition rate is greater than 1 KHz. In this case,
most of the averaging of the envelope power is performed in the front end of the sensor (before being digitized).
When this is the case, the MA24106A will provide an accurate indication of the average power with no special
considerations.
Case 2: Modulated signals with pulse or pattern repetition times between 1 ms and 50 ms
(100 Hz < PRF < 1 KHz)
In this case, the signal is varying too slowly to be averaged in the front end of the sensor, so averaging must be
performed after digitalization by increasing the averaging number in the power meter application (or
calculating the average of several measurements if controlling the sensor over the bus). A large amount of
averaging must be used for some pulse/pattern repetition frequencies to get a steady reading. If Low Aperture
Time (LAT) mode is selected, the maximum recommended pulse repetition time is about 10 ms. If High
Aperture Time (HAT) mode is selected, signals with pulse repetition periods as long as 50 ms can usually be
measured.
Case 3: Modulated signals with pulse or pattern repetition times greater than 50 ms
In this case, it can be difficult to get an accurate average power reading even by averaging many readings. The
sample rate of the sensor and the pulse repetition rate of the signal may be close enough that they can “beat”
together resulting in low frequency modulation of the power indication. If averages are not calculated over
many of these beats, or an integer number of beats, errors can result. This is not unique to the MA24106A and
can be an issue with any power sensor/meter and any sampled data system.
High Crest Factor Signals (peak to average ratio)
High crest factor signals such as CDMA/WCDMA may have crest factors as high as 10 dB. To ensure the most
accurate power measurement, the statistically low-probability peak signals should not exceed +30 dBm.
PowerXpert UG
PN: 10585-00020 Rev. C
9-5
9-3
Measurement Considerations
Using the MA24106A
For example, if a signal has an expected crest factor of 10 dB, then the highest average power measured should
not exceed +20 dBm. A sensor’s linearity graph of a WCDMA (TestModel_5_8HSPDSCH) signal with 10 dB
crest factor is shown below:
2GHz WCDM A Linearity
TestModel_5_8HSPDSCH
0.7
0.6
0.5
0.4
Variance (dB)
0.3
0.2
0.1
0.0
-40
-30
-20
-10
-0.1 0
10
20
-0.2
-0.3
-0.4
-0.5
-0.6
-0.7
Input Power (dBm)
Figure 9-3.
Sensor Linearity Graph
Multitone Signals
The MA24106A is a True-RMS sensor that can measure very wide bandwidth modulation without much
restriction. The only limitation is the frequency flatness of the sensor. Because the sensor’s sensitivity is not
identical for all frequencies and when measuring multitone signals, the frequency entered into the sensor’s
application should be the average frequency of all significant tones. The MA24106A has an error of 0.01 dB for
every 100 MHz bandwidth at frequencies below 3 GHz, and an error of 0.03 dB for every 100 MHz bandwidth
at frequencies above 3 GHz.
For example, a dual tone signal of 2.0 GHz and 2.2 GHz may have an additional measurement error of 0.02 dB
(0.01 dB 2) when the application frequency is set to 2.1 GHz.
Noise and Averaging
When there is a need to achieve a required reading resolution, particularly at low power levels, averaging is
often needed to reduce noise and steady the displayed power reading. Use the noise vs. resolution tables
(Table 9-1 and Table 9-2 on page 9-4) to determine the number of averages that will typically be required for a
given resolution. Alternatively, determine the number of averages through calculation by using the noise
specifications and the fact that noise will be proportional to the square root of N, where N is the number of
averages.
For example, a CW tone at –30 dBm is to be measured to 0.01 dB resolution. Using the table in the sensor
manual, the required number of averages is 38 averages using High Aperture Time mode (the same
measurement would require more than 256 averages in Low Aperture Time mode).
9-6
PN: 10585-00020 Rev. C
PowerXpert UG
Using the MA24106A
9-4
Uncertainty of a Measurement
Settling Time
The MA24106A samples power continuously every 70 ms in the Low Aperture Time (LAT) mode and 700 ms in
the High Aperture Time (HAT) mode. The sensor’s front end and digitizer settles completely to a step change in
power in this amount of time. However, there is no way to synchronize the sensor’s sampling to any other
event, such as a power step or bus request for a measurement. Therefore, the first measurement requested
from the sensor after a power step may not be fully settled. To ensure a fully settled measurement when
operating the sensor over the bus, wait 70 ms (700 ms if in HAT) after a power step before requesting the
measurement from the sensor. Alternatively, request two measurements from the sensor and discard the first.
If averaging is required as described above, settling time increases by N × sample period, where N is the
number of averages and the sample period is the time is milliseconds. The measurement sample period is
70 ms for LAT and 700 ms for HAT. When operating the sensor over the bus, request N+1 measurements from
the sensor, discard the first, and then average the subsequent readings. The settling time is approximately
(N+1) × sample period.
9-4
Uncertainty of a Measurement
Measurement Uncertainty Calculator
Included on the Power Expert CD-Rom is a Microsoft Excel tool for calculating power uncertainty. It is
accessible from the Startup.htm page. It contains two tabs; one that provides measurement uncertainty for
each sensor (selectable from a drop-down menu), and another tab that provides additional uncertainty
components and calculated values for the MA24105A Peak Power Sensor.
Uncertainty Components
Power measurements have many component parts that affect overall measurement uncertainty when
measuring power with the MA24106A sensor:
• Sensor Linearity and Temperature Compensation: Sensor Linearity and Temperature
Compensation describe the relative power level response over the dynamic range of the sensor.
Temperature Compensation should be considered when operating the sensor at other than room
temperature.
• Noise, Zero Set, and Zero Drift: These are factors within the sensor that impact measurement
accuracy at the bottom of the power sensor’s dynamic range.
• Mismatch Uncertainty: Mismatch uncertainty is typically the largest component of measurement
uncertainty. The error is caused by differing impedances between the power sensor and the device to
which the power sensor is connected. Mismatch uncertainty can be calculated as follows:
% Mismatch Uncertainty = 1001 + 122 – 1
dB Mismatch Uncertainty = 10log1 + 12
where
1 and 2 are the reflection coefficients of the power sensor and the device under test
• Sensor Calibration Factor Uncertainty: Sensor Calibration Factor Uncertainty is defined as the
accuracy of the sensor calibrated at a standard calibration condition. Anritsu follows the industry
standard condition of calibration at a reference power of 0 dBm (1 mW) and an ambient temperature of
25 °C.
PowerXpert UG
PN: 10585-00020 Rev. C
9-7
9-4
Uncertainty of a Measurement
Using the MA24106A
Uncertainty Example
Two measurement uncertainty calculations for Low Aperture Time mode are shown for the MA24106A in
Table 9-3. The MA24106A is used to measure the power of a 3 GHz, +12.0 dBm and –35 dBm CW signal from a
signal source with 1.5:1 VSWR. The example is based on 128 measurement averages.
Table 9-3.
Measurement Uncertainty Example
Uncertainty
Uncertainty
Specification Specification
at –35 dBm
at +12 dBm
(%)
(%)
Uncertainty
Term
Probability
Distribution
Divisor
Adjusted
Uncertainty
at +12 dBm
(%)
Adjusted
Uncertainty
at –35 dBm
(%)
Sensor Linearity
(<+18 dBm)
3.0
3.0
Rectangular
1.8
1.8
Noise
0.0
0.8
Normal at 2
2
0.0
0.4
Zero Set
0.0
3.2
Rectangular
0.0
1.8
Zero Drift
0.0
0.9
Normal at 2
2
0.0
0.6
Calibration Factor
Uncertainty
1.4
1.4
Normal at 2
2
0.7
0.7
Mismatch
Uncertainty
4.0
4.0
Rectangular
2.3
2.3
Combined
Uncertainty
(RSS), Room
Temperature
3.0
3.6
Expanded
Uncertainty with
K=2, Room
Temperature
6.0
7.2
0.8
0.8
Combined
Uncertainty
(RSS, 0 to 50 °C)
3.1
3.7
Expanded
Uncertainty
with K=2
(RSS, 0 to 50 °C)
6.2
7.4
Temperature
Compensation
Table 9-4.
1.4
1.4
Rectangular
Noise Measurement Uncertainty Calculations
Noise Calculations at 12 dBm (16 mW):
Noise 400 nW/16 mW = 0.0 %
Zero Set 1700 nW/16 mW = 0.0 %
Zero Drift 500 nW/16 mW = 0.0 %
Noise Calculations at –35 dBm (316 nW):
Noise 2.5 nW/316 nW = 0.8 %
Zero Set 10 nW/316 nW = 3.2 %
Zero Drift 3 nW/316 nW = 0.9 %
9-8
PN: 10585-00020 Rev. C
PowerXpert UG
Using the MA24106A
9-5
9-5
Error States
Error States
This section details some of the error messages that may appear on the application screen. In most cases, the
error condition can be easily corrected. The status LED will light yellow when an error state occurs. If not, note
the error message and contact an Anritsu Service Center.
Table 9-5.
Error Messages
Message
Description
Resolution
Zero invalid as temperature
changed by more than
10 Degrees C
The sensor’s ambient temperature has changed
by more than 10 ºC since the last zero
operation.
Perform the zero operation again.
Temperature out of
operating range
Operating range of the sensor is 0 ºC to 55 ºC.
Re-examine the ambient
conditions.
Sensor zero failed
This message box appears if the zero operation Turn off the RF input to the sensor
is unsuccessful. The reason could be the
or disconnect the sensor from the
presence of RF power at the input of the sensor. RF source and try the zero
operation again.
ZERO_ERROR
This message appears on the application
screen if the zero operation is unsuccessful. The
reason could be the presence of RF power at
the input of the sensor.
Turn off the RF input to the sensor
or disconnect the sensor from the
RF source and try the zero
operation again.
ADC_TEMP_OVERRNGE
This message appears on the application
screen if the sensor is being operated in
extremely high temperatures and has
overheated.
Remove the sensor from the USB
connection and allow to cool to
the operating range of the sensor:
0 ºC to 55 ºC
PowerXpert UG
PN: 10585-00020 Rev. C
9-9
9-5
9-10
Error States
Using the MA24106A
PN: 10585-00020 Rev. C
PowerXpert UG
Chapter 10 — Operational Testing for the
MA24106A
10-1
Introduction
The test methodology and equipment described here can be used to gain some confidence in the measurement
accuracy of the MA24106A Power Sensor. This is accomplished by comparing the sensor to another sensor with
a specified cal factor and linearity performance or uncertainty. General commercially available equipment is
used for these tests; however, these procedures are not sufficiently accurate to verify sensors to factory
specification. Therefore, sensor test limits in these procedures are set appropriately to the specified comparison
equipment. All tests should be performed at an ambient temperature of 20 ºC to 25 ºC.
Calibration and verification of high accuracy power sensors requires substantial investment in both
skill and equipment. For calibration, calibration verification, and to maintain the factory specifications
of your power sensor, please send sensors to qualified Anritsu Customer Service Centers.
Note
Refer to the following sections for required equipment and test procedures:
• “Required Equipment - MA24106A”
• “VSWR Pretest”
• “Frequency Response Test”
• “Linearity Test”
10-2
Precautions
Warning
Do not connect or apply power outside of the power sensor specifications or permanent damage
may result.
Before connecting the power sensor to another device, ensure the following:
Both connectors are in good condition and undamaged
Pin depth is verified
Both connectors are clean
Ensure the output of the device you are connecting to does not exceed the signal limits of the
sensor.
ESD precautions are observed.
Refer to Chapter 4, “Power Sensor Care” for complete details.
Caution
When connecting the power sensor, ensure the following:
The connectors are aligned before mating
Do not turn the connector body–only the connector coupling nut.
Torque the connection using the correct torque wrench and proper torquing technique.
Do not over torque.
Refer to Chapter 4, “Power Sensor Care” for complete details.
PowerXpert UG
PN: 10585-00020 Rev. C
10-1
10-3
Required Equipment - MA24106A
10-3
Operational Testing for the MA24106A
Required Equipment - MA24106A
Table 10-1. Required Equipment
Equipment Description
Manufacturer and
Model
Critical Specifications
Vector Network Analyzer (Pretest)
Anritsu MS4642A
or equivalent
Synthesizer
(Cal. Factor and Linearity Tests)
Anritsu MG3692
or equivalent
Reference Power Meter
(Cal. Factor and Linearity Tests)
Reference Power Sensor
(Cal. Factor and Linearity Tests)
10 dB K Attenuator
(Linearity Test)
6 dB K Attenuator
(Cal. Factor Test)
Adapter N(f) to K(f)
(Cal. Factor and Linearity Tests)
Power Splitter
(Linearity Tests)
Personal Computer
Anritsu ML2438
or equivalent
Anritsu MA24002A
or equivalent
Anritsu 41KC-10
VSWR 1.15, 10 MHz to 6 GHz
Anritsu 41KC-6
VSWR 1.15, 10 MHz to 6 GHz
Anritsu 34ANF50 and
34AS50
Anritsu K241B
VSWR 1.05, 10 MHz to 6 GHz
Any
See Chapter 2
10-2
Reflection Coefficient
Uncertainty 0.013, 10 MHz to 2 GHz
Uncertainty 0.020, 2 GHz to 6 GHz
Output Power: >+18 dBm, 50 MHz to 6 GHz
Output Power Setting Resolution: 0.01 dBm
Harmonics: –40 dBc
Source VSWR 2.00
Instrumentation Accuracy 0.5 %
NIST Calibration or equivalent
Effective Output VSWR < 1.45, 10 MHz to 6 GHz
PN: 10585-00020 Rev. C
PowerXpert UG
Operational Testing for the MA24106A
10-4
10-4
VSWR Pretest
VSWR Pretest
The most common cause of power sensor failure is excess input power. Applying power exceeding the damage
level shown on the label will damage the sensor’s sensing element resulting in impedance change. Input match
will be degraded when element impedance is changed. If you suspect that a senor is damaged, you should start
with an input match pretest.
The maximum VSWR values are listed in the Performance Specification section of this manual. The
uncertainty of the VSWR test equipment will affect actual measurement values. See Table 10-2 below for an
example of how measurement system uncertainty can affect the Expected Maximum Reflection Coefficient
when using the Anritsu MS4642A Vector Network Analyzer.
Test Procedure
Follow the manufacturers S11 (or return loss) calibration procedure to perform calibration on a network
analyzer. Connect the power sensor to the network analyzer test port and measure power sensor input match.
Typically, matches are measured in terms of return loss in dB. Return loss and magnitude of the reflection
coefficient conversion equations are as follows:
= 10–RL/20
RL = –20log
where
RL = Return Loss in dB
= Magnitude of the Reflection Coefficient
VSWR and magnitude of the reflection coefficient conversion equations are as follows:
VSWR = (1 + ) / (1 – )
= (VSWR – 1) / (VSWR + 1)
where
VSWR = Voltage Standing Wave Ratio
= Magnitude of the Reflection Coefficient
Record the measured data into Table 10-2 under the Actual Measurement column. The Actual Measurement
should be smaller than the Maximum Reflection coefficient. The Maximum Reflection Coefficient is equal to
the measurement system uncertainty added to the sensor’s reflection coefficient specification. If the Actual
Measurement reflection coefficient is larger than the Maximum Reflection Coefficient, then the power sensor
may be defective. If the actual reflection coefficient is significantly larger than the maximum values in
Table 10-2, then the sensor is damaged and it is not necessary to perform further testing.
Note
There are no user-serviceable parts inside the power sensors. Contact your local Anritsu Service
Center and return defective sensors with a detailed description of the observed problem.
Table 10-2. Pretest Measurement Result
Frequency
MS4642A Reflection
Coefficient Uncertainty
Maximum Reflection
Coefficient
50 MHz to 2 GHz
0.013
0.050 + 0.013 = 0.063
2 GHz to 6 GHz
0.020
0.100 + 0.020 = 0.120
PowerXpert UG
PN: 10585-00020 Rev. C
Actual Measurement
10-3
10-5
Frequency Response Test
10-5
Operational Testing for the MA24106A
Frequency Response Test
In this test the frequency response of the sensor is tested at one low power level against a reference sensor of
known measurement uncertainty. The reference sensor should be calibrated by a reputable standards
laboratory using instruments with low published measurement uncertainty values. To perform the
comparison, both sensors are used to measure the output power of a synthesizer with a high quality
attenuator, such as the 41KC-6, on the output. The attenuator improves the source match of the synthesizer by
lowering the mismatch ripples, thereby lowering the uncertainty in the comparison.
Test Procedure
1. Set up the equipment as follows (refer to Figure 10-1 for an illustration):
a. Connect the reference power sensor to the reference power meter using the appropriate cables.
b. Connect the MA24106A USB cable between the personal computer with the PowerXpert
application installed and the MA24106A power sensor under test.
c. Launch the PowerXpert application.
d. Turn the power on to all of the instruments and allow them to warm up for the amount of time
specified in their respective manuals.
e. Reset or Preset all of the instruments.
f. Configure the reference meter and sensor to measure a CW signal.
g. Perform a sensor Zero and a 1 mW reference calibration on the reference sensor and meter per the
manufacturer’s instructions.
h. Perform a low level Zero of the MA24106A by disconnecting the MA24106A from the synthesizer,
clicking the Zero button on the PowerXpert application, and waiting for the Zeroing message to
close.
i. Connect the attenuator to the output of the synthesizer, then connect the appropriate adapter to
the output of the attenuator.
j. Set the synthesizer to +6 dBm and 50 MHz.
MA24106A
2
3
3
6
4
1
5
7
Index
1
2
3
4
Description
Synthesizer
Reference Power Meter
Reference Power Sensor
K to N Adapter
Figure 10-1. Cal Factor Test Set Up (1 of 2)
10-4
PN: 10585-00020 Rev. C
PowerXpert UG
Operational Testing for the MA24106A
5
6
7
10-5
Frequency Response Test
Attenuator
MA24106A Power Sensor
PC with Anritsu PowerXpert Application
Figure 10-1. Cal Factor Test Set Up (2 of 2)
2. Connect the reference sensor to the synthesizer with the appropriate adapter and attenuator in-line (see
Figure 10-1).
3. Apply the Cal factor to the reference sensor per the manufacturer’s instruction.
4. Record the power indicated by the reference meter in Table 10-3.
5. Disconnect the reference sensor from the synthesizer output and connect the MA24106A power sensor
with the appropriate adapter and attenuator in-line (see Figure 10-1).
6. Apply the Cal factor to the MA24106A by entering the frequency (in GHz) in the PowerXpert application,
and then click Apply above settings.
7. Record the power indicated by the MA24106A in Table 10-3.
8. Set the synthesizer frequency to the next frequency in Table 10-3.
9. Repeat Step 2 through Step 8 until all of the frequencies in Table 10-3 have been measured.
10. For each row in Table 10-3, calculate the absolute value of the difference between the recorded Reference
power measurement and the recorded MA24106A measurement, and record the result in Table 10-3.
11. For each frequency, compare the power difference to the maximum allowed difference specified in
Table 10-3. If the difference is higher than the maximum allowed difference, contact Anritsu customer
service.
Table 10-3. Test Measurement Results
Frequency
(GHz)
A
B
Reference Power
Measurement
(dBm)
MA24106A
Measurement
(dBm)
A-B
Absolute Value of
Difference in Power
Measurements
(dB)
Maximum Allowed
Difference
(dB)
0.05
0.26
0.1
0.26
0.3
0.26
0.5
0.26
1.0
0.26
2.0
0.31
3.0
0.31
4.0
0.31
5.0
0.33
6.0
0.33
PowerXpert UG
PN: 10585-00020 Rev. C
10-5
10-6
10-6
Linearity Test
Operational Testing for the MA24106A
Linearity Test
The linearity correction of the MA24106A is compared to a thermal power sensor, which has very good
inherent linearity over a power range of about –20 to +10 dBm. For this reason, the MA24106A will be
compared to the thermal sensor in two ranges, keeping the power levels to the thermal sensor in the range of
–17 dBm to +5 dBm, while the power to the MA24106A will vary from about –26 dBm to about +14 dBm.
Test Procedure
1. Set up the equipment as follows (refer to Figure 10-2 for an illustration):
a. Connect the reference power sensor to the reference power meter using the appropriate cables.
b. Connect the USB cable between the personal computer with the PowerXpert application installed
and the MA24106A power sensor under test.
c. Launch the PowerXpert application.
d. Turn the power on to all of the instruments and allow them to warm up for the amount of time
specified in the instrument’s respective manuals.
e. Reset or Preset all of the instruments.
f. Configure the reference meter and sensor to measure a CW signal.
g. Perform a sensor Zero and a 1 mW reference calibration on the reference sensor and meter per the
manufacturer’s instructions.
h. Perform a low-level Zero of the MA24106A by disconnecting the sensor from the synthesizer, click
the Zero button in the PowerXpert application, and wait for the Zeroing message to close.
i. Connect the power splitter to the output of the synthesizer and connect the 10 dB attenuator to
one of the splitter outputs.
j. Connect an N(f) to K adapter to each power sensor.
k. Connect the reference sensor and adapter to the 10 dB attenuator.
l. Connect the MA24106A and adapter to the other splitter output.
m. Set the synthesizer to 50 MHz and +20 dBm.
n. Increase averaging by entering “16” in the PowerXpert application, and then click Apply above
settings.
10-6
PN: 10585-00020 Rev. C
PowerXpert UG
Operational Testing for the MA24106A
10-6
Linearity Test
2
3
4
1
5
6
7
Index
1
2
3
4
5
6
7
8
9
3
MA24106A
8
9
Description
Synthesizer
Reference Power Meter
Reference Power Sensor
K to N Adapter (if required)
Attenuator
Power Splitter
K to N Adapter (if required)
MA24106A Power Sensor
PC with Anritsu PowerXpert Application
Figure 10-2. Linearity Test Setup 1
2. Apply the Cal factor to the reference sensor per the manufacturer’s procedure.
3. Apply the Cal factor to the MA24106A by entering the frequency (in GHz) in the PowerXpert application,
and then click Apply above settings.
4. Turn Off the synthesizer’s RF output and perform a low-level Zero of both the Reference sensor and the
MA24106A.
5. Turn On the synthesizer’s RF output.
6. Record data for the first 20 dB range as follows:
a. Record the power reading by the reference meter in Table 10-4 on page 10-9.
b. Record the power reading by the MA24106A in Table 10-4.
c. Set the synthesizer power to +15 dBm.
d. Record the reference meter and the MA24106A power sensor readings in Table 10-4.
e. Repeat the measurement for synthesizer output levels of +10, +5, and 0 dBm.
Note
The MA24106A power measured at 0 dBm will be used in Step 7e, below.
PowerXpert UG
PN: 10585-00020 Rev. C
10-7
10-6
Linearity Test
Operational Testing for the MA24106A
7. Set up the test for the second 20 dB range as follows:
a. Remove the 10 dB attenuator from in between the reference sensor and splitter and connect the
reference sensor directly to the splitter.
b. Remove the MA24106A from the splitter and connect the 10 dB attenuator between the splitter
and the MA24106A power sensor (see Figure 10-3).
c. Turn Off the synthesizer’s RF output and perform a low-level Zero of both the Reference sensor
and the MA24106A.
d. Turn On the synthesizer’s RF output.
2
3
4
1
5
6
7
9
Index
1
2
3
4
5
6
7
8
9
3
MA24106A
8
Description
Synthesizer
Reference Power Meter
Reference Power Sensor
K to N Adapter (if required)
Power Splitter
Attenuator
K to N Adapter (if required)
MA24106A Power Sensor
PC with Anritsu PowerXpert Application
Figure 10-3. Linearity Test Setup 2
e. Set the synthesizer output level to +10 dBm and then adjust it until the sensor/meter under test
reads as close as possible to the value obtained above in Step 6e.
8. Record data for the next 20 dB range
a. Read and record the power indicated by the reference meter in Table 10-4.
b. Lower the output power level of the synthesizer to +5 dBm.
10-8
PN: 10585-00020 Rev. C
PowerXpert UG
Operational Testing for the MA24106A
10-6
Linearity Test
c. Record the reference meter and the MA24106A power sensor readings in Table 10-4.
d. Repeat the measurement for synthesizer output levels of 0, –5, and –10 dBm.
Table 10-4. Measurement Results (50 MHz)
A
Reference
Power
Measurement
(dBm)
B
= (A6–A5)
C
= (A+B)
Corrected
Reference Power
Measurement
(dB)
Row
#
Synthesizer
Power Level
Setting
(dBm)
Attenuation
in Reference
Arm
(dB)
1
+20
10
0
2
+15
10
0
3
+10
10
0
4
+5
10
0
5
0
10
0
6
adjust per
Step 7e
0
0
10
7
+5
0
0
10
8
0
0
0
10
9
-5
0
0
10
10
-10
0
0
10
Correction
(dB)
Attenuation
in Test Arm
(dB)
D
E
= (C–D)
MA24106A
Measurement
(dBm)
Difference
Calculation
(dB)
11
Max:
12
Min:
13
Delta (E11 – E12):
9. Perform the calculations and operation check as follows:
a. Subtract the Reference Power Measurement of row 5 from the Reference Power Measurement of
row 6. Record this value in the Correction column of rows 1 through 5.
Note
The Correction column of rows 1 through 5 should all have the same value.
The Correction column of rows 6 through 10 have values of 0.
b. Add the Reference Power Measurement and Correction values of row 1 and record the result in the
Corrected Reference Power Measurement column of row 1.
c. Repeat Step 9b for rows 2 through 10.
d. Subtract the MA24106A Measurement of row 1 from the Corrected Reference Power Measurement
of row 1 and record the result in the Difference Calculation column of row 1.
e. Repeat Step 9d for rows 2 through 10.
f. Find the largest (most positive) value in the Difference Calculation column and record this value
next to the word Max in row 11.
g. Find the smallest (least positive or most negative) value in the Difference Calculation column and
record this value next to the word Min in row 12.
h. Subtract the Min value from Step 9g from the Max value from Step 9f and record the result next to
the word Delta in row 13.
i. The Delta result should be less than 0.3 dB. If it is larger, contact Anritsu customer service.
10. Repeat the entire measurement and calculations with synthesizer frequency settings of 2 GHz, 4 GHz,
and 6 GHz.
PowerXpert UG
PN: 10585-00020 Rev. C
10-9
10-6
Linearity Test
Operational Testing for the MA24106A
Table 10-5. Measurement Results (2 GHz)
A
Reference
Power
Measurement
(dBm)
B
= (A6–A5)
C
= (A+B)
Corrected
Reference Power
Measurement
(dB)
Row
#
Synthesizer
Power Level
Setting
(dBm)
Attenuation
in Reference
Arm
(dB)
1
+20
10
0
2
+15
10
0
3
+10
10
0
4
+5
10
0
5
0
10
0
6
adjust per
Step 7e
0
0
10
7
+5
0
0
10
8
0
0
0
10
9
–5
0
0
10
10
–10
0
0
10
Correction
(dB)
Attenuation
in Test Arm
(dB)
D
C–D
MA24106A
Measurement
(dBm)
Difference
Calculation
(dB)
11
Max:
12
Min:
13
Delta (E11 – E12):
Table 10-6. Measurement Results (4 GHz)
A
Reference
Power
Measurement
(dBm)
B
= (A6–A5)
C
= (A+B)
Corrected
Reference Power
Measurement
(dB)
Row
#
Synthesizer
Power Level
Setting
(dBm)
Attenuation
in Reference
Arm
(dB)
1
+20
10
0
2
+15
10
0
3
+10
10
0
4
+5
10
0
5
0
10
0
6
adjust per
Step 7e
0
0
10
7
+5
0
0
10
8
0
0
0
10
9
–5
0
0
10
10
–10
0
0
10
Correction
(dB)
Attenuation
in Test Arm
(dB)
D
E
= (C–D)
MA24106A
Measurement
(dBm)
Difference
Calculation
(dB)
11
Max:
12
Min:
13
Delta (E11 – E12):
10-10
PN: 10585-00020 Rev. C
PowerXpert UG
Operational Testing for the MA24106A
10-6
Linearity Test
Table 10-7. Measurement Results (6 GHz)
A
Reference
Power
Measurement
(dBm)
B
= (A6–A5)
C
= (A+B)
Corrected
Reference Power
Measurement
(dB)
Row
#
Synthesizer
Power Level
Setting
(dBm)
Attenuation
in Reference
Arm
(dB)
1
+20
10
0
2
+15
10
0
3
+10
10
0
4
+5
10
0
5
0
10
0
6
adjust per
Step 7e
0
0
10
7
+5
0
0
10
8
0
0
0
10
9
–5
0
0
10
10
–10
0
0
10
Correction
(dB)
Attenuation
in Test Arm
(dB)
D
E
= (C–D)
MA24106A
Measurement
(dBm)
Difference
Calculation
(dB)
11
Max:
12
Min:
13
Delta (E11 – E12):
PowerXpert UG
PN: 10585-00020 Rev. C
10-11
10-6
10-12
Linearity Test
Operational Testing for the MA24106A
PN: 10585-00020 Rev. C
PowerXpert UG
Chapter 11 — Using the MA24108A,
MA24118A, and MA24126A
11-1
Sensor Overview
The MA24108A, MA24118A, and MA24126A power sensor is illustrated in the figure below:
1
2
Index
3
4
Description
RF Input: N Type Connector (Torque connector at 12 lbf·in (1.35 N·m)
RF Input (MA24126A): K Type Connector (Torque connector at 8 lbf·in (0.90 N·m)
2-color LED (reports functional status of the sensor)
1
2
Green: Sensor ON, Status OK
Amber: Error or Programming Condition
3
USB Micro-B Port (for connection with a PC or Anritsu handheld instrument)
4
External Trigger Input (TTL/CMOS)
Figure 11-1. MA24108A, MA24118A, and MA24126A Sensor Overview
11-2
Making Measurements
This section presents common procedures for using the MA24108A, MA24118A, and MA24126A power sensors
with a PC. These procedures refer to the power sensor and to the Anritsu PowerXpert PC application buttons
and menus that were previously described. Before attempting these procedures, you should be familiar with
the Anritsu PowerXpert PC application. If an Anritsu Master™ series handheld instrument is being used with
the power sensor, refer to the user documentation that came with the handheld instrument for procedures on
operating external power sensors.
Basic Power Measurement
1. Connect the sensor to a computer or Anritsu Master™ series instrument as shown in Figure 11-2.
2. Open the Anritsu PowerXpert application.
3. Zero the sensor as described below in “Zeroing the Sensor”.
Warning
Do not connect or apply power outside of the power sensor specifications or permanent damage
may result.
PowerXpert UG
PN: 10585-00020 Rev. C
11-1
11-2
Making Measurements
Using the MA24108A, MA24118A, and MA24126A
Before connecting the power sensor to another device, ensure the following:
Caution
Both connectors are in good condition and undamaged
Pin depth is verified
Both connectors are clean
Ensure the output of the device you are connecting to does not exceed the signal limits of the
sensor.
ESD precautions are observed.
Refer to Chapter 4, “Power Sensor Care” for complete details.
When connecting the power sensor, ensure the following:
The connectors are aligned before mating
Do not turn the connector body–only the connector coupling nut.
Torque the connection using the correct torque wrench and proper torquing technique.
Do not over torque.
Refer to Chapter 4, “Power Sensor Care” for complete details.
Optional
Attenuator
3
Figure 11-2. Measurement Setup
4. Connect the RF source to the RF IN port of the power sensor. An attenuator is necessary for measuring
power levels above +20 dBm.
5. Read the power measurement from the Anritsu PowerXpert application window (power readings are
continuous with the default setting).
Connecting the DUT
RF signal connections are made to the male RF connector, which has a 50 ohm characteristic impedance. When
connecting to the male connector of the sensor, observe the following practice for tightening the connection:
1. While holding the body of the sensor in one hand, turn the male connector nut to finger tighten the
connection. Do not turn the body of the sensor as this will cause excessive wear to the connector.
2. Back off the connection by turning the connector nut counter clockwise 1/4 turn.
3. Tighten the connection (clockwise) using a 12 in-lb torque wrench (Anritsu part number: 01-200).
Zeroing the Sensor
Zero the sensor before making power measurements. If frequent low-level measurements are being made, it is
advised to check the sensor zeroing often and repeat as necessary. If the sensor goes into sleep mode, the
sensor must be re-zeroed before taking measurements. Before zeroing the sensor, connect it to the DUT (device
under test) test port and remove RF power from the connection to a level 20 dB below the noise floor of the
power sensor. For the power sensors, this level is less than –60 dBm. It is preferable to leave the sensor
connected to the DUT test port so that ground noise and thermal EMF (electro-magnetic fields) are zeroed out
of the measurement. The sensor may also be connected to a grounded connector on the DUT or disconnected
from any signal source.
11-2
PN: 10585-00020 Rev. C
PowerXpert UG
Using the MA24108A, MA24118A, and MA24126A
11-2
Making Measurements
To zero the sensor, click the Zero button on the application. If the sensor fails the zeroing operation, the
messages “Range 1 zeroing error” and/or “Range 2 zeroing error” is displayed on the application screen until the
problem is corrected.
Calibrating the Sensor
The signal channel/analog signal acquisition hardware is integrated along with the RF front end of the power
sensor. All calibration factors, as well as linearity and temperature corrections, are stored in the sensor.
Therefore, there is no need for a reference calibration with the sensor.
Applying a Calibration Factor Correction
The power sensor has an internal EEPROM containing correction and calibration factors that were
programmed into the sensor at the factory. The power sensor has an internal temperature sensor that reports
its readings periodically to the microprocessor. The sensor makes all of the required calculations on the
measurement once the measurement frequency has been entered in the General Settings area.
Optimizing the Readings
This section presents information on how to get the fastest readings from the power sensor when using the
Anritsu PowerXpert application or operating under remote control (refer to Chapter 13, “Remote Operation”
for specific remote programming command descriptions). Measurement speed depends greatly on the type of
measurement, the power level, and stability of the signal. Stability of a measurement is influenced by noise
and signal modulation. If high resolution is required, averaging must be increased.
Table 11-1 on page 11-4 describes the number of averages needed to attain a certain noise level for a particular
power level measurement.
PowerXpert UG
PN: 10585-00020 Rev. C
11-3
11-2
Making Measurements
Note
Using the MA24108A, MA24118A, and MA24126A
The values in the following table are typical and should be used as a reference only.
Table 11-1. Sensor Averaging Table (Continuous Mode, default settings, 20 ms aperture time)
Input Power
(dBm)
Input Power
(mW)
Number of
Averages
Needed for
< 0.20 dB
Noise
Number of
Averages
Needed for
< 0.15 dB
Noise
Number of
Averages
Needed for
< 0.10 dB
Noise
Number of
Averages
Needed for
< 0.05 dB
Noise
Number of
Averages
Needed for
< 0.01 dB
Noise
20
100.0000000
1
1
1
1
1
15
31.6000000
1
1
1
1
1
10
10.0000000
1
1
1
1
1
5
3.2000000
1
1
1
1
1
0
1.0000000
1
1
1
1
1
–5
0.3160000
1
1
2
5
122
–10
0.1000000
1
1
1
1
1
–15
0.0316000
1
1
1
1
1
–20
0.0100000
1
1
1
1
4
–25
0.0031600
1
1
1
2
31
–30
0.0010000
1
2
4
13
303
–35
0.0003160
8
14
31
123
3028
–40
0.0000100
79
139
309
1222
30278
Noise Calculations:
20dBm Power 7 dBm
40 10 6 20 Po int s 12
noise(dB) 10 log 1 Power
10 Time N
10
40dBm Power 7 dBm
8 10 3 20 Po int s 12
noise(dB) 10 log 1 Power
10 Time N
10
where:
11-4
Continuous Average Mode:
Scope Mode:
Power = Power level being measured in dBm
Points = 1
Time = Aperture time in milliseconds
N = Number of averages
Power = Power level being measured in dBm
Points = The number of data points on the scope graph
Time = Capture time in milliseconds
N = Number of averages
PN: 10585-00020 Rev. C
PowerXpert UG
Using the MA24108A, MA24118A, and MA24126A
11-3
11-3
Measurement Considerations
Measurement Considerations
High Crest Factor Signals (peak to average ratio)
High crest factor signals, such as CDMA/WCDMA, may have crest factors as high as 10 dB. To ensure the most
accurate power measurement, the statistically-low peak signals should not exceed +30 dBm.
For example, if a signal has an expected crest factor of 10 dB, then the highest average power measured should
not exceed +20 dBm. A sensor’s linearity graph of a WCDMA (TestModel_5_8HSPDSCH) signal with 10 dB
crest factor is shown below:
2GHz WCDM A Linearity
TestModel_5_8HSPDSCH
0.7
0.6
0.5
0.4
Variance (dB)
0.3
0.2
0.1
0.0
-40
-30
-20
-10
-0.1 0
10
20
-0.2
-0.3
-0.4
-0.5
-0.6
-0.7
Input Power (dBm)
Figure 11-3. Sensor Linearity Graph
Multitone Signals
The sensor is a True-RMS sensor that can measure very wide bandwidth modulation without much restriction.
The only limitation is the frequency flatness of the sensor. Because the sensor’s sensitivity is not identical for
all frequencies and when measuring multitone signals, the frequency entered into the sensor’s application
should be the average frequency of all significant tones. The sensor has an additional uncertainty of 0.05 dB for
every 1 GHz tone separation when measuring multitone signals.
For example, a dual tone signal of 2 GHz and 4 GHz may have an additional measurement error of 0.1 dB
(0.05 dB 2) when the application frequency is set to 3 GHz.
PowerXpert UG
PN: 10585-00020 Rev. C
11-5
11-3
Measurement Considerations
Using the MA24108A, MA24118A, and MA24126A
Noise and Averaging
When there is a need to achieve a required reading resolution, particularly at low power levels, averaging is
often needed to reduce noise and steady the displayed power reading. Use the noise vs. resolution table in
“Optimizing the Readings” on page 11-3 to determine the number of averages that will typically be required for
a given resolution. Alternatively, determine the number of averages through calculation by using the noise
specifications and the fact that noise will be proportional to the square root of N, where N is the number of
averages. For example, a CW tone at –25 dBm is to be measured to 0.05 dB resolution. Using Table 3-7, the
required number of averages is 2 averages. The same measurement to 0.01 dB resolution would require 31
averages.
Average Value of Time Varying Signals
When measuring the average Power of a time varying or modulated signal with a modulation rate which is
much greater than the signal channel BW of the sensor, averaging of the power is performed in the sensor
hardware (detectors and or preamplifiers). For the case of the MA24108A / MA24118A the signal channel BW
is 50 KHz, so signals modulated at MHz rates will be averaged in the hardware, and no special considerations
are required.
When measuring signals with modulation frequency components near, or below, the signal channel bandwidth,
average power readings may be seen to fluctuate over time. This fluctuation may be reduced through careful
selection of the aperture time and averaging number. Ideally, the aperture time should be chosen to be an
integer multiple of the modulation frequency. If this can be done, then the average power reading will be stable
for each measurement update. For modulations with multiple frequencies present, or with significant
modulation components with periods longer than the maximum 300 ms aperture time, averaging will have to
be increased to obtain a stable reading. If the measurement update rate is very close to the period of the
modulation, a low frequency “beat note” can result. If the frequencies are very close, the beat note can be very
low in frequency, and therefore require very long averaging times to remove. In this case it is suggested that
the aperture time be changed to result in a higher frequency beat which is easier to average out.
Settling Time
The signal channel bandwidth of the power sensor supports a rise time of about 8 us. The ADC sample period
is a bit more than 7 us. Thus it will take more than one ADC sample for the signal channel hardware to
completely settle in response to a step change in input power. The hardware settling time can be estimated by
assuming a single pole response with the 50 kHz bandwidth:
SP
Settlingtime ln
100
where:
0.35
7 e 6 sec onds
(50e 3)
SP Desired Settling %
For small settling percentages, it is quite likely that the noise per ADC sample will be larger than the desired
settling percentage, thus averaging or decimation of ADC samples will have to be used to reduce the noise.
Averaging will, of course, increase the settling time of the measurement in direct proportion to the averaging
number used.
It is important to note that the settling time described above strictly applies only to increasing power steps
(rise time). Settling to decreasing power steps is typically slower. For settling decreasing power steps to
1 % or 0.1 %, the settling will typically be within a factor of 2 or 3 of the calculation above. Settling
to 0.01 % or less may take considerably longer.
11-6
PN: 10585-00020 Rev. C
PowerXpert UG
Using the MA24108A, MA24118A, and MA24126A
11-3
Measurement Considerations
Noise and Time Resolution in Scope Mode
In scope mode (and in all other modes) the MA24108A / MA24118A is sampling at full speed, which is about
once every 7 µs. When the period chosen for scope mode exceeds the number of data points times this period,
then multiple ADC samples are averaged to form each data point. Therefore there is a trade-off between time
resolution (many data points) and trace noise. To minimize trace noise, choose less data points. Of course for
recurrent waveforms trace averaging can always be used to reduce trace noise if a large number of points is
desired. This would however tend to increase the over-all measurement time.
Optimizing Internal Triggering
Sometimes it can be difficult to obtain consistent triggering in scope or slot mode. Here are some points to
consider when choosing triggering parameters:
• It is more difficult to trigger on signals which are slowly varying with time. Noise in the signal channel
can result in false triggers. In this case, try setting the trigger level at powers away from the bottoms of
the measurement ranges. The trigger crossover power is about +2 dBm. Thus it can be advantageous to
avoid setting the trigger at powers just above +2 dBm, and powers just above -20 dBm where the trigger
signal is noisy.
• Modulated signals can appear “noisy” and also result in false triggers. In this case adjusting the trigger
level may not help. Sometimes there may be a portion of the signal with less modulation, or less
“noise-like” modulation which can be triggered on with more success. Try using a different trigger point
and adjusting the trigger delay to shift the waveform in time to see the desired section.
• False triggers due to either noise or noise-like modulation can be reduced by increasing the trigger noise
immunity parameter. This will result in a slight positive trigger delay, but this can be made up for by
introducing a negative trigger delay with the trigger delay parameter.
• The trigger settings should always be optimized before trace averaging is applied. If trace averaging is
used when the trigger is not stabilized, the displayed waveform will not be an accurate representation of
the signal. First optimize the trigger, then apply trace averaging.
Noise Floor in Scope Mode
The noise level or “floor” displayed in scope or slot mode in PowerXpert when using low averaging may seem to
be higher than what would be expected. This is due to the way noise is dealt with when converting power into
dBm for display. With no input power, the values of the ADC samples vary about some value which
corresponds to zero power. Ideally there are equal number of samples above and below this value. The samples
which are below this value correspond to “negative” power. This is non-physical, and does not truly mean there
is negative power flow to the sensor, it is simply a by product of noise in the signal channel. If these samples
are displayed in linear power units such as mW, then the noise floor will be as expected. However there is a
problem when converting to logarithmic units such as dB. Because taking the logarithm of negative numbers is
not generally allowed, the absolute value of the samples is usually taken before taking the logarithm. This has
the drawback of increasing the average value of the samples, artificially increasing the apparent noise floor.
When the averaging is increased, the noise floor will go down. The apparent noise floor can be estimated using:
NF = 0.8 x noise
where:
NF = the average linear power or noise floor due to taking absolute value of power samples
noise = the noise power in linear units on a 1 sigma basis
PowerXpert UG
PN: 10585-00020 Rev. C
11-7
11-4
11-4
Uncertainty of a Measurement
Using the MA24108A, MA24118A, and MA24126A
Uncertainty of a Measurement
Measurement Uncertainty Calculator
Included on the Power Expert CD-Rom is a Microsoft Excel tool for calculating power uncertainty. It is
accessible from the Startup.htm page. It contains two tabs; one that provides measurement uncertainty for
each sensor (selectable from a drop-down menu), and another tab that provides additional uncertainty
components and calculated values for the MA24105A Peak Power Sensor.
Uncertainty Components
Power measurements have many component parts that affect overall measurement uncertainty when
measuring power with the power sensor:
• Measurement Uncertainty: Measurement uncertainty includes the uncertainty associated with the
correction of frequency and the linearity response of the sensor over the entire dynamic range. Anritsu
follows the industry standard condition of calibrating the power-sensing element at a reference power of
0 dBm (1 mW) and an ambient temperature of 25 °C.
• Temperature Compensation: Sensor Temperature Compensation describes the relative power level
response over the dynamic range of the sensor. Temperature Compensation should be considered when
operating the sensor at other than room temperature.
• Noise, Zero Set, and Zero Drift: These are factors within the sensor that impact measurement
accuracy at the bottom of the power sensor’s dynamic range.
• Mismatch Uncertainty: Mismatch uncertainty is typically the largest component of measurement
uncertainty. The error is caused by the differing impedances between the power sensor and the devices
to which the power sensor is connected. Mismatch uncertainty can be calculated as follows:
% Mismatch Uncertainty = 1001 + 122 – 1
dB Mismatch Uncertainty = 20log1 + 12
where:
1 is the reflection coefficient of the power sensor
2 is the reflection coefficient of the device
Uncertainty examples are shown in Table 11-2 on page 11-9 and Table 11-3 on page 11-10.
11-8
PN: 10585-00020 Rev. C
PowerXpert UG
Using the MA24108A, MA24118A, and MA24126A
11-4
Uncertainty of a Measurement
Uncertainty Examples
Two measurement uncertainty calculations are shown for the MA24108A and MA24118A sensors in
Table 11-2. The power sensor is used to measure the power of a 3 GHz, +12.0 dBm and –35 dBm CW signal
from a signal source with a 1.5:1 VSWR. The example is based on an aperture time of 20 ms and 64
measurement averages.
Table 11-2. MA24108A and MA24118A Measurement Uncertainty Example
Uncertainty
Term
Uncertainty
Uncertainty
Specification Specification
at –35 dBm
at +12 dBm
(%)
(%)
Probability
Distribution
Divisor
Adjusted
Uncertainty
at +12 dBm
(%)
Adjusted
Uncertainty
at –35 dBm
(%)
Sensor Linearity
(<+18 dBm)
3.0
3.0
Rectangular
1.7
1.7
Noise
0.0
1.6
Normal at 2
2
0.0
0.8
Zero Set
0.0
3.2
Rectangular
0.0
1.8
Zero Drift
0.0
0.9
Normal at 2
2
0.0
0.6
Calibration Factor
Uncertainty
1.5
1.5
Normal at 2
2
0.8
0.8
Mismatch
Uncertainty
4.0
4.0
Rectangular
2.3
2.3
Combined
Uncertainty
(RSS), Room
Temperature
3.0
3.6
Expanded
Uncertainty with
K=2, Room
Temperature
6.0
7.3
0.8
0.8
Combined
Uncertainty
(RSS, 0 to 50 °C)
3.1
3.6
Expanded
Uncertainty
with K=2
(RSS, 0 to 50 °C)
6.2
7.5
Temperature
Compensation
PowerXpert UG
1.4
1.4
Rectangular
PN: 10585-00020 Rev. C
11-9
11-4
Uncertainty of a Measurement
Using the MA24108A, MA24118A, and MA24126A
Two measurement uncertainty calculations are shown for the MA24126A sensor in Table 11-3. The power
sensor is used to measure the power of a 3 GHz, +12.0 dBm and –35 dBm CW signal from a signal source with
a 1.5:1 VSWR. The example is based on an aperture time of 20 ms and 64 measurement averages.
Table 11-3. MA24126A Measurement Uncertainty Example
Uncertainty
Uncertainty
Specification Specification
at –35 dBm
at +12 dBm
(%)
(%)
Uncertainty
Term
Probability
Distribution
Divisor
Adjusted
Uncertainty
at +12 dBm
(%)
Adjusted
Uncertainty
at –35 dBm
(%)
Sensor Linearity
(<+18 dBm)
3.0
3.0
Rectangular
1.7
1.7
Noise
0.0
1.6
Normal at 2
2
0.0
0.8
Zero Set
0.0
3.2
Rectangular
0.0
1.8
Zero Drift
0.0
0.9
Normal at 2
2
0.0
0.6
Calibration Factor
Uncertainty
2.5
2.5
Normal at 2
2
1.25
1.25
Mismatch
Uncertainty
4.0
4.0
Rectangular
2.3
2.3
Combined
Uncertainty
(RSS), Room
Temperature
3.2
3.8
Expanded
Uncertainty with
K=2, Room
Temperature
6.3
7.6
0.8
0.8
Combined
Uncertainty
(RSS, 0 to 50 °C)
3.3
3.9
Expanded
Uncertainty
with K=2
(RSS, 0 to 50 °C)
6.5
7.7
Temperature
Compensation
1.4
1.4
Rectangular
Table 11-4. Noise Measurement Uncertainty Calculations
Noise Calculations at 12 dBm (16 mW):
Noise 1 µW/16 mW = 0.0 %
Zero Set 1 µW/16 mW = 0.0 %
Zero Drift 0.5 µW/16 mW = 0.0 %
Noise Calculations at –35 dBm (316 nW):
Noise 5 nW/316 nW = 1.6 %
Zero Set 10 nW/316 nW = 3.2 %
Zero Drift 3 nW/316 nW = 0.9 %
11-10
PN: 10585-00020 Rev. C
PowerXpert UG
Using the MA24108A, MA24118A, and MA24126A
11-5
11-5
Error States
Error States
This section details some of the error messages that may appear on the application screen. In most cases, the
error condition can be easily corrected. The status LED will light amber when an error state occurs. If not, note
the error message and contact an Anritsu Service Center.
Table 11-5. Error Messages
Message
Description
Resolution
Temp change > 10 C
The sensor’s ambient temperature has changed
by more than 10 ºC since the last zero
operation.
Perform the zero operation again.
Temperature over range
The sensor is operating outside of its specified
range of 0 ºC to 55 ºC.
Operate the sensor within its
specified range.
Range 1 zero failure
or
Range 2 zero failure
This message appears if the zero operation is
Turn off the RF input to the sensor
unsuccessful. The reason could be the
or disconnect the sensor from the
presence of RF power at the input of the sensor. RF source and try the zero
operation again.
Range 1 over range
This message appears on the application
screen if excess power is applied to the sensor.
PowerXpert UG
PN: 10585-00020 Rev. C
Reduce the input power to the
sensor to within acceptable limits
(< 30 dBm).
11-11
11-5
11-12
Error States
Using the MA24108A, MA24118A, and MA24126A
PN: 10585-00020 Rev. C
PowerXpert UG
Chapter 12 — Operational Testing for the
MA24108A, MA24118A, and MA24126A
12-1
Introduction
The test methodology and equipment described here can be used to gain some confidence in the measurement
accuracy of the MA24108A, MA24118A, or MA24126A Power Sensor. This is accomplished by comparing the
sensor to another sensor with a specified cal factor and linearity performance or uncertainty. General
commercially available equipment is used for these tests; however, these procedures are not sufficiently
accurate to verify sensors to factory specification. Therefore, sensor test limits in these procedures are set
appropriately to the specified comparison equipment. All tests should be performed at an ambient temperature
of 20 ºC to 25 ºC.
Calibration and verification of high accuracy power sensors requires substantial investment in both
skill and equipment. For calibration, calibration verification, and to maintain the factory specifications
of your power sensor, please send sensors to qualified Anritsu Customer Service Centers.
Note
Refer to the following sections for required equipment and test procedures:
• “Required Equipment - MA24108A/118A/126A”
• “VSWR Pretest”
• “Frequency Response Test”
• “Linearity Test”
12-2
Precautions
Warning
Do not connect or apply power outside of the power sensor specifications or permanent damage
may result.
Before connecting the power sensor to another device, ensure the following:
Both connectors are in good condition and undamaged
Pin depth is verified
Both connectors are clean
Ensure the output of the device you are connecting to does not exceed the signal limits of the
sensor.
ESD precautions are observed.
Refer to Chapter 4, “Power Sensor Care” for complete details.
Caution
When connecting the power sensor, ensure the following:
The connectors are aligned before mating
Do not turn the connector body–only the connector coupling nut.
Torque the connection using the correct torque wrench and proper torquing technique.
Do not over torque.
Refer to Chapter 4, “Power Sensor Care” for complete details.
PowerXpert UG
PN: 10585-00020 Rev. C
12-1
12-3
Required Equipment - MA24108A/118A/126A Operational Testing for the MA24108A, MA24118A, and
12-3
Required Equipment - MA24108A/118A/126A
Table 12-1. Required Equipment
Equipment Description
Vector Network Analyzer
(Pretest)
Synthesizer
(Cal. Factor and Linearity Tests)
Reference Power Meter
(Cal. Factor and Linearity Tests)
Reference Power Sensor
(Cal. Factor and Linearity Tests)
Manufacturer and Model
Anritsu 37369D
Anritsu MS4642A or
MS4644A (for MA24126A)
or equivalent
Anritsu MG3693
or equivalent
Anritsu ML2438A
or equivalent
Anritsu MA24002A
or equivalent, or
Anritsu MA24004A or
equivalent
(for MA24126A)
Anritsu 41KC-10
Critical Specifications
Reflection Coefficient
Uncertainty 0.013, 10 MHz to 2 GHz
Uncertainty 0.020, 2 GHz to 18 GHz
Uncertainty 0.025, 18 GHz to 26 GHz
Output Power: > +10 dBm, 50 MHz to 26 GHz
Output Power Setting Resolution: 0.01 dBm
Harmonics: –40 dBc
Source VSWR 2.00
Instrumentation Accuracy 0.5 %
NIST Calibration or equivalent
6 dB K Attenuator
(Cal. Factor Test)
Anritsu 41KC-6
Adapter N(f) to K(f)
(Cal. Factor and Linearity Tests)
Power Splitter
(Linearity Tests)
Personal Computer
Anritsu 34ANF50 and
34AK50
Anritsu K241B
VSWR 1.15, 10 MHz to 12 GHz
VSWR 1.20, 12 GHz to 18 GHz
VSWR 1.30, 18 GHz to 26 GHz
VSWR 1.15, 10 MHz to 12 GHz
VSWR 1.20, 12 GHz to 18 GHz
VSWR 1.30, 18 GHz to 26 GHz
VSWR 1.10, 10 MHz to 18 GHz
VSWR 1.17, 18 GHz to 26 GHz
Effective Output VSWR < 1.45, 10 MHz to 26 GHz
Any
See Chapter 2
10 dB K Attenuator
(Linearity Test)
12-2
PN: 10585-00020 Rev. C
PowerXpert UG
Operational Testing for the MA24108A, MA24118A, and MA24126A
12-4
12-4
VSWR Pretest
VSWR Pretest
The most common cause of power sensor failure is excess input power. Applying power exceeding the damage
level shown on the label will damage the sensor’s sensing element resulting in impedance change. Input match
will be degraded when element impedance is changed. If you suspect that a sensor is damaged, you should
start with an input match pretest.
The maximum VSWR values are listed in the Performance Specification section of this manual. The
uncertainty of the VSWR test equipment will affect actual measurement values. See the following Table 12-2
for an example of how measurement system uncertainty can affect the Expected Maximum Reflection
Coefficient when using the Anritsu MS4642A Vector Network Analyzer.
Test Procedure
Follow the manufacturers S11 (or return loss) calibration procedure to perform calibration on a network
analyzer. Connect the power sensor to the network analyzer test port and measure power sensor input match.
Typically, matches are measured in terms of return loss in dB. Return loss and magnitude of the reflection
coefficient conversion equations are as follows:
= 10–RL/20
RL = –20log
where
RL = Return Loss in dB
= Magnitude of the Reflection Coefficient
VSWR and magnitude of the reflection coefficient conversion equations are as follows:
VSWR = (1 + ) / (1 – )
= (VSWR – 1) / (VSWR + 1)
where
VSWR = Voltage Standing Wave Ratio
= Magnitude of the Reflection Coefficient
Record the measured data into Table 12-2 under the Actual Measurement column. The Actual Measurement
should be smaller than the Maximum Reflection coefficient. The Maximum Reflection Coefficient is equal to
the measurement system uncertainty added to the sensor’s reflection coefficient specification. If the Actual
Measurement reflection coefficient is larger than the Maximum Reflection Coefficient, then the power sensor
may be defective. If the actual reflection coefficient is significantly larger than the maximum values in
Table 12-2, then the sensor is damaged and it is not necessary to perform further testing.
Note
There are no user-serviceable parts inside the power sensors. Contact your local Anritsu Service
Center and return defective sensors with a detailed description of the observed problem.
Table 12-2. Pretest Measurement Result
Frequency
37369D and MS4624B
Reflection Coefficient
Uncertainty
Maximum Reflection
Coefficient
10 MHz to 50 MHz
0.013
0.310 + 0.013 = 0.323
50 MHz to 150 MHz
0.013
0.078 + 0.013 = 0.091
150 MHz to 2 GHz
0.013
0.057 + 0.013 = 0.070
2 GHz to 12 GHz
0.020
0.099 + 0.020 = 0.119
12 GHz to 18 GHz
0.020
0.111 + 0.020 = 0.131
18 GHz to 26 GHz
0.025
0.149 + 0.025 = 0.174
PowerXpert UG
PN: 10585-00020 Rev. C
Actual Measurement
12-3
12-5
Frequency Response Test
12-5
Operational Testing for the MA24108A, MA24118A, and MA24126A
Frequency Response Test
In this test the frequency response of the sensor is tested at one low power level against a reference sensor of
known measurement uncertainty. The reference sensor should be calibrated by a reputable standards
laboratory using instruments with low published measurement uncertainty values. To perform the
comparison, both sensors are used to measure the output power of a synthesizer with a high quality
attenuator, such as the 41KC-6, on the output. The attenuator improves the source match of the synthesizer by
lowering the mismatch ripples, thereby lowering the uncertainty in the comparison.
Test Procedure
1. Set up the equipment as follows (refer to Figure 12-1 for an illustration):
a. Connect the reference power sensor to the reference power meter using the appropriate cables.
b. Connect the USB cable between the personal computer with the PowerXpert application installed
and the MA24108A, MA24118A, or MA24126A power sensor under test.
c. Launch the PowerXpert application.
d. Turn the power on to all of the instruments and allow them to warm up for the amount of time
specified in their respective manuals.
e. Reset or Preset all of the instruments.
f. Configure the reference meter and sensor to measure a CW signal.
g. Perform a sensor Zero and a 1 mW reference calibration on the reference sensor and meter per the
manufacturer’s instructions.
h. Perform a low level Zero of the MA24108A, MA24118A, or MA24126A power sensor by
disconnecting it from the synthesizer, clicking the Zero button on the PowerXpert application, and
waiting for the Zeroing message to close.
i. Connect the attenuator to the output of the synthesizer with the appropriate adapter (if required)
to the output of the attenuator.
j. Set the synthesizer to +6 dBm and 50 MHz.
MA24108A
MA24118A
MA24126A
2
3
3
6
4
1
5
7
Index
1
2
3
4
5
Description
Synthesizer
Reference Power Meter
Reference Power Sensor
K to N Adapter (if required)
Attenuator
Figure 12-1. Cal Factor Test Set Up (1 of 2)
12-4
PN: 10585-00020 Rev. C
PowerXpert UG
Operational Testing for the MA24108A, MA24118A, and MA24126A
6
7
12-5
Frequency Response Test
MA24108A, MA24118A or MA24126A Power Sensor
PC with Anritsu PowerXpert Application
Figure 12-1. Cal Factor Test Set Up (2 of 2)
2. Connect the reference sensor to the synthesizer with the appropriate adapter (if required) and attenuator
in-line (see Figure 12-1).
3. Apply the Cal factor to the reference sensor per the manufacturer’s instruction.
4. Record the power indicated by the reference meter in Table 12-3.
5. Disconnect the reference sensor from the synthesizer output and connect the MA24108A, MA24118A, or
MA24126A power sensor with the appropriate adapter (if required) and attenuator in-line (see
Figure 12-1).
6. Apply the Cal factor to the MA24108A, MA24118A, or MA24126A by entering the frequency of the
measurement in GHz.
7. In the General Settings, set Averages to 4.
8. Record the power indicated by the MA24108A, MA24118A, or MA24126A in Table 12-3.
9. Set the synthesizer frequency to the next frequency in Table 12-3.
10. Repeat Step 2 through Step 9 until all of the frequencies in Table 12-3 have been measured.
11. For each row in Table 12-3, calculate the absolute value of the difference between the recorded Reference
power measurement and the recorded MA24108A, MA24118A, or MA24126A measurement, and record
the result in Table 12-3.
12. For each frequency, compare the power difference to the maximum allowed difference specified in
Table 12-3. If the difference is higher than the maximum allowed difference, contact Anritsu customer
service.
Table 12-3. Test Measurement Results (1 of 2)
A
B
A-B
MA24108A and
MA24118A
Maximum
Allowed
Difference
(dB)
MA24126A
Maximum
Allowed
Difference
(dB)
0.01
0.51
0.55
0.05
0.29
0.31
0.1
0.29
0.31
0.3
0.27
0.29
0.5
0.27
0.29
1.0
0.27
0.29
2.0
0.27
0.29
3.0
0.30
0.33
4.0
0.30
0.33
5.0
0.30
0.33
6.0
0.30
0.33
7.0
0.32
0.35
8.0
0.32
0.35
9.0
0.32
0.37
10.0
0.32
0.37
Frequency
(GHz)
PowerXpert UG
Reference Power
Measurement
(dBm)
Absolute Value of
MA241xxA
Difference in Power
Measurement
Measurements
(dBm)
(dB)
PN: 10585-00020 Rev. C
12-5
12-5
Frequency Response Test
Operational Testing for the MA24108A, MA24118A, and MA24126A
Table 12-3. Test Measurement Results (2 of 2)
A
A-B
MA24108A and
MA24118A
Maximum
Allowed
Difference
(dB)
MA24126A
Maximum
Allowed
Difference
(dB)
11.0
0.32
0.37
12.0
0.32
0.37
13.0
0.34
0.38
14.0
0.34
0.38
15.0
0.34
0.38
16.0
0.34
0.41
17.0
0.34
0.41
18.0
0.34
0.41
19.0
-
0.62
20.0
-
0.62
21.0
-
0.62
22.0
-
0.62
23.0
-
0.62
24.0
-
0.62
25.0
-
0.62
26.0
-
0.62
Frequency
(GHz)
12-6
B
Reference Power
Measurement
(dBm)
Absolute Value of
MA241xxA
Difference in Power
Measurement
Measurements
(dBm)
(dB)
PN: 10585-00020 Rev. C
PowerXpert UG
Operational Testing for the MA24108A, MA24118A, and MA24126A
12-6
12-6
Linearity Test
Linearity Test
The linearity correction of the MA24108A, MA24118A, or MA24126A is compared to a thermal power sensor,
which has very good inherent linearity over a power range of about –20 to +10 dBm. For this reason, the
MA24108A, MA24118A, or MA24126A is compared to the thermal sensor in two ranges, keeping the power
levels to the thermal sensor in the range of –17 dBm to +5 dBm, while the power to the MA24108A,
MA24118A, or MA24126A varies from about –26 dBm to about +14 dBm.
Test Procedure
1. Set up the equipment as follows (refer to Figure 12-2 for an illustration):
a. Connect the reference power sensor to the reference power meter using the appropriate cables.
b. Connect the USB cable between the personal computer with the PowerXpert application installed
and the MA24108A, MA24118A, or MA24126A power sensor under test.
c. Launch the PowerXpert application.
d. Turn the power on to all of the instruments and allow them to warm up for the amount of time
specified in the instrument’s respective manuals.
e. Reset or Preset all of the instruments.
f. Configure the reference meter and sensor to measure a CW signal.
g. Perform a sensor Zero and a 1 mW reference calibration on the reference sensor and meter per the
manufacturer’s instructions.
h. Perform a low level Zero of the MA24108A, MA24118A, or MA24126A by disconnecting the it from
the synthesizer, clicking the Zero button on the PowerXpert application, and waiting for the
Zeroing message to close.
i. Connect the power splitter to the output of the synthesizer, and connect the 10 dB attenuator to
the reference arm of the splitter output.
j. Connect an N(f) to K adapter (if required) to each power sensor.
k. Connect the reference sensor and adapter to the 10 dB attenuator.
l. Connect the MA24108A, MA24118A, or MA24126A and adapter (if required) to the other splitter
output.
m. Set the synthesizer to 50 MHz and +20 dBm.
n. Increase averaging by entering “16” in the PowerXpert application, and then click Apply above
settings.
PowerXpert UG
PN: 10585-00020 Rev. C
12-7
12-6
Linearity Test
Operational Testing for the MA24108A, MA24118A, and MA24126A
2
3
4
1
5
6
7
Index
1
2
3
4
5
6
7
8
9
3
MA24108A
MA24118A
MA24126A
8
9
Description
Synthesizer
Reference Power Meter
Reference Power Sensor
K to N Adapter (if required)
Attenuator
Power Splitter
K to N Adapter (if required)
MA24108A, MA24118A or MA24126A Power Sensor
PC with Anritsu PowerXpert Application
Figure 12-2. Linearity Test Setup 1
2. Apply the Cal factor to the reference sensor per the manufacturer’s procedure.
3. Apply the Cal factor by entering the frequency of the measurement in GHz.
4. Turn Off the synthesizer’s RF output and perform a low-level Zero of both the Reference sensor and the
MA24108A, MA24118A, or MA24126A.
5. Turn On the synthesizer’s RF output.
6. Record data for the first 20 dB range as follows:
a. Record the power reading by the reference meter in Table 12-4 on page 12-10.
b. Record the power reading by the MA24108A, MA24118A, or MA24126A in Table 12-4.
c. Set the synthesizer power to +15 dBm.
d. Record the reference meter and the MA24108A, MA24118A, or MA24126A power sensor readings
in Table 12-4.
e. Repeat the measurement for synthesizer output levels of +10, +5, and 0 dBm.
12-8
PN: 10585-00020 Rev. C
PowerXpert UG
Operational Testing for the MA24108A, MA24118A, and MA24126A
Note
12-6
Linearity Test
The MA24108A, MA24118A, or MA24126A power measured at 0 dBm will be used in Step 7e,
below.
7. Set up the test for the second 20 dB range as follows:
a. Remove the 10 dB attenuator from in between the reference sensor and splitter and connect the
reference sensor (with adapter, if required) directly to the splitter.
b. Remove the MA24108A, MA24118A, or MA24126A from the splitter and connect the 10 dB
attenuator between the splitter and the power sensor (see Figure 12-3).
c. Turn Off the synthesizer’s RF output and perform a low-level Zero of both the Reference sensor
and the MA24108A, MA24118A, or MA24126A.
d. Turn On the synthesizer’s RF output.
2
3
4
1
5
6
7
9
Index
1
2
3
4
5
6
7
8
9
3
MA24108A
MA24118A
MA24126A
8
Description
Synthesizer
Reference Power Meter
Reference Power Sensor
K to N Adapter (if required)
Power Splitter
Attenuator
K to N Adapter (if required)
MA24108A, MA24118A or MA24126A Power Sensor
PC with Anritsu PowerXpert Application
Figure 12-3. Linearity Test Setup 2
e. Set the synthesizer output level to +10 dBm, then adjust its power level until the sensor/meter
under test reads as close as possible to the 0 dBm value obtained above in Step 6e.
PowerXpert UG
PN: 10585-00020 Rev. C
12-9
12-6
Linearity Test
Operational Testing for the MA24108A, MA24118A, and MA24126A
8. Record data for the next 20 dB range
a. Read and record the power indicated by the reference meter in Table 12-4.
b. Lower the output power level of the synthesizer to +5 dBm.
c. Record the reference meter and the MA24108A, MA24118A, or MA24126A power sensor readings
in Table 12-4.
d. Repeat the measurement for synthesizer output levels of 0, –5, and –10 dBm.
Table 12-4. Measurement Results (50 MHz)
A
Reference
Power
Measurement
(dBm)
B
= (A6–A5)
C
= (A+B)
Corrected
Reference Power
Measurement
(dB)
Row
#
Synthesizer
Power Level
Setting
(dBm)
Attenuation
in Reference
Arm
(dB)
1
+20
10
0
2
+15
10
0
3
+10
10
0
4
+5
10
0
5
0
10
0
6
adjust per
Step 7e
0
0
10
7
+5
0
0
10
8
0
0
0
10
9
-5
0
0
10
10
-10
0
0
10
Correction
(dB)
Attenuation
in Test Arm
(dB)
D
E
= (C–D)
MA241xxA
Measurement
(dBm)
Difference
Calculation
(dB)
11
Max:
12
Min:
13
Delta (E11 – E12):
9. Perform the calculations and operation check as follows:
a. Subtract the Reference Power Measurement of row 5 from the Reference Power Measurement of
row 6. Record this value in the Correction column of rows 1 through 5.
Note
The Correction column of rows 1 through 5 should all have the same value.
The Correction column of rows 6 through 10 have values of 0.
b. Add the Reference Power Measurement and Correction values of row 1 and record the result in the
Corrected Reference Power Measurement column of row 1.
c. Repeat Step 9b for rows 2 through 10.
d. Subtract the MA24108A, MA24118A, or MA24126A Measurement of row 1 from the Corrected
Reference Power Measurement of row 1 and record the result in the Difference Calculation column
of row 1.
e. Repeat Step 9d for rows 2 through 10.
f. Find the largest (most positive) value in the Difference Calculation column and record this value
next to the word Max in row 11.
g. Find the smallest (least positive or most negative) value in the Difference Calculation column and
record this value next to the word Min in row 12.
12-10
PN: 10585-00020 Rev. C
PowerXpert UG
Operational Testing for the MA24108A, MA24118A, and MA24126A
12-6
Linearity Test
h. Subtract the Min value from Step 9g from the Max value from Step 9f and record the result next to
the word Delta in row 13.
i. The Delta result should be less than 0.3 dB. If it is larger, contact Anritsu customer service.
10. Repeat the entire measurement and calculations with synthesizer frequency settings of 2 GHz, 4 GHz,
6 GHz, 10 GHz, 12 GHz, 14 GHz, 16 GHz, 18 GHz, 20 GHz, 22 GHz, 24 GHz, and 26 GHz.
Table 12-5. Measurement Results (2 GHz)
A
Reference
Power
Measurement
(dBm)
B
= (A6–A5)
C
= (A+B)
Corrected
Reference Power
Measurement
(dB)
Row
#
Synthesizer
Power Level
Setting
(dBm)
Attenuation
in Reference
Arm
(dB)
1
+20
10
0
2
+15
10
0
3
+10
10
0
4
+5
10
0
5
0
10
0
6
adjust per
Step 7e
0
0
10
7
+5
0
0
10
8
0
0
0
10
9
–5
0
0
10
10
–10
0
0
10
Correction
(dB)
Attenuation
in Test Arm
(dB)
D
C–D
MA241xxA
Measurement
(dBm)
Difference
Calculation
(dB)
11
Max:
12
Min:
13
Delta (E11 – E12):
Table 12-6. Measurement Results (4 GHz) (1 of 2)
A
Reference
Power
Measurement
(dBm)
B
= (A6–A5)
C
= (A+B)
Corrected
Reference Power
Measurement
(dB)
Row
#
Synthesizer
Power Level
Setting
(dBm)
Attenuation
in Reference
Arm
(dB)
1
+20
10
0
2
+15
10
0
3
+10
10
0
4
+5
10
0
5
0
10
0
6
adjust per
Step 7e
0
0
10
7
+5
0
0
10
8
0
0
0
10
9
–5
0
0
10
10
–10
0
0
10
PowerXpert UG
Correction
(dB)
PN: 10585-00020 Rev. C
Attenuation
in Test Arm
(dB)
D
E
= (C–D)
MA241xxA
Measurement
(dBm)
Difference
Calculation
(dB)
12-11
12-6
Linearity Test
Operational Testing for the MA24108A, MA24118A, and MA24126A
Table 12-6. Measurement Results (4 GHz) (2 of 2)
A
Row
#
Synthesizer
Power Level
Setting
(dBm)
Attenuation
in Reference
Arm
(dB)
Reference
Power
Measurement
(dBm)
B
= (A6–A5)
Correction
(dB)
C
= (A+B)
Corrected
Reference Power
Measurement
(dB)
Attenuation
in Test Arm
(dB)
D
E
= (C–D)
MA241xxA
Measurement
(dBm)
Difference
Calculation
(dB)
11
Max:
12
Min:
13
Delta (E11 – E12):
Table 12-7. Measurement Results (6 GHz)
A
Reference
Power
Measurement
(dBm)
B
= (A6–A5)
C
= (A+B)
Corrected
Reference Power
Measurement
(dB)
Row
#
Synthesizer
Power Level
Setting
(dBm)
Attenuation
in Reference
Arm
(dB)
1
+20
10
0
2
+15
10
0
3
+10
10
0
4
+5
10
0
5
0
10
0
6
adjust per
Step 7e
0
0
10
7
+5
0
0
10
8
0
0
0
10
9
–5
0
0
10
10
–10
0
0
10
Correction
(dB)
Attenuation
in Test Arm
(dB)
D
E
= (C–D)
MA241xxA
Measurement
(dBm)
Difference
Calculation
(dB)
11
Max:
12
Min:
13
Delta (E11 – E12):
Table 12-8. Measurement Results (8 GHz) (1 of 2)
A
Reference
Power
Measurement
(dBm)
B
= (A6–A5)
C
= (A+B)
Corrected
Reference Power
Measurement
(dB)
Row
#
Synthesizer
Power Level
Setting
(dBm)
Attenuation
in Reference
Arm
(dB)
1
+20
10
0
2
+15
10
0
3
+10
10
0
4
+5
10
0
5
0
10
0
12-12
Correction
(dB)
PN: 10585-00020 Rev. C
Attenuation
in Test Arm
(dB)
D
E
= (C–D)
MA241xxA
Measurement
(dBm)
Difference
Calculation
(dB)
PowerXpert UG
Operational Testing for the MA24108A, MA24118A, and MA24126A
12-6
Linearity Test
Table 12-8. Measurement Results (8 GHz) (2 of 2)
A
Reference
Power
Measurement
(dBm)
B
= (A6–A5)
C
= (A+B)
Corrected
Reference Power
Measurement
(dB)
Synthesizer
Power Level
Setting
(dBm)
Attenuation
in Reference
Arm
(dB)
6
adjust per
Step 7e
0
0
10
7
+5
0
0
10
8
0
0
0
10
9
–5
0
0
10
10
–10
0
0
10
Row
#
Correction
(dB)
Attenuation
in Test Arm
(dB)
D
E
= (C–D)
MA241xxA
Measurement
(dBm)
Difference
Calculation
(dB)
11
Max:
12
Min:
13
Delta (E11 – E12):
Table 12-9. Measurement Results (10 GHz)
A
Reference
Power
Measurement
(dBm)
B
= (A6–A5)
C
= (A+B)
Corrected
Reference Power
Measurement
(dB)
Row
#
Synthesizer
Power Level
Setting
(dBm)
Attenuation
in Reference
Arm
(dB)
1
+20
10
0
2
+15
10
0
3
+10
10
0
4
+5
10
0
5
0
10
0
6
adjust per
Step 7e
0
0
10
7
+5
0
0
10
8
0
0
0
10
9
–5
0
0
10
10
–10
0
0
10
Correction
(dB)
Attenuation
in Test Arm
(dB)
D
E
= (C–D)
MA241xxA
Measurement
(dBm)
Difference
Calculation
(dB)
11
Max:
12
Min:
13
Delta (E11 – E12):
PowerXpert UG
PN: 10585-00020 Rev. C
12-13
12-6
Linearity Test
Operational Testing for the MA24108A, MA24118A, and MA24126A
Table 12-10.Measurement Results (12 GHz)
A
Reference
Power
Measurement
(dBm)
B
= (A6–A5)
C
= (A+B)
Corrected
Reference Power
Measurement
(dB)
Row
#
Synthesizer
Power Level
Setting
(dBm)
Attenuation
in Reference
Arm
(dB)
1
+20
10
0
2
+15
10
0
3
+10
10
0
4
+5
10
0
5
0
10
0
6
adjust per
Step 7e
0
0
10
7
+5
0
0
10
8
0
0
0
10
9
–5
0
0
10
10
–10
0
0
10
Correction
(dB)
Attenuation
in Test Arm
(dB)
D
E
= (C–D)
MA241xxA
Measurement
(dBm)
Difference
Calculation
(dB)
11
Max:
12
Min:
13
Delta (E11 – E12):
Table 12-11.Measurement Results (14 GHz)
A
Reference
Power
Measurement
(dBm)
B
= (A6–A5)
C
= (A+B)
Corrected
Reference Power
Measurement
(dB)
Row
#
Synthesizer
Power Level
Setting
(dBm)
Attenuation
in Reference
Arm
(dB)
1
+20
10
0
2
+15
10
0
3
+10
10
0
4
+5
10
0
5
0
10
0
6
adjust per
Step 7e
0
0
10
7
+5
0
0
10
8
0
0
0
10
9
–5
0
0
10
10
–10
0
0
10
Correction
(dB)
Attenuation
in Test Arm
(dB)
D
E
= (C–D)
MA241xxA
Measurement
(dBm)
Difference
Calculation
(dB)
11
Max:
12
Min:
13
Delta (E11 – E12):
12-14
PN: 10585-00020 Rev. C
PowerXpert UG
Operational Testing for the MA24108A, MA24118A, and MA24126A
12-6
Linearity Test
Table 12-12.Measurement Results (16 GHz)
A
Reference
Power
Measurement
(dBm)
B
= (A6–A5)
C
= (A+B)
Corrected
Reference Power
Measurement
(dB)
Row
#
Synthesizer
Power Level
Setting
(dBm)
Attenuation
in Reference
Arm
(dB)
1
+20
10
0
2
+15
10
0
3
+10
10
0
4
+5
10
0
5
0
10
0
6
adjust per
Step 7e
0
0
10
7
+5
0
0
10
8
0
0
0
10
9
–5
0
0
10
10
–10
0
0
10
Correction
(dB)
Attenuation
in Test Arm
(dB)
D
E
= (C–D)
MA241xxA
Measurement
(dBm)
Difference
Calculation
(dB)
11
Max:
12
Min:
13
Delta (E11 – E12):
Table 12-13.Measurement Results (18 GHz)
A
Reference
Power
Measurement
(dBm)
B
= (A6–A5)
C
= (A+B)
Corrected
Reference Power
Measurement
(dB)
Row
#
Synthesizer
Power Level
Setting
(dBm)
Attenuation
in Reference
Arm
(dB)
1
+20
10
0
2
+15
10
0
3
+10
10
0
4
+5
10
0
5
0
10
0
6
adjust per
Step 7e
0
0
10
7
+5
0
0
10
8
0
0
0
10
9
–5
0
0
10
10
–10
0
0
10
Correction
(dB)
Attenuation
in Test Arm
(dB)
D
E
= (C–D)
MA241xxA
Measurement
(dBm)
Difference
Calculation
(dB)
11
Max:
12
Min:
13
Delta (E11 – E12):
PowerXpert UG
PN: 10585-00020 Rev. C
12-15
12-6
Linearity Test
Operational Testing for the MA24108A, MA24118A, and MA24126A
Table 12-14.Measurement Results (20 GHz)
A
Reference
Power
Measurement
(dBm)
B
= (A6–A5)
C
= (A+B)
Corrected
Reference Power
Measurement
(dB)
Row
#
Synthesizer
Power Level
Setting
(dBm)
Attenuation
in Reference
Arm
(dB)
1
+20
10
0
2
+15
10
0
3
+10
10
0
4
+5
10
0
5
0
10
0
6
adjust per
Step 7e
0
0
10
7
+5
0
0
10
8
0
0
0
10
9
–5
0
0
10
10
–10
0
0
10
Correction
(dB)
Attenuation
in Test Arm
(dB)
D
E
= (C–D)
MA241xxA
Measurement
(dBm)
Difference
Calculation
(dB)
11
Max:
12
Min:
13
Delta (E11 – E12):
Table 12-15.Measurement Results (22 GHz)
A
Reference
Power
Measurement
(dBm)
B
= (A6–A5)
C
= (A+B)
Corrected
Reference Power
Measurement
(dB)
Row
#
Synthesizer
Power Level
Setting
(dBm)
Attenuation
in Reference
Arm
(dB)
1
+20
10
0
2
+15
10
0
3
+10
10
0
4
+5
10
0
5
0
10
0
6
adjust per
Step 7e
0
0
10
7
+5
0
0
10
8
0
0
0
10
9
–5
0
0
10
10
–10
0
0
10
Correction
(dB)
Attenuation
in Test Arm
(dB)
D
E
= (C–D)
MA241xxA
Measurement
(dBm)
Difference
Calculation
(dB)
11
Max:
12
Min:
13
Delta (E11 – E12):
12-16
PN: 10585-00020 Rev. C
PowerXpert UG
Operational Testing for the MA24108A, MA24118A, and MA24126A
12-6
Linearity Test
Table 12-16.Measurement Results (24 GHz)
A
Reference
Power
Measurement
(dBm)
B
= (A6–A5)
C
= (A+B)
Corrected
Reference Power
Measurement
(dB)
Row
#
Synthesizer
Power Level
Setting
(dBm)
Attenuation
in Reference
Arm
(dB)
1
+20
10
0
2
+15
10
0
3
+10
10
0
4
+5
10
0
5
0
10
0
6
adjust per
Step 7e
0
0
10
7
+5
0
0
10
8
0
0
0
10
9
–5
0
0
10
10
–10
0
0
10
Correction
(dB)
Attenuation
in Test Arm
(dB)
D
E
= (C–D)
MA241xxA
Measurement
(dBm)
Difference
Calculation
(dB)
11
Max:
12
Min:
13
Delta (E11 – E12):
Table 12-17.Measurement Results (26 GHz)
A
Reference
Power
Measurement
(dBm)
B
= (A6–A5)
C
= (A+B)
Corrected
Reference Power
Measurement
(dB)
Row
#
Synthesizer
Power Level
Setting
(dBm)
Attenuation
in Reference
Arm
(dB)
1
+20
10
0
2
+15
10
0
3
+10
10
0
4
+5
10
0
5
0
10
0
6
adjust per
Step 7e
0
0
10
7
+5
0
0
10
8
0
0
0
10
9
–5
0
0
10
10
–10
0
0
10
Correction
(dB)
Attenuation
in Test Arm
(dB)
D
E
= (C–D)
MA241xxA
Measurement
(dBm)
Difference
Calculation
(dB)
11
Max:
12
Min:
13
Delta (E11 – E12):
PowerXpert UG
PN: 10585-00020 Rev. C
12-17
12-6
12-18
Linearity Test
Operational Testing for the MA24108A, MA24118A, and MA24126A
PN: 10585-00020 Rev. C
PowerXpert UG
Chapter 13 — Remote Operation
13-1
Introduction
This chapter describes the supported remote programming commands for each power sensor model.
Programming commands are classified into three main groups with the following functions and modes:
• Section 13-3 “General Purpose Commands”
• Section 13-4 “Mode Commands”
• “Continuous Average Mode (CA Mode)”
• “Slot Mode”
• “Scope Mode”
• Section 13-5 “Trigger Commands”
• “Trigger Source”
• “Trigger Level”
• “Trigger Edge”
• “Trigger Delay”
• “Trigger Noise Immunity”
• “Trigger Arming”
The sensor starts up in the HOLD mode (the START command is sent to put the sensor in run mode).
13-2
Programming the Sensor
Send and Receive Format
Every communication with the power sensor must be suffixed with the line feed (LF) character (ASCII 0x0A).
Every response from the sensor is also suffixed with the same character (except when using Microsoft
HyperTerminal, which uses a carriage return as the identifier). The sensor rejects any command without the
line feed character with a NO TERM response. All commands and responses mentioned in this document are
assumed to be suffixed with a new line character. The following considerations must also be observed:
• Command arguments presented in this document are enclosed in angle brackets: <argument>. The angle
brackets are not included as part of the actual argument.
• Floating point numbers are truncated to integers by commands that only use integers as input. For
example, if the number of averages is set as 2000.937, the firmware truncates the number to 2000.
• For the MA24108A, MA24118A, and MA24126A sensors, use only two digits after the decimal in floating
point arguments (except FREQ, which uses four digits after the decimal, and gate parameters, which
allow three digits after decimal).
HyperTerminal
Only the MA24105A, MA24108A, MA24118A, and MA24126A sensors are compatible with Windows
HyperTerminal. When programming the sensor with HyperTerminal, the carriage return is used as the
termination character instead of a new line. The HyperTerminal port should be configured with a baud rate of
9600 bits per second. To properly format the commands and responses for HyperTerminal, the following check
boxes should be checked in Properties | Settings | ASCII Setup:
• Send line ends with line feeds
• Echo typed characters locally
• Append line feeds to incoming line ends
PowerXpert UG
PN: 10585-00020 Rev. C
13-1
13-2
Programming the Sensor
Remote Operation
Time Resolution
The maximum time resolution of the sensor is 10 µs, hence all of the time arguments have a 10 µs resolution.
This does not apply to the MA24105A sensor.
Sampling Rate
The MA24108A, MA24118A, and MA24126A sensors have two sampling rates. For “Continuous Mode” and
Internal “Trigger Source”, the sensor has a sampling time of 6.8288 µs or a sampling frequency of 146.438 kHz.
External “Trigger Source” has a sampling time of 7.3347 µs, or a sampling frequency of 136.338 kHz.
Error Responses
Any unrecognized command is rejected by the sensor with a BAD CMD message. A valid command coupled with
an invalid command is rejected by the sensor with an ERR message. A command failure is also indicated by the
sensor with an ERR message.
Default Sensor Settings
The sensor settings in Table 13-1 apply to the MA24105A.
Table 13-1. General Default Sensor Settings, MA24105A
Setting
Command
Default Value
Mode of Operation FORWARD
REVERSE
Continuous Forward Mode
Continuous Reverse Mode
Measurement Frequency FREQ
0.35 GHz
Number of Averages AVGCNT
1
Range SETRNG
Auto range (0)
The sensor settings in Table 13-2, Table 13-3 and Table 13-4 apply to the MA24108A, MA24118A, MA24126A.
Table 13-2. General Default Sensor Settings, MA24108A, MA24118A, MA24126A
Setting
Command
Default Value
Mode of Operation CHMOD
“Continuous Average Mode (CA Mode)”
(0)
Measurement Frequency FREQ
0.010 GHz
Averaging Algorithm AVGTYP
Moving (0)
Number of Averages AVGCNT
1
Auto Averaging AUTOAVG
Off (0)
Auto Averaging Source AUTOAVGSRC
1
Auto Average Resolution AUTOAVGRES
0.01 (2)
Range SETRNG
Auto range (0)
Table 13-3. Continuous Average Mode Default Sensor Settings, MA24108A, MA24118A, MA24126A
Setting
Command
Default Value
Aperture Time CHAPERT
20 ms
Duty Cycle Correction CWDUTY
13-2
100 %
PN: 10585-00020 Rev. C
PowerXpert UG
Remote Operation
13-2
Programming the Sensor
Table 13-3. Continuous Average Mode Default Sensor Settings, MA24108A, MA24118A, MA24126A
Setting
Command
Default Value
Relative Mode CWREL
Off (0)
Table 13-4. Slot Mode Default Sensor Settings, MA24108A, MA24118A, MA24126A
Setting
Command
Default Value
Number of Slots TSLTPARAMS
8
Slot Width TSLTPARAMS
10 ms
Start Exclusion TSLTPARAMS
0.02 ms
End Exclusion TSLTPARAMS
0.02 ms
Table 13-5. Scope Mode Default Sensor Settings, MA24108A, MA24118A, MA24126A
Setting
Command
Default Value
Capture Time SCOPEPARAMS
Number of Points SCOPEPARAMS
Gate GENABLE
20 ms
200
Disabled (0)
Gate Start GATEPARAMS
0 ms
Gate End GATEPARAMS
20 ms
Fence Start GATEPARAMS
0 ms
Fence End GATEPARAMS
0 ms
Table 13-6. Trigger Default Sensor Settings, MA24108A, MA24118A, MA24126A
Setting
Command
Default Value
Trigger Source TRGSRC
Continuous (0)
Trigger Arm Type TRGARMTYP
Standby (3)
Trigger Level TRGLVL
0 dBm
Trigger Edge TRGEDG
Positive (0)
Trigger Delay TRGDLY
0 ms
Trigger Noise Parameter TRGNOISE
PowerXpert UG
1
PN: 10585-00020 Rev. C
13-3
13-3
General Purpose Commands
13-3
Remote Operation
General Purpose Commands
General purpose commands are used to set/read the general settings of the sensor. These commands are not
mode or trigger dependent. All of the commands for the MA24104A, MA24105A and MA24106A sensors are
confined to this section. Most of the commands in this section are compatible with the MA24108A, MA24118A,
and MA24126A sensors.
START
Description: Sets the sensor to measurement mode from the idle mode.
Syntax: START +LF
Return Value: OK
Remarks: This command should be the first command sent. The sensor sends OK to each START
command. If the sensor is in the HOLD mode, then it will change the mode to the RUN
mode. If it is not in HOLD mode, it will not change the sensor’s mode.
Compatible Sensor: MA24104A, MA24105A, MA24106A, MA24108A, MA24118A, MA24126A
STOP
Description: Sets the power sensor to idle mode.
Syntax: STOP +LF
Return Value: OK
Remarks: This command should be sent before exiting the application.
Compatible Sensor: MA24104A, MA24105A, MA24106A, MA24108A, MA24118A, MA24126A
IDN?
Description: Gets the identification information from the sensor.
Syntax: IDN? +LF
Return Value: ANRITSU, Model #, Serial #, Module Serial #, firmware version
Compatible Sensor: MA24104A, MA24105A, MA24106A, MA24108A, MA24118A, MA24126A
CALDATE
Description: Returns the last calibration date of the sensor.
Syntax: CALDATE +LF
Return Value: Calibration date of the sensor in mm/dd/yyyy format
Compatible Sensor: MA24105A, MA24108A, MA24118A, MA24126A
13-4
PN: 10585-00020 Rev. C
PowerXpert UG
Remote Operation
13-3
General Purpose Commands
PWR?
Description: Gets the current power reading (in dBm) from the sensor output buffer in the continuous
average mode.
Syntax: PWR? +LF
Return Value: Power value in dBm or ERR
Remarks: If an error condition exists, “e” precedes the output and the sensor’s LED turns yellow.
Use the STATUS? command for details about the error.
This command returns an error (“ERR”) if used in slot or scope modes.
This command returns “busy” if used in repeat average mode with immediate trigger (if
the sensor has not completed the averaging cycle).
In simple repeat average mode, it will echo the latest value from the buffer. The buffer
will update only when the averaging cycle is complete.
In moving average mode, it will return the current power reading in the buffer.
Compatible Sensor: MA24104A, MA24105A, MA24106A, MA24108A, MA24118A, MA24126A
PWRALL
Description: Gets all the measurements shown in Return Value
Syntax: PWRALL +LF
Return Value: Forward average power, Crest Factor, Burst Average Manual, Peak Envelop Power,
Reverse Average Power, Reflection Coefficient, Return Loss, Standing Wave Ratio
Remarks: Returns comma separated values in the sequence shown in the return value above.
Compatible Sensor: MA24105A
FREQ
Description: Sets the current calibration factor frequency value for the power sensor.
Syntax: FREQ <freq> +LF
Return Value: OK or ERR
Remarks: The frequency <freq> value is in GHz and must be within the operating limits of the
power sensor.
For the MA24104A and MA24106A, resolution is 0.000001 GHz (1 Hz)
For the MA24105A, “num” is the cal factor frequency value in GHz and must be between
0.35 GHz to 4.0 GHz.
For the MA24105A, MA24108A, MA24118A, and MA24126A, resolution is
0.0001 GHz (100 kHz).
Compatible Sensor: MA24104A, MA24105A, MA24106A, MA24108A, MA24118A, MA24126A
FREQ?
Description: Gets the current calibration factor frequency value of the power sensor.
Syntax: FREQ? +LF
Return Value: Current calibration factor frequency in GHz.
Compatible Sensor: MA24104A, MA24105A, MA24106A, MA24108A, MA24118A, MA24126A
PowerXpert UG
PN: 10585-00020 Rev. C
13-5
13-3
General Purpose Commands
Remote Operation
ZERO
Description: Zeros the power sensor.
Syntax: ZERO +LF
Return Value: OK if zero is successful or ERR if zero fails.
Remarks: Zeroing the sensor is essential for taking accurate readings as it cancels any offsets in the
preamplifiers and channel noise. The sensor should be zeroed without any input RF
power. In case of zero failure, the STATUS? command can be used to retrieve more detail
about the error.
For the MA24105A, zeroing the sensor takes 75 seconds to complete and will take at least
this long to get a response from the sensor.
For all other models, zeroing the sensor takes 20 seconds to complete and will take at
least this long to get a response from the sensor.
Compatible Sensor: MA24104A, MA24105A, MA24106A, MA24108A, MA24118A, MA24126A
TMP?
Description: Gets the current temperature reading from the sensor.
On the MA24105A, gets the current temperature reading from both forward and reverse
temperature sensors. The return value for this reading is a comma separated value (for
example; 25,28).
Syntax: TMP? +LF
Return Value: Current temperature reading of the sensor in degrees Celsius
On the MA24105A, current temperature reading of Forward and Reverse in degrees
Celsius. The return value for this reading is a comma separated value (for example;
return value “25,28” means the forward temperature is 25 degrees Celsius and the
reverse temperature is 28 degrees Celsius).
Compatible Sensor: MA24104A, MA24105A, MA24106A, MA24108A, MA24118A, MA24126A
13-6
PN: 10585-00020 Rev. C
PowerXpert UG
Remote Operation
13-3
General Purpose Commands
STATUS?
Description: Gets the current error status codes from the sensor.
Syntax: STATUS? +LF
Return Value: Error status codes.
Remarks: For the MA24104A and MA24106A, the error status codes are as follows:
Status.b0: ZERO_TEMP_ERROR (Temperature changed more than allowable limit
after zeroing sensor)
Status.b1: Not Used
Status.b2: ADC_CH2_OR (Temperature over range)
Status.b3: ADC_CH3_OR (Detector A over ranged)
Status.b4: ZERO_ERROR_DET_A
Status.b5: ZERO_ERROR_DET_B
Status.b6: TEMP_ERROR (Temperature beyond operating range)
Status.b7: Not Used
For the MA24105A, the error status codes are 16-bit numbers, each bit of which
represents an error:
Bit 0: Temperature change of more than 10 C after zeroing
Bit 1: Operating temperature over range < 0 C or > 60 C
Bit 2: Forward low zeroing error
Bit 3: Forward high zeroing error
Bit 4: Reverse zeroing error
Bit 5: PEP zeroing error
Bit 6: CCDF zeroing error
Bit 7: Forward high over range
Bit 8: Reverse over range
Bit 9: PEP over range
Bit 10: Flash Data Error
For the MA24108A, MA24118A, and MA24126A, the error status codes are 16-bit
numbers, each bit of which represents an error:
Bit 0: Temperature change of more than 10 °C after zeroing
Bit 1: Operating temperature over range < 0 °C or > 60 °C
Bit 2: Detector A zeroing error
Bit 3: Detector B zeroing error
Bit 4: Detector A over range
Compatible Sensor: MA24104A, MA24105A, MMA24106A, MA24108A, MA24118A, MA24126A
HAT
Description: Sets the high aperture time mode.
Syntax: HAT +LF
Return Value: OK or ERR
Remarks: This command will put the sensor in high aperture time mode. In this mode, the A to D
converter integration time is about 160 milliseconds.
Compatible Sensor: MA24104A, MA24106A
PowerXpert UG
PN: 10585-00020 Rev. C
13-7
13-3
General Purpose Commands
Remote Operation
LAT
Description: Sets the low aperture time mode.
Syntax: HAT +LF
Return Value: OK or ERR
Remarks: This command will put the sensor in low aperture time mode. In this mode, the A to D
converter integration time is about 10 milliseconds. This mode is the default mode for the
sensor when powered up.
Compatible Sensor: MA24104A, MA24106A
ASDON
Description: Turns on auto shutdown mode
Syntax: ASDON +LF
Return Value: OK or ERR
Remarks: This command applies when RS232 connectivity is used with battery power. This is the
default mode at power up. In this mode, the sensor will automatically go into sleep mode
to conserve battery power if the RS-232 serial port cable is disconnected from the host.
The sensor will wake up when an active host is reconnected and must be zeroed before
taking measurements.
Compatible Sensor: MA24104A
ASDOFF
Description: Turns off auto shutdown mode
Syntax: ASDOFF +LF
Return Value: OK or ERR
Remarks: This command applies when RS232 connectivity is used with battery power. In this
mode, the sensor will not go into sleep mode if the RS-232 serial port cable is
disconnected from the host.
Compatible Sensor: MA24104A
RST
Description: Resets the sensor to factory default settings.
Syntax: RST +LF
Return Value: OK
Compatible Sensor: MA24105A, MA24108A, MA24118A, MA24126A
CHOLD
Description: Sets the current power sensor state.
Syntax: CHOLD <state> +LF
Return Value: OK or ERR
Remarks: <state> is an integer value that represents a specific mode:
0 – Run
1 – Hold
Compatible Sensor: MA24105A, MA24108A, MA24118A, MA24126A
13-8
PN: 10585-00020 Rev. C
PowerXpert UG
Remote Operation
13-3
General Purpose Commands
CHOLD?
Description: Gets the current power sensor state.
Syntax: CHOLD? +LF
Return Value: An integer value.
Remarks: This command queries the sensor state. Returned value can be:
0 – Run
1 – Hold
Compatible Sensor: MA24105A, MA24108A, MA24118A, MA24126A
SETRNG
Description: Sets the detector range of the sensor.
Syntax: SETRNG <det_range> +LF
Return Value: OK or ERR
Remarks: <det_range> is an integer with the following values:
0 – Auto Range
1 – Channel A (covers the power range from +20 dBm to –7 dBm)
2 – Channel B (covers the power range from –7 dBm to –40 dBm)
For MA24105A, <det_range> is an integer with the following values:
0 – Auto Range
1 – Low Power (covers the power range from +3 dBm to +40 dBm)
2 – High Power (covers the power range from +40 dBm to +51.76 dBm)
Compatible Sensor: MA24105A, MA24108A, MA24118A, MA24126A
SETRNG?
Description: Gets the detector range setting of the sensor.
Syntax: SETRNG? +LF
Return Value: An integer with the following values:
0 – Auto Range
1 – Channel A (covers the power range from +20 dBm to –7 dBm)
2 – Channel B (covers the power range from –7 dBm to –40 dBm)
For MA24105A, an integer with the following values:
0 – Auto Range
1 – Low Power (covers the power range from +3 dBm to +40 dBm)
2 – High Power (covers the power range from +40 dBm to +51.76 dBm)
Compatible Sensor: MA24105A, MA24108A, MA24118A, MA24126A
SAVE
Description: Saves a user defined setup to the power sensor.
Syntax: SAVE <setup> +LF
Return Value: OK or ERR
Remarks: <setup> is an integer from 1 to 10 that is translated into a storage location. Therefore,
there are 10 presets the user can store.ERR is returned if <setup> is out of range.
Compatible Sensor: MA24108A, MA24118A, MA24126A
PowerXpert UG
PN: 10585-00020 Rev. C
13-9
13-3
General Purpose Commands
Remote Operation
DELETE
Description: Deletes all user defined setups in the power sensor.
Syntax: DELETE +LF
Return Value: OK or ERR
Compatible Sensor: MA24108A, MA24118A, MA24126A
RECALL
Description: Recalls one of the 10 user defined setups from the power sensor.
Syntax: RECALL <setup> +LF
Return Value: OK or ERR
Remarks: <setup> is an integer from 1 to 10 that is translated into a storage location. Hence, there
are 10 presets the user can recall from. ERR is returned if <setup> is out of range.
Compatible Sensor: MA24108A, MA24118A, MA24126A
RDBUF
Description: Reads the buffer in Scope and Time Slot modes.
Syntax: RDBUF +LF
Return Value: Current power readings from the sensor buffer separated by commas.
Remarks: This command is used to read out the entire array of points for the recent measurement
run from the sensor output buffer, which contains reading from Scope and Time Slot
modes. The power readings are in mW. The power values are separated by a comma (,)
and the buffer is prefixed and suffixed by $ (the dollar sign) to mark the beginning and
end of the buffer. Each power reading has six digits after the decimal point
(0.000001 mW).
In case of an error, “e” precedes the output. Use the STATUS? command for details
about the error. If the gate (discussed in “Scope Mode”) is enabled, then the gate average
power is also suffixed at the end of the output. For example, for four points with gate
enabled, the RDBUF response is:
$,<P1>,<P2>,<P3>,<P4>,$,<GP>
Time Slot mode with 4 slots will send out the buffer as:
$,-3.233454,0.124355,0.233443, 0.223456,$
Compatible Sensor: MA24108A, MA24118A, MA24126A
13-10
PN: 10585-00020 Rev. C
PowerXpert UG
Remote Operation
13-3
General Purpose Commands
FULLBUF
Description: Sets the full sensor buffer enable.
Syntax: FULLBUF <n> +LF
Return Value: OK or ERR
Remarks: <n> is an integer value that represents a specific mode:
0 – Off
1 – On
This command has effect only if the sensor is internally or externally triggered. If full
buffer is turned ON, the sensor will return the full buffer in triggered mode (default
operation). If full buffer is turned OFF, the sensor only returns the gated average power
value enclosed in the $ (dollar sign). For example: $,3.54546,$
If the sensor is in Slot mode or the gates are turned off, the sensor returns:
$,Sensor triggered, output is disabled,$
In case of an error, “e” followed by the error code precedes the output. For example:
e25$,2.565677,$
or
e25$,Sensor triggered, output is disabled,$
Compatible Sensor: MA24108A, MA24118A, MA24126A
CWDUTY
Description: Sets the duty cycle correction.
Syntax: CWDUTY <duty_correction> +LF
Return Value: OK or ERR
Remarks: <duty_correction> is the duty cycle correction percentage from 0.01 to 100.
For the MA24105A, this correction applies only to Burst Average Manual measurement.
Compatible Sensor: MA24105A, MA24108A, MA24118A, MA24126A
CWDUTY?
Description: Gets the duty cycle correction value.
Syntax: CWDUTY? +LF
Return Value: Duty cycle correction percentage.
Compatible Sensor: MA24105A, MA24108A, MA24118A, MA24126A
CWREL
Description: Sets the CA relative power mode status ON or OFF.
Syntax: CWREL <relative> +LF
Return Value: OK or ERR
Remarks: In the relative power mode, the power is calculated relative to the current power value
when the command is sent. <relative> is an integer with the following values:
0 – Relative mode OFF
1 – Relative mode ON
Compatible Sensor: MA24108A, MA24118A, MA24126A
PowerXpert UG
PN: 10585-00020 Rev. C
13-11
13-3
General Purpose Commands
Remote Operation
CWREL?
Description: Gets the CA relative mode status ON or OFF.
Syntax: CWREL? +LF
Return Value: 0 or 1
Remarks: In the relative power mode, the power is calculated relative to the current power value
when the command is sent. <relative> is an integer with the following values:
0 – Relative mode OFF
1 – Relative mode ON
Compatible Sensor: MA24108A, MA24118A, MA24126A
AVGTYP
Description: Sets the power sensor’s averaging type of Moving or Repeat.
Syntax: AVTYP <average_type> +LF
Return Value: OK or ERR
Remarks: <average_type> is an integer with the following values:
0 – Moving
1 – Repeat mode ON
Compatible Sensor: MA24108A, MA24118A, MA24126A
AVGTYP?
Description: Gets the current power sensor’s averaging type of Moving or Repeat.
Syntax: AVTYP? +LF
Return Value: An integer with the following values:
0 – Moving
1 – Repeat mode ON
Compatible Sensor: MA24108A, MA24118A, MA24126A
AVGCNT
Description: Sets the number of averages in the Continuous, Average, Time Slot, or Scope modes.
Syntax: AVGCNT <num_avgs> +LF
Return Value: OK or ERR
Remarks: Time Slot and Scope modes are applicable only to MA24108A, MA24118A, MA24126A.
Average count is the number of measurements used to calculate the average power stored
in the output buffer of the sensor. The maximum number of averages is 40,000 for up to
200 points. The averaging number is limited by the formula:
Max Averaging Number = 8231936 / points
For MA24105A, Max Averaging Number = 512 / points
In the Auto Average mode, this command is ineffective as the number is set
automatically depending on the power level and resolution required. (There is no Auto
Average for MA24105A).
Compatible Sensor: MA24105A, MA24108A, MA24118A, MA24126A
13-12
PN: 10585-00020 Rev. C
PowerXpert UG
Remote Operation
13-3
General Purpose Commands
AVGCNT?
Description: Gets the number of averages in the Continuous, Average, Time Slot, or Scope modes.
Syntax: AVGCNT? +LF
Return Value: For MA24108A, MA24118A, MA24126A, an integer value between 1 and 40,000.
For MA24105A, an integer value between 1 and 512.
Remarks: The command can also be used in the auto-average mode.
Time Slot and Scope modes applicable only to MA24108A, MA24118A, MA24126A.
Compatible Sensor: MA24105A, MA24108A, MA24118A, MA24126A
AUTOAVG
Description: Sets the Auto Average mode to ON, OFF or AUTO ONCE.
Syntax: AUTOAVG <average_mode> +LF
Return Value: OK or ERR
Remarks: The Auto Average mode depends on three factors, Auto Average Resolution, Capture
Time, and the Auto Average Source, which are set by their own commands as explained
later. <average_mode> is an integer with the following values:
0 – OFF
1 – ON
2 – AUTO ONCE (ON for one iteration only and is turned OFF automatically once the
averaging number is set)
Compatible Sensor: MA24108A, MA24118A, MA24126A
AUTOAVG?
Description: Gets the Auto Average mode of ON, OFF or AUTO ONCE.
Syntax: AUTOAVG? +LF
Return Value: An integer with the following values:
0 – OFF
1 – ON
2 – AUTO ONCE (ON for one iteration only and automatically OFF once the averaging
number is set)
Compatible Sensor: MA24108A, MA24118A, MA24126A
AUTOAVGSRC
Description: Sets the Auto Average Source value for Time Slot and Scope modes.
Syntax: AUTOAVGSRC <average_source> +LF
Return Value: OK or ERR
Remarks: The <average_source> number is calculated from the average power of only one Time
Slot or Scope Point. If the <average_source> value is set out of bounds, auto averaging is
ineffective. For auto averaging to be effective, the auto average source must be set less
than the number of points in scope mode, or set less than the number of slots in slot
mode. AUTOAVGSRC is disabled in CA mode.
Compatible Sensor: MA24108A, MA24118A, MA24126A
PowerXpert UG
PN: 10585-00020 Rev. C
13-13
13-3
General Purpose Commands
Remote Operation
AUTOAVGSRC?
Description: Gets the Auto Average Source value for Time Slot or Scope mode.
Syntax: AUTOAVGSRC? +LF
Return Value: An integer with the auto averaging source value.
Compatible Sensor: MA24108A, MA24118A, MA24126A
AUTOAVGRES
Description: Sets the Auto Average resolution (digits after decimal point).
Syntax: AUTOAVGRES <average_resolution> +LF
Return Value: OK or ERR
Remarks: The <average_resolution> number is set according to the desired resolution. Higher
resolution results in more averaging and slower throughput of data.
<average_resolution> must range from 0 to 3.
Compatible Sensor: MA24108A, MA24118A, MA24126A
AUTOAVGRES?
Description: Gets the Auto Average resolution.
Syntax: AUTOAVGRES? +LF
Return Value: Integer from 0 to 3
Remarks: The Auto Averaging number is set according to the desired resolution. Higher resolution
results in more averaging and slower throughput of data.
Compatible Sensor: MA24108A, MA24118A, MA24126A
AVGRST
Description: Resets the averaging count and clears the averaging buffers.
Syntax: AVGRST +LF
Return Value: OK
Compatible Sensor: MA24105A, MA24108A, MA24118A, MA24126A
FORWARD
Description: Sets the forward measurement mode.
Syntax: FORWARD <num> +LF
Details: num = 1 to 6
Return Value: OK or ERR
Remarks: 1 – Forward Average
2 – Crest Factor
3 – Burst Average Manual
4 – Peak Envelope Power
5 – Burst Average Auto
6 – CCDF
Compatible Sensor: MA24105A
13-14
PN: 10585-00020 Rev. C
PowerXpert UG
Remote Operation
13-3
General Purpose Commands
FORWARD?
Description: Gets the forward measurement mode.
Syntax: FORWARD? +LF
Return Value: num = 1 to 6
Remarks: 1 – Forward Average
2 – Crest Factor
3 – Burst Average Manual
4 – Peak Envelope Power
5 – Burst Average Auto
6 – CCDF
Compatible Sensor: MA24105A
REVERSE
Description: Sets the reverse measurement mode
Syntax: REVERSE <num> +LF
Details: num = 1 to 4
Remarks: 1 – Reverse Average
2 – Reflection Coefficient
3 – Return Loss
4 – Standing Wave Ratio (VSWR)
Compatible Sensor: MA24105A
REVERSE?
Description: Gets the reverse measurement mode
Syntax: REVERSE? +LF
Return Value: num = 1 to 4
Remarks: 1 – Reverse Average
2 – Reflection Coefficient
3 – Return Loss
4 – Standing Wave Ratio (VSWR)
Compatible Sensor: MA24105A
VIDEOBW
Description: Sets the video BW
Syntax: VIDEOBW <num> +LF
Details: num = 0 to 2
Return Value: OK or ERR
Remarks: 0 – Full
1 – 4 kHz
2 – 200 kHz
Compatible Sensor: MA24105A
PowerXpert UG
PN: 10585-00020 Rev. C
13-15
13-3
General Purpose Commands
Remote Operation
VIDEOBW?
Description: Gets the video BW
Syntax: VIDEOBW? +LF
Return Value: num = 0 to 2
Remarks: 0 – Full
1 – 4 kHz
2 – 200 kHz
Compatible Sensor: MA24105A
MODTYPE
Description: Sets the modulation type
Syntax: MODTYPE <num> +LF
Details: num = 0 to 5
Return Value: OK or ERR
Remarks: 0 – NONE
1 – GSM_GPRS_EDGE
2 – WCDMA_HSPA_SINGLE_CARRIER
3 – WCDMA_HSPA_MULTI_CARRIER
4 – ISDB_T
5 – CDMA_IS95_2000_EVDO
Compatible Sensor: MA24105A
MODTYPE?
Description: Gets the modulation type
Syntax: MODTYPE? +LF
Return Value: num = 0 to 5
Remarks: 0 – NONE
1 – GSM_GPRS_EDGE
2 – WCDMA_HSPA_SINGLE_CARRIER
3 – WCDMA_HSPA_MULTI_CARRIER
4 – ISDB_T
5 – CDMA_IS95_2000_EVDO
Compatible Sensor: MA24105A
CCDFTHRESH
Description: Sets the threshold for CCDF
Syntax: CCDFTHRESH <num> +LF
Return Value: OK or ERR
Remarks: <num> is a value in dBm. The range of CCDF threshold values that can be entered is
3 dBm to 54.77 dBm.
Compatible Sensor: MA24105A
13-16
PN: 10585-00020 Rev. C
PowerXpert UG
Remote Operation
13-3
General Purpose Commands
CCDFTHRESH?
Description: Gets the threshold for CCDF
Syntax: CCDFTHRESH <num> +LF
Return Value: Last threshold value
Compatible Sensor: MA24105A
PowerXpert UG
PN: 10585-00020 Rev. C
13-17
13-4
Mode Commands
13-4
Remote Operation
Mode Commands
The power sensor supports the following three modes of operation:
• “Continuous Average Mode (CA Mode)”
• “Slot Mode”
• “Scope Mode”
The power sensor starts up in the “Continuous Average Mode (CA Mode)” mode after the “START” command is
issued and continuously reads power. The “CHMOD” command is issued to change the sensor’s mode of
operation. Mode-specific commands can be issued when the sensor is in any other mode, but will only affect the
sensor operation if the sensor is in the mode for which the command is issued. When the sensor mode is
changed, the parameters/settings get updated automatically.
CHMOD
Description: Sets the current power sensor mode and loads related settings.
Syntax: CHMOD <mode> +LF
Return Value: OK or ERR
Remarks: <mode> is an integer value as follows:
0 – Continuous Average Mode
1 – Time Slot Mode
2 – Scope Mode
3 – Idle Mode
Compatible Sensor: MA24108A, MA24118A, MA24126A
CHMOD?
Description: Gets the current power sensor mode.
Syntax: CHMOD? +LF
Return Value: Integer value as follows:
0 – Continuous Average Mode
1 – Time Slot Mode
2 – Scope Mode
3 – Idle Mode
Compatible Sensor: MA24108A, MA24118A, MA24126A
13-18
PN: 10585-00020 Rev. C
PowerXpert UG
Remote Operation
13-4
Mode Commands
Continuous Average Mode (CA Mode)
CA mode is the default mode of operation. In CA mode, the sensor is continuously triggered and collects data at
all times. Capture time is the only parameter associated with CA mode. The sensor calculates one average
power averaged over the entire capture time. For example, for 20 ms of capture time, the sensor collects 2860
samples (with an approximate142 kHz sampling rate). The CA power is the average of the 2860 samples for
each 20 ms time frame. The power can be read using the “PWR?” command. The related CA mode commands
are listed below.
CHAPERT
Description: Sets the effective capture time (aperture time) for average power measurements.
Syntax: CHAPERT <capture_time> +LF
Return Value: OK or ERR
Remarks: <capture_time> must range from a maximum of 300 ms to a minimum of 0.01 ms and has
a resolution of 0.01 ms.
Compatible Sensor: MA24108A, MA24118A, MA24126A
CHAPERT?
Description: Gets the effective capture time (aperture time) for average power measurements.
Syntax: CHAPERT? +LF
Return Value: Channel aperture time for CA mode in ms.
Compatible Sensor: MA24108A, MA24118A, MA24126A
Slot Mode
Slot mode operation is generally useful when doing measurement on slotted TDMA signals like GSM. The slot
mode breaks up the measurement in time slots and calculates the average power reading for each individual
slot. The slot mode measurement can be continuously triggered, but more often it is internally or externally
triggered. Triggering is discussed in Section 13-5. To set up the sensor in slot mode operation, the following
four parameters must be set:
• Number of Slots: The number of slots is the number of time slots in the measurement. There is one
power reading for each slot, the power reading being the averaged power of all the samples falling within
that slot. The maximum number of slots is 128.
• Slot Width: Slot width is the width of each slot in milliseconds. The minimum slot width is 0.01 ms
(approximately one sample) and the maximum slot width is 100 ms.
• Start Exclusion: Start exclusion is the time in milliseconds that is excluded from the beginning of each
slot for power calculation.
• End Exclusion: End exclusion is the time in milliseconds that is excluded at the end of each slot for
power calculation.
Note
Slot Width x Number of Slots = Total Capture Time. Total Capture Time cannot exceed 300 ms.
The exclusions should not eclipse the entire slot width.
Start Exclusion + End Exclusion must be less than the slot width.
The “TSLTPARAMS” command sends all of the above parameters at once. The “TSLTPARAMS?” command
receives all of the above parameters at once.
PowerXpert UG
PN: 10585-00020 Rev. C
13-19
13-4
Mode Commands
Remote Operation
TSLTPARAMS
Description: Sets all of the slot mode parameters.
Syntax: TSLTPARAMS <num1,num2,num3,num4> +LF
Return Value: OK or ERR
Remarks: The input parameters are comma separated values and must be sent in the correct order
as follows:
num1: Number of Slots
num2: Slot Width
num3: Start Exclusion Time
num4: End Exclusion Time
An asterisk “*” can be used instead of a value if the parameter is not to be changed. For
example, TSLTPARAMS 8,20,*,1 updates the Number of Slots to 8, the Slot Width to
20 ms, the Exclusion End Time to 1 ms. The Exclusion Start Time remains unchanged.
Returns ERR if the input values are out of range.
Compatible Sensor: MA24108A, MA24118A, MA24126A
TSLTPARAMS?
Description: Sets all of the slot mode parameters.
Syntax: TSLTPARAMS? +LF
Return Value: Comma separated string with the following four values:
num1: Number of Slots
num2: Slot Width
num3: Start Exclusion Time
num4: End Exclusion Time
Compatible Sensor: MA24108A, MA24118A, MA24126A
13-20
PN: 10585-00020 Rev. C
PowerXpert UG
Remote Operation
13-4
Mode Commands
Scope Mode
In scope mode, the sensor acts similarly to an oscilloscope in that it can be used to measure power as a function
of time. Two parameters are needed to define the Scope mode operation: the collection period and the number
of data points. In Scope mode, the sensor first waits for a trigger. Once a trigger is received, the sensor collects
data at its sample rate of approximately 142 ksps for the duration of the capture time. This typically results in
a number of samples that exceeds the number of data points requested, and individual samples are then
averaged together to reduce the data set to the requested number of data points.
Gate and Fence
A gate and a fence can be set up to compute the average power of all the points within the gate. The fence
is used to mask the unwanted portion of the gate, but a fence remains entirely within the gate. Any
points falling within the fence are rejected for the average gate power calculation. Setting the fence start
and fence end to zero disables the fence. The gate can be enabled or disabled as desired by using the gate
enable “GENABLE” command. If the gate is enabled, the average power, maximum power, minimum
power and crest within the gate can be queried by using the gate power “GATEVALUES?” query. All
values are based on data points and NOT on the individual raw sample packets in the gate.
Capture Time
The capture time is the total time in milliseconds captured by the sensor in a single run. The maximum
capture time is 300 ms. The capture time can not be made equal to or less than the negative trigger
delay. In case of a conflict between trigger delay and capture time, an error is returned when setting
scope parameters.
Number of Data Points
The number of data points can never be set less than the total number of samples. For a given capture
time, the lower the number of data points, the more samples that are averaged per point, thus the lower
the trace noise. The sensor supports a maximum of 1024 data points if there are enough samples. For
example, 20 ms of capture time results in 2860 samples (~142 KHz sampling frequency). If there are 10
data points, then each data point contains the averaged data of 286 samples. The entire data point array
is read out by the “RDBUF” command as explained in the previous section. Hence, “RDBUF” reads out 10
data point values separated by a comma (,).
Gate Start
Gate start marks the start of the gate in milliseconds with respect to the trigger (start of capture). The
Gate start value can not be negative and it can not exceed the capture time.
Gate End
Gate end marks the end of the gate in milliseconds with respect to the trigger. The Gate end value can
not be less than the Gate start value and it can not exceed the capture time.
Fence Start
Fence start marks the beginning of the fence in milliseconds with respect to the trigger. The fence start
must always be inside the gate (unless the fence is disabled by setting both the fence start and the fence
end to zero).
Fence End
Fence end marks the end of the fence in milliseconds with respect to the trigger. The fence end must
always be between fence start and the Gate end (unless the fence is disabled by setting both the fence
start and the fence end to zero). If the fence start value and the fence end value are the same, then the
fence is ineffective.
The following commands set the Scope mode parameters:
PowerXpert UG
PN: 10585-00020 Rev. C
13-21
13-4
Mode Commands
Remote Operation
SCOPEPARAMS
Description: Sets the scope mode parameters.
Syntax: SCOPEPARAMS <num1,num2> +LF
Return Value: OK or ERR
Remarks: The input parameters are comma separated values and must be sent in the correct order
as follows:
num1: Data Capture Time (maximum 300 ms)
num2: Number of Points
An asterisk “*” can be used instead of a value if the parameter is not to be changed. For
example, SCOPEPARAMS *,4 updates the number of points to 4, while the data capture
time is unchanged. A space is treated as a zero. Returns ERR if the input values are out of
range.
Compatible Sensor: MA24108A, MA24118A, MA24126A
SCOPEPARAMS?
Description: Gets the scope mode parameters.
Syntax: SCOPEPARAMS? +LF
Return Value: Comma separated string with the following two values:
num1: Data Capture Time
num2: Number of Points
Compatible Sensor: MA24108A, MA24118A, MA24126A
GATEPARAMS
This command sets the gate parameters. The parameters are comma separated in the
order: gate start, gate end, fence start, fence end. An asterisk (*) can be used instead of a
value if the user does not want to change that parameter.
Description: Sets the gate parameters.
Syntax: GATEPARAMS <num1,num2,num3,num4> +LF
Return Value: OK or ERR
Remarks: The input parameters are comma separated values (in ms) and must be sent in the
correct order as follows:
num1: Gate Start
num2: Gate End
num3: Fence Start
num4: Fence End
For example, GATEPARAMS 0,20,5,15 updates the Gate Start to 0 ms, the Gate End to
20 ms, the Fence Start to 5 ms, and the Fence End to 15 ms. An asterisk “*” can be used
instead of a value if the parameter is not to be changed. Returns ERR if the input values
are out of range.
Compatible Sensor: MA24108A, MA24118A, MA24126A
13-22
PN: 10585-00020 Rev. C
PowerXpert UG
Remote Operation
13-4
Mode Commands
GATEPARAMS?
Description: Gets the gate parameters.
Syntax: GATEPARAMS? +LF
Return Value: Comma separated string with the following four values:
num1: Gate Start
num2: Gate End
num3: Fence Start
num4: Fence End
Compatible Sensor: MA24108A, MA24118A, MA24126A
GENABLE
Description: Enables or disables the gate.
Syntax: GENABLE <gate> +LF
Return Value: OK or ERR
Remarks: <gate> is an integer with the following values:
0 – Disable
1 – Enable
Returns ERR if <gate> is out of range or if the gate is improperly set up.
Compatible Sensor: MA24108A, MA24118A, MA24126A
GENABLE?
Description: Gets the gate enable/disable status.
Syntax: GENABLE?
Return Value: 0 – Disable
1 – Enabled
Compatible Sensor: MA24108A, MA24118A, MA24126A
GATEVALUES?
Description: Gets the gate average power, peak power, minimum power, and crest for the most recent
scope measurement run (with gate enabled).
Syntax: GATEVALUES?
Return Value: Comma separated string with the following four values:
num1: Average Power (in dBm)
num2: Peak Power (in dBm)
num3: Minimum Power (in dBm)
num4: Crest Power (in dB)
Remarks: All return values are based on data points and NOT on the individual raw sample
packets in the gate. In case of an error, “e” precedes the output. For example:
“e2.453,3.456,5.234,2.435”
Compatible Sensor: MA24108A, MA24118A, MA24126A
PowerXpert UG
PN: 10585-00020 Rev. C
13-23
13-5
13-5
Trigger Commands
Remote Operation
Trigger Commands
Trigger is an event that initiates a measurement. When the sensor is armed, it waits for a trigger. Once the
trigger occurs, the sensor starts data collection, calculation, and averaging to complete a measurement.
Trigger commands must be sent after general setup of the power sensor as the general settings impact the
trigger setup. Before arming the sensor for a trigger, the sensor must be set up with the following trigger
related parameters:
• “Trigger Source”
• “Trigger Level”
• “Trigger Edge”
• “Trigger Delay”
• “Trigger Noise Immunity”
• “Trigger Arming”
“Trigger Arming” commands should be sent to the sensor last and just before triggering because any other type
of command aborts the armed state and places the sensor in standby mode. For Time Slot and Scope modes,
the sensor’s default arming state is standby.
Trigger Source
The power sensor supports four different types of triggers (trigger sources):
Continuous Trigger
When the trigger source is set to continuous, the sensor is continuously collecting data. It does not look
for a trigger and is triggered all the time. Because the sensor is always collecting data, it does not depend
on any other trigger related parameters.
Internal Trigger
If internal trigger source is set, the sensor triggers based on the signal power, edge and noise immunity
factor set in the sensor. These parameters can be set with their respective commands as discussed later.
External Trigger
When the sensor is setup with external trigger, it is triggered by the TTL/CMOS signal on the external
trigger pin. In this trigger source, sensor can be set up to trigger at a particular edge of the TTL/CMOS
signal. External trigger does not depend on any other trigger related parameter.
Bus Trigger
Bus trigger is a manual trigger that allows the user to manually control the trigger by sending the
“TRGIMM” command. The bus trigger is command based and is not set up like the other trigger sources,
and it does not depend on any trigger-related parameters.
All of the trigger sources (except Bus Trigger) work in conjunction with the trigger arm types discussed later. A
trigger setup is incomplete if the sensor is not armed. The trigger source can be set and read with the following
commands:
13-24
PN: 10585-00020 Rev. C
PowerXpert UG
Remote Operation
13-5
Trigger Commands
TRGSRC
Description: Sets the trigger source.
Syntax: TRGSRC <trigger_source> +LF
Return Value: OK or ERR
Remarks: <trigger_source> is an integer with the following values:
0 – Continuous
1 – Internal
2 – External
Compatible Sensor: MA24108A, MA24118A, MA24126A
TRGSRC?
Description: Gets the trigger source.
Syntax: TRGSRC? +LF
Return Value: An integer with the following values:
0 – Continuous
1 – Internal
2 – External
Compatible Sensor: MA24108A, MA24118A, MA24126A
TRGIMM
Description: Triggers the sensor immediately and starts taking new readings.
Syntax: TRGIMM +LF
Return Value: Power reading in dBm or BUSY
Remarks: Once the sensor receives this command, the sensor starts collecting data for the capture
time defined by the sensor’s mode. Once all data collection, calculation, and averaging is
complete, the sensor automatically outputs the power reading and returns to the
previous state (before TRGIMM was received). The sensor is programmed to repeat
averaging if triggered manually, irrespective of the type of average type set in the sensor.
Upon completion, if the sensor is in continuous mode, it outputs one power reading in
dBm (same as the “PWR?” command) and if the sensor is in scope/slot mode, it sends the
entire buffer out (like RDBUF command). If the power is requested (by sending PWR? or
RDBUF commands) before the sensor is done with averaging, the sensor returns BUSY.
There is no need to arm the trigger when using bus trigger.
Compatible Sensor: MA24108A, MA24118A, MA24126A
PowerXpert UG
PN: 10585-00020 Rev. C
13-25
Trigger Level
Trigger level is the power value that triggers the sensor when it is crossed. This parameter has no effect in
continuous, external or bus trigger setups.
TRGLVL
Description: Sets the trigger level in dBm.
Syntax: TRGLVL <trigger_level> +LF
Return Value: OK or ERR
Remarks: <trigger_level> must be from –20 dBm to +20 dBm in 0.01 dB steps.
Compatible Sensor: MA24108A, MA24118A, MA24126A
TRGLVL?
Description: Gets the trigger level in dBm.
Syntax: TRGLVL? +LF
Return Value: Trigger level in dBm
Compatible Sensor: MA24108A, MA24118A, MA24126A
Trigger Edge
Sets the trigger edge for internal and external trigger. Trigger edge can be set to positive or negative.
For internal trigger, the sensor triggers only when the signal crosses the trigger level from high to low when
set to negative; the sensor triggers only when the signal crosses the trigger level from low to high when set to
positive.
For external trigger, the sensor triggers when the TTL signal on the external trigger pin falls from high to low
when set to negative; the sensor triggers when the TTL signal on the external trigger pin rises from low to high
when set to positive.
TRGEDG
Description: Sets the trigger edge.
Syntax: TRGEDG <trigger_edge> +LF
Return Value: OK or ERR
Remarks: <trigger_edge> is an integer with the following values:
0 – Positive
1 – Negative
Compatible Sensor: MA24108A, MA24118A, MA24126A
TRGEDG?
Description: Gets the trigger edge setting.
Syntax: TRGEDG? +LF
Return Value: An integer with the following values:
0 – Positive
1 – Negative
Compatible Sensor: MA24108A, MA24118A, MA24126A
13-26
PN: 10585-00020 Rev. C
PowerXpert UG
Remote Operation
13-5
Trigger Commands
Trigger Delay
Trigger delay is the time in milliseconds between the trigger event and when the sensor starts taking readings.
The trigger delay can be either positive or negative. The trigger delay can be set from –5 ms to 10,000 ms with
a resolution of 0.01 ms.
If the delay is negative, the sensor starts taking the readings before the trigger occurs and the total capture
time includes the negative delay time. For example, for a capture time of 20 ms and a delay of –1 ms, the
length of the capture would be from –1 ms to 19 ms, given the trigger occurs at time, t = 0. The negative delay
can not be greater than or equal to the capture time. If the capture time conflicts with the trigger delay, the
trigger delay command returns an error.
If the delay is positive, the sensor waits for the set delay time after a trigger before it starts taking readings.
The sensor is unresponsive during the wait period and can not be aborted. The capture time is unaffected by a
positive trigger delay.
TRGDLY
Description: Sets the trigger delay in msec
Syntax: TRGDLY <trigger_delay> +LF
Return Value: OK or ERR
Remarks: <trigger_delay> is the trigger delay value in msec and must range from –5 ms to
10,000 ms with a resolution of 0.01 ms.
Compatible Sensor: MA24108A, MA24118A, MA24126A
TRGDLY?
Description: Gets the trigger delay in msec
Syntax: TRGDLY? +LF
Return Value: Trigger delay in ms
Compatible Sensor: MA24108A, MA24118A, MA24126A
PowerXpert UG
PN: 10585-00020 Rev. C
13-27
13-5
Trigger Commands
Remote Operation
Trigger Noise Immunity
When internally triggering on very noisy signals, the sensor can trigger at an undesired point or edge. To
provide immunity against such situations, the sensor can be set to wait for N number of samples to cross the
trigger level before it triggers.
The value of N is the trigger noise immunity factor and is set by the “TRGNOISE” command, where N is a value
from 1 to 10. Higher values of N result in increased noise immunity, but also increase the trigger latency. It is
advised to use a negative trigger delay when using noise immunity. The negative delay required to reduce the
trigger latency is the product of N and the sample duration of the power sensor, which is approximately 7 µs.
TRGNOISE
Description: Sets the trigger noise immunity factor.
Syntax: TRGNOISE <noise> +LF
Return Value: OK or ERR
Remarks: <noise> is an integer from 1 to 10. Higher values of <noise> result in increased noise
immunity, but also increase the trigger latency.
Compatible Sensor: MA24108A, MA24118A, MA24126A
TRGNOISE?
Description: Gets the trigger noise immunity factor.
Syntax: TRGNOISE? +LF
Return Value: An integer from 1 to 10
Compatible Sensor: MA24108A, MA24118A, MA24126A
13-28
PN: 10585-00020 Rev. C
PowerXpert UG
Remote Operation
13-5
Trigger Commands
Trigger Arming
The trigger parameters are effective only if the sensor is armed. Armed is the state when the sensor is waiting
for a trigger. By default, the sensor is in Standby mode and must be armed before it can be triggered. “Trigger
Arming” should be the last command sent to the sensor before triggering as any other type of command aborts
the armed state and places the sensor in standby mode.
When the sensor is armed, it waits for a trigger indefinitely. Once the trigger occurs, the sensor starts data
collection, calculation, and averaging to complete a measurement. The measurement result is sent in dBm (in
CA mode) or in mW (in Time Slot and Scope modes). After setting up the sensor, the sensor can be armed as
follows:
Auto Armed
In this arming state, the sensor is automatically rearmed after one trigger has occurred and the
measurement has been output. Auto Armed is generally used in Time Slot and Scope modes to
continuously monitor the signal.
Single Armed
In this arming state, the sensor is armed only once before the trigger. Once triggered, the sensor
performs the measurement, outputs the result, and returns to the standby mode. The sensor makes N
number of measurement runs and outputs the average power on completion of averaging the N
measurements. N is the averaging number set in the sensor. However, in moving average mode, the
intermediate moving average power is also sent after each measurement run, the last one being the most
accurate as it has the effect of all of the N measurements. The sensor triggers only once and all of the
measurements follow.
Multiarmed
In this arming state, the sensor is automatically rearmed for N number of times after each of N trigger
events, and then the sensor outputs one measurement result at the completion of all triggered events. N
is the number of averages set in the sensor prior to arming (set with the “AVGCNT” command). If there
are N averages set in the sensor, the sensor will look for N triggers, make N measurements and send out
one averaged power for all of the N triggered measurements. However, in moving average mode, the
intermediate, moving average power is also sent after each triggered measurement, the last one being
the most accurate as it has the average of all of the N measurements. For multiarmed triggering, at least
N triggers must occur for the sensor to complete the entire measurement. The sensor is rearmed until it
has received all N number of triggers. Once the measurements are complete, the sensor is set to the
Standby mode.
Standby
In standby mode, the sensor is not waiting for a trigger and is UNARMED.
Trigger arming is effective only in the Internal and External trigger modes. Arming has no effect when the
sensor is continuously triggered.
TRGARMTYP
Description: Sets the trigger arming state.
Syntax: TRGARMTYP <arm_type> +LF
Return Value: OK followed by measurement results, or ERR
Remarks: <arm_type> is an integer with the following values:
0 – “Auto Armed”
1 – “Single Armed”
2 – “Multiarmed”
3 – “Standby”
Compatible Sensor: MA24108A, MA24118A, MA24126A
PowerXpert UG
PN: 10585-00020 Rev. C
13-29
13-5
Trigger Commands
Remote Operation
TRGARMTYP?
Description: Gets the trigger arming state.
Syntax: TRGARMTYP? +LF
Return Value: An integer with the following values:
0 – “Auto Armed”
1 – “Single Armed”
2 – “Multiarmed”
3 – “Standby”
Compatible Sensor: MA24108A, MA24118A, MA24126A
13-30
PN: 10585-00020 Rev. C
PowerXpert UG
Appendix A — Sample Visual Basic Code
A-1
Demo Application
The CD contains a demo application that allows you to interface with the power sensor using the remote
programming protocol. The sample code is written in Microsoft® Visual Basic® 6.0 and is given at the end of
this appendix. The complete project, DemoApp.vbp, is available on the CD that shipped with the sensor. The
Demo Application’s main form is shown below:
Figure A-1.
Demo Application
Anritsu recommends that you use the source code and project available on the CD that shipped with the sensor
to minimize typing errors. You may need to add Microsoft® Comm Control 6.0 manually, which can be added
from Visual Basic® 6.0 IDE by navigating to: Project | Components.
A-2
Using the Demo Application
To launch the Demo Application:
1. Go to the PowerXpert CD home page and click on Open Sample Program Folder. Windows Explorer will
open. Double click on DemoApp.exe. The application screen shown in Figure A-1 will appear.
2. Connect the power sensor to the PC using the USB cable. The sensor shows up as a Serial port device on
the PC. You can find its COM port number using the device manager in the Windows® control panel.
3. Type the COM port number in the ComPortNo: text box and click Initialize.
Once the COM port is initialized, you can type commands in the Command text box, and then click the
Send button. Refer to Chapter 13, “Remote Operation” for a list of available commands. Any responses
from the sensor will be displayed in the Received text box. You can use the Functions group buttons to
exercise the sensor for power readings, frequency readings and settings, and for zeroing sensor.
Note
The Demo Application uses Microsoft Comm Control, which limits COM Port number usage to less
than 16 (COM3 to COM16).
PowerXpert UG
PN: 10585-00020 Rev. C
A-1
A-2
Using the Demo Application
************************************************************************
// This sample program shows how to control an Anritsu USB power sensor using
//Microsoft Visual basic 6.0
Option Explicit
Public gstrInputBuffer As String
'Event handler for InitializeComPort button
Private Sub btnInitializeComPort_Click()
Call SetCommPort(Val(Trim(txtCOMPORTNo.Text)))
End Sub
'Subroutine to set the com port
Public Sub SetCommPort(portNo As Integer)
On Error GoTo errHndler
'Setup MSComm control
MSComm1.Settings = "115200,n,8,1"
MSComm1.CommPort = Trim(txtCOMPORTNo.Text)
MSComm1.PortOpen = True
MSComm1.RThreshold = 1
MSComm1.SThreshold = 1
'
'Wait for half a second before sending START command
Delay (0.5)
'Arm sensor to start making measurements
txtCommand.Text = "START"
Call btnSend_Click
'
Exit Sub
errHndler:
MsgBox ("ERROR: " & Err.Description)
End Sub
'Event handler for ResetComPort button
Private Sub btnResetComPort_Click()
'Close com port
If MSComm1.PortOpen = True Then
MSComm1.PortOpen = False
End If
End Sub
'Event handler for Send button
Private Sub btnSend_Click()
Dim strResult As String
'Clear buffer & receive text window before sending command
gstrInputBuffer = ""
txtReceived.Text = ""
'Send command and appeand Termination character, 0x0A(10)with it.
MSComm1.Output = UCase(txtCommand.Text) & Chr(10)
'Display received result on the Received text box
txtReceived.Text = strResult
'
End Sub
A-2
PN: 10585-00020 Rev. C
PowerXpert UG
A-2
Using the Demo Application
'
'Event handler for MSComm1 event
Private Sub MSComm1_OnComm()
'Get data from Input buffer
gstrInputBuffer = MSComm1.Input
'Display received result on the Received text box
txtReceived.Text = gstrInputBuffer
End Sub
'Event handler for GetFreq button
Private Sub btnGetFreq_Click()
txtCommand.Text = "FREQ?"
Call btnSend_Click
End Sub
'Event handler for GetPower button
Private Sub btnGetPower_Click()
txtCommand.Text = "PWR?"
Call btnSend_Click
End Sub
'Event handler for SetFreq button
Private Sub btnSetFreq_Click()
txtCommand.Text = "FREQ " & txtFreq.Text
Call btnSend_Click
End Sub
'Event handler for ZeroSensor button
Private Sub btnZeroSensor_Click()
txtCommand.Text = "ZERO"
Call btnSend_Click
'Sensor will return OK after about 19 Seconds
End Sub
'Event handler for Close button
Private Sub btnClose_Click()
'
'Make sure we close the com port before we exit the app
If MSComm1.PortOpen = True Then
'Stop sensor from making measurements
txtCommand.Text = "STOP"
Call btnSend_Click
'
'Wait for half a second after sending START command
Delay (0.5)
'
MSComm1.PortOpen = False
End If
'Close the app
End
End Sub
PowerXpert UG
PN: 10585-00020 Rev. C
A-3
A-2
Using the Demo Application
'Delay routine
Public Sub Delay(ByVal Seconds As Single)
'
Dim fStartTimer As Single
Dim fFinish
As Single
'
fStartTimer = Timer
'
Do
DoEvents
fFinish = Timer
If Abs(fFinish - fStartTimer) > Seconds Then
Exit Do
End If
Loop
'
End Sub
************************************************************************
A-4
PN: 10585-00020 Rev. C
PowerXpert UG
Appendix B — Upgrading the Firmware
B-1
Introduction
The Anritsu PowerXpert™ application provides the necessary software to upgrade the Anritsu USB power
sensor firmware. Follow the correct procedure for your sensor model as described in the following sections:
• Section B-2 “MA24104A, and MA24106A Firmware Upgrade”
• Section B-3 “MA24105A, MA24108A, MA24118A, and MA24126A Firmware Upgrade”
The current sensor firmware can be determined by expanding the Sensor Information list in PowerXpert.
B-2
MA24104A, and MA24106A Firmware Upgrade
Warning
Before launching the firmware upgrade utility, make sure that you have the firmware file available.
Failure to complete the firmware installation will render the power sensor inoperable.
1. Download the latest firmware upgrade files from http://www.us.anritsu.com and save them in a
recoverable location.
2. Note the COM port number to which the power sensor is connected. This can be determined by expanding
the Sensor Information list in PowerXpert.
3. Launch the Update Firmware command from the Tools menu.
4. Click Yes to update the firmware:
Figure B-1.
Update Firmware Warning
5. Connect to the power sensor as follows:
a. Disconnect and reconnect the USB cable from the power sensor.
b. For the MA24104A, press and hold the power button on the sensor for three seconds to turn the
sensor On.
Figure B-2.
Firmware Upgrade Dialog (MA24104A left, MA24106A, right)
6. If this is the first time that you are upgrading the sensor’s firmware, you will need to install the power
sensor upgrade driver when the Windows Found New Hardware wizard starts before continuing with
this procedure. If the upgrade drivers have already been installed, continue to Step 8.
PowerXpert UG
PN: 10585-00020 Rev. C
B-1
B-2
MA24104A, and MA24106A Firmware Upgrade
7. The power sensor upgrade driver installation is similar to the power sensor driver installation detailed in
Chapter 2, “Installing Power Sensor Drivers” except that, during the upgrade driver installation,
Windows will ask for the path of the driver file to install mchpusb.sys (mchpusb64.sys for 64-bit
systems). During this step, browse to the program installation directory:
C:\Program Files\Anritsu\PowerXpert\Drivers
Select the file and complete the upgrade driver installation.
Figure B-3.
Windows Locate File Dialog
8. Click OK to continue with the firmware upgrade procedure.
Figure B-4.
Note
B-2
Firmware Upgrade Dialog
If the firmware upgrade utility does not start automatically, start it from:
C:\Program Files\Anritsu\PowerXpert\MA2410xxFirmwareUpgradeApp.exe
PN: 10585-00020 Rev. C
PowerXpert UG
B-2
MA24104A, and MA24106A Firmware Upgrade
9. Select the power sensor that you intend to upgrade from the drop-down list box.
Figure B-5.
Firmware Upgrade Application
10. Click Load Hex File and select the HEX file from the directory in which it was saved.
Figure B-6.
Warning
Open File Dialog
Do Not disconnect the power sensor from the USB port or interrupt the firmware write sequence as
this will cause an unrecoverable programming error and render the power sensor inoperable.
PowerXpert UG
PN: 10585-00020 Rev. C
B-3
B-2
MA24104A, and MA24106A Firmware Upgrade
11. Click Program Device. The following messages will be displayed during the program operation:
MESSAGE - Programming FLASH Completed
MESSAGE - Erasing and Programming FLASH...
Figure B-7.
Firmware Upgrade Application
12. Connect to the power sensor as follows:
a. Disconnect, and then reconnect the USB cable from the power sensor.
b. For the MA24104A, press and hold the power button on the sensor for three seconds to turn the
sensor On (note that the LED will illuminate).
13. If the status light of the power sensor is green, the sensor is programmed successfully and the Anritsu
PowerXpert application automatically detects the upgraded sensor.
B-4
PN: 10585-00020 Rev. C
PowerXpert UG
B-3
B-3
MA24105A, MA24108A, MA24118A, and MA24126A Firmware Upgrade
MA24105A, MA24108A, MA24118A, and MA24126A Firmware Upgrade
1. Download the appropriate firmware upgrade file depending upon the sensor model number from:
http://www.us.anritsu.com and save them in a recoverable location.
Before launching the firmware upgrade utility, make sure that you have the sensor firmware file
available. Failure to complete the firmware installation will render the power sensor inoperable.
Warning
Earlier versions of the MA24108A and MA24118A power sensors used an Atmel upgrade driver. This
driver must first be uninstalled from the USB devices listed in Windows Device Manager before
upgrading the firmware. See “Removing Old Upgrade Driver” on page B-7.
2. Launch PowerXpert.
3. Launch the Update Firmware command from the Tools menu.
When this command is sent to the sensor, the sensor goes into upgrade mode and the status LED turns
yellow. The LED must turn yellow before continuing with the following steps.
4. Click Yes to update the firmware:
Figure B-8.
Update Firmware Warning
If this is the first time that you are upgrading the sensor’s firmware, you need to install the
“Anritsu Sensor Upgrade Driver” when the Windows Found New Hardware wizard starts before
continuing with this procedure. If the upgrade mode drivers are not installed for the power sensor,
install the drivers before clicking OK in the dialog box shown above. If OK is clicked before the
drivers are installed, the COM port of the sensor will not be enumerated in the upgrade utility and the
upgrade utility will need to be manually launched from the application folder after installing the
drivers.
Note
The power sensor upgrade driver installation is similar to the power sensor driver installation detailed
in “Installing Power Sensor Drivers” on page 2-5 except that the sensor will be identified as
“Anritsu Sensor Upgrade Driver”. The system should automatically find the driver and install it after a
warning.
Windows 7 operating system: the “Anritsu Sensor Upgrade Driver” is referred to as
“GPS camera detect” by the OS because of a conflict in the drivers. The SAM-BA functionality
remains unaffected.
5. Disconnect and reconnect the USB cable from the power sensor.
Figure B-9.
Update Firmware Dialog
PowerXpert UG
PN: 10585-00020 Rev. C
B-5
B-3
MA24105A, MA24108A, MA24118A, and MA24126A Firmware Upgrade
6. If the upgrade drivers have already been installed, continue to Step 7.
Note
If the SAM-BA firmware upgrade utility does not start automatically, start it from:
C:\Program Files\Anritsu\PowerXpert\SensorUpgradeUtility.exe
7. In the SAM-BA dialog, configure your connection and board as follows:
Figure B-10. SAM-BA Configuration Dialog
The SAM-BA firmware upgrade utility requires that the serial ports between COM2 and COM49 be
used. You can find out the COM port number by going to:
Start | Settings | Control Panel | System | Hardware | Device Manager | Ports (COM & LPT).
Note
If the assigned COM port for the “Anritsu Sensor Upgrade Driver” is COM50 or greater, then the
COM port number must be reassigned to less than COM50 and the SAM-BA firmware upgrade utility
must be relaunched from C:\Program Files\Anritsu\PowerXpert\SensorUpgradeUtility.exe.
Refer to Appendix C for additional information.
a. Select or type the connection: COMX, where X is the COM port number to which the upgrade mode
sensor is connected. The COM port number can be checked from the Windows Device Manager. If
you do not see the sensor listed in the Device Manager | Ports, see “Removing Old Upgrade Driver”
on page B-7.
b. Select your board: USB_POWER_SENSOR
c. Click Connect to launch the SAM-BA firmware upgrade utility.
8. Click Yes in the External RAM init. dialog.
Figure B-11. External RAM init. Dialog
B-6
PN: 10585-00020 Rev. C
PowerXpert UG
B-3
MA24105A, MA24108A, MA24118A, and MA24126A Firmware Upgrade
9. In the SAM-BA firmware upgrade utility shown in Figure B-12, do the following:
a. In the Send File Name field, browse for the latest firmware file downloaded from the Anritsu Web
site (MA24108A.bin or MA24118A.bin).
b. Click Send File (a Sending File status message should pop up).
c. After the bin file is sent, click No in the Lock region(s) to lock pop-up dialog.
d. In the scripts group box, select Boot from flash (GPNVM 2), and then click Execute.
a
b
d
c
Figure B-12. SAM-BA Firmware Upgrade Utility
10. Close the SAM-BA interface and disconnect the sensor from the USB cable.
11. Reconnect the sensor. If the status light is green, the sensor is programmed successfully and the Anritsu
PowerXpert application automatically detects the upgraded sensor.
Removing Old Upgrade Driver
Use this procedure if you need to remove earlier installations of an Anritsu PowerXpert sensor upgrade driver.
Once you click the upgrade button and disconnect and reconnect the sensor, the sensor should show up as
Anritsu Sensor Upgrade Driver in Device Manager | Ports. If it does not show up in the list and does not ask for
a driver, remove the old drivers.
The old driver can be seen in Device Manager | Universal Device Controllers listed as atm6124.sys ATMEL
AT91xxxxx Test Board when you connect a sensor in upgrade mode. Right click this item and select Uninstall to
remove this driver. Disconnect the sensor and reconnect the sensor connect again. The system should look for
the driver. Complete the driver installation as mentioned in the note with Step 5 on page B-5. You should now
see the sensor listed as Anritsu Sensor Upgrade Driver in Device Manager | Ports and be able to complete the
sensor firmware upgrade.
PowerXpert UG
PN: 10585-00020 Rev. C
B-7
B-3
B-8
MA24105A, MA24108A, MA24118A, and MA24126A Firmware Upgrade
PN: 10585-00020 Rev. C
PowerXpert UG
Appendix C — USB/Serial Port Compatibility
C-1
Introduction
The SAM-BA upgrade utility requires that the serial ports between COM2 and COM49 are used. You can find
out the COM port number by going to Start | Settings | Control Panel | System | Hardware | Device Manager |
Ports (COM & LPT). Disconnect and reconnect the power sensor’s USB cable from the computer and notice the
new COM port number that appears in the Ports list.
Figure C-1.
Device Manager
If this number is less than 49, then the PC application will work fine. However, in some cases when the power
sensor is connected, Windows may map your serial port to a port number greater than 49, such as COM51 or
COM52 depending on which USB port that is being used. If you connect your power sensor and the SAM-BA
upgrade utility displays No Sensor, a port number above COM49 may be assigned. To correct this problem, you
will need to follow one of the three options outlined below. Whichever method you use, you should only need to
perform the procedure once.
• Method 1–Download Updated Software
• Method 2–Trying a Different USB Port
• Method 3–Remapping a Serial Port
PowerXpert UG
PN: 10585-00020 Rev. C
C-1
C-2
Method 1–Download Updated Software
C-2
Method 1–Download Updated Software
The preferred method for resolving serial port compatibility issues is to download software updates for your
product from www.us.anritsu.com.
C-3
Method 2–Trying a Different USB Port
1. Disconnect the USB end of your power sensor from your computer (or USB hub).
2. Connect the USB power sensor to a different USB port on your computer. Connecting to a USB hub tends
to increase the port numbers, so connecting directly to the computer’s USB port usually provides the best
result.
3. Open the Device manager to see if the new port assignment is between COM2 and COM49. If it is NOT,
return to step 1 and connect to a different USB port. If the port assignment is between COM2 and
COM49, the problem has been resolved and no further action is required.
C-4
Method 3–Remapping a Serial Port
A serial port may be remapped to a different number, such as changing a serial port from COM19 to COM5.
This may be needed if the methods above do not result in a serial port assignment between COM2 and COM49
or if you prefer to use a USB hub or a specific USB port on your computer.
1. Open the System Properties by going to Start | Settings | Control Panel | System, or simultaneously
pressing the Windows and Pause keys.
2. Select the Hardware tab and click the Device Manager button to open the Device Manager.
Figure C-2.
C-2
System Properties
PN: 10585-00020 Rev. C
PowerXpert UG
C-2
Method 1–Download Updated Software
3. Click the + box next to Ports (COM & LPT) to expand the installed ports list.
Figure C-3.
Device Manager
4. Select the port that is assigned to the power sensor. Disconnect and reconnect the sensor and notice the
new COM port number that appears. The new port is the current port assignment for the power sensor.
5. Right-click on the new port assigned in step 4 above and select Properties from the pop-up menu to
display the properties for that port.
6. Click the Port Settings tab of the properties window.
7. Click the Advanced button to show the advanced property settings for the port.
Figure C-4.
Advanced Settings for COM Port
PowerXpert UG
PN: 10585-00020 Rev. C
C-3
C-2
Method 1–Download Updated Software
8. Select a COM Port Number in the range of 1 through 16. If possible, select a port which is NOT marked as
“in use” in the COM Port Number list. If all of the ports are marked as being in use, select port number
16 unless you know for sure that something is actually using COM16.
9. You will get an alert when you close the window telling you that the COM port number may be in use by
another device and asking if you want to continue. Click Yes to continue.
Figure C-5.
Device Manager
10. Close all windows that you have opened up.
C-4
PN: 10585-00020 Rev. C
PowerXpert UG
A to I
Index
A
adapter, cable . . . . . . . . . . . . . . . . . . . . . . . . . . . . 1-2
aperture time . . . . . . . . . . . . . . . . . . . . . . . . . . . 3-11
HAT . . . . . . . . . . . . . . . . . . . . . . . . . . . . . . . . 3-11
LAT . . . . . . . . . . . . . . . . . . . . . . . . . . . . . . . . 3-11
MA24108A, 118A, 126A . . . . . . . . . . . . . . . . 3-12
application demo . . . . . . . . . . . . . . . . . . . . . . . . . . A-1
ASDOFF . . . . . . . . . . . . . . . . . . . . . . . . . . . . . . . 13-8
ASDON . . . . . . . . . . . . . . . . . . . . . . . . . . . . . . . . 13-8
auto shutdown . . . . . . . . . . . . . . . . . . . . . . . . . . . 5-1
averaging
MA24104A . . . . . . . . . . . . . . . . . . . . . . . . . . . 5-6
MA24105A . . . . . . . . . . . . . . . . . . . . . . . . . . . 7-6
MA24106A . . . . . . . . . . . . . . . . . . . . . . . . . . . 9-6
MA24108A, 118A, 126A . . . . . . . . . . . . . . . . 11-6
averaging table
MA24104A . . . . . . . . . . . . . . . . . . . . . . . . . . . 5-5
MA24105A . . . . . . . . . . . . . . . . . . . . . . . . . . . 7-5
MA24106A . . . . . . . . . . . . . . . . . . . . . . . . . . . 9-4
MA24108A, 118A, 126A . . . . . . . . . . . . . . . . 11-4
B
battery, MA24104A . . . . . . . . . . . . . . . . . . . . . . . 5-1
C
cable
coaxial . . . . . . . . . . . . . . . . . . . . . . . . . . . . . . . 1-2
USB . . . . . . . . . . . . . . . . . . . . . . . . . . . . . . . . . 1-2
calibrating the sensor
MA24104A . . . . . . . . . . . . . . . . . . . . . . . . . . . 5-4
MA24105A . . . . . . . . . . . . . . . . . . . . . . . . . . . 7-4
MA24106A . . . . . . . . . . . . . . . . . . . . . . . . . . . 9-3
MA24108A, 118A, 126A . . . . . . . . . . . . . . . . 11-3
calibration factor correction
MA24104A . . . . . . . . . . . . . . . . . . . . . . . . . . . 5-4
MA24105A . . . . . . . . . . . . . . . . . . . . . . . . . . . 7-4
MA24106A . . . . . . . . . . . . . . . . . . . . . . . . . . . 9-3
MA24108A, 118A, 126A . . . . . . . . . . . . . . . . 11-3
CD, installation . . . . . . . . . . . . . . . . . . . . . . . . . . . 2-2
cleaning . . . . . . . . . . . . . . . . . . . . . . . . . . . . . . . . . 4-7
coaxial cable . . . . . . . . . . . . . . . . . . . . . . . . . . . . . 1-2
compatibility, of serial port . . . . . . . . . . . . . . . . . C-1
connecting, DUT
MA24104A . . . . . . . . . . . . . . . . . . . . . . . . . . . 5-3
MA24105A . . . . . . . . . . . . . . . . . . . . . . . . . . . 7-4
MA24106A . . . . . . . . . . . . . . . . . . . . . . . . . . . 9-2
MA24108A, 118A, 126A . . . . . . . . . . . . . . . . 11-2
connectors
care . . . . . . . . . . . . . . . . . . . . . . . . . . . . . . . . . .4-2
cleaning . . . . . . . . . . . . . . . . . . . . . . . . . . . . . .4-7
disconnection . . . . . . . . . . . . . . . . . . . . . . . . . .4-3
of sensor MA241014A . . . . . . . . . . . . . . . . . . .5-1
of sensor MA24105A . . . . . . . . . . . . . . . . . . . .7-1
of sensor MA24106A . . . . . . . . . . . . . . . . . . . .9-1
of sensor MA24108A, 118A, 126A . . . . . . . . .11-1
teflon tuning washers . . . . . . . . . . . . . . . . . . .4-2
visual inspection . . . . . . . . . . . . . . . . . . . . . . .4-4
contact Anritsu . . . . . . . . . . . . . . . . . . . . . . . . . . . .1-4
contents, shipping . . . . . . . . . . . . . . . . . . . . . . . . .1-2
correction, calibration factor
MA24104A . . . . . . . . . . . . . . . . . . . . . . . . . . . .5-4
MA24105A . . . . . . . . . . . . . . . . . . . . . . . . . . . .7-4
MA24106A . . . . . . . . . . . . . . . . . . . . . . . . . . . .9-3
MA24108A, 118A, 126A . . . . . . . . . . . . . . . .11-3
D
demo application . . . . . . . . . . . . . . . . . . . . . . . . . A-1
directivity uncertainty . . . . . . . . . . . . . . . . . . . . . .7-8
driver, installation . . . . . . . . . . . . . . . . . . . . . . . . .2-1
DUT, connecting
MA24104A . . . . . . . . . . . . . . . . . . . . . . . . . . . .5-3
MA24105A . . . . . . . . . . . . . . . . . . . . . . . . . . . .7-4
MA24106A . . . . . . . . . . . . . . . . . . . . . . . . . . . .9-2
MA24108A, 118A, 126A . . . . . . . . . . . . . . . .11-2
E
error messages . . . . . . . . . . . . . . . . . . . . . . . . . .11-11
error states
MA24104A . . . . . . . . . . . . . . . . . . . . . . . . . . .5-10
MA24105A . . . . . . . . . . . . . . . . . . . . . . . . . . .7-10
MA24106A . . . . . . . . . . . . . . . . . . . . . . . . . . . .9-9
MA24108A, 118A, 126A . . . . . . . . . . . . . . .11-11
F
frequency response test
MA24104A . . . . . . . . . . . . . . . . . . . . . . . . . . . .6-6
MA24105A . . . . . . . . . . . . . . . . . . . . . . . . . . . .8-7
MA24106A . . . . . . . . . . . . . . . . . . . . . . . . . . .10-4
MA24108A, 118A, 126A . . . . . . . . . . . . . . . .12-4
G
gauge, pin depth . . . . . . . . . . . . . . . . . . . . . . . . . . .4-6
H
HAT . . . . . . . . . . . . . . . . . . . . . . . . . . . . . . . . . . . .13-7
I
inspection . . . . . . . . . . . . . . . . . . . . . . . . . . . . . . . .4-4
installation . . . . . . . . . . . . . . . . . . . . . . . . . . . . . . .2-1
IPA . . . . . . . . . . . . . . . . . . . . . . . . . . . . . . . . . 4-2, 4-7
isopropyl alcohol . . . . . . . . . . . . . . . . . . . . . . . . . . .4-7
PowerXpert UG
PN: 10585-00020 Rev. C
Index-1
L to S
L
LAT . . . . . . . . . . . . . . . . . . . . . . . . . . . . . . . . . . . 13-8
linearity test
MA24104A . . . . . . . . . . . . . . . . . . . . . . . . . . . 6-8
MA24105A . . . . . . . . . . . . . . . . . . . . . . . . . . . 8-9
MA24106A . . . . . . . . . . . . . . . . . . . . . . . . . . 10-6
MA24108A, 118A, 126A . . . . . . . . . . . . . . . . 12-7
links
contacting Anritsu . . . . . . . . . . . . . . . . . . . . . 1-4
product page . . . . . . . . . . . . . . . . . . . . . . . . . . 1-4
M
MA241xxA
inspection . . . . . . . . . . . . . . . . . . . . . . . . . . . . 1-2
installation . . . . . . . . . . . . . . . . . . . . . . . . . . . 2-1
product contents . . . . . . . . . . . . . . . . . . . . . . . 1-2
serial number . . . . . . . . . . . . . . . . . . . . . . . . . 1-3
settings . . . . . . . . . . . . . . . . . . . . . . . . . . . . . . 3-2
mapping serial port . . . . . . . . . . . . . . . . . . . . . . . . C-2
measurements
MA24104A . . . . . . . . . . . . . . . . . . . . . . . . . . . 5-1
MA24105A . . . . . . . . . . . . . . . . . . . . . . . . . . . 7-2
MA24106A . . . . . . . . . . . . . . . . . . . . . . . . . . . 9-1
MA24108A, 118A, 126A . . . . . . . . . . . . . . . . 11-1
mismatch uncertainty . . . . . . . . . . . . . . . . . . . . . 5-8
multitone signal measurements
MA24104A . . . . . . . . . . . . . . . . . . . . . . . . . . . 5-6
MA24105A . . . . . . . . . . . . . . . . . . . . . . . . . . . 7-6
MA24106A . . . . . . . . . . . . . . . . . . . . . . . . . . . 9-6
MA24108A, 118A, 126A . . . . . . . . . . . . . . . . 11-5
N
negative pin depth . . . . . . . . . . . . . . . . . . . . . . . . 4-5
noise
MA24104A . . . . . . . . . . . . . . . . . . . . . . . . . . . 5-6
MA24105A . . . . . . . . . . . . . . . . . . . . . . . . . . . 7-6
MA24106A . . . . . . . . . . . . . . . . . . . . . . . . . . . 9-6
MA24108A, 118A, 126A . . . . . . . . . . . . . . . . 11-6
number, serial . . . . . . . . . . . . . . . . . . . . . . . . . . . . 1-3
O
operational test
MA24104A . . . . . . . . . . . . . . . . . . . . . . . . . . . 6-1
MA24105A . . . . . . . . . . . . . . . . . . . . . . . . . . . 8-1
MA24106A . . . . . . . . . . . . . . . . . . . . . . . . . . 10-1
MA24108A, 118A, 126A . . . . . . . . . . . . . . . . 12-1
optimizing readings
MA24104A . . . . . . . . . . . . . . . . . . . . . . . . . . . 5-4
MA24105A . . . . . . . . . . . . . . . . . . . . . . . . . . . 7-4
MA24106A . . . . . . . . . . . . . . . . . . . . . . . . . . . 9-3
MA24108A, 118A, 126A . . . . . . . . . . . . . . . . 11-3
P
part number
coaxial cable . . . . . . . . . . . . . . . . . . . . . . . . . . 1-2
software CD . . . . . . . . . . . . . . . . . . . . . . . . . . 1-2
USB cable . . . . . . . . . . . . . . . . . . . . . . . . . . . . 1-2
Index-2
pin depth
negative pin depth . . . . . . . . . . . . . . . . . . . . . .4-5
power measurement
MA24104A . . . . . . . . . . . . . . . . . . . . . . . . . . . .5-2
MA24105A . . . . . . . . . . . . . . . . . . . . . . . . . . . .7-2
MA24106A . . . . . . . . . . . . . . . . . . . . . . . . . . . .9-1
MA24108A, 118A, 126A . . . . . . . . . . . . . . . . .11-1
power measurementMA24106A . . . . . . . . . . . . . .9-1
power sensor
cleaning . . . . . . . . . . . . . . . . . . . . . . . . . . 4-2, 4-7
power sensor precautions
clean connectors . . . . . . . . . . . . . . . . . . . . . . . .4-2
ESD sensitivity . . . . . . . . . . . . . . . . . . . . . . . .4-1
excess power . . . . . . . . . . . . . . . . . . . . . . . . . . .4-1
mechanical shock . . . . . . . . . . . . . . . . . . . . . . .4-1
over-torque . . . . . . . . . . . . . . . . . . . . . . . . . . . .4-1
USB connector . . . . . . . . . . . . . . . . . . . . . . . . .4-2
R
remapping serial port . . . . . . . . . . . . . . . . . . . . . . C-2
required equipment, for test
MA24104A . . . . . . . . . . . . . . . . . . . . . . . . . . . .6-2
MA24105A . . . . . . . . . . . . . . . . . . . . . . . . . . . .8-2
MA24106A . . . . . . . . . . . . . . . . . . . . . . . . . . .10-2
MA24108A,118A, 126A . . . . . . . . . . . . . . . . .12-2
requirements
hardware . . . . . . . . . . . . . . . . . . . . . . . . . . . . .2-1
software . . . . . . . . . . . . . . . . . . . . . . . . . . . . . .2-1
return loss, connectors . . . . . . . . . . . . . . . . . . . . . .4-5
RF connector precautions
alignment before connecting . . . . . . . . . . . . . .4-2
checking pin depth . . . . . . . . . . . . . . . . . . . . . .4-2
handle with care . . . . . . . . . . . . . . . . . . . . . . . .4-2
handling . . . . . . . . . . . . . . . . . . . . . . . . . . . . . .4-2
keeping connectors clean . . . . . . . . . . . . . . . . .4-2
protective covers . . . . . . . . . . . . . . . . . . . . . . . .4-2
storage . . . . . . . . . . . . . . . . . . . . . . . . . . . . . . .4-2
torque . . . . . . . . . . . . . . . . . . . . . . . . . . . . . . . .4-2
RS232
interface . . . . . . . . . . . . . . . . . . . . . . . . . . . . . .5-1
S
Safety Symbols
For Safety . . . . . . . . . . . . . . . . . . . . . . . . Safety-2
In Manuals . . . . . . . . . . . . . . . . . . . . . . . Safety-1
On Equipment . . . . . . . . . . . . . . . . . . . . Safety-1
sample VB code . . . . . . . . . . . . . . . . . . . . . . . . . . . A-1
sensor calibration
MA24104A . . . . . . . . . . . . . . . . . . . . . . . . . . . .5-4
MA24105A . . . . . . . . . . . . . . . . . . . . . . . . . . . .7-4
MA24106A . . . . . . . . . . . . . . . . . . . . . . . . . . . .9-3
MA24108A, 118A, 126A . . . . . . . . . . . . . . . . .11-3
sensor zero failed . . . . . . . . . . . . . . . . . . . . . . . . .5-10
PN: 10585-00020 Rev. C
PowerXpert UG
T to Z
sensor zeroing
MA24104A . . . . . . . . . . . . . . . . . . . . . . . . . . . 5-4
MA24105A . . . . . . . . . . . . . . . . . . . . . . . . . . . 7-4
MA24106A . . . . . . . . . . . . . . . . . . . . . . . . . . . 9-3
MA24108A, 118A, 126A . . . . . . . . . . . . . . . . 11-2
serial number . . . . . . . . . . . . . . . . . . . . . . . . . . . . 1-3
serial port . . . . . . . . . . . . . . . . . . . . . . . . . . . . . . . C-1
configuration . . . . . . . . . . . . . . . . . . . . . . . . . C-2
remapping . . . . . . . . . . . . . . . . . . . . . . . . . . . . C-2
settings . . . . . . . . . . . . . . . . . . . . . . . . . . . . . . . . . 3-2
sensor . . . . . . . . . . . . . . . . . . . . . . . . . . . . . . . 3-2
settling time
MA24104A . . . . . . . . . . . . . . . . . . . . . . . . . . . 5-7
MA24105A . . . . . . . . . . . . . . . . . . . . . . . . . . . 7-6
MA24106A . . . . . . . . . . . . . . . . . . . . . . . . . . . 9-7
MA24108A, 118A, 126A . . . . . . . . . . . . . . . . 11-6
shipment . . . . . . . . . . . . . . . . . . . . . . . . . . . . . . . . 1-4
shipping contents . . . . . . . . . . . . . . . . . . . . . . . . . 1-2
shutdown, auto . . . . . . . . . . . . . . . . . . . . . . . . . . . 5-1
sleep function . . . . . . . . . . . . . . . . . . . . . . . . . . . . 5-1
software update . . . . . . . . . . . . . . . . . . . . . . . . . . C-2
storage . . . . . . . . . . . . . . . . . . . . . . . . . . . . . . . . . . 1-4
T
table, averaging
MA24104A . . . . . . . . . . . . . . . . . . . . . . . . . . . 5-5
MA24105A . . . . . . . . . . . . . . . . . . . . . . . . . . . 7-5
MA24106A . . . . . . . . . . . . . . . . . . . . . . . . . . . 9-4
MA24108A, 118A, 126A . . . . . . . . . . . . . . . . 11-4
teflon tuning washers . . . . . . . . . . . . . . . . . . . . . . 4-2
temperature
out of range . . . . . . . . . . . . . . . . . . . . . . . . . . 5-10
test, frequency response
MA24104A . . . . . . . . . . . . . . . . . . . . . . . . . . . 6-6
MA24105A . . . . . . . . . . . . . . . . . . . . . . . . . . . 8-7
MA24106A . . . . . . . . . . . . . . . . . . . . . . . . . . 10-4
MA24108A, 118A, 126A . . . . . . . . . . . . . . . . 12-4
test, linearity
MA24104A . . . . . . . . . . . . . . . . . . . . . . . . . . . 6-8
MA24105A . . . . . . . . . . . . . . . . . . . . . . . . . . . 8-9
MA24106A . . . . . . . . . . . . . . . . . . . . . . . . . . 10-6
MA24108A, 118A, 126A . . . . . . . . . . . . . . . . 12-7
test, operational
MA24104A . . . . . . . . . . . . . . . . . . . . . . . . . . . 6-1
MA24105A . . . . . . . . . . . . . . . . . . . . . . . . . . . 8-1
MA24106A . . . . . . . . . . . . . . . . . . . . . . . . . . 10-1
MA24108A, 118A, 126A . . . . . . . . . . . . . . . . 12-1
test, VSWR
MA24104A . . . . . . . . . . . . . . . . . . . . . . . . . . . 6-3
MA24105A . . . . . . . . . . . . . . . . . . . . . . . . . . . 8-3
MA24106A . . . . . . . . . . . . . . . . . . . . . . . . . . 10-3
MA24108A, 118A, 126A . . . . . . . . . . . . . . . . 12-3
PowerXpert UG
time, settling
MA24104A . . . . . . . . . . . . . . . . . . . . . . . . . . . .5-7
MA24105A . . . . . . . . . . . . . . . . . . . . . . . . . . . .7-6
MA24106A . . . . . . . . . . . . . . . . . . . . . . . . . . . .9-7
MA24108A, 118A, 126A . . . . . . . . . . . . . . . .11-6
tolerance, connector . . . . . . . . . . . . . . . . . . . . . . . .4-6
U
uncertainty
measurement uncertainty . . . . . . . . . . . . . . . .5-8
uncertainty components
directivity uncertainty (MA24105A) . . . . . . . .7-8
mismatch . . . . . . . . . . . . . . . . . . . . . . . . . . . . .5-8
noise . . . . . . . . . . . . . . . . . . . . . . . . . . . . . . . . .5-8
temperature compensation . . . . . . . . . . . . . . .5-8
zero drift . . . . . . . . . . . . . . . . . . . . . . . . . . . . . .5-8
zero set . . . . . . . . . . . . . . . . . . . . . . . . . . . . . . .5-8
uncertainty examples
MA24104A . . . . . . . . . . . . . . . . . . . . . . . . . . . .5-9
MA24105A . . . . . . . . . . . . . . . . . . . . . . . . . . . .7-9
MA24106A . . . . . . . . . . . . . . . . . . . . . . . . . . . .9-8
MA24108A, 118A, 126A . . . . . . . . . . . . . . . .11-9
uncertainty of a measurement
MA24104A . . . . . . . . . . . . . . . . . . . . . . . . . . . .5-8
MA24105A . . . . . . . . . . . . . . . . . . . . . . . . . . . .7-8
MA24106A . . . . . . . . . . . . . . . . . . . . . . . . . . . .9-7
MA24108A, 118A, 126A . . . . . . . . . . . . . . . .11-8
update software . . . . . . . . . . . . . . . . . . . . . . . . . . C-2
USB
serial port . . . . . . . . . . . . . . . . . . . . . . . . . . . . C-1
USB cable . . . . . . . . . . . . . . . . . . . . . . . . . . . . . . . .1-2
user interface, layout . . . . . . . . . . . . . . . . . . . . . . .3-4
V
VB code . . . . . . . . . . . . . . . . . . . . . . . . . . . . . . . . . A-1
visual inspection, connectors . . . . . . . . . . . . . . . . .4-4
VSWR test
MA24104A . . . . . . . . . . . . . . . . . . . . . . . . . . . .6-3
MA24105A . . . . . . . . . . . . . . . . . . . . . . . . . . . .8-3
MA24106A . . . . . . . . . . . . . . . . . . . . . . . . . . .10-3
MA24108A, 118A, 126A . . . . . . . . . . . . . . . .12-3
W
web links
contacting Anritsu . . . . . . . . . . . . . . . . . . . . . .1-4
product page . . . . . . . . . . . . . . . . . . . . . . . . . . .1-4
Z
zero
failed . . . . . . . . . . . . . . . . . . . . . . . . . . . . . . . .5-10
invalid . . . . . . . . . . . . . . . . . . . . . . . . . . . . . . .5-10
range zero failure . . . . . . . . . . . . . . . . . . . . .11-11
zero drift . . . . . . . . . . . . . . . . . . . . . . . . . . . . . . . . .5-8
zero set . . . . . . . . . . . . . . . . . . . . . . . . . . . . . . . . . .5-8
ZERO_ERROR . . . . . . . . . . . . . . . . . . . . . . . . . . .5-10
PN: 10585-00020 Rev. C
Index-3
Z to Z
zeroing sensor
MA24104A . . . . . . . . . . . . . . . . . . . . . . . . . . . 5-4
MA24105A . . . . . . . . . . . . . . . . . . . . . . . . . . . 7-4
MA24106A . . . . . . . . . . . . . . . . . . . . . . . . . . . 9-3
MA24108A, 118A, 126A . . . . . . . . . . . . . . . . 11-2
Index-4
PN: 10585-00020 Rev. C
PowerXpert UG
Alphabetical Index of
Programming Commands
ASDOFF. . . . . . . . . . . . . . . . . . . . . . . . . . . . . . . . 13-8
ASDON. . . . . . . . . . . . . . . . . . . . . . . . . . . . . . . . . 13-8
AUTOAVG . . . . . . . . . . . . . . . . . . . . . . . . . . . . . 13-13
AUTOAVG? . . . . . . . . . . . . . . . . . . . . . . . . . . . . 13-13
AUTOAVGRES . . . . . . . . . . . . . . . . . . . . . . . . . 13-14
AUTOAVGRES? . . . . . . . . . . . . . . . . . . . . . . . . 13-14
AUTOAVGSRC . . . . . . . . . . . . . . . . . . . . . . . . . 13-13
AUTOAVGSRC? . . . . . . . . . . . . . . . . . . . . . . . . 13-14
AVGCNT . . . . . . . . . . . . . . . . . . . . . . . . . . . . . . 13-12
AVGCNT?. . . . . . . . . . . . . . . . . . . . . . . . . . . . . . 13-13
AVGRST. . . . . . . . . . . . . . . . . . . . . . . . . . . . . . . 13-14
AVGTYP. . . . . . . . . . . . . . . . . . . . . . . . . . . . . . . 13-12
AVGTYP? . . . . . . . . . . . . . . . . . . . . . . . . . . . . . . 13-12
CALDATE . . . . . . . . . . . . . . . . . . . . . . . . . . . . . . 13-4
CCDFTHRESH . . . . . . . . . . . . . . . . . . . . . . . . . 13-16
CCDFTHRESH? . . . . . . . . . . . . . . . . . . . . . . . . 13-17
CHAPERT . . . . . . . . . . . . . . . . . . . . . . . . . . . . . 13-19
CHAPERT? . . . . . . . . . . . . . . . . . . . . . . . . . . . . 13-19
CHMOD . . . . . . . . . . . . . . . . . . . . . . . . . . . . . . . 13-18
CHMOD? . . . . . . . . . . . . . . . . . . . . . . . . . . . . . . 13-18
CHOLD. . . . . . . . . . . . . . . . . . . . . . . . . . . . . . . . . 13-8
CHOLD? . . . . . . . . . . . . . . . . . . . . . . . . . . . . . . . . 13-9
CWDUTY . . . . . . . . . . . . . . . . . . . . . . . . . . . . . . 13-11
CWDUTY? . . . . . . . . . . . . . . . . . . . . . . . . . . . . . 13-11
CWREL . . . . . . . . . . . . . . . . . . . . . . . . . . . . . . . 13-11
CWREL?. . . . . . . . . . . . . . . . . . . . . . . . . . . . . . . 13-12
DELETE. . . . . . . . . . . . . . . . . . . . . . . . . . . . . . . 13-10
FORWARD. . . . . . . . . . . . . . . . . . . . . . . . . . . . . 13-14
FORWARD? . . . . . . . . . . . . . . . . . . . . . . . . . . . . 13-15
FREQ . . . . . . . . . . . . . . . . . . . . . . . . . . . . . . . . . . 13-5
FREQ? . . . . . . . . . . . . . . . . . . . . . . . . . . . . . . . . . 13-5
FULLBUF . . . . . . . . . . . . . . . . . . . . . . . . . . . . . 13-11
GATEPARAMS . . . . . . . . . . . . . . . . . . . . . . . . . 13-22
GATEPARAMS? . . . . . . . . . . . . . . . . . . . . . . . . 13-23
GATEVALUES?. . . . . . . . . . . . . . . . . . . . . . . . . 13-23
GENABLE . . . . . . . . . . . . . . . . . . . . . . . . . . . . . 13-23
GENABLE? . . . . . . . . . . . . . . . . . . . . . . . . . . . . 13-23
HAT . . . . . . . . . . . . . . . . . . . . . . . . . . . . . . . . . . . 13-7
PowerXpert UG
IDN? . . . . . . . . . . . . . . . . . . . . . . . . . . . . . . . . . . . .13-4
LAT . . . . . . . . . . . . . . . . . . . . . . . . . . . . . . . . . . . .13-8
MODTYPE. . . . . . . . . . . . . . . . . . . . . . . . . . . . . .13-16
MODTYPE? . . . . . . . . . . . . . . . . . . . . . . . . . . . . .13-16
PWR? . . . . . . . . . . . . . . . . . . . . . . . . . . . . . . . . . . .13-5
PWRALL . . . . . . . . . . . . . . . . . . . . . . . . . . . . . . . .13-5
RDBUF . . . . . . . . . . . . . . . . . . . . . . . . . . . . . . . .13-10
RECALL. . . . . . . . . . . . . . . . . . . . . . . . . . . . . . . .13-10
REVERSE . . . . . . . . . . . . . . . . . . . . . . . . . . . . . .13-15
REVERSE? . . . . . . . . . . . . . . . . . . . . . . . . . . . . .13-15
RST . . . . . . . . . . . . . . . . . . . . . . . . . . . . . . . . . . . .13-8
SAVE . . . . . . . . . . . . . . . . . . . . . . . . . . . . . . . . . . .13-9
SCOPEPARAMS . . . . . . . . . . . . . . . . . . . . . . . . .13-22
SCOPEPARAMS? . . . . . . . . . . . . . . . . . . . . . . . .13-22
SETRNG . . . . . . . . . . . . . . . . . . . . . . . . . . . . . . . .13-9
SETRNG?. . . . . . . . . . . . . . . . . . . . . . . . . . . . . . . .13-9
START . . . . . . . . . . . . . . . . . . . . . . . . . . . . . . . . . .13-4
STATUS? . . . . . . . . . . . . . . . . . . . . . . . . . . . . . . . .13-7
STOP . . . . . . . . . . . . . . . . . . . . . . . . . . . . . . . . . . .13-4
TMP? . . . . . . . . . . . . . . . . . . . . . . . . . . . . . . . . . . .13-6
TRGARMTYP . . . . . . . . . . . . . . . . . . . . . . . . . . .13-29
TRGARMTYP? . . . . . . . . . . . . . . . . . . . . . . . . . .13-30
TRGDLY . . . . . . . . . . . . . . . . . . . . . . . . . . . . . . .13-27
TRGDLY?. . . . . . . . . . . . . . . . . . . . . . . . . . . . . . .13-27
TRGEDG . . . . . . . . . . . . . . . . . . . . . . . . . . . . . . .13-26
TRGEDG? . . . . . . . . . . . . . . . . . . . . . . . . . . . . . .13-26
TRGIMM . . . . . . . . . . . . . . . . . . . . . . . . . . . . . . .13-25
TRGLVL. . . . . . . . . . . . . . . . . . . . . . . . . . . . . . . .13-26
TRGLVL? . . . . . . . . . . . . . . . . . . . . . . . . . . . . . . .13-26
TRGNOISE . . . . . . . . . . . . . . . . . . . . . . . . . . . . .13-28
TRGNOISE? . . . . . . . . . . . . . . . . . . . . . . . . . . . .13-28
TRGSRC . . . . . . . . . . . . . . . . . . . . . . . . . . . . . . .13-25
TRGSRC? . . . . . . . . . . . . . . . . . . . . . . . . . . . . . . .13-25
TSLTPARAMS . . . . . . . . . . . . . . . . . . . . . . . . . .13-20
TSLTPARAMS?. . . . . . . . . . . . . . . . . . . . . . . . . .13-20
VIDEOBW . . . . . . . . . . . . . . . . . . . . . . . . . . . . . .13-15
VIDEOBW? . . . . . . . . . . . . . . . . . . . . . . . . . . . . .13-16
ZERO . . . . . . . . . . . . . . . . . . . . . . . . . . . . . . . . . . .13-6
PN: 10585-00020 Rev. C
Commands-1
Commands-2
PN: 10585-00020 Rev. C
PowerXpert UG
Anritsu prints on recycled paper with vegetable soybean oil ink.
Anritsu Company
490 Jarvis Drive
Morgan Hill, CA 95037-2809
USA
http://www.anritsu.com