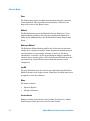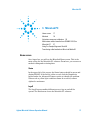
1
Agilent MicroLab Software Operation Manual Notices © Agilent Technologies, Inc. 2009, 2011, 2013 No part of this manual may be reproduced in any form or by any means (including electronic storage and retrieval or translation into a foreign language) without prior agreement and written consent from Agilent Technologies, Inc. as governed by United States and international copyright laws. Manual Part Number 0020-410 Edition Fourth edition, May 2013 Printed in Malaysia Agilent Technologies, Inc. Errata Statement NOTICE: This document contains references to A2 Technologies. Please note that A2 Technologies is now part of Agilent Technologies. For more information, go to www.agilent.com/chem. Warranty The material contained in this document is provided “as is,” and is subject to being changed, without notice, in future editions. Further, to the maximum extent permitted by applicable law, Agilent disclaims all warranties, either express or implied, with regard to this manual and any information contained herein, including but not limited to the implied warranties of merchantability and fitness for a particular purpose. Agilent shall not be liable for errors or for incidental or consequential damages in connection with the furnishing, use, or performance of this document or of any information contained herein. Should Agilent and the user have a separate written agreement with warranty terms covering the material in this document that conflict with these terms, the warranty terms in the separate agreement shall control. Technology Licenses The hardware and/or software described in this document are furnished under a license and may be used or copied only in accordance with the terms of such license. contract clause. Use, duplication or disclosure of Software is subject to Agilent Technologies’ standard commercial license terms, and nonDOD Departments and Agencies of the U.S. Government will receive no greater than Restricted Rights as defined in FAR 52.227-19(c)(1-2) (June 1987). U.S. Government users will receive no greater than Limited Rights as defined in FAR 52.227-14 (June 1987) or DFAR 252.227-7015 (b)(2) (November 1995), as applicable in any technical data. Safety Notices CAUTION A CAUTION notice denotes a hazard. It calls attention to an operating procedure, practice, or the like that, if not correctly performed or adhered to, could result in damage to the product or loss of important data. Do not proceed beyond a CAUTION notice until the indicated conditions are fully understood and met. Restricted Rights Legend If software is for use in the performance of a U.S. Government prime contract or subcontract, Software is delivered and licensed as “Commercial computer software” as defined in DFAR 252.227-7014 (June 1995), or as a “commercial item” as defined in FAR 2.101(a) or as “Restricted computer software” as defined in FAR 52.227-19 (June 1987) or any equivalent agency regulation or 2 Agilent MicroLab Software Operation Manual Contents Contents 1. Introduction 7 2. MicroLab Mobile Initial setup 9 9 Logging on for the first time 10 Managing users 11 Adding 11 Common icons 13 Home screen 13 Status 13 Start 14 Method 14 Reference Method 14 Log Off 14 Menu 14 Method screen 15 Methods list Print Activate Editing Agilent MicroLab Software Operation Manual 15 15 16 16 3 Contents 3. MicroLab PC 17 Home screen 17 Status 17 Logoff 17 Previous Results 18 Advanced Features 18 Methods 18 Editing 19 Univariate component calibration 26 Multivariate method transfer from GRAMS PLS/IQ to MicroLab PC 27 Exporting the PLS/IQ *.CAL file to ASCII 27 Generating the method file 28 Using Pre-Sample Alignment Check 29 Transferring edited methods to MicroLab Mobile 30 Using MicroLab Lite Synchronize 30 Copying via My Computer 31 4. Measuring Samples 33 Cleaning the sample interface 33 Collecting a background measurement 34 Collecting the sample measurement 35 4 Agilent MicroLab Software Operation Manual Contents 5. Reviewing Results 37 MicroLab Mobile 37 Results screen 37 Handling data 38 Previous results 40 MicroLab PC/MicroLab Lite 41 Results screen 42 Importing spectra into GRAMS 6. Updates and Troubleshooting Firmware update 47 Troubleshooting 47 Agilent MicroLab Software Operation Manual 45 47 5 Contents This page is intentionally left blank. 6 Agilent MicroLab Software Operation Manual Introduction 1. Introduction The Agilent MicroLab software suite is designed to run Agilent 4100 ExoScan, 4200 FlexScan, 4500 Series, 5500 Series and Cary 630 FTIR spectrometers. The software comes in three versions: MicroLab PC for Microsoft® Windows® XP, Vista, and 7 operating systems, MicroLab Mobile for Windows Mobile platforms, and MicroLab Lite for data review and method development on Windows XP, Vista, and 7 operating systems. The software packages provide similar functionality and structure, with the following exceptions: Methods cannot be edited on the MicroLab Mobile software, Data cannot be collected on the MicroLab Lite software, and An instrument must be connected to run the MicroLab PC and MicroLab Mobile software. The software is designed to be easy to use for both advanced and novice users, with menu-driven screens and instructions to walk users through analyses. The software incorporates a user logon; each user has defined ‘roles’ that are assigned by the administrator. These roles enable administrators to limit the methods and actions allowed for lower level users. Agilent MicroLab Software Operation Manual 7 Introduction This page is intentionally left blank. 8 Agilent MicroLab Software Operation Manual MicroLab Mobile 2. MicroLab Mobile Initial setup Managing users Adding Common icons Home screen Method screen 9 11 11 13 13 15 Initial setup The MicroLab Mobile software is supplied pre-installed on embedded and handheld PCs supplied with Agilent products. Software installation is required only when upgrading to a new software version. A backup copy of the software is supplied on a disk with new systems. A separate computer running Microsoft Windows XP operating system or later (with ActiveSync or Win Mobile) is needed for the installation, along with the appropriate cable to connect the handheld or embedded PC to that computer. To upgrade to a new version of MicroLab Mobile software: 1 Each Agilent-supplied handheld or embedded PC comes with an adapter cable, which enables it to be connected to the computer via a USB cable. Connect the handheld or embedded PC to the computer. 2 When connected, the computer will launch the ‘Active Sync’ (or Win Mobile) dialog box. Click Cancel on the first dialog box. Choose Explore Device from the Active Sync menu. The handheld or embedded PC can then be treated as a removable drive on the computer. 3 Insert the MicroLab Mobile disk into the computer CD drive. Browse to the CD directory using My Computer or Windows Explorer. Agilent MicroLab Software Operation Manual 9 MicroLab Mobile 4 Select all of the files on the disk and click Edit > Copy. 5 Paste the copied files into the following directory of the handheld or embedded PC (see Step 2): MobileDevice\Program Files\Agilent\MicroLab Mobile. 6 When prompted, choose Yes to All to overwrite the current software on the device. 7 Once the copy is complete, the handheld PC can be disconnected from the computer and returned to the instrument. The software is now ready to use. Logging on for the first time To log on to MicroLab Mobile for the first time: 1 Handheld and embedded PCs shipped with the Agilent 4100 ExoScan FTIR and Agilent 4500 Series FTIR systems are supplied with a shortcut to the MicroLab Mobile software installed in the Start menu. To start the software, click Start then click the MicroLab Mobile icon. The software can also be started by browsing to My Device\Program Files\Agilent\MicroLab Mobile and clicking the MicroLab Mobile.exe icon. The software will launch and display a Security screen. 2 NOTE Enter Admin as the user name, and enter the password ‘admin’ as directed in the security screen. This will allow the user to enter the software for the first time. Both the user name and password are case-sensitive. The logon screen will display after the security information has been entered. Enter the login information just entered into the security screen; then the system will display the Home screen. 10 Agilent MicroLab Software Operation Manual MicroLab Mobile Managing users The Advanced Features option enables an administrator to manage authorized users and alter the MicroLab system features. The system is installed with multiple user levels: Admin, Developer, Technician, E-signer and Service. Additional users can be added at any time. It is advisable to set up the system with the desired users and passwords on initial launch if multiple operators will be using the system. NOTE Only users with administration privileges can access User Management. Adding To add a user to the system: NOTE 1 Tap the Advanced Features button on the MicroLab Mobile Home screen. 2 Click User Management. 3 Click Add New User. 4 Enter a personalized UserID in the text box. 5 Enter the user’s complete name. 6 Insert a new password. 7 Identify the role of the new user (Admin, Service, Developer, Technician). 8 Click Apply Changes. 9 A window will appear notifying you that you will be logged off the system. You will be forced to login again after the changes have been applied. The system will automatically log off the user. The new UserID will appear in the User Name drop-down menu on the Logon screen. Agilent MicroLab Software Operation Manual 11 MicroLab Mobile Role definitions Service: The Service role provides access to all instrument parameters within a method including the sampling technology applicable for the method. Admin: The Admin (administration) role is reserved for the person(s) responsible for continual maintenance and changes to MicroLab software, including editing methods, creating new methods, defining public methods, conducting instrument verification, and controlling user access. Developer: The Developer role allows access to system performance validation in addition the ability to edit and run methods. However, this role does not have access to User Management functions or system diagnostics. Technician: The Technician role is for standard users of the system. The technician only has access to run methods defined by Admin as public. In addition, the technician cannot review data, conduct system validation or modify methods. NOTE Only the Admin and Developer roles have access to Advanced Features. User Management screen Add New User: Adds a user to the system. A user name, password, and access level must be assigned. The full name is also required. Delete User: Permanently deletes a user’s profile from the MicroLab Mobile system. Reset Password: Enables the administrator to change the password of the currently selected user. Reset Security: Deletes all customized users and resets the three predefined users (Service, Admin and User). This option will also reset the security if it has been disabled with the Disable Security option. 12 Agilent MicroLab Software Operation Manual MicroLab Mobile Disable Security: Removes all security features. When security is disabled, no password is required and all users have administrator privileges. Security can be restored by tapping the Reset Security button. Common icons These icons appear throughout the software: Home: Returns the software to the initial Home screen. Menu: Displays menu options. Next: Takes the software to the next step in the data collection process. Home screen The Home screen is the first displayed screen in MicroLab following logon. From the Home screen, you can start a method, measure a reference sample, open the Method Selection dialog box, open the Previous Results dialog box or open the Advanced Features dialog box. All procedures begin and end at the Home screen. Status In the upper right corner of the screen, a small circle appears. This circle gives a color indicating the status of the instrument connected to the MicroLab software. The circle will be green when the system is operating within the factory-defined parameters. A red or yellow light indicates a parameter outside of specification. When a red or yellow light condition cannot be resolved, contact Agilent for assistance. All parameters used to determine system readiness are listed in Advanced Features > Diagnostics. Parameters outside limits will be listed in red on the Diagnostics screen. Just above the ready light is a battery indicator. The battery indicator shows the level of charge remaining on the instrument battery. The charge level of the battery running the handheld PC is not indicated on the MicroLab software. Agilent MicroLab Software Operation Manual 13 MicroLab Mobile Start The Start button begins a sample measurement using the currently selected method. The currently selected method is shown in the upper left corner of the Home screen. Method The Method button opens the Method Selection dialog box. Users without Admin privileges can only select methods designated as Public by the administrator. See the Method Selection instructions below. Reference Method The Reference Method button enables the collection of a reference sample for a component method. Some component methods present concentrations as a percentage increase or decrease. For these calculations, a reference of the in specification sample is needed to calculate these starting values. Also, the Reference Method saves the spectrum of the in specification (new) material for later visual comparison. Log Off The Log Off button exits the current user and returns the MicroLab Mobile software to the Logon screen. From there, the Exit button can be tapped to close the software. Menu The menu contains: Previous Results Advanced Features Previous Results Enables viewing of previously collected data. Only Service, Admin and Developer roles have access to Previous Results. 14 Agilent MicroLab Software Operation Manual MicroLab Mobile Advanced Features The Advanced Features screen provides access to Diagnostics, System Validation, User Management, and Library Management for Admin, Service and Developer roles. Method screen Methods define instrument collection parameters and data analysis within the MicroLab software. Methods can be defined to only collect data, collect and compare collected data to a predefined library or collect data and perform a quantitative analysis on that data. Predefined methods include data collection, qualitative library searches and quantitative methods for oil and fuel analysis on the Agilent 4500t/5500t FTIR spectrometers. For questions and additional information on specifications for predefined methods, contact Agilent. MicroLab Mobile only allows for selection of predefined methods. Editing of methods must be conducted in the MicroLab PC or MicroLab Lite software on a separate computer. To be viewable within the Method dialog box, methods developed on a separate computer should be transferred to the following directory on the handheld or embedded PC: C:\Program Files\Agilent\MicroLab Mobile\Methods. For component methods, which use Quant (multivariate) calibrations, the Model for the method is required on the handheld as well. Methods list Displays a list of methods created for the MicroLab PC application software. To move up or down the method list, simply touch the stylus to the list and drag the list across the screen. Print This system feature enables the user to print a copy of the selected methods. Agilent MicroLab Software Operation Manual 15 MicroLab Mobile NOTE A system administrator limits accessibility of methods. The system administrator must select the check boxes along the left edge of the screen; this enables operation of methods for all technician level users. For users with the Technician role, this screen will display only those methods enabled previously by a system administrator. Activate The Activate button selects the highlighted method and closes the screen. The software returns to the Home screen. Check to make sure the correct method is active. If the incorrect method appears, return to the Methods screen and choose an alternative method. To do this, tap the Select Methods button, highlight the desired method and tap Activate. Editing Method editing is not available on the MicroLab Mobile software. In order to edit a method, you must use the MicroLab Lite software installed on a separate computer. Once the method is established, it can be transferred to the handheld or embedded PC for use with MicroLab Mobile. NOTE 16 The MicroLab Lite software should be installed on a computer containing Microsoft ActiveSync or Windows Mobile in order to easily transfer methods and data. Agilent MicroLab Software Operation Manual MicroLab PC 3. MicroLab PC Home screen 17 Methods 18 Univariate component calibration 26 Multivariate method transfer from GRAMS PLS/IQ to MicroLab PC 27 Using Pre-Sample Alignment Check 29 Transferring edited methods to MicroLab Mobile 30 Home screen Once logged on, you will see the MicroLab Home screen. This is the main screen for the MicroLab PC software. From here, you can access method editing and reviewing data. Status In the upper left of the screen, the Status button should be green and display READY. If the field is yellow or red, click the Diagnostics button under the Advanced Features option to identify the problem. When a red or yellow light condition cannot be resolved, contact Agilent for assistance. Logoff The Logoff screen enables different users to log on and off the system. The Exit button closes the MicroLab PC software. Agilent MicroLab Software Operation Manual 17 MicroLab PC Previous Results Once you have performed your analysis, you can access your previous results via the Home screen. After clicking Previous Results, a screen will appear listing the samples that have been run. The samples will be named based on the chosen naming conventions. Advanced Features From the Home screen, you may access libraries, user access, and the change password option. This feature enables a user to perform administrator tasks. Methods Methods list: Displays a list of methods created for the MicroLab PC application software. Delete: Deletes the currently selected method; only accessible by users with Admin rights. New: Creates a new method; only accessible by users with Admin rights. Edit: Opens the currently selected method for editing; only accessible by users with Admin rights. Activate: Selects the currently highlighted method as the method to be used. In order to collect data using a particular method, it must first be activated. NOTE 18 Only methods selected in the Public column will be viewable or selectable by non-Admin level users. Agilent MicroLab Software Operation Manual MicroLab PC Editing Info page Method Name: This field specifies the method name; the method name will be displayed in the method list. Developer: This field specifies the user who developed the method. Comment: This field is made available to the user to input any special information concerning the method. Type page Method Type: Three types of methods are available in the MicroLab PC software: Data Collect: Only collect and display the infrared spectrum. No further analysis is performed on the collected data. Component: Quantitative prediction methods. An infrared spectrum is collected then a predefined quantitative prediction is made from that data. Several components can be defined, each with their own quantitative calibration. Qualitative Library Search: Collect an infrared spectrum and search it against a predefined spectral library. The results of this method will be the top matches to the spectral library. Check for Clean Crystal Prior to Collecting Background: This option enables or disables the system checks of the cleanliness of the ATR crystal or sample cell prior to collecting a background. This option is recommended. Background: Two options exist for collection of the background: New Background for Each Sample: This requires the collection of a new background spectrum for every sample. This is the recommended option, as it provides the best correction for water vapor, carbon dioxide and other atmospheric variations. Collect Background at Time Interval: If this option is selected, samples can be collected in sequence without measuring a background spectrum in between samples. Agilent MicroLab Software Operation Manual 19 MicroLab PC Y-Axis Units: Specifies the Y-axis scale: Absorbance or Transmittance. Clamp max. Y-value: This option will display absorbances over the specified value as that value. This is a useful option when bands that are not used analytically may be off-scale; if this feature is selected, the off-scale bands will appear ‘flat-topped’ and not adversely affect the displayed scale. Instrument page Background Scan: This specifies the number of scans to be collected in the background measurement. Additional scans will produce higher signal-to-noise; however, the measurement time increases proportional to the number of scans. Sample Scans: This specifies the number of scans to be collected in the sample measurement. As with the background measurement, additional scans increase the signal-to-noise, but also increase the amount of time. The sample scans should be equal or less than the number of background scans. Typically, the background and sample are collected with the same number of scans. Resolution: This specifies the spectral resolution. For condensed phase samples, most measurements can be made with 8 cm-1 resolution. Components page (Component Methods) The Components page lists components defined for that method. Components are quantitative calibrations for constituents of a sample. Multiple components can be defined for each method. Next to each component is a check box in the Display column. Unselected components will not be displayed in the final results screen or reports generated from that screen. Add: This button adds a component to the method. This button will display the Component Definition dialog box (see below). Remove: This button removes the selected component from the method. 20 Agilent MicroLab Software Operation Manual MicroLab PC Edit: This button enables editing of the parameters used for the selected component calibration. This button will display the Component Definition dialog box (see below). Component Definition dialog box The Component Definition dialog box enables the addition or editing of components. This dialog box provides settings for the component calibration, the display settings and the limits for that component. The component limits enable color-coded display of the component results. Component Name: This specifies the name of the component that will be displayed both in the component list and the results. For clarity, the name should include the units of the result. Calculation Type: This field specifies the type of calculation to be used. Calculation types include univariate (Peak Height, Peak Height with Single Baseline, Peak Height With Dual Baseline, Peak Area, Peak Area with Single Baseline, Peak Area with Dual Baseline), noise calculation (RMS Noise), peak position (Peak Position (Center of Gravity)) and multivariate (Quant Model). NOTE The linear fit for a univariate calibration must be conducted in third party software (such as Excel). NOTE Multivariate calibrations are conducted in the Thermo Galactic PLS/IQ Plus software and exported to a text format readable by the MicroLab PC software. See instructions below for details on exporting calibrations. Peak 1, Peak 2: For univariate and peak position calculations, these define the peak to be used. For a peak height calculation, the largest value between this region will be selected. For a peak area, these are the limits of the area calculation. For a center of gravity, these are the limits between which the center of gravity will be calculated. For a multivariate (Quant), this will be the limit of the display range. Agilent MicroLab Software Operation Manual 21 MicroLab PC Baseline 1 Start, Baseline 1 Stop: These points define the area from which the first point of a baseline will be calculated. For a single point baseline, only Baseline 1 will be used. The baseline will be taken as the minimum value within this range. Baseline 2 Start, Baseline 2 Stop: These points define the area from which the second point of a baseline will be calculated. The baseline will be taken as the minimum value within this range. Scaling: This section defines a linear calibration to be applied to the data. This can be used with any of the peak definitions (Peak Height, Peak Area, and so on), or to modify the value generated by a multivariate (Quant) method. Often, this is used to change the value to an appropriate scale. NOTE The Agilent software presents results only in whole numbers. An appropriate scale should be chosen to produce results in whole numbers. Scale (x value): The Scale is the slope of a linear calibration equation. In the equation for a linear fit, y=mx+b, scale is ‘m’. Offset: The Offset is the Y-axis offset for a linear calibration. In the equation for a linear fit, y=mx+b, offset is ‘b’. Decimal Digits to Report: This defines the number of decimal places that will be reported in the answer. Thresholds: This section defines limits that the MicroLab PC software will use to color-code the displayed results and reports. Values that are between the Marginal High and Critical High, or the Marginal Low and Critical Low thresholds, will be displayed in yellow. Values above the Marginal High or below the Marginal Low thresholds will be displayed in red. All other values will be displayed in green. Report Value As: Values can be reported as either the actual value or a percentage of either the Critical High or Critical Low values. 22 Agilent MicroLab Software Operation Manual MicroLab PC Component Reporting page Component Reporting enables the method developer to determine when a component is shown in both the Results screen and the report. Only selected components that are selected in the Display column will be shown on the screen and the report. Edit Component Reporting Condition dialog box Additionally, the method developer can choose to report a component only under certain conditions. For instance, the developer can specify that a component is reported only when its value is within the range for which it has been calibrated. This enables calibrations over several ranges (high, medium and low) to be present in a method. If specified, the software will only report the concentration from the calibration that is in range. For multivariate methods, any of the method statistical measurements (Mahalanobis Distance, F-test, and so on) can be used to determine if a value should be reported. Report As: This section enables the developer to choose if the component is reported as the calculated value or as a text string based on that value. Used with the Boolean logic in the condition setting, this allows text-based results, such as ‘out of specification’ or ‘good’, to be displayed instead of numeric results. Component/Diagnostic: This drop-down list shows all of the diagnostic information that can be used to make a display logic choice. Test State: Enables specification of the state of the diagnostic. This is used with ‘Value’ below. Agilent MicroLab Software Operation Manual 23 MicroLab PC Value: The value of the diagnostic that is used with the test state in order to determine if the component will be displayed. Example: For a simple univariate method, two components may be specified for a single analyte; one component would have a valid calibration over a low range and the other would have a valid calibration over a high range. The developer may prefer that only the appropriate range be reported. In this example, the component will be called ‘area’ and the high range will be valid from 1000 to 5000 ppm. For this example, Area will be selected for the Component/diagnostic. First, the Test State of >= will be selected, along with a value of 1000. After this is Added, the And qualifier will be selected. Then the Test State of < will be selected with a value of 5000. In this example, the area component will now only be reported if the value is between 1000 and 5000. Example: For a multivariate (PLS) method, one may have several components specified. Each component may have a different multivariate calibration. You may only want the component that has a calibration set that is most closely related to the unknown sample. In this case, the developer would select the component/diagnostic to be MDistance (Mahalanobis Distance), the test state to be <= and the value to be 3. This would only report values that have a Mahalanobis Distance less than three, which indicates that the sample is statistically within the group of the calibration set. Custom Fields page Custom fields are available and can be added or deleted by the administrator. These fields will be visible on the Results screen and the ROAR report. Reports page Available Report Templates: Report templates are defined for specific types of methods. Component methods use only the Oil Report. Qualitative search methods can use the Spectrum with Parameter, Stacked Spectra with Search Results, Stacked Spectrum with Subtraction and Parameters Summary or the Stacked Spectrum with Zoomed Overlay templates. Multiple templates can be selected. 24 Agilent MicroLab Software Operation Manual MicroLab PC Results Folder: This specifies the location within the C:\Program Files\Agilent\MicroLab\Results directory where results will be saved. If this is left blank, the files are saved directly into the Results folder. A different folder can be entered for saving the files within the Results directory. If the method is transferred to a system running MicroLab Mobile, the folder will automatically update to the appropriate folder on the mobile device. There is also an option for an auto-report feature. Check this box will automatically generate any and all reports associated with the method in question when a sample is collected using it. Results Naming: MicroLab has an auto save feature that creates unique identification numbers that are exclusive to each analysis. All files are available to all authorized users and can be reviewed under the Previous Results button. An administrator has an option of choosing a format that best fits their needs. Sample ID + increment (Sample ID): The results name will correspond with Sample ID and time of analysis. Date Time: The results name will correspond with a date and time stamp of the analysis. Sample ID + Date Time: The results name will contain the sample ID, date, and time of the analysis. Results Auto-Export: MicroLab has an auto-export function that allows the user to automatically export the results file at the time of data acquisition. MicroLab can generate SPC and ASP file types for importing into a variety of third party software programs. NOTE The Sample ID is entered by the user during analysis. If the user fails to enter a Sample ID, the system will automatically create a date and time stamp. The user must always update the Sample ID when running multiple samples. MicroLab PC will store the previously entered sample ID. Agilent MicroLab Software Operation Manual 25 MicroLab PC Recommend page The recommendations will be displayed on the Results screen following sample analysis. The messages are a unique feature; they give the user the ability to customize results to their specific needs and parameters. Univariate component calibration MicroLab PC software contains functionality to implement a linear calibration and conduct a quantitative prediction; however, MicroLab PC does not have facilities to create a linear fit to collected data in order to perform this calibration. To conduct linear calibrations: 26 1 Using a Data Collect method, collect representative spectra of high and low concentration samples in the appropriate sample matrix. 2 View the spectra to determine peaks that can be used to predict the concentration. In general, look for peaks that increase with concentration and are isolated from interfering peaks. 3 Create a new Component method using the collection parameters (resolution, number of scans, and so on) desired for the final analysis. 4 On the Component page, click the Add button to define a new component. Select the desired type of calculation (Peak Height, Peak Area, and so on) and define the peaks and baseline points determined in Step 2. 5 Select an appropriate scaling factor (10, 100, 1000) to ensure that the measurements of the peak height or area are whole numbers. Choose that the result be listed as an Actual Value. 6 Measure samples over the desired concentration range using this newly defined component method. Record the results listed for the defined component. 7 Enter the component results measured in Step 6 along with the concentrations associated with those results into a commerciallyavailable spreadsheet software package, such as Microsoft Excel. Agilent MicroLab Software Operation Manual MicroLab PC 8 Define a graph where the concentration is on the Y-axis and the measured component value is on the X-axis. Fit a linear line to that graph. In Excel, select the data and choose to create a Scatter plot. On the scatter plot, right-click on the data and choose Add a Trendline. Choose to show the equation on the chart. 9 Return to MicroLab PC and the Component Definition dialog box of the previously generated method. Enter the values for slope (scale) and offset from the calibration equation into the method. 10 Adjust the limits and reporting of the method accordingly. 11 Click Save. Multivariate method transfer from GRAMS PLS/IQ to MicroLab PC Exporting the PLS/IQ *.CAL file to ASCII To export the PLS/IQ *.CAL file to ASCII: 1 Generate a PLS/IQ *.CAL file using the PLS/IQ module. To save a calibration in PLS/IQ, use the procedure ‘Galactic GRAMS: Saving a Calibration from the Experiment’ from the GRAMS Help File. For questions and additional information on the GRAMS Help File, contact Agilent. 2 From the main GRAMS screen, click Add-ons > PLS/IQ > Export Calibration. An ‘Open’ dialog box will be displayed. 3 Choose the appropriate *.CAL file and click Open. An Export dialog box will be displayed. 4 The first section lists the selected calibration file. The second section lists the exported file type; the output file type should be ASCII Text. 5 Click Next. A ‘Save As’ dialog box will be displayed. 6 Browse to the following folder before saving the file: C:\Program Files\A2 Technologies\MicroLab PC\Models. 7 Enter an appropriate name and click Open. The calibration file will be exported. The software returns to the Export dialog box. 8 Click Cancel to return to GRAMS. Agilent MicroLab Software Operation Manual 27 MicroLab PC Generating the method file To generate the method file in MicroLab PC: 28 1 From the MicroLab PC Component Definition dialog box, enter a component name. The component name is the text that will appear next to the value when the method is run by the end user. The name should be descriptive of the property being predicted. 2 For a multivariate (PLS) method, choose Quant Model as the Calculation Type. An Open file dialog box will appear. 3 Choose the appropriate calibration text file (exported from Galactic GRAMS in Step 7 of ‘Exporting the PLS/IQ *.CAL file to ASCII’) and click Open. 4 Other options available in the Component dialog box are listed below: a Peak 1 and Peak 2: These set a frequency range to be displayed when the component is selected from the Results screen. If this is left blank, the entire spectrum is displayed. b Scaling: The scaling section will apply a linear scaling to the result generated from the Quant model. c Thresholds: These values set the display colors for the component result. If the component value is above or below the critical values, the result will be displayed in red. If the component value is between the critical and the marginal values, the result will be displayed in yellow. Otherwise the result will be displayed in green. d Report Value As: Changes the display between an actual component value, a % of the critical high value or a % of the critical low value. 5 Once all of the values are set appropriately, click OK. 6 Click Save As. Enter the appropriate method name and save to the folder: C:\Program Files\Agilent\MicroLab PC\Methods. 7 The method is now available for use with MicroLab PC. Ensure that the method is Activated in order to use the method. Agilent MicroLab Software Operation Manual MicroLab PC Using Pre-Sample Alignment Check The Pre-Sample Alignment Check produces a visual indication of the signal strength from a measured sample in a preview screen. This allows you to determine if the sample is at the instrument focus or flat against the ATR crystal or reflectance housing, or that the instrument is aligned to the sample for maximum signal. This procedure details creation of a method that uses the pre-sample alignment check. In the method, a measurement to be made from the sample will be specified. Typically this should be a peak height or area that corresponds to the sample of interest. To check the sample alignment: 1 From MicroLab PC or MicroLab Lite, click the Method button. 2 In the Method dialog box, click the New button. 3 On the first page of the Method Definition dialog box, choose Components from the Method Type drop-down list. 4 Click the Component tab. 5 On the Component page, click the Add button. 6 In the Add Components dialog box, specify a Name for the component. 7 Select a Calculation Type for the component. Typically, either a Peak Area With Dual Baseline or a Peak Height With Dual Baseline will give the best indication of sample alignment. 8 Define the peak (area) to be measured. For peak areas, Peak 1 and Peak 2 define the edges of the peak. For Baseline 1 and Baseline 2, baseline is established as the lowest point between the Start and Stop points. 9 Set a Scale Factor such that the measured points will be greater than 1. For peak heights, a scale factor of 1000 ensures that most measurements are on-scale. 10 Click OK. 11 On the method Type page, select Show Pre-Sample Alignment Check. From the drop-down list, choose the component defined in Step 6. Agilent MicroLab Software Operation Manual 29 MicroLab PC 12 It should also be noted that the Sample Continuity Check can be used to ensure that the system is aligned to the sample throughout the measurement. 13 Click Save As and save the method. 14 For use on the handheld PC, the method should be transferred to the MicroLab Mobile/Methods folder on the mobile device. 15 In MicroLab Mobile, the Pre-Sample Alignment Check will be displayed as a red/yellow/green bar graph on the Sample Alignment page. The sample should be rotated or aligned in order to reach the maximum value on the bar graph. Transferring edited methods to MicroLab Mobile After completing modifications to a method in MicroLab PC or MicroLab Lite, the files should be transferred to the embedded or handheld PC for use. There are two ways to copy files; by using My Computer, or by transferring them automatically via MicroLab Lite. Using MicroLab Lite Synchronize To transfer methods to MicroLab Mobile using MicroLab Lite Synchronize: 30 1 Connect the handheld or embedded PC to the computer containing MicroLab PC and start ActiveSync as specified in ‘Initial Setup’ Steps 1 and 2 on Page 9. 2 Open MicroLab Lite on the computer. 3 Click Advanced Features. 4 Click MLp Report Settings. 5 If no connection is listed, click New. 6 In the dialog box, enter the serial number of the instrument and select what options are to be synchronized. Reports, Results and Methods can be synchronized. In addition, reports can be automatically printed by specifying the desired printer. 7 Once the device to be synchronized has been selected, click OK. 8 To transfer files, highlight the desired handheld PC from the list and click Synchronize. Agilent MicroLab Software Operation Manual MicroLab PC Copying via My Computer To transfer methods to MicroLab Mobile using My Computer: 1 Connect the handheld or embedded PC to the computer containing MicroLab PC and start ActiveSync as specified in ‘Initial Setup’ Steps 1 and 2 on Page 9. 2 From the computer, open My Computer and browse to the C:\Program Files\Agilent\MicroLab PC\Methods folder. 3 Select the desired methods and choose Edit > Copy. 4 From the My Computer heading, select the Mobile Device drive. 5 Browse to the folder Program Files\Agilent\MicroLab Mobile\Methods. 6 Click Edit > Paste. 7 Return to the C:\ drive on the computer and browse to the folder Program Files\Agilent\MicroLab PC\Models. 8 Copy the entire contents of the Models folder. 9 From the My Computer heading, select the Mobile Device drive. 10 Browse to the folder Program Files\Agilent\MicroLab Mobile\Models and click Edit > Paste. 11 Click Yes to All if an overwrite warning appears. Agilent MicroLab Software Operation Manual 31 MicroLab PC This page is intentionally left blank. 32 Agilent MicroLab Software Operation Manual Measuring Samples 4. Measuring Samples Cleaning the sample interface 33 Collecting a background measurement 34 Collecting the sample measurement 35 The MicroLab Mobile software is designed to walk the user through sample measurement. The software displays images and instructions of the actions that are required by the user for sample measurement. Following the instructions on the screen ensures consistent measurement results. For any sample measurement, the following steps are taken: Clean the sample interface. Collect a background. Place the sample to be measured. Collect the sample measurement. Cleaning the sample interface The first step in making a sample measurement is to ensure that the sample mounting interface is clean of any residue from previous samples or from general use and storage. For specific instructions for cleaning, refer to the appropriate instrument operation manual supplied with the system. CAUTION Do not break the spectrometer seal and attempt to clean interior surfaces. Breaking the seal will void the warranty. Agilent MicroLab Software Operation Manual 33 Measuring Samples Collecting a background measurement It is recommended that the system is configured to collect a background before every sample. Before you begin an analysis, the software will automatically collect a background spectrum when the method is configured as recommended. The background measurement (with no sample present) provides a baseline profile of the current system conditions and enables you to factor out any anomalies occurring in both the background and sample spectrum. NOTE As mentioned above, before collecting a background, ensure that the sample interface is clean. To clean the sample interface, a suitable solvent such as methanol, acetone or isopropyl alcohol should be used. See the instrument operation manual for more detailed information. To collect a background measurement: 1 On the Home screen, ensure that the appropriate method is active, and then click START to initialize background sample analysis. 2 NOTE 34 Click Next. A brief check of the sample interface (that is, the crystal) will occur. Following a successful test, the system gathers a ‘background’. Background progress is indicated by a status bar. Only click HOME to go back to the main home screen if you wish to start your analysis over. Agilent MicroLab Software Operation Manual Measuring Samples Collecting the sample measurement To measure a sample: NOTE 1 To begin sample measurement, click the Start button on the Home screen. 2 As the software instructs, clean the sample interface for an ATR or Transmission (Agilent 4500t/5500t FTIR) measurement. For a reflectance measurement on the Agilent 4100 ExoScan FTIR, the reflection standard should be placed on the sample interface. The sample surface should be cleaned with a soft tissue and an appropriate solvent such as methanol, ethanol or acetone. 3 Click the Next button. Clicking the Home button will stop the measurement and return you to the Home screen. The Clean Crystal Check will be conducted if it has been selected in the method. This will check for absorbance over a stored reference. If any absorbances are found, the software will instruct you to clean the sample interface and start again. NOTE If the clean crystal check continually fails, the stored background scan may be corrupted. If this occurs, the clean background can be reset by clicking Advanced Features > Diagnostics then Reset Clean Check in the Diagnostics dialog box. This will clear the stored background. 4 Following the crystal check (if specified), the software will collect the background sample. Background samples are collected either at every scan or after a specified time interval, as specified in the method. The software will instruct you to apply the sample to the sample interface. The picture displayed will match the configuration of the system. Once the sample is in place, click Next. Agilent MicroLab Software Operation Manual 35 Measuring Samples NOTE 5 The software will display a graph showing the intensity (absorbance) of the sample measurement. This screen is used to ensure that the sample has been correctly placed at the sampling interface. For oil applications using the Agilent 4500t FTIR, the value should be maximized. For Agilent 4100 ExoScan FTIR applications using reflectance, the value should be between 0.1 and 2 AU; ATR measurements should be between 0.05 and 1 AU. 6 Enter a file name in the Sample ID field; this will be the file name under which the sample data is saved. Enter further information about the sample in the Comment field. 7 Click the Next button to begin sample measurement. The software will co-add sample scans as specified in the method. 8 During sample measurement, the sample needs to remain at the focus of the sampling technology. For the Agilent 4500t FTIR, the sample cell should not be adjusted during the measurement. For the Agilent 4100 ExoScan FTIR, the instrument should not be moved from the sample surface during the measurement. The software monitors the sample signal during measurement. If the signal falls below a preset threshold, the collection will stop. Once the sample focus is regained, the software will immediately start collecting data. The progress bar shows the advancement of the data collection. When the progress bar is complete, the prompt will change to Transferring Data. Once this occurs, the measurement is complete and the instrument can be removed from the sample. 9 36 When the sample measurement is complete, the software will display the method results in the Results screen. The sample spectrum and the calculated method results will automatically be saved. The data can be returned to at any time from the Previous Results screen. Agilent MicroLab Software Operation Manual Reviewing Results 5. Reviewing Results MicroLab Mobile 37 MicroLab PC/MicroLab Lite 41 MicroLab Mobile Results screen For component methods, the Results screen shows the calculated component values. Component values are ordered relative to their critical limits; those values outside of the critical range are listed first followed by values outside of the marginal range. The components within the acceptable range are shown last in green. Green results show that the sample is within adjustable limits. Yellow results show that the sample is between marginal and critical limits. Red results show that the sample is above or below critical limits. Home: This button returns the software to the Home screen. Next: This button returns the software to the Sample Collection page for measurement of additional samples. Agilent MicroLab Software Operation Manual 37 Reviewing Results Handling data The Menu button enables you to choose Data Handling. This button allows the user to input a Sample ID and comments if not previously entered. The system’s auto-save feature will save the Comment field and generate a new file based on the sample ID if one is entered. NOTE The auto save feature will always save the current file with a sample ID and a time date stamp. This prevents the user from saving over a previous sample results. Home: Returns the software to the Home screen. Next: Takes the software back to the start sample screen to measure the next sample. Re-Analyze: Enables you to perform the calculations of a different method on the currently viewed data. This is useful when it is not possible to recollect the sample data. NOTE The Re-analyze feature should be used only with data collected at the same spectral resolution as the method chosen. Differences in spectral resolution can quantitative results. Export: Enables you to export data collected on the Agilent 5500a FTIR to other analytical software packages. The exported file will be saved with the same file name as the sample, except the extension will be *.asp or *.spc. It will be saved into the Results directory. Peak Picking: Enables the user to define peaks to be marked on the spectrum being reviewed. This is done by right clicking on the spectrum and choosing Peak Pick from the menu. To mark peaks on the spectrum draw a threshold line by clicking, dragging, and clicking again. This can be repeated multiple times to define several peaks on the spectrum. The peaks will print on any report generated and will keep with the data file. Once done, right click again and de-select Peak Pick from the menu. 38 Agilent MicroLab Software Operation Manual Reviewing Results Importing spectra into GRAMS To import data from a ‘foreign’ format to Thermo Electron SPC format: 1 Open GRAMS/AI on your computer and click File > Import/Export. Select the ASCII file converter. Then, click the Import button. 2 Browse the drives and directories to locate the file(s) you wish to import. When importing, remember that most file converters expect a particular input file name extension. For example, the ASCII converter looks for files with the *.ASP file name extension. (If needed, change Files of type to All Files (*.*).) You may select multiple files by pressing the CONTROL key while clicking each file name. Click Open. The File Import dialog box displays the name of the file to import. (If you are importing more than one file, the name of the first file will be displayed.) 3 Rename the file, if desired. To write the newly created file to a different directory, precede the file name with the complete directory path. Otherwise, it will be saved in the same folder as the ASP file. (You must have read/write access to the output directory.) 4 Choose an experiment key extension from the Output File Type list. Leave it set to the default Spectra (*.spc). 5 Select an Output Rename option. Leave it as Manual. 6 Click Auto-open to automatically open the converted file in GRAMS/AI. (Auto-open will not open multiple files. Auto-open will apply to the last file converted.) 7 From the File Import dialog box, click OK. As the file is converted, GRAMS Convert Application reads in the file to import and writes a new file to disk. Once the conversion process is complete, you can load the file into GRAMS/AI using the File > Open Trace command. Agilent MicroLab Software Operation Manual 39 Reviewing Results As the conversion proceeds, any messages or errors are displayed. If many files are being converted, you can switch back to GRAMS/AI or any other Windows program and the conversion continues. Note that the Convert program is actually a separate application named GRAMSC32.EXE and can be independently started from Windows from GRAMS/AI. The File > Import/Export command launches this application with a special command line switch, which causes it to automatically exit after the conversion. Report: Clicking the Data Handling button enables you to save a report. Reports are *.PDF files, which detail the component results for component methods or the library search results for Qualitative Search methods. The reports are saved in the Results directory and can be synchronized using MicroLab Lite. Previous results MicroLab Mobile’s Previous Results enables reviewing of data after collection has occurred. Previous results are available under the Menu icon on the Home screen. A list of previously collected samples is displayed on the Previous Results screen. In order to move through the list, click the list and drag to scroll. Home: Returns the software to the Home screen. View: Opens the data file for viewing. The data will be presented in an identical way to the Results screen shown in the Reviewing Results section on Page 37. Report: From the Menu button, the Report button will generate a PDF report as specified in the Reports page section on Page 24. 40 Agilent MicroLab Software Operation Manual Reviewing Results MicroLab PC/MicroLab Lite MicroLab PC/MicroLab Lite enable further data analysis than is available within MicroLab Mobile. Due to the screen size, spectra are not currently displayed in the MicroLab Mobile software. MicroLab PC/MicroLab Lite enable viewing of the spectra and review of the spectral regions that were used for the component calculations. Once the data has been transferred to the computer (see Transferring edited methods to MicroLab Mobile on Page 29; transferring results is analogous to transferring methods), it can be reviewed using the Previous Results feature of MicroLab PC or MicroLab Lite. From the MicroLab PC Home screen, click the Previous Results button; a screen will appear listing the all sample file names. Home: Returns the software to the Home screen. Import: Enables you to make additions to the Results screen. Report: The Roar Report for the sample reviewed at this point. You can print a copy of this report from this screen. A toolbar will appear that enables you to Export and Print. View: Returns the software to the Sample Results screen. The Sample Results are always reviewable with the MicroLab software. Overlay: The Overlay button appears when more than one spectral file is selected. It allows the user to view up to 5 sample spectra in overlaid or stacked format for comparison. The files must have the same abscissa type in order to be viewed together. Clicking Details, the spectrum of the sample can be viewed. The user is also able to zoom in on any portion of the spectra by using the left button on the mouse and highlighting the desired area. The screen will immediately change to the zoom portion. To return to the previous spectrum, right-click and choose Undo Zoom. Agilent MicroLab Software Operation Manual 41 Reviewing Results NOTE The software from the previous results section will operate as the results section operates. The screens are identical. These features enable operators to review data. Results screen Results box The results are color-coded for clarity and out-of-spec results are highlighted red and are moved to the top of the list. Green results show that sample is within adjustable limits. Yellow results or close to acceptable limits. Red results shows that sample are outside acceptable limits. The Results table has two headers: Parameters and Current Level. Viewing spectra regions A unique feature of the MicroLab software enables you to compare samples at specific regions. Simply double-click the individual parameters. The reference spectra will appear alongside the sample spectra. Moving between categories is accomplished by using the left and right arrows in the top right corner. You may decide to compare sample and reference spectra in an Overlay or Stacked view. 42 Agilent MicroLab Software Operation Manual Reviewing Results Figure 1. Example of Stacked option Figure 2. Example of Overlay option Agilent MicroLab Software Operation Manual 43 Reviewing Results NOTE To change between categories, right-click and scroll down to either option. The screen will reflect the view you indicate. Details This button enables you to view the entire spectra. The MicroLab software will display the sample spectra against the reference spectra. NOTE You can zoom in on any portion of the spectra. Using the mouse or touch pad, click on the graph and highlight the desired portion. The screen will automatically change to the zoomed in portion. To return to the full spectrum, right-click on one graph and choose Undo Zoom. Report: Clicking the Data Handling Button enables you to generate a Roar Report in a new window. The report outlines the preset parameters and shows the results in relevant units compared to the reference oil or ASTM method where appropriate. Add To a Library: Enables you to add the sample spectra to an appropriate library. The library is found by clicking Browse. A list will appear that shows the libraries available to you. Add To Library will complete the process. Adding new spectra to the user’s library enables the Agilent 5500a FTIR to determine if the subsequent samples are similar. Export: Enables you to export data collected on the Agilent 5500a FTIR to other analytical software packages. Go To ResPro: Automatically detects whether Resolutions Pro software is installed and allows the user to directly export the data displayed for advanced data processing and analysis. 44 Agilent MicroLab Software Operation Manual Reviewing Results Importing spectra into GRAMS To import data from a ‘foreign’ format to Thermo Electron SPC format: 1 Open GRAMS/AI on your computer and click File > Import/Export. Select the ASCII file converter. Then, click the Import button. 2 Browse the drives and directories to locate the file(s) you wish to import. When importing, remember that most file converters expect a particular input file name extension. For example, the ASCII converter looks for files with the *.ASP extension. (If needed, change Files of type to All Files (*.*).) You may select multiple files by pressing the CONTROL key while clicking each file name. Click Open. The File Import dialog box displays the name of the file to import (If you are importing more than one file, the name of the first file will be displayed.) 3 Rename the file, if desired. To write the newly created file to a different directory, precede the file name with the complete directory path. Otherwise, it will be saved in the same folder as the ASP file. (You must have read/write access to the output directory.) 4 Choose an experiment key extension from the Output File Type list. Leave it set to the default Spectra (*.spc). 5 Select an Output Rename option. Leave it at Manual. 6 Click Auto-open to automatically open the converted file in GRAMS/AI. (Auto-open will not open multiple files. Auto-open will apply to the last file converted.) 7 From the File Import dialog box, click OK. As the file is converted, GRAMS Convert application reads in the file to import and writes a new file to disk. Once the conversion process is complete, you can load the file into GRAMS/AI using the File > Open Trace command. Agilent MicroLab Software Operation Manual 45 Reviewing Results As the conversion proceeds, any messages or errors are displayed. If many files are being converted, you can switch back to GRAMS/AI or any other Windows program and the conversion continues. Note that the Convert program is actually a separate application named GRAMSC32.EXE and can be independently started from Windows from GRAMS/AI. The File > Import/Export command launches this application with a special command line switch, which causes it to automatically exit after the conversion. Done: Returns to a screen that prompts you to clean the sampling area and sampling device. This prepares the Agilent 5500a FTIR for the next sample. ‘Done’ enables you to run multiple samples without having to return to the Home screen. 46 NOTE Warning: This option does not allow you to change unit information. If you are running samples from different machines, you must return to the Home screen. NOTE If you would like to stop the analysis, click the HOME button. Agilent MicroLab Software Operation Manual Updates and Troubleshooting 6. Updates and Troubleshooting Firmware update Troubleshooting 47 47 Firmware update Occasionally Agilent will release updates to the firmware (software contained in the FTIR spectrometer). These updates will generally correct bugs that have been noticed by customers, and may expand upon the features that the system can provide. Firmware updates will be provided as Microsoft Windows executables files. These files may be provided directly to the customer, or may be made available in conjunction with an update to the Agilent MicroLab PC application. Troubleshooting If you see this error message: Instrument failed to initialize Instrument returned error code: -2. The application will exit; then power-cycle the instrument and restart the application. Upon loading the software, the spectrometer is not connected to the computer. If using the handheld PC with MicroLab Mobile, verify that the instrument displays a green light on the power button, and verify that the ‘Bluetooth’ communications are turned ‘On’ on the handheld PC. The instrument must be connected for either the MicroLab Mobile or MicroLab PC software. The instrument is not required for MicroLab Lite. Agilent MicroLab Software Operation Manual 47 Updates and Troubleshooting This page is intentionally left blank. 48 Agilent MicroLab Software Operation Manual Updates and Troubleshooting This page is intentionally left blank. Agilent MicroLab Software Operation Manual 49 www.agilent.com In This Guide The guide describes the following: Introduction MicroLab Mobile MicroLab PC Measuring Samples Reviewing Results Updates and Troubleshooting © Agilent Technologies 2009, 2011, 2013 Printed in Malaysia 05/13 *0020-410* *0020-410* 0020-410 Issue 4