1
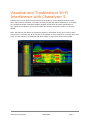
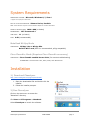
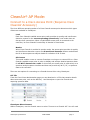
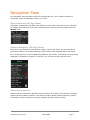
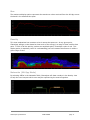
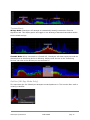
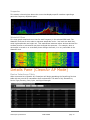
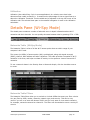
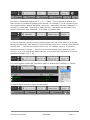
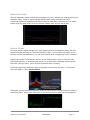
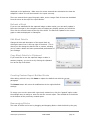
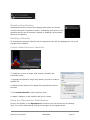
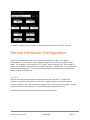
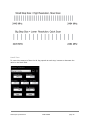
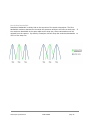
Chanalyzer 5
Chanalyzer by MetaGeek
USER GUIDE
page 1
Chanalyzer 5®
spectrum analysis software
Table of Contents
Installation
Connect to a Cisco Access Point (Requires Cisco CleanAir Accessory)
Wi-Spy Mode:
Choose a Wireless Network Interface Card (NIC)
Navigation Pane
Overview Pane
Details Pane (CleanAir AP Mode)
Device Interferers Table
Details Pane (Wi-Spy Mode)
Report Builder (Accessory)
Automatic Classification (Wi-Spy Mode)
Lab (Accessory)
Chanalyzer by MetaGeek
USER GUIDE
page 2
Visualize and Troubleshoot Wi-Fi
Interference with Chanalyzer 5
Chanalyzer 5 turns RF spectrum data collected from Wi-Spy or a Cisco CleanAir-enabled access
point (with accessory purchase) into highly interactive charts and graphs, allowing you to visualize
your wireless landscape. Chanalyzer displays wireless access points and other transmitters as
they appear in the spectrum, giving quick insight into whether interference is Wi-Fi or non-Wi-Fi
related.
Note: The features and abilities of Chanalyzer depend on which data source you are using. When
connected to a CleanAir® AP, Wi-Fi data will be unavailable. If using Chanalyzer in Wi-Spy mode from
within a virtual machine, an additional USB Wi-Fi adapter is required to gather network data.
Chanalyzer by MetaGeek
USER GUIDE
page 3
System Requirements
OPERATING SYSTEM: Microsoft® Windows 8, 7, Vista *
* support for XP (SP3) to be announced
Mac OS X VIRTUALIZATION: VMware Fusion, Parallels
NOTE: Virtual machines require an external USB Wi-Fi adapter to view Wi-Fi information
DISPLAY RESOLUTION: 1024 x 600 (or better)
FRAMEWORK: .NET Framework 4
USB PORT: 1.1 (or better)
RAM: 4 GB (recommended)
MetaGeek Wi-Spy Mode
HARDWARE:
Wi-Spy 2.4x or Wi-Spy DBx
Built-In Wi-Fi card (802.11n recommended, a/b/g compatible)
Cisco CleanAir® Mode (Requires Cisco CleanAir accessory)
HARDWARE: Cisco CleanAir-enabled Access Point (for remote troubleshooting)
SUPPORTED: Cisco Aironet 1500, 2600, 3500, and 3600 Series
Installation
1) Download Chanalyzer
http://www.metageek.net/support/downloads/
1. Open the downloaded file and double-click the
installer.
2. Follow the installer prompts.
2) Run Chanalyzer
Click on the start menu to access the
“MetaGeek” directory.
Click Start > All Programs > MetaGeek.
Select Chanalyzer to launch the software.
Chanalyzer by MetaGeek
USER GUIDE
page 4
CleanAir® AP Mode:
Connect to a Cisco Access Point (Requires Cisco
CleanAir Accessory)
The three different operating modes of a Cisco CleanAir access point determine which types
of data are available to Chanalyzer.
Local
Each Cisco CleanAir-enabled access point radio provides air quality and interference
detection reports for the current operating channel only. Local mode does not
disrupt client connections. When a hybrid-REAP access point is connected to the
controller, its Cisco CleanAir functionality is identical to local mode.
Monitor
When Cisco CleanAir is enabled in monitor mode, the access point provides air quality
and interference detection reports for all monitored channels. Monitor mode allows
the AP to share spectrum analysis dwells for collection of Wi-Fi data.
SE-Connect
This mode enables a user to connect Chanalyzer running on an external PC to a Cisco
CleanAir-enabled access point in order to display and analyze detailed spectrum data
for all Wi-Fi channels on a radio. In this mode, an access point is used strictly as a
spectrum analysis capture interface and does not provide any Wi-Fi, RF, or spectrum
data to the controller.
There are two options for connecting to a CleanAir Access Point using Chanalyzer:
CCF File
From the Cisco Prime administration page you can download a .ccf file that contains details
about an access point, such as the NSI key. Use Chanalyzer to open the file and start
capturing spectrum data.
Chanalyzer Direct Connect
Within Chanalyzer, use the CleanAir menu to select “Connect to a CleanAir AP.” You will need
Chanalyzer by MetaGeek
USER GUIDE
page 5
to enter the IP address and NSI Key, and you can assign it a friendly name. If the AP has a
WSSI monitor module, select the checkbox.
Chanalyzer will keep a list of your recent connections so you can quickly toggle between
multiple APs.
Wi-Spy Mode:
Choose a Wireless Network Interface Card (NIC)
Select a built-in or connected wireless network card in the main menu to access additional
WLAN information about SSIDs, RSSI, MAC address and data rate. Click Wi-Fi in the menu
bar, and then click the name of your wireless network card to collect Wi-Fi data in
conjunction with the spectrum data.
*Wi-Spy is a spectrum analyzer. It is not capable of reading at the Wi-Fi packet layer.
Therefore Wi-Spy will not appear in the Wi-Fi card drop-down list. Due to the way Mac OS X
handles Wi-Fi, if you are running Chanalyzer in a VM, you will need an additional USB Wi-Fi
adapter to collect network information.
Occasionally a wireless network card will actively perform probe requests on all Wi-Fi
channels, creating noise across the entire band with power levels above -40dBm. This
background activity can often skew the results of a spectrum analysis site survey. If you
notice this behavior with your wireless network card and don't want the additional noise in
your recording, we recommend that you select No Wi-Fi Scanning.
Chanalyzer by MetaGeek
USER GUIDE
page 6
See Wi-Fi Channel labels on the Density View
In the main menu select View > Wi-Fi Channels. This will change the x-axis to display the
Wi-Fi channels instead of the corresponding spectrum frequencies.
Application Window Details
Chanalyzer by MetaGeek
USER GUIDE
page 7
Navigation Pane
The Navigation pane provides controls for browsing Wi-Spy / Wi-Fi capture sessions or
recordings. Within the Navigation Pane, you'll find:
Device Selector (Wi-Spy Mode)
Chanalyzer continuously logs data from multiple sources when connected to your computer.
To change which band you’re currently analyzing and recording, select an option from the
Wi-Spy menu.
Session Navigator (Wi-Spy Mode)
Each time a user selects a new frequency range in the Wi-Spy menu, the previous data is
saved as a session in a Wi-Spy Recording. Active sessions are indicated with a red record
icon, meaning there is currently data being added to the session. The session currently being
displayed in Chanalyzer, whether it is active or not, will have a green box around it.
Renaming a Session
Sessions can be renamed to represent various points in a recording. This feature is primarily
used to identify locations however it can also be used to identify smaller frequency ranges.
It’s handy to rename sessions to help you navigate through several surveys.
Chanalyzer by MetaGeek
USER GUIDE
page 8
Timespan Controls
The Timespan controls adjust the length of time users see in the Overview and Details panes.
Timespan adjustments allow users to narrow in on anomalies and moments in time when
WLAN performance suffered. The playback buttons are used to Play, Pause, Rewind, and Fast
Forward while viewing a capture. The playback controls can also aid in selecting smaller time
spans in the waterfall navigation.
Waterfall Navigation
Waterfall Navigation colorfully displays all data in the current Wi-Spy session to show the
section of time detailed in the Overview and Details panes.
To move to a specific position within the session, double-click a point within the waterfall.
You can also click and drag the head and tail of the highlight slider region to easily adjust the
timespan in the Waterfall Navigation.
To swap the active band, click the arrow in the inactive band’s thumbnail.
Chanalyzer by MetaGeek
USER GUIDE
page 9
Overview Pane
This pane, located at the top right of the Navigation pane, contains the Waterfall
and Density views.
Density View
The Density View displays how often a signal is detected at a specific amplitude. After a
short time of gathering data, patterns begin to emerge in the Density View. A density map
view enables the user to quickly identify packet-based and analog patterns that may be
interfering with your network.
Display Options
The Density View has several view options. All of the display options can be toggled on and
off as needed, and the trace colors customized. Users can employ combinations of these
options to troubleshoot more efficiently.
Current
The current display option represents the received values at the most recent reading in the
time span. By default this will be real-time unless the user has changed the time span
settings to previously captured data.
Average
The average display option represents the average of the received spectrum activity in the
selected time span. For example, if the time span is 1 minute, the average will be calculated
in the rolling 1 minute.
Chanalyzer by MetaGeek
USER GUIDE
page 10
Max
The maximum display option represents the maximum values received from the Wi-Spy across
the band in the selected time span.
Density
This view emphasizes how constant noise is across the spectrum. At any given point,
Chanalyzer assigns a color based on how much of the energy in a range of time is above that
point. If 50% of all the activity is above an amplitude point, Chanalyzer colors it red. This
display option is especially useful in understanding just how constant interference is within a
given range of time.
Networks (Wi-Spy Mode)
By selecting SSIDs in the Networks Table, Chanalyzer will draw overlays in the density view
to help the user interpret which ones may be experiencing the most congestion.
Chanalyzer by MetaGeek
USER GUIDE
page 11
Transmitters
Wi-Spy Mode: Chanalyzer will attempt to automatically identify transmitters from the
Signatures tab. This display option will toggle on the drawing of detected transmitters within
the threshold settings.
CleanAir Mode: When connected to a CleanAir AP, Chanalyzer will draw overlays around the
channels that an interfering device is affecting. Simply check the box in the “Interfering
Devices” tab next to the devices you are interested in.
Outline (Wi-Spy Mode Only)
This represents the line Chanalyzer attempts to match patterns to. This is most often used in
creating a classifier.
Chanalyzer by MetaGeek
USER GUIDE
page 12
Inspector
This creates a hovering box above the cursor that displays specific numbers regarding a
particular frequency amplitude point.
Waterfall View
This view graphs amplitude over time for each frequency in the selected ISM band. The
Waterfall View uses a color scale to represent amplitude levels – low levels are dark blue,
while high amplitudes are bright red. This emphasizes instances where wireless devices like
cordless phones or microwaves may have changed the spectrum. For example, when a
microwave is turned on or a cordless phone changes channels, it is very noticeable in the
Waterfall View.
Details Pane (CleanAir AP Mode)
Device Interferers Table
When connected to a CleanAir AP, Chanalyzer will begin populating the Interfering Devices
table with any non-Wi-Fi transmitters that are detected. The table is fully filterable by
Device Type, Severity, Duty Cycle, and Signal Strength.
Chanalyzer by MetaGeek
USER GUIDE
page 13
Clicking the checkbox next to an interferer will display a visual indicator in the density view
that spans the channels where the device is active. The spanning area will be filled in
depending on the severity of the interference-- The higher the severity, the more opaque
the overlay will be (and the more impact your users are likely to experience).
Channels Table
Average - The average signal strength (in dBm) of devices on a channel.
Total Utilization - Measurement (in percentage) of total airtime utilization on a channel.
Device Count - Number of devices detected on a channel.
Devices Duty Cycle - A measurement of how constant a specific transmitter is above the
noise floor.
Interference Max Power - Highest detected amplitude level of an interfering device
affecting that channel.
Air Quality Index - Grade assigned by averaging the impact of interference against a
theoretical perfect spectrum. The closer to 100, the better. Read more here.
Chanalyzer by MetaGeek
USER GUIDE
page 14
Utilization
Utilization (also called Duty Cycle in some applications) is a relative score that helps
determine how usable a channel is. It measures the percentage of time a signal was at or
above the Utilization Threshold. This threshold can be adjusted in the top left corner of the
Utilization tab. The selected time span in the waterfall navigation is used in the Utilization
calculation.
Details Pane (Wi-Spy Mode)
The details pane contains a number of tabs with more in-depth information about Wi-Fi
networks and their channels. You can quickly alternate between tabs by pressing CTRL + TAB.
Networks Table (Wi-Spy Mode)
The Networks Table is a list of all the Wi-Fi access points that are within range of your
computer’s Wi-Fi card.
The names (or SSIDs) of access points (APs) are displayed, along with signal strength
(RSSI), channel, MAC address and other identifiers. This table provides a snapshot of Wi-Fi
networks in the area, and helps correlate RF activity in the spectrum views to known Wi-Fi
networks.
To see a network drawn in the Density View or Networks Graph, click the checkbox next to
its name.
Networks Table Filters
The Networks Table filters allow you to exclude or include SSIDs that meet your filter criteria.
You can filter by SSID, vendor, channels, network type, and security. This can be very
useful if you are in an area with dozens of AP’s and you only want to view certain networks,
for example, networks centered on channel 6. The filters can be stacked to meet a variety of
criteria.
Chanalyzer by MetaGeek
USER GUIDE
page 15
The SSID or Vendor filter begins with a “+” or “-” option. This will determine whether the
filter includes or excludes the following text entered. For example, if you do not want to see
any wireless networks named “MetaGeek”, select the - radio button and enter “MetaGeek” in
the SSID or Vendor field. Press enter to apply the filter. Chanalyzer will then show every
network that doesn’t have “MetaGeek” in the SSID or hardware field.
To filter by channels, click the arrow on the drop-down menu which will allow you to choose
between 2.4 GHz and 5 GHz channels. 2.4 GHz channels range from 1-14 and 5 GHz channels
from 36-165. “-” will filter the channels from a to b. For example, typing (1-6) will show
channels 1 through 6. Using a “,” will allow you to enter multiple single channels to view.
Typing (1, 4, 6, 9) will show only those channels. You can also use a combination of the two
operators as follows: (2-5, 7-10).
The remaining filter options will show either AdHoc or Infrastructure networks, or exclude
certain security settings of SSIDs.
To remove filters, click the x next to the box below.
Chanalyzer by MetaGeek
USER GUIDE
page 16
Networks Graph
Click the Networks Graph to show signal strength over time, drawing the rows selected in the
Networks Table. Drops in signal strength indicate poor signal coverage and can be
referenced against the Waterfall and Density views to determine if interference is to blame.
Please note, this data comes from the wireless network card and not the Wi-Spy.
Device Finder
This view shows a signal strength over time graph similar to the Networks Graph, but also
shows the signal strength of a selected frequency range. Device Finder will enable you to
actively seek out transmitters so you can know exactly what is happening in your networks.
Amplify the results of Chanalyzer’s built-in device finding feature with our Device Finder
Directional Antenna, an accessory that allows you to track down offending devices quicker
than with a Wi-Spy alone. Don't let mystery devices stay a mystery.
Click and drag across the density pane to highlight a continuous interferer. A contextual
menu will appear. Select Device Finder.
Chanalyzer will now track the amplitude levels over time of the frequency selection made in
the density pane. As the user gets closer to the source, the line graph will trend upwards.
Chanalyzer by MetaGeek
USER GUIDE
page 17
Utilization
Utilization (also called Duty Cycle in some applications) is a relative score that helps
determine how usable a channel is. It measures the percentage of time a signal was at or
above the Utilization Threshold. This threshold can be adjusted in the top left corner of the
Utilization tab. The selected time span in the waterfall navigation is used in the Utilization
calculation.
Channels Table
Current – The current represents an average of the most recent amplitude readings within
the channel range.
Grade – This calculation uses the entire 20 Mhz width of a Wi-Fi channel. Higher power
levels near the center of the channel will affect the grade more negatively. A high grade of
90 or above can be interpreted as an “A” while 80 or above is a “B.” Anything below 70 is not
recommended for Wi-Fi deployment.
Average - For each channel range (for example, Wi-Fi Channel 1, 2401 - 2423 MHz),
Chanalyzer calculates the average power within that channel frequency range.
Max - This is the highest amplitude point within the Wi-Fi channel frequency range.
Utilization – The percentage of all noise above a defined amplitude threshold.
amplitude is -85dBm.
The default
Networks – Once network scanning is initialized, Chanalyzer will list the networks that are
detected.
Chanalyzer by MetaGeek
USER GUIDE
page 18
Report Builder (Accessory)
With the Report Builder accessory for Chanalyzer, users can highlight and visually explain how
bad interference was when it occurred in an easy, professional manner.
Start a New or Open an Existing Report Project
Chanalyzer can start with a previously built report project (.wsxr file) or build a new one.
Add Block to the Report
Each of these menu items will add a different graph block from Chanalyzer to your report.
When a block is added, it will take a snapshot of one of the panes exactly as it is currently
Chanalyzer by MetaGeek
USER GUIDE
page 19
displayed in the application. Make sure the correct networks are selected at the time the
snapshot is taken so it will be entered in the report correctly.
There are several block types like graph, table, text or image. Each of these can be added
from the menu at the top of the report builder.
Refresh a Block
If you are not satisfied with the captured image or table results, you can easily update it.
Move the time span in the navigation pane and adjust any display options you would like.
Then click the refresh button at the top of the block. The block will update to the current
graph or table as displayed in Chanalyzer.
Edit Block Details
Change the title and description of the report block by
clicking the pencil icon in the top right of the block. This is
where you can change the block’s title or content, allowing
you to create a better and more personalized presentation of
your findings.
Copy Block Details to Clipboard
If you would like to use the captured image or table in
another program, you can do so by clicking the clipboard
icon at the top of the block.
Creating Custom Report Builder Blocks
After editing a block's text, click Save to replace the default text with the current
paragraph.
The Revert button will return all modifications to the original default
settings.
To merge your current report with a previously created one, click the “append” option under
the settings menu to merge a .wsxr file with the current report. This will add all of the blocks
to the bottom of the previously created report.
Rearranging Blocks
The order of blocks can be set by dragging and dropping blocks. Grab the block by the gray
Chanalyzer by MetaGeek
USER GUIDE
page 20
title section to drag them up and down the list to rearrange.
Report Builder Settings
Settings for the report builder can be found by clicking the Settings menu on the right of the
menu bar.
Automatic Classification (Wi-Spy
Mode)
Chanalyzer will automatically identify a transmission once a signature has been created.
Devices with separate center frequencies will need separate classifiers created. Chanalyzer
uses the outline view to match classifier patterns in a spectrum recording. When a classifier
matches the shape in the outline by a large percentage, it will draw it in the density view if
the transmitter display option is enabled.
Threshold Settings
There are two sliders that act as threshold settings to adjust the rate at which Chanalyzer
identifies transmitters in the Density View. By lowering the threshold, Chanalyzer will identify
more often with lower confidence levels. Confidence levels can be adjusted individually or as
a group.
Master Confidence Slider
The master confidence threshold slider changes how frequent the classifier will be drawn in
the density view.
Individual Confidence Threshold Slider
Each classifier has its own threshold settings. The confidence level of each classifier is listed
next to the slider. Due to the different nature of transmitters, classifiers should have
different confidence levels. Each classifier can be adjusted under the master threshold slider.
Chanalyzer by MetaGeek
USER GUIDE
page 21
Disabling Classification
Classification can be turned off as a display option above the density
view by clicking the “Interferers” button. Individually each device in the
signature tab can also be checked, enabling or disabling it as a possible
device to be classified.
Deleting a Classifier
To permanently remove a classifier from the signatures tab, click the garbage can icon in the
top right of the classifier.
Create a New Interferer Identifier
1. Turn on the outline view.
2. Disable the current, average, max, density, networks and
transmitter views.
3. Highlight the frequency range of the device you wish to create a
classifier for.
4. Adjust the time frame to find shape that represents the device
the most.
5. Click Create Classifier in the contextual menu.
6. Assign a Category to the classifier and give it a name.
Using the Silhouette for Identification
Click on the classifier in the Signatures tab and then hover the mouse over the Density
View. Turn off the silhouette by clicking the box again in the Signatures tab.
Chanalyzer by MetaGeek
USER GUIDE
page 22
Lab (Accessory)
This guide is specific to the Lab Accessory for Chanalyzer, and should be viewed as a
supplement to the main Chanalyzer user guide. For more information, please visit our
knowledgebase at http://support.metageek.net.
After unlocking the Lab accessory in Chanalyzer, the “Lab” tab will be added to the Details
Pane.
Wi-Spy Configuration Presets
There are two locations to choose frequency presets. In the Hardware Configuration Panel,
you can select from the default presets as well as their own custom configurations
Custom Configurations
Users can save configuration presets that are quickly accessible from the drop down menu.
Once the configuration has been applied, the drop down will appear empty. To save the
configuration click the SAVE disk icon. Give the preset a name, and it will appear in the drop
down.
Chanalyzer by MetaGeek
USER GUIDE
page 23
To remove a preset, select it from the drop down menu and click the trash can icon.
Manual Hardware Configuration
There are two methods in manually selecting the frequency range for the Wi-Spy
configuration. You can enter a center frequency and select the frequency span or step
width. For example, if you entered “5775” into the Center Field and “20” for the span, it
would leave 10 MHz on both sides of the center frequency. Alternatively, you can enter the
start and stop frequencies. The Step Size and the Span are configured to automatically
display at least 10 data points.
Step Size
The step size defines the resolution displayed in the overview pane. To adjust the
resolution, increase or decrease the step size. A smaller step size will create a higher
resolution capture, but it will increase the length of time it takes to finish a sweep. A large
step size will lower the resolution, but will decrease the sweep time as well.
The default settings are optimized for both speed and resolution.
Chanalyzer by MetaGeek
USER GUIDE
page 24
Dwell Time
To control the amount of time the Wi-Spy spends at each step, increase or decrease the
value in the Dwell field.
Chanalyzer by MetaGeek
USER GUIDE
page 25
Resolution Bandwidth
Resolution Bandwidth is closely tied to the step size of the spectrum analyzer. The filter
bandwidth resolution determines how wide the spectrum analyzer will listen at each step. If
the resolution bandwidth is the same width as the step size, some transmissions will be
omitted from the capture. By default, Chanalyzer Lab will keep the resolution bandwidth to
125% of the step size.
Chanalyzer by MetaGeek
USER GUIDE
page 26
Markers
Chanalyzer Lab can measure current, average and maximum values for specific frequencies
selected by the user. To create a marker right click in the overview pane and select “Create
New Frequency Marker.”
Chanalyzer will build a table to the right of the Hardware Configuration options. Each entry
will display measurements for the current, average, and max for each frequency marker.
These values are dependent on the time span selected.
Chanalyzer by MetaGeek
USER GUIDE
page 27
LEARN MORE
You can learn more about Chanalyzer at our website
http://www.metageek.net/products/chanalyzer
Chanalyzer by MetaGeek
USER GUIDE
page 28