1
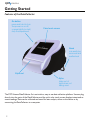
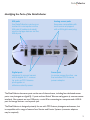
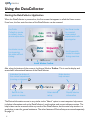
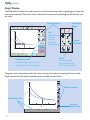
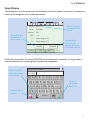
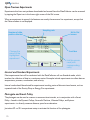
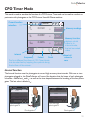
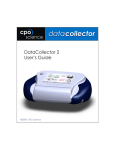
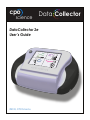
cpo
science
Data Collector
DataCollector 2e
User’s Guide
Data
Collection
Meter
Mode
©2012, CPO Science
CPO Timer
Mode
Stopwatc
h
Designed by CPO Science
In conjunction with:
Reinrag East
PRI
EVC
Silvis Consulting
cpo
science
making it real™
Copyright © 2012 CPO Science
Table of Contents
Getting Started������������������������������������������������������������������������������������������������������������ 2
Features of the DataCollector������������������������������������������������������������������������������������������������������������2
Identifying the Ports of the DataCollector������������������������������������������������������������������������������������������3
Using the DataCollector���������������������������������������������������������������������������������������������� 4
Starting the DataCollector Application�����������������������������������������������������������������������������������������������4
Data Collection Mode�������������������������������������������������������������������������������������������������� 5
Experiment Setup�������������������������������������������������������������������������������������������������������������������������������6
Meter Window������������������������������������������������������������������������������������������������������������������������������������7
Table Window�������������������������������������������������������������������������������������������������������������������������������������7
Graph Window������������������������������������������������������������������������������������������������������������������������������������8
Setup Window�������������������������������������������������������������������������������������������������������������������������������������9
Open Previous Experiments������������������������������������������������������������������������������������������������������������ 10
Interval and Standard Experiments�������������������������������������������������������������������������������������������������� 10
Photogate and Smart Pulley������������������������������������������������������������������������������������������������������������� 10
CPO Timer Mode������������������������������������������������������������������������������������������������������� 11
Interval Function������������������������������������������������������������������������������������������������������������������������������ 11
Frequency Function�������������������������������������������������������������������������������������������������������������������������� 12
Period Function�������������������������������������������������������������������������������������������������������������������������������� 12
Count Function�������������������������������������������������������������������������������������������������������������������������������� 12
Meter Mode���������������������������������������������������������������������������������������������������������������� 13
Stopwatch Mode�������������������������������������������������������������������������������������������������������� 14
Device Setup��������������������������������������������������������������������������������������������������������������� 14
Connecting the DataCollector to a Computer��������������������������������������������������������� 15
Transferring and Analyzing Data������������������������������������������������������������������������������������������������������� 15
Updating the DataCollector������������������������������������������������������������������������������������������������������������� 16
Warnings and Precautions������������������������������������������������������������������������������������������ 17
cpo
science
Getting Started
Features of the DataCollector
Go button
press and hold to turn
the power on or off,
or press lightly to start/
stop the experiment
Color touch screen
Stand
can easily be
removed and
reattached
Stylus rest
Stylus
hides out of
sight when not
being used
The CPO Science DataCollector 2e is an intuitive, easy-to use data collection platform. Sensors plug
directly into the ports of the DataCollector and the unit’s color touch screen displays instant and accurate readings. Data can be collected and saved for later analysis, either on the device or by
connecting the DataCollector to a computer.
2
Data Collector
Identifying the Ports of the DataCollector
USB ports
the DataCollector can be connected to a computer via the
USB mini-B (cables included)
and to storage devices via the
USB-A port
Digital ports
designed to accept sensors
with a digital RJ-11 connector such as CPO Science
photogates or
distance-velocity sensor
Analog sensor ports
these are compatible with
most sensors equipped
with a BTA right-hand plug
Power jack
to ensure proper function, use
the included CPO Science
power adaptor
The DataCollector has seven ports on the rear of the enclosure, including four dedicated sensor
ports: two photogate or digital RJ-11 ports and two British Telecom analog ports (a common sensor
interface). Also present are two USB ports—a mini-B for connecting to a computer and a USB-A
port for storage devices—and a power jack.
The DataCollector is designed primarily for use with CPO Science photogates and sensors, but
is compatible with a range of sensors from Vernier and Fourier Systems (connector adaptors
may be required).
3
cpo
science
Using the DataCollector
Starting the DataCollector Application
When the DataCollector is powered on, the first screen that appears is called the Home screen.
From here, the four main functions of the DataCollector can be accessed.
Use Data
Collection mode
to collect, store,
and analyze data
Use Timer mode
to conduct
unrecorded
experiments with
photogates
Use Meter mode
for observing
live data without
storing
Use Stopwatch
mode for simple
timing exercises
Home Window Toolbar
Also, along the bottom of the screen is the Home Window Toolbar. This is used to display and
access basic informational features of the DataCollector.
Indicates the status of
the current experiment
(running or stopped
)
Return to the
previous screen
Enter device
help screens
Enter device
setup
Display device
information
The Device Information screen is very similar to the “About” option in most computer help menus:
it displays information such as the DataCollector’s serial number and current software version. The
help screens can be accessed within any mode of the DataCollector, but the main help window is a
good place to start for general assistance. The other features of Device Setup are covered separately
on page 14.
4
Data Collector
Data Collection Mode
Status Bar
Data Collection Mode is used to collect, record, and analyze data. Selecting
Data Collection from the Home Screen
brings up the Data Collection window.
1
2
A B
Push
Tapping Go! in the center of the screen
will start a new experiment with default
settings.
Along the bottom are the options to
enter experiment setup or to explore
old experiments still stored on the
DataCollector.
to run new experiment
Setup
Open
Change default
experiment settings
Explore saved
experiments
Along the top of the screen is the Status Bar, which displays general information about the
experiment as well as access to the home and help screens.
Experiment status
indicates that the experiment
is running
, stopped, or has
reached the sample size limit
Return to the
home screen
1
Sensor status
the sensor is present
and active (dark) or
inactive (light grey)
2
Photogate status
indicates that a
photogate or other
digital sensor is
present and active
(dark) or inactive
(light grey)
A B
Sampling rate
rate at which samples
are being collected in
the active experiment
Sample size
total number of samples to
be collected in the current
experiment
5
cpo
science
Experiment Setup
Selecting the Setup tab opens the experiment setup screen. From here, the experiment mode,
sample size and rate, as well as sensor units can be selected. Sensor inputs can also be deactivated, so
that experiments for single sensors can be run without having to detach the sensor from the DataCollector.
Once the experiment settings are correct, tap Go! to start.
Sample size can
be set from 10 –
2000 data points
Sensor inputs
can be turned
on or off
S1: Analog
Sensors
PGA: Photogate
SPA: Smart Pulley
Photogates
1
2
A
Mode:
Standard
B
Interval
Samples: 500
Rate: 1
Hz
S1:
Pressure
kPa
S2:
Pressure
kPa
none
Cancel
Reset
Sample rate can
be set from 1 – 200
samples per
second (Hz) or
2 – 3600 seconds
between samples
Many sensors
have alternates
to the default SI
units
Tap to start!
An experiment can also be set up to record several successive interval trials. Simply select the
Interval radio button and the desired sample size before beginning.
1
2
A
Mode:
Display changes
to indicate
photogate setup
Standard
Samples:
500
PGA:
Interval
S
PGB:
Interval
S
PGAB:
Interval
S
Cancel
6
B
Interval
Reset
Sample size can
range from 10 to
2000 trials
Data Collector
Meter Window
Once the experiment is begun, the Meter window appears, which displays the readings for the active
sensors in the experiment, as well as the elapsed experiment time.
Selecting the view tabs along the bottom of the screen chanages the view to a different view window.
1
Active Sensor
Readings
2
A
T1
30.72
C
T2
29.14
C
Elapsed
experiment time
B
Window tabs
select to change
to a different
view or to modify
the parameters
of the experiment
02:14.32
Meter
Table
Graph
Setup
Table Window
The Table window displays the collected data for the active experiment and also allows the sources
for the experiment graph to be selected. Up to three data sources can be collected in the data table.
Live data
1
2
A
0.4799
t
seconds
Graph source
specify how you
would like the
data graphed by
selecting one
x-axis and up to
two y-axis inputs
19.56
12.83
degree C
degree C
20.14
20.02
19.89
19.77
19.68
13.25
13.18
13.10
13.06
12.99
T1
0.2000
0.4000
0.6000
0.8000
1.0000
x
Y1 Y2
Meter
x
Y1 Y2
Table
B
T2
x
Y1 Y2
Graph
Scroll bar
scroll through
the entire data
series
X Y1 Y2
Setup
7
cpo
science
Graph Window
The DataCollector allows for visual interaction with the experiment data by graphing up to two data
sources automatically. Data points can be selected and compared by selecting the desired area with
the stylus.
Graph Controls
1
2
A
B
T (°C)
20
10
t
20.000
T1
Y1 :
7.0008
T2
Y2 :
6.8888
X:
0
20
10
30
40
t (s)
Meter
Table
Graph
Full Screen
Mode
Pan
useful for
moving
quickly
through
large graphs
B
Zoom
Controls
Setup
Scroll
moves forward
or backward one
point on the graph
Coordinate data
indicate data values at the
selected point on the graph
The graph can be expanded to allow for better viewing of the data by entering full screen mode.
Graph controls are still readily identifiable and accessible via the side bar.
20
T (°C)
Graph controls
10
Coordinate data
0
X1: 20.000
8
10
Y1: 7.0008
20
30
t (s)
Y2 : 6.8888
40
Return to
normal view
Data Collector
Setup Window
The settings for the active experiment are displayed in the Setup window. From here, the experiment
name can be changed or a new experiment started.
1
Returns to the
experiment
setup screen
2
A
Name:
EXP0004
Mode:
Standard
Samples:
500
Rate:
1 Hz
S 1:
S 2:
Tap to change
the experiment
name
Temp (degree C)
Immediately
starts a new
experiment with
the same settings
Temp (degree C)
Modify
Meter
B
Table
Repeat
Graph
Setup
Default file names follow the format EXPXXXX and are numbered sequentially. It is a good idea to
rename experiments to something more immediately recognizable.
Select the shift
button for upper
case letters
Experiment Name
Unit 5 Ex
Q W E R T Y U I O P
A S D F G H J K L
Z X C V B N M .
Cancel name
change
-
Accept
changed
file name
1 2 3 4 5 6 7 8 9 0
space
x
9
cpo
science
Open Previous Experiments
Experiments that have not yet been downloaded and erased from the DataCollector can be accessed
by tapping the Open icon in the lower right corner of the Go! screen.
When an experiment is opened, the features are exactly the same as a live experiment, except that
the Meter window is not displayed.
Number of data
points collected
Sampling rate
Experimental History
Name
Change the
name of the
highlighted
experiment
Exit to Go!
screen
# f Info
EXP0016
Gas Law 1
EXP0018
4
10
3
EXP0019
15
Rename
1
Hz
1
Hz
2
sec
1
Hz
P(kPa) T(C)
P(kPa)
P(kPa)
P(kPa)
Scroll bar
Delete
Lists the sensors
used (with
corresponding
units)
Open
Interval and Standard Experiments
Most experiments that will be conducted with the DataCollector will use Standard mode, which
involves the collection of data in a continuous series. Examples include experiments to collect data on
temperature, pressure, acceleration, and velocity.
Interval mode should be selected for experiments involving series of discrete timed events, such as
repeated trials of the Gravity Drop or Energy Car experiments.
Photogate and Smart Pulley
The photogate can be used as a sensor to measure time intervals, or in conjunction with a Smart
Pulley—found in the Dynamic Pulleys, Atwood’s Machine, Ultimate Pulleys, and Spinner
experiments—to directly measure distance, speed or acceleration.
Just select SP1 or SP2 in experiment setup to activate this function of the photogate.
10
Data Collector
CPO Timer Mode
This mode is used to emulate the function of a CPO Science Timer and can be used to conduct experiments with photogates or the CPO Science Sound & Waves machine.
Current function
selection
1
2
A
Interval
B
tA
0.0122
s
0.0099
tB
0.0089
s
0.0071
tAB
0.3255
s
0.2919
f
I
p
Memory readings
Memory function
displays a hold
value or, in
interval mode,
the last recorded
value
# 0.0 m
Interval
Reset all
values to
zero
Frequency
Period
Count
The four different functions of CPO Timer Mode
can be selected by tapping the symbols along
the bottom of the screen.
Interval Function
The Interval function uses the photogates to record high-accuracy time intervals. With one or two
photogates plugged in, the DataCollector will record the duration that the beam of each photogate
is broken—labeled as tA and tB—as well as the time elapsed between the breaking of the two photogates. This last value is labeled tAB.
1
2
A
Interval
tA
0.0122
s
tB
0.0089
s
tAB
0.3255
I
f
p
B
1
TA
s
# 0.0 m
2
A
Interval
tA
0.0122
s
tB
0.0089
s
tAB
0.3255
s
I
f
p
B
TB
# 0.0 m
Time through
photogate B
Time through
photogate A
Photogate A
Photogate B
11
cpo
science
1
TAB
Photogate A
A
Interval
2
tA
0.0122
s
tB
0.0089
s
tAB
0.3255
s
p
f
I
B
# 0.0 m
Time from photogate A
to photogate B
Photogate B
Frequency Function
The DataCollector is able to measure and display frequencies from 0.1–19,999 Hz, either from teh
photogates—how often the beam is broken by an object—or from a direct source such as the Sound
& Waves machine.
1
With two photogates attached,
the DataCollector displays the
difference between the signals
(ΔfAB, ΔTAB, or ΔNAB
2
A
Freq.
B
fA
9.2500
Hz
3.7500
fB
4.7500
Hz
7.5000
Δ f AB
+4.500
Hz
-3.750
I
f
p
In frequency,
period, or count
functions, the
currently
displayed value
can be held
by tapping the
memory icon
# 0.0 m
Period Function
The period of a connected signal is measured and displayed in seconds. In order to correct for inaccuracies when using a photogate, the period displayed is an average of the previous two breaks of the
photogate beam. As a result, the DataCollector will not begin displaying the period until the beam of
the photogate has been broken three times.
Count Function
The DataCollector can keep a count of how many times the beam of a photogate is broken, up to a
maximum of 19,999.
12
Data Collector
Meter Mode
Meter Mode is used to observe live data from attached sensors without recording data to an
experiment file. Unlike Data Collection Mode, the sensor information is automatically displayed on
the screen when it is plugged in.
Meter Mode Icon
1
Sensor Data
displays live
readings when
the experiment
clock is running
Experiment
Clock
Clock status
2
A
T1
198.72
C
V2
0.3689
V
B
Sensor Units
alternate units,
when available,
can be selected
from the dropdown menu
Start/Stop
0.0
0 1: 12. 44
Reset
1
When the experiment clock is
stopped, the last recorded value is
displayed in white on a dark blue
field. Normal data display resumes
when the clock is restarted.
2
A
T1
198.72
C
V2
0.3689
V
B
13
cpo
science
Stopwatch Mode
For use in simple timing experiments, the DataCollector can fucntion as a stopwatch in
Stopwatch Mode.
1
2
Stopwatch Mode
Icon
A
B
00:00.00
Reset
00:00
Changes to
when the clock
is running
Start/
Stop
Device Setup
By clicking the
icon, some basic features of the DataCollector can be controlled, such as the
device name, sensor display, and data management.
Check this box to
display raw signal
(uninterpreted)
values from
sensors (most
often a resistance
or voltage)
Convert
experiment data
to downloadable
.csv files
Preferences and Tools
Unit name:
Apricot
Allow natural sensor units?
Convert Data
Delete All Data
Enter Leader Mode
Select when the DataCollector is attached to a
computer to use as a demonstration device
14
The default
name is that of a
random fruit, but
this can easily
be changed
Erases all
experiment
history
Data Collector
Connecting the DataCollector to a Computer
The DataCollector comes with a mini-USB cable that can be used to connect to a computer for
transferring data and updating software.
It is important to remember that, when disconnecting the DataCollector from a computer, it is always best to use the Safely Remove Hardware (PC) or Eject Hardware (Mac) options before physically
disconnecting the device.
Transferring and Analyzing Data
Upon completion of an experiment, the data can be saved on the device as comma separated value
(.csv) files which can be opened in programs such as Mathworks Matlab, Vernier Logger Lite, or
Microsoft Excel.
Attach the DataCollector to a computer and navigate to its drive name (CPO_DC2) in the file
explorer. The experiments can be found in the data folder.
Experiments
are found in
the device
name folder
within the
data folder
15
cpo
science
Updating the DataCollector
To learn which software version is currently on the DataCollector, select the device information icon
on the Home screen.
Software updates and support information, including digital copies of product copies of product
documentation, are available at:
www.cpo.com/dc-updates
Download the software update by clicking the appropriate link and specifying a location for the file
to be saved. To load the the update onto the DataCollector, first ensure that it is powered byt he
included 9V adaptor—if a battery were to fail midway through the update, the DataCollector may be
rendered inoperable. Connect the DataCollector to the computer on which the file has been saved
with the included USB cable. The computer should recognize the DataCollector as a drive named
CPO_DC2. Next, simply drag the file from its save location to the DataCollector drive.
Drag the file
from its save
location
to the
CPO_DC2
drive
Disconnect the DataCollector from the computer first by using the Safely Remove Hardware (PC) or
Eject Hardware (Mac) option and then unplugging the USB cable. The software update will be
automatically installed and the update progress will be displayed on the screen.
Data Collector
STARTING UPDATE.... all
16
Installing cpodc2-v2.0b22a
Data Collector
Warnings and Precautions
Please make note of the following warnings and precautions. Failure to follow these guidelines can
result in damage to the DataCollector and in severe cases possible bodily harm.
i
IMPORTANT: Use only the supplied CPO Science 9V DC adaptor with the
DataCollector. That an adaptor can plug into the DataCollector is not a
reliable guide to compatibility.
i
IMPORTANT: Do not over tighten the thumbscrew on the photogates.
Overtightening can flex the body of the photogate to the point that the
infrared emitter and receiver twist out of alignment, causing the photogate
not to return a reading.
i
IMPORTANT: It is highly suggested that the DataCollector be used
primarily with the included 9V power supply when conducting experiments.
Longer experiments can quickly drain the battery.
!
WARNING: Do not plug any lines from the telephone system into the
DataCollector’s sensor ports. Telephone rings generate large voltages that
can damage or destroy the DataCollector.
!
WARNING: Some computer data cables have the same RJ-11 connectors
and appear the same as the cords included with the photogates, but
differences in the internal wiring may cause damage to the photogates and
the DataCollector.
!
WARNING: When using the DataCollector, be sure not to exceed the
specifications on the voltage sensor, current sensor, or other sensor types
that may be used. Doing so can damage both the sensor and DataCollector,
as well as cause injury.
!
WARNING: Be sure to use the 9V power supply with the DataCollector when
updating the software on the device. Failure of the battery before completion
of the software update may cause the DataCollector to become inoperable.
17
Warranty Information
CPO Science warranties this instrument against defects in materials and workmanship for
a period of one year. Repair and/or replacements authorization can be obtained by
contacting CPO Science Customer Care at:
1.800.932.5227
[email protected].
CPO Science
80 Northwest Blvd.
Nashua, NH 03063
Technical support and product FAQs can be accessed at www.cpo.com/techsupport.
Be sure to fill out the warranty card that came with your kit or register online to receive
notification of software updates.
cpo
science
making it real™