1
How many bricks does it take to crack a microcell?
Mathew Rowley
Matasano Security
Abstract
This is a tale of a journey that tested almost every security related skill I have acquired over the past six years. It is a story of failures, successes, logic =laws and learning.
This is my adventure of reverse engineering a 3G microcell. It will cover topics including hardware hacking, kernel reversing, =irmware extraction and manipulation, software reversing, networking, memory forensics, social engineering, and more. I have gained a wealth of knowledge going through the process of completely pulling apart this device and want to share my trials and errors. This project covers such a broad spectrum of topics at differential depths that anyone reading should obtain some knowledge they previously did not have.
Background
The cell phone reception in my apartment is horrible; somehow my mobile phone provider was able to discover that and proactively make a response. To my surprise, I received a coupon in the mail for a free microcell/femtocell. I quickly went to the store to pick up the device and set it up in my apartment. After a little bit of con=iguration on the company’s web page, my phone gladly connected to the microcell without any user interaction. With all of the mobile research going on and the GSM hacks that have been presented in the past, my mind went wild with ideas. I proceeded to see how I could use this device to my advantage.
Hardware
Disassembly
Upon obtaining the microcell, the =irst step was to disassemble the outer panels in order to gain access to the physical board. The device had two screws behind the MAC address tape on the bottom of the device. Upon unscrewing these, the orange bottom panel can be removed. There are two places where the outside cage is attached to jumper pins on the actual board. These need to be unhooked, or removed prior to removing the outer panels. If the jumper pins are not connected in the proper order and the device is booted up, it will send a signal home, informing that the device has been tampered with. The =irst attempt at disassembling caused the device to becoming inactive due to the pins being pulled. Upon speaking with a technical support employee at the company, they informed me that the “tamper =lag” was set on my account and continually asked if I had dropped the device. After a bit of convincing, I was able to have them replace my device at the store without any fee. A thin saw blade purchased from Home Depot was used to saw through the plastic parts that attached the outer panels to the board. Upon removing those plastic connectors, the outer panels can be removed. The board now has four screws keeping it attached to the center cage. After those are removed, and the anti-‐
disassembly pins are still in their original place, the board can be powered on and booted. Board
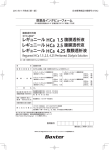
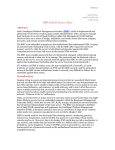
The front image of the board below is highlighted and labeled, describing major components discussed in the contents of this paper. It is broken down into the following:
•
•
Major Components (Green)
o GPS Antenna for RoyalTek
o RaLink RT2150F
o Xilinx XC3S400A
o PicoChip PC202
Debug Pins (Blue and Green)
o C541
o JP1
o JP2
o JP5
o JP6
o PL1
o PL2
Figure 1: Disassembled board, front view
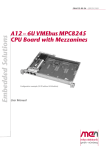
Figure 2: Disassembled board, back view
Debug Pins
There were 5 obvious locations on the board where headers had been removed (C541, JP2, JP5, JP6). Each of these was connected to a Saleae logic analyzer 1 and sampled at various rates to attempt to determine if data was being transmitted over those pins. If data was seen, it was analyzed in an attempt to determine what it actually was. Logic Analyzer
A logic analyzer is a device that can be connected to ports on a board, sampling them at different rates. This graph of high/low signals is then depicted to a user for analysis. From there, it is possible to decode the data, based on a speci=ic protocol, in order to attempt to understand what the communication =low is. The Saleae Logic software has the ability to auto analyze this data, which typically decodes into some human readable format.
The work=low for sampling pins is as follows:
1. Use a millimeter to attempt to determine which of the pins is a ground, and to ensure none are giving off higher voltage than the Saleae can handle
2. Attach the logic analyzer to the pins and con=igure it for a fairly high sample rate (typically I would start at 16MHz and 10 billion samples)
3. Start the logic software and power on the device
4. After some variable time, stop the sampling and see if there are any high/low lines
5. Attempt to “analyze” the lines. If errors are seen, lower the sampling rate and start again.
Note: On the Saleae logic 16 you can increase the sample rate by con=iguring it to sample less pins.
These de=initions became clear over time, however initial interaction with the Saleae device was confusing.
•
•
Number of samples: This is how many times you want the little pins on the board to detect if there is a signal or not.
Sample rate: How many times per second that you want to check to see if there is a signal.
So, if you increase the sample rate and keep the number of samples the same, it will be =inished sooner.
1 http://www.saleae.com/logic/
C541
The =irst set of pins I decided to look at was labeled C541. Upon attaching the logic analyzer and sampling, to my surprise, I saw some square lines indicating data. Figure 3: Zoomed out sample of C541
From here I added just about any analyzer that would allow me to only use one line. Finally, using the Async Serial analyzer, I was able to see some data.
Note: The Async Serial analyzer has an ‘auto-‐baud’ feature which will attempt to guess the baud rate of the line, but it is prone to error. If you see that some characters are being shown and then some errors, the data is most likely there but the baud rate is incorrect. You should attempt to change the baud rate to one of the common rates.
Figure 4: Async serial analysis of line 1
In order to actually see what was being transmitted, I exported the async-‐serial analysis to a CSV, imported it to Excel, then copied and pasted the column I was interested in to VI. With some search/replace magic the following was seen.
'255''255''255''255''255''255''255''255''255''255''255''255''255''255''
255''255''255''255''255''255''160''162''0'0'221'$GPGGA232354.755000M0.0
M0000*50
'239''176''179''160''162''0'?'221'$GPGSV3111206428306510421648300324301
8*71
'12''209''176''179''160''162''0'?'221'$GPGSV321119400710336352233617911
17325*79
'12''227''176''179''160''162''0'4'221'$GPGSV3311251023731081380702261*4
9
'192''176''179''160''162''0'*'221'$GPRMC232354.755V150612N*4A
'21''176''179''255''255''255''255''255''255''255''255''255''255''255''2
55''255''255''255''255''255''255''255''255''160''162''0''2''2''16''0''1
8''176''179''255''255''255''255''255''255''255''255''255''255''255''255
''255''255''255''255''255''255''255''255''160''162''0'0'221'$GPGGA23235
9.736000M0.0M0000*58
'251''176''179''160''162''0'?'221'$GPGSV3111206428306510421648300324301
8*71
'12''209''176''179''160''162''0'?'221'$GPGSV321119400710336352233617911
17325*79
'12''227''176''179''160''162''0'4'221'$GPGSV3311251023731081380702261*4
9
'192''176''179''160''162''0'*'221'$GPRMC232359.736V150612N*42
This looks like a bunch of garbage, however there is one reoccurring string in there that stands out: $GPGSV32111… after doing a quick Google search it became obvious that this is the data being sent from the GPS module to somewhere else. Looking at the placement of the GPS chip, this theory made sense. However, this was of no real interest to me, as I wanted something I could interact with. When con=iguring the device, you have to register a speci=ic location (for 911 and so you can’t use it in different countries). If you were inclined to use this device where it is not registered (possibly outside of the country), it may be possible to remove the GPS chip and place something that replays data that was captured at a valid location.
JP1
Moving down the board, there is another set of four pins labeled JP1. The same process described above was performed to view the data.
Figure 5: Zoomed out sample of JP1
Note that the zoomed out image has a much different pattern than the GPS debug pins. Upon dumping the data, I saw something much more interesting:
Figure 6: Dumped data from JP1
Linux boot text!
After doing a bit of reading, it seemed that this was a serial connection, just like old-‐
school RS232 ports used to connect to and debug routers and switches. I was able to purchase a 3v3 FTDI USB cable that allowed me to connect to these pins and send data in and out. The pin con=iguration is:
.-v---------.
| RX TX G x |
`-----------’
Tip: There was a long time where I was able to see data coming in over the wire, however every time I tried to send data, it was not displayed properly on the screen. I tried every possible line speed con=iguration and nothing worked. I then realized that I had switched the RX and the Ground, which was causing everything to be misinterpreted. Make sure your pin-‐out is correct.
After connecting the FTDI cable, I used screen to communicate with the board:
$ screen /dev/tty.usbserial-AFU80ROT 57600
The baud rate was determent based on what the logic analyzer auto-‐bauded. After booting up the device, it proceeded through a UBoot boot loader sequence, then through a normal Linux boot, straight to a ‘login:’ prompt.
This was of high interest, but will be discussed further in the software section of this paper. JP2, JP5, JP6
There was no signi=icant data seen on any of these pins. JP5 was the only set of pins that showed any data. One of the pins had a constant high/low switch. No other pins on JP5 transmitted any data.
Based on documentation found for the development board of the PC302 2, I speculated that one of these pins was in fact the RS232 connection for the PicoChip, but the documentation explained that the development board must have two separate pins jumped for the TX/RX to be transmitted. No combination of jumping the other pins was able to display any data on the line.
PL2
Initially, when sampling the PL2 pins, there was data coming on some of them. However, none of the Saleae analyzers could decode the data. The PL2 has 14 pads, laid out in two rows of seven. In turn, the logic analyzer was con=igured to use all of its pins to sample. This only allowed for a maximum sampling rate of 16MHz per pin. However, during sampling, there was only a small set of pins that were transmitting data.
2 http://www.scribd.com/doc/53283168/PC-‐102851-‐ML-‐1-‐PC7302-‐Quick-‐Start-‐
Guide
Figure 7: PL2 pin sampling
Only sampling the three pins that were showing data allowed for a higher sampling rate (up to 50MHz). Upon increasing the sample rate, and con=iguring an SPI analyzer a different picture could be seen.
Figure 8: PL2 pin with SPI analyzer
It took a bit of time to understand how to con=igure the SPI analyzer, but it makes sense if you know some key concepts of SPI.
SPI
SPI is a protocol used for communication between chips. After understanding the following points, it should make more sense on how the SPI analyzer was con=igured:
•
SPI can transmit at up to 100MHz (this is why we needed to increase the speed of the Saleae)
•
•
•
Communicates in a Master/Slave mode where there can be multiple slaves
There are four lines:
o MOSI – Output
o MISO – Input
o Clock – Not like your typical metronome clock, but will be explained in the next point
o Enable/Slave Select – Determine which slave the master is talking to
The clock operates in one of two modes: “low to high” or “high to low.” Data on one of the lines (MOSI, or MISO) is “read” when the clock is changing from low to high, or high to low, depending on the mode. So, if it’s set up on “low to high” mode, when you see the line on the clock go from bottom to top, that is when the MOSI and MISO lines are read.
With that information, you can see that the clock is the one moving up and down the most, and the output/input lines are the only other two sending data. In this case, the Enable/Slave Select line is set as none.
• 1 = Clock
• 2 = MOSI
• 3 = MISO
Furthermore, you can see that the clock is set up in chucks of 16 up’s, that will mean that the data being sent is most likely being transmitted in 16 bit or some mod of 16 bits. The above screenshots is displaying the text in ASCII with 8bit data chunks.
At the time of writing this, it is unclear what the data being transmitted actually is.
PL1
The Saleae logic analyzer did not display any data when being connected to the PL1 pins. However attempting to communicate with them using a common con=iguration of JTAG was successful. Before getting into the details, a brief background on JTAG is needed.
JTAG Background
JTAG is a method/standard used to test and manipulate hardware after it has already been placed on a board. The full details of JTAG and how it works are beyond the scope of this paper. However, there are a few key points that should be understood:
1. JTAG pins, on their own, do not send any data. So you will not see anything if you only have a logic analyzer connected 2. There are 5 pins that must be connected in order to communicate with a device (VREF, TMS, TCK, TDO, TDI)
3. The cable provides the clock signal to the board (presumably that’s why there is no data on the pins on their own)
4. Multiple chips can be “daisy chained” together. So one JTAG plug/pin-‐out can communicate with multiple chips on a board
5. Each chip that is connected in a JTAG chain is called a TAP
There are two 2x7 headers (highlighted in RED: PL1 and PL2) located on the board. Upon inquiry, colleagues thought that the con=iguration “screamed JTAG.” However, only one of them was successfully communicated with. Hardware/SoHware
The Olimex ARM-‐USB-‐OCD-‐H3 was used as a JTAG cable in order to communicate with the board. OpenOCD software4 was used to perform TAP discovery and further JTAG communication. The OpenOCD software uses a client/server architecture. The server is used to facilitate user communication, scripting and debugging. To run the software, you start the server, then can either connect to it via telnet or con=igure GDB as a remote debugging session.
Pin-‐out Discovery
Since nothing was known about the board, the discovery of JTAG pins was done through the following trial and error procedure:
1. If there is data on the pins, then its not JTAG
2. If there is a known con=iguration for the pins, plug the JTAG up accordingly (if this does not work, try the same con=iguration rotated 180 degrees, as we do not know which is PIN0)
3. Power on the device
4. Start OpenOCD software. If it can discover TAPs, then you have a JTAG port
PL1
The Xilinx Parallel pin-‐out5 was used for the PL1 pads:
PL1
.
.--------.
| x
vg |
| x
g |
| tdi g |
| tdo g |
| tck g |
| tms g |
| vref g |
3 https://www.olimex.com/dev/arm-‐usb-‐ocd-‐h.html
4 http://openocd.sourceforge.net/
5 http://www.jtagtest.com/pinouts/xilinx
`--------'
The OpenOCD documentation is upwards of 140 pages, and without wanting to read it all, the =irst thing I searched for was other people’s experiences/tutorials. After reading through several tutorials, and parts of the OpenOCD documentation, I determined that in order to communicate with a chip I needed to con=igure OpenOCD to communicate with my cable and con=igure a TAP. The OpenOCD documentation states:
TAP con(iguration is the (irst thing that needs to be done after interface and reset con(iguration. Sometimes it's hard (inding out what TAPs exist, or how they are identi(ied. Vendor documentation is not always easy to (ind and use.
To help you get past such problems, OpenOCD has a limited autoprobing ability to look at the scan chain, doing a blind interrogation and then reporting the TAPs it (inds. To use this mechanism, start the OpenOCD server with only data that con(igures your JTAG interface, and arranges to come up with a slow clock (many devices don't support fast JTAG clocks right when they come out of reset).
This means that TAP identi=ication is partially automated. I came up with a plan where the main work=low for discovering and communicating with JTAG devices using OpenOCD was as follows:
1.
2.
3.
4.
Install OpenOCD software and OS drivers
Con=igure the cable in OpenOCD
Allow for OpenOCD AutoDiscovery
Use AutoDiscovery data to con=igure a TAP
OpenOCD installation was initially performed on an Ubuntu 11 OS through APT, however due to some data discrepancies during initial communication, the OpenOCD team pointed me to a new mpsse-‐driver version of OpenOCD. This version was used and can be obtained via the following command:
$ git clone http://openocd.zylin.com/openocd && cd openocd && git fetch
origin refs/changes/34/534/5 && git checkout -b ftdi FETCH_HEAD
By reading through the documentation I learned base con=iguration =iles are included within a main con=iguration =ile using TCL commands. However I wanted to include everything in a self contained con=ig. The OpenOCD project provides a con=iguration for the exact cable I am using:
#
# Olimex ARM-USB-OCD-H
#
# http://www.olimex.com/dev/arm-usb-ocd.html
#
interface ft2232
ft2232_device_desc "Olimex OpenOCD JTAG ARM-USB-OCD-H"
ft2232_layout olimex-jtag
ft2232_vid_pid 0x15ba 0x002b
The only other addition that is needed is to de=ine the JTAG speed with either an ‘adapter_khz’ or ‘jtag_rclk’. The OpenOCD documentation says that auto probing is performed better at lower speeds and gives a sample con=iguration:
reset_config trst_and_srst
jtag_rclk 8
Which is what I used in my con=iguration =ile. The con=iguration =ile currently looks like:
interface ft2232
ft2232_device_desc "Olimex OpenOCD JTAG ARM-USB-OCD-H"
ft2232_layout olimex-jtag
ft2232_vid_pid 0x15ba 0x002b
reset_config trst_and_srst
jtag_rclk 8
Upon starting the OpenOCD server I was able to see that some sort of communication was happening:
$ sudo ./openocd -f wuntee.cfg
Open On-Chip Debugger 0.5.0 (2012-07-02-13:56)
Licensed under GNU GPL v2
For bug reports, read
http://openocd.berlios.de/doc/doxygen/bugs.html
Info : only one transport option; autoselect 'jtag'
3000 kHz
trst_and_srst separate srst_gates_jtag trst_push_pull srst_open_drain
RCLK - adaptive
Info : device: 6 "2232H"
Info : deviceID: 364511275
Info : SerialNumber: OLUTHMH9A
Info : Description: Olimex OpenOCD JTAG ARM-USB-OCD-H A
Info : max TCK change to: 30000 kHz
Info : RCLK (adaptive clock speed)
Warn : There are no enabled taps. AUTO PROBING MIGHT NOT WORK!!
Warn : AUTO auto0.tap - use "jtag newtap auto0 tap -expected-id
0x02220093 ..."
Warn : AUTO auto0.tap - use "... -irlen 2"
Error: IR capture error at bit 2, saw 0x3FFFFFFFFFFFFFF5 not 0x...3
Warn : Bypassing JTAG setup events due to errors
Warn : gdb services need one or more targets defined
Auto probing seems to be working, but there were some errors.
Note: When attempting to communicate with a non JTAG port (or using a miscon=igured pin setup), one the following was seen:
1. The interrogation returned all ones
2. The interrogation returned all zeros
3. There was a timeout and there was no data received
The next step was to decipher what all of this meant. First I tried to telnet to the OpenOCD command interface and run ‘jtag init’, which returned errors. After googling the ‘expected-‐id’ displayed during auto probing, I found a few links which were directly related to the speci=ic Xilinx chip that is installed on the board. After some more reading about OpenOCD and JTAG I found that in order to successfully initialize the JTAG chain I was going to have to determine the correct combination of the following things:
•
•
•
•
expected-‐id
irlen
ircapture
irmask
Fortunately there is another concept/standard closely related to JTAG called Boundary Scan De=inition Language (BSDL) which is a con=iguration =ile on how to communicate via JTAG to a chip. These =iles includes all of the information needed above. Xilinx provides these for each of their speci=ic chipsets through their webpage6, and I was able to download the BSDL =ile for my speci=ic Xilinx chip. A quick search of the xc2s400.bsd =ile shows the following lines:
...
attribute INSTRUCTION_LENGTH of XC3S400_BARE : entity is 6;
...
attribute INSTRUCTION_CAPTURE of XC3S400_BARE : entity is
-- Bit 5 is 1 when DONE is released (part of startup sequence)
-- Bit 4 is 1 if house-cleaning is complete
-- Bit 3 is ISC_Enabled
-- Bit 2 is ISC_Done
"XXXX01";
...
Using that information along with the auto-‐discovered “expected-‐id”, I now could put together a fully functional JTAG con=iguration =ile:
interface ft2232
ft2232_device_desc "Olimex OpenOCD JTAG ARM-USB-OCD-H"
ft2232_layout olimex-jtag
ft2232_vid_pid 0x15ba 0x002b
reset_config trst_and_srst
jtag_rclk 8
jtag newtap xilinx tap –irlen 6 –expected-id 0x02220093 –ircapture 0x01
Upon restar6ng the server, I saw the following output:
$ sudo openocd -f probe.cfg
6 http://www.xilinx.com/support/download/index.htm
Open On-Chip Debugger 0.6.0-dev-00603-g43863b6 (2012-07-10-12:01)
Licensed under GNU GPL v2
For bug reports, read
http://openocd.sourceforge.net/doc/doxygen/bugs.html
Info : only one transport option; autoselect 'jtag'
RCLK - adaptive
3000 kHz
trst_and_srst separate srst_gates_jtag trst_push_pull srst_open_drain
Info : clock speed 3000 kHz
Info : JTAG tap: unk1.tap tap/device found: 0x02220093 (mfg: 0x049,
part: 0x2220, ver: 0x0)
Warn : gdb services need one or more targets defined
The next step was to telnet to the OpenOCD command line interface and perform the ‘jtag init’ func6on. Which upon success should look like this:
> jtag init
Info : JTAG tap: unk1.tap tap/device found: 0x02220093 (mfg: 0x049,
part: 0x2220, ver: 0x0)
I now had a func6oning JTAG communica6on channel to the Xilinx chip. However, there was not much I could accomplish with that. During this process, the one thing I failed to realize was that there wasn’t much of anything I could gain from this par6cular JTAG access. JTAG is a very open protocol which defines very few opera6ons. My main goal was to gain access to the PicoChip or the Flash chip connected to it. These would have showed up in the auto probe if they were in the JTAG chain. Although this was an excellent learning experience, it got me no closer to my goal.
SoHware
As explained in a previous section, I was able to obtain access to a serial communication channel that brought us to a Linux ‘login’ prompt. My goal now was to gain access to this operating system.
Obtaining the Filesystem
Initially, I was not starting the serial cable terminal session until after the device was booted up which meant not being able to see the beginning of the boot process. When I plugged the serial FTDI cable to the pins on the device, started ‘screen’, and then booted the device up, I noticed that there was a small pause after the UBoot text.
============================================
Ralink UBoot Version: 3.7.1
-------------------------------------------ASIC 2150_MP2 (MAC to GigaMAC Mode)
DRAM COMPONENT: 128Mbits
DRAM BUS: 16BIT
Total memory: 16 MBytes
Date:Jan 7 2009 Time:12:26:56
============================================
icache: sets:256, ways:4, linesz:32 ,total:32768
dcache: sets:128, ways:4, linesz:32 ,total:16384
##### The CPU freq = 384 MHZ ####
SDRAM bus set to 16 bit
SDRAM size =16 Mbytes
Please choose the operation:
1: Load system code to SDRAM via TFTP.
2: Load system code then write to Flash via TFTP.
3: Boot system code via Flash (default).
4: Entr boot command line interface.
9: Load Boot Loader code then write to Flash via TFTP.
<PAUSE>
At that <PAUSE> I was able to quickly press ‘4’ and enter into the UBoot command line interface. Without knowing much about UBoot (or bootloaders in general) I then started reading the UBoot manual7 to see what functionality was available to me.
After a bit of contemplation, I decided that the ‘md’ or memory display command was going to be my best bet. The ‘md’ command would allow me to display any arbitrary memory location on the =lash chip. At this point I was also able to =ind a page that had some information on the board. The page used to be hosted on http://
exploitworkshop.org/ ,but had since been taken down. Luckily Google’s cache still had it (the cached page is no longer up), and I saved it locally. One key piece of information it had was a memory layout of the =lash chip:
Figure 9: ExploitWorkshop.org Ralink Slash layout
7 http://www.denx.de/wiki/publish/DULG/DULG-‐tqm8xxl.html
From here I was able to create a command that would dump the full 4M =lash chip using the ‘md’ command in the UBoot boot loader. While it was dumping the raw memory, I was using ‘screen’ to log the output.
RT2150 # md bfc00000 1000000
bfc00000: 100000ff 00000000 100000fd
bfc00010: 10000219 00000000 10000217
bfc00020: 10000215 00000000 10000213
…
bfffffd0: ffffffff ffffffff ffffffff
bfffffe0: ffffffff ffffffff ffffffff
bffffff0: ffffffff ffffffff ffffffff
00000000
00000000
00000000
................
................
................
ffffffff
ffffffff
ffffffff
................
................
................
I then created a ruby script that allowed me to convert the raw dump into a binary =ile. This took a bit of time as I had to take into account things like endianness. The script can be seen in Appendix A.
After having a clean binary dump of the =ile, I ran strings on the entire thing to ensure that it was in fact what I was looking for.
$ strings -n 10 full_flash.bin | head
__remove_pages
TERM=linux
<4>Parameter %s is obsolete, ignored
<3>Unknown boot option `%s': ignoring
Too many boot env vars at `%s'
Too many boot init vars at `%s'
<4>Malformed early option '%s'
early options
<5>Kernel command line: %s
Booting kernel
There is a tutorial on extracting =irmware from a Linksys router8 that became the basis of my methodology for attempting to get some sort of =ilesystem out of this dump. First, running ‘binwalk’ 9 on the initial image resulted in the following output:
Figure 10: Initial binwalk of the Slash dump
8 http://www.devttys0.com/2011/05/reverse-‐engineering-‐=irmware-‐linksys-‐
wag120n/
9 http://code.google.com/p/binwalk/
This pretty much matched the memory layout from the ExploitWorkshop web page. From here, the LZMA partitions were dumped using ‘df’ and each was attempted to be un-‐lzma’ed. The only partition that was successfully decompressed was the last one. This partition showed even more information when ‘strings’ was run against it.However, ‘=ile’ only showed it as a data blob. I then ran ‘binwalk’ on the unlzmaed =ile, which returned a whole set of new LZMAed partitions.
Figure 11: Binwalk of the unlzmaed partition
Seeing ‘squasfs’ in this dump got my hopes up. I pulled each of those out of the =ile and attempted to ‘unsquash’ them; nothing succeeded. I then attempted to modify the =ile’s ‘magic’ within the dump similar to the tutorial mentioned above. Again, nothing worked.
‘dd’ was used again to dump each of the LZMA portions to =iles. Each partition was then decompressed. The only one that succeeded was, of course, the last. Running ‘strings’ on this newly decompressed =ile displayed:
lzma4.18: ASCII cpio archive (SVR4 with no CRC)
Being the impatient person I am, I saw ‘ASCII’ and assumed that it was nothing. I then ran ‘binwalk’ again on this =ile which displayed much more promising information:
Figure 12: Binwalk output for lzma4.18
This showed that there were actually MIPS binaries in the =ile. Viewing the contents of the decompressed =ile gave me a little more insight:
Figure 13: Contents of lzma4.18
You can see some long numbers, then a =ilename, then some random data. After googling around a bit I was able to conclude that the =ile was in fact a ‘CPIO Archive’. I then re-‐looked at the output of the ‘=ile’ command, and proceeded to see what an idiot I was.
The next step was to un-‐cpio the =ile. Using ‘cpio’ to list the =iles con=irmed that this was a valid archive:
$ cpio -it -F lzma4.18
/init
/var
/proc
/usr
/usr/sbin
/usr/sbin/setlogcons
/usr/sbin/ipc_client
/usr/sbin/config_server
/usr/sbin/cs_client
/usr/sbin/telnetd
/usr/sbin/udhcpd
/usr/sbin/rmm_client
/usr/sbin/chpasswd
/usr/sbin/ipc_server
/usr/bin
…
After reading a bit about CPIO I realized there was a limitation; when un-‐archiving a CPIO archive, the =iles go to their exact locations and there did not seem to be a way to change this to a relative directory. Instead, I had to ‘Rename =iles interactively’ – there were 208 =iles.
Gaining Root Access
I now had the boot =ilesystem and the =irst thing I looked for was the /etc/passwd =ile. There were two users (root and sshd), both having the same password hash. This was a 14 character string that did not look like anything I had seen in an /etc/
passwd =ile (after some research, it was an old-‐school crypt() style hash), however I still ran John the Ripper against it on a server I had at home. After two days of nothing, I did not have any faith that the hash was going to be cracked, so I then attempted to look for another way of gaining access to the operating system.
The =irst thing I wanted to understand was the boot process. I started looking at the strings that were displayed during the boot procedure and referencing them within =iles that I dumped. This included viewing the contents of scripts, as well as decompiling and reversing binary applications. All of the executables were MIPS binaries, which I was not familiar with, introducing another learning curve. After a few days of reversing, I found nothing useful. The main place I was looking was the /
sbin/*.sh scripts, as well as certain binaries that simply ran the ‘_eval‘ function without sanitizing input. The majority of these commands =irst obtained values from a part of the =lash called ‘PICO_CONFIG.’ This portion of memory was basically a nested array of key value pairs and was accessed via the ‘cs_client’ application.
[ dev ]--[ switch ]--[ num ]--[ 7 ]
[ wan ]--[ num ]--[ 1 ]
[ 0 ]--[ conn_type ]--[ 1 ]
[ ip ]--[ 0.0.0.0 ]
[ netmask ]--[ 0.0.0.0 ]
[ mtu ]--[ 1500 ]
[ dev_name ]--[ eth2.2 ]
[ gateway ]--[ num ]--[ 0 ]
[ 0 ]--[ ip ]--[ 0.0.0.0 ]
…
[ sys ]--[ op_mode ]--[ 0 ]
[ basic_realm ]--[ W3GFP-100 ]
[ host ]--[ name ]--[ PICO_ROUTER ]
[ swdirurl ]--[ tftp://192.168.157.186/754image-1.0.25 ]
[ restore_default ]--[ 0 ]
[ tamper_proof ]--[ 100110 ]
[ fw ]--[ 0 ]--[ name ]--[ /tmp/754-image-1.0.25 ]
[ swdirurl ]--[ tftp://
192.168.157.186/754-image-1.0.25 ]
[ 1 ]--[ name ]--[ /tmp/840-router-1.0.31 ]
[ swdirurl ]--[ tftp://
192.168.157.186/840-router-1.0.31 ]
[ boot_loc ]--[ 0 ]
[ tampered ]--[ 0 ]
[ serial_num ]--[ 157750777 ]
…
[ firewall ]--[ pf ]--[ enable ]--[ 1 ]
[ num ]--[ 3 ]
[ 0 ]--[ proto ]--[ tcp ]
[ port ]--[ 80 ]
[ dstip ]--[ 192.168.157.186
[ 1 ]--[ proto ]--[ tcp ]
[ port ]--[ 22 ]
[ dstip ]--[ 192.168.157.186
[ 2 ]--[ proto ]--[ tcp ]
[ port ]--[ 8080 ]
[ dstip ]--[ 192.168.157.186
[ 3 ]--[ proto ]--[ tcp ]
[ port ]--[ 20000 ]
[ dstip ]--[ 192.168.157.186
[ enable ]--[ 1 ]
[ snat ]--[ enable ]--[ 0 ]
[ num ]--[ 0 ]
[ ipcserver ]--[ enable ]--[ 1 ]
]
]
]
]
There are a few interesting things in there:
1. tamper_proof – this seems to be the con=iguration of the ‘tamper’ pins on the front and back of the board. One of the applications actually allows you to set the device in ‘learn mode,’ which presumably writes the current pin con=iguration.
2. There looks like =irmware images on a 192.168.157.186 host
3. There is a =irewall node that resembles what is being seen at boot
[FW] [C]iptables -t nat -A PREROUTING -p tcp --dst 0.0.0.0 --dport 80 j DNAT --to 192.168.157.186:80
[FW] [C]iptables -t nat -A PREROUTING -p tcp --dst 0.0.0.0 --dport 22 j DNAT --to 192.168.157.186:22
[FW] [C]iptables -t nat -A PREROUTING -p tcp --dst 0.0.0.0 --dport 8080
-j DNAT --to 192.168.157.186:8080
This was of interest because when disassembling the ‘con=ig_server’ application, I found this:
First the application uses ‘cs_client’ to pull static keys out of the PICO_CONFIG, then for the ‘iptables’ portion it initializes a command here:
Tip: If you see the last 2 lines of this function, it does a ‘b loc_412254’ and then performs another ‘addiu’ instruction. This was confusing because the branch instruction will always be called, so how is the ‘addiu’ instruction called? This is possible because MIPS architecture implements ‘instruction pipelining.’ Meaning that at the same time one instruction is executed, the next instruction is loaded into the “pipeline.” The branch happens, and the ‘addiu’ instruction is in queue, then the addiu is pushed to the current instruction, and the start of the branch target is loaded. This is also why you see some random ‘NOP’s.
The application then jumps to ‘cs_execute_id’ which performs…
or,
_eval(sh –c [IPTABLES STRING] > /dev/null 2>&1)
There is no sanitization of the PICO_CONFIG or the return of the ‘cs_con=ig’ command used to obtain the iptables string. If I could modify this PICO_CONFIG portion of =lash, I would have command injection. The UBoot command prompt not only had the ability to read from =lash, but also to write to it. If I could write to =lash and modify the PICO_CONFIG data, I should be able to gain access to the device. Unfortunately, everything that I tried did not work. Any ‘write to =lash’ commands would not actually write (reading that same memory address back would not show changes after a write). This is when I realized that there is a ‘protect’ command in UBoot as well, and based on the boot messages, much of the =lash memory is protected from being written to.
In an attempt to un-‐protect memory sectors, I discovered a command that showed environmental variables and commands. One in particular showed ‘protect off’:
RT2150 # printenv
bootcmd=tftp
bootdelay=3
baudrate=57600
ethaddr="00:AA:BB:CC:DD:10"
ipaddr=10.10.10.123
serverip=10.10.10.3
preboot=echo;echo
ramargs=setenv bootargs root=/dev/ram rw
addip=setenv bootargs $(bootargs) ip=$(ipaddr):$(serverip):$
(gatewayip):$(netmask):$(hostname):$(netdev):off
addmisc=setenv bootargs $(bootargs) console=ttyS0,$(baudrate) ethaddr=$
(ethaddr) panic=1
flash_self=run ramargs addip addmisc;bootm $(kernel_addr) $
(ramdisk_addr)
kernel_addr=BFC40000
u-boot=u-boot.bin
load=tftp 8A100000 $(u-boot)
u_b=protect off 1:0-1;era 1:0-1;cp.b 8A100000 BC400000 $(filesize)
loadfs=tftp 8A100000 root.cramfs
u_fs=era bc540000 bc83ffff;cp.b 8A100000 BC540000 $(filesize)
test_tftp=tftp 8A100000 root.cramfs;run test_tftp
boot_loc=0
backdoor=0
manuf_test=0
fail_cnt=0
stdin=serial
stdout=serial
stderr=serial
ethact=Eth0 (10/100-M)
Environment size: 829/65532 bytes
In an attempt to turn off memory protection and write to a con=iguration portion of =lash, I ran the command ‘u_b’. I did this prior to understanding what it did, and this resulted in a second brick. It essentially erased the entire =lash chip. After a few days, I again was able to manipulate the technical support and sales people into replacing my device: “I don’t know what happened, it just stopped working!”
Reversing the Kernel func1on table
During the wait for my new device to arrive, I realized that not only did I have the boot =ilesystem, but I also had the raw Linux kernel image. One of the binwalks showed:
DECIMAL
HEX
DESCRIPTION
…
2228224
0x220000
uImage header, created: Thu Mar 4
03:17:29 2010, image size: 1690167 bytes, Data Address: 0x80000000,
Entry Point: 0x802A0000, CRC: 0x70DC4C09, OS: Linux, CPU: MIPS, image
type: OS Kernel Image, compression type: lzma, image name: Linux Kernel
Image
After dumping this with ‘dd’ and attempting to load it in IDA, I was able to =ind the correct con=iguration (which was all given to me in the binwalk):
The =ile loaded will be of type ‘mipsl’, because the ‘=ile’ command on any of the binaries shows that they are ‘LSB’ (least signi=icant bit).
Figure 14: IDA ConSiguration to load the ramdisk
To get the decompiled image I manually went to the entry point (0x802A0000) and press ‘c’ to start the analysis.
This will start generating blocks and eventually you will end up with a bunch of unnamed functions. This is the kernel, however it is not very useful since it has a lack of names and symbols. When looking at the ‘strings’ in IDA, I noticed that there were a lot of what looked like kernel function names. Figure 15: Kernel functions in IDA strings
After doing a bit of analysis, I determined that there was a portion of the ramdisk that was a linked list associating memory addresses of the start of a function to the text representation of what that function was. I was able to con=irm this by =inding the start address of the ‘memcpy’ string, then searching for that sequence of bytes in the rest of the image. There was only one other location that displayed this value within the =ile. The next 4 bytes was the memory address of the start of a function. I was then able to write a ruby script (Appendix B) that stripped the strings and addresses out of the ramdisk and generated an IDA script which could be loaded to rename all of the functions with their proper names.
Figure 16: IDA script to rename functions
Figure 17: Renamed functions in IDA
This did not rename all of the functions. However, it did give me a much better idea of what was going on in the loaded image.
John the Ripper
Also, while waiting for my new device to arrive, I was greeted to a lovely surprise from John. After 7 days, the root password was cracked. It ended up being a 7 character, all lower case string. This would now give me access to the actual operating system.
GPL
Around this same time, I received an email from a friend linking me to the software license agreement for the particular device. Speci=ically, it states:
Where speci(ic free/open source license terms (such as the GNU Lesser/General Public License) entitle you to the source code of such software, that source code will be available to you at cost from [COMPANY] for at least three years from the purchase date of your product. If you would like a copy on a CD of such open source code, upon written request and receipt of payment of $9.99 (to cover shipping and handling costs), [COMPANY] will mail to you a copy. Please send your written request and check payment (payable to [COMPANY]), together with your name, mailing address, email address and phone number to:
Which was followed with a mailing address and an email address for any questions. I sent an email to the address asking if it was possible to obtain access to the GPL’ed software without mailing for a CD. They happily provided me with two FTP links for the following =iles:
•
•
DPH151_V1.0.25-‐5.tar.gz – This is the full build chain for the device that will allow you to build an image =ile for the device on Ubuntu OS. It contains a con=iguration =ile that allows full control of what applications are included in the =inal image.
ip.access-‐AP-‐IPA1.0-‐3.zip – This seems to be source code for another (PICO) processor on the board. It does not contain a full build chain. It is just the source code for speci=ic packages and patches, as well as the licenses for the associated packages.
RALink Internals
My new device arrived and I was now able to gain access to the RALink, or as it’s referred to internal to the source, the Router. From here a lot of the internal architecture became clearer. Architecture
Upon power up, the router/Ralink chip is booted =irst. Then it sends a GPIO signal to the pico chip, which is then powered on. The router initiates a DHCP daemon on a local IP address of 192.168.157.185/30 where the pico chip will send a request and get 192.168.157.186. All network communication from the pico chip will be routed through the routers interface and then out to the network.
IPtables
The router sets up a NAT to forward a few ports to the pico chip. However, none of those ports seem to be open. In fact, after performing a port scan, no ports on the pico chip seem to be open.
Chain PREROUTING (policy ACCEPT 0 packets, 0 bytes)
pkts bytes target
prot opt in
out
source
destination
0
0 DNAT
tcp -- *
*
0.0.0.0/0
0.0.0.0
tcp dpt:80 to:192.168.157.186:80
0
0 DNAT
tcp -- *
*
0.0.0.0/0
0.0.0.0
tcp dpt:22 to:192.168.157.186:22
0
0 DNAT
tcp -- *
*
0.0.0.0/0
0.0.0.0
tcp dpt:8080 to:192.168.157.186:8080
Chain POSTROUTING (policy ACCEPT 11 packets, 660 bytes)
pkts bytes target
prot opt in
out
source
destination
0
0 MASQUERADE all -- *
eth2.2 192.168.157.184/30
0.0.0.0/0
Chain OUTPUT (policy ACCEPT 11 packets, 660 bytes)
pkts bytes target
prot opt in
out
source
destination
ipcserver
There is an IPCserver that is running on the router that allows speci=ic commands to be sent (from either the pico processor or the router) to obtain information about the device (such as uptime, tamper status, etc).
The ‘ipc_client’ on the router has the following functions.
command list: reset factory_reset tamper download_finished
wizard
This seems to listen for commands on a multicast address and return the associated command data. Any command that has arguments should be vulnerable to command injection. This is similar to the explanation of the vulnerability in the IPtables setup. The fail0ver=low team was able to discover that one of these commands would allow you to run remote commands on the device10.
cfg_flash
As named, this application reads and writes data to the =lash chip’s PICO_CONFIG section. This application has the ability to create a telnet backdoor to the device. Upon normal boot, telnet is bound to the routers internal address, however if you run the following command:
cfg_flash -s -n backdoor -v 1
the telnet daemon will be listening on all IP address upon reboot. However, the ‘con=ig_server’ and the ‘wizard’ will always switch this =lag back off, so the above command must to be run prior to each reboot for the telnet backdoor to persist.
Debugging Binaries
‘tcpdump.lzma’ was the only debugging utility found on the device. It can be decompressed and run as tcpdump. Any other binaries must be compiled speci=ically for the device.
Cross Compiling
In order to run any external application on this device, it must be compiled speci=ically for MIPS LSB and statically linked. Prior to having the full build chain, this was performed using ‘qemu’. The details of how to create and compile applications through qemu can be found in a recent blog post11 .
Adding raw application source to the build chain, or enabling them in the provided build chain con=iguration was suf=icient for building new applications quickly. 10 http://fail0ver=low.com/blog/2012/microcell-‐fail.html
11 http://intrepidusgroup.com/insight/2011/10/qemu-‐mips-‐netcat/
Appendix A: memToBin.rb
#!/usr/bin/env ruby
infile = ARGV[0]
outfile = ARGV[1]
start = ARGV[2]
finish = ARGV[3]
puts("#{start} - #{finish}");
#bfc00000: 100000ff 00000000 100000fd 00000000
................
f = File.new(infile, "r")
fout = File.new(outfile, "w")
writeFlag = false
while(line = f.gets)
splitLine = line.strip.split(/\s+/, 6)
if(splitLine.size == 6)
address=splitLine[0]
address=address[0,8]
hex1=splitLine[1]
hex2=splitLine[2]
hex3=splitLine[3]
hex4=splitLine[4]
ascii=splitLine[5]
str = "#{address} #{hex1}#{hex2}#{hex3}#{hex4} #{ascii}"
if(address.downcase == start.downcase)
puts("Found start: #{str}")
writeFlag = true;
end
if(writeFlag == true)
unhex1=[hex1].pack("H*").reverse
unhex2=[hex2].pack("H*").reverse
unhex3=[hex3].pack("H*").reverse
unhex4=[hex4].pack("H*").reverse
unhex = unhex1 + unhex2 + unhex3 + unhex4
fout.write(unhex)
end
end
end
f.close()
if(address.downcase == finish.downcase)
puts("Found finish: #{str}")
fout.close();
exit
end
Appendix B: genSymbolTable.rb
#!/usr/bin/env ruby
def hex(hex)
return(hex.to_s(16).rjust(2, "0"))
end
def hexToAddr(hex)
# 01234567
# 54cc2780
# should be
# 8027cc54
return hex(hex[3])+hex(hex[2])+hex(hex[1])+hex(hex[0])
end
off_base = 0x80000000
off_start = 0x27cc4c
off_end = 0x286fbd
addr_off_start = 0x2761c4
addr_off_end = 0x27a8c4
f_ramdisk = "ramdisk"
separator = 0x00
f = File.open(f_ramdisk, "r")
file = f.read()
ctr = 0
func = ""
addr_str_link = {}
for i in (0 .. (addr_off_end - addr_off_start)/8)
# 0 = [0 .. 3] : [4 .. 7]
# 1 = [8 .. 11] : [12 .. 15]
# 2 = [16 .. 20] : [21 .. 25]
str_addr_start = 8 * i
str_addr_end = str_addr_start + 3
func_addr_start = str_addr_end + 1
func_addr_end = func_addr_start + 3
str_addr = hexToAddr(file[addr_off_start+str_addr_start ..
addr_off_start+str_addr_end])
func_addr = hexToAddr(file[addr_off_start+func_addr_start ..
addr_off_start+func_addr_end])
addr_str_link[str_addr] = func_addr
end
#addr_str_link.each { |k,v| puts "#{k} => #{v}" }
last_addr_str = off_base + off_start
file[off_start .. off_end].split(//).each do |f_c|
if(f_c != "\0") then
func = func + f_c
else
"\");")
end
if(func.strip != "") then
str_addr = last_addr_str.to_s(16)
#puts("Looking for: " + str_addr + "(" + func + ")")
func_addr = addr_str_link[str_addr]
#puts(func + " = " + func_addr)
puts("MakeName(0x" + func_addr + ", \"" + func +
func = ""
end
last_addr_str = off_base + off_start + ctr + 1
end
ctr = ctr + 1