1
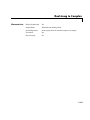
XY Graph
Purpose
8XY Graph
Library
Sinks
Description
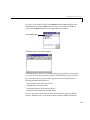
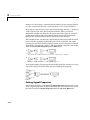
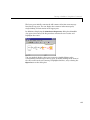
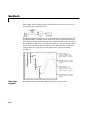
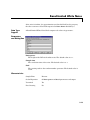
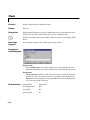
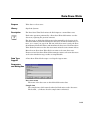
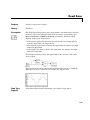
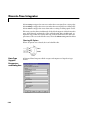
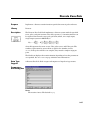
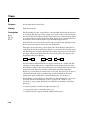
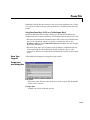
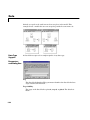
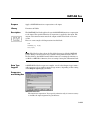
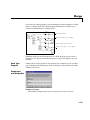
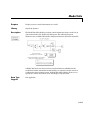
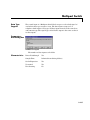
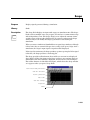
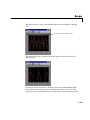
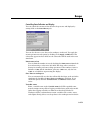
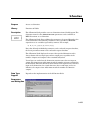
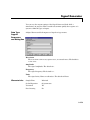
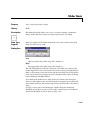
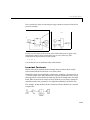
The XY Graph block displays an X-Y plot of its inputs in a MATLAB figure
window.
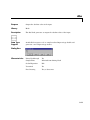
Display an X-Y plot of signals using a MATLAB figure window.
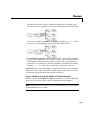
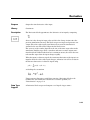
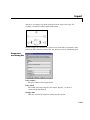
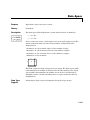
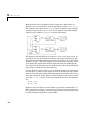
The block has two scalar inputs. The block plots data in the first input (the x
direction) against data in the second input (the y direction). This block is useful
for examining limit cycles and other two-state data. Data outside the specified
range is not displayed.
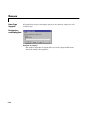
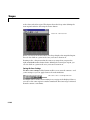
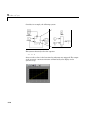
Simulink opens a figure window for each XY Graph block in the model at the
start of the simulation.
For a demo that illustrates the use of the XY Graph block, enter lorenzs in the
command window.
Data Type
Support
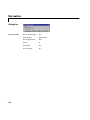
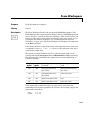
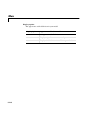
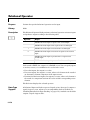
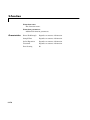
An XY Graph block accepts real signals of type double.
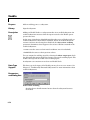
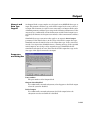
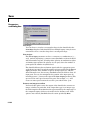
Parameters
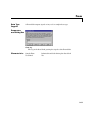
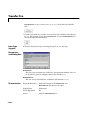
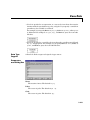
and Dialog Box
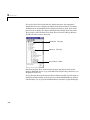
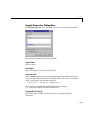
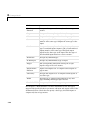
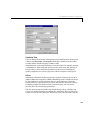
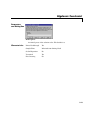
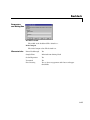
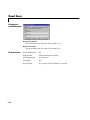
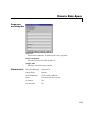
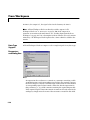
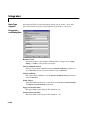
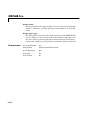
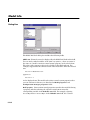
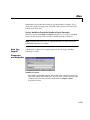
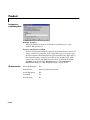
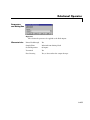
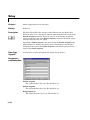
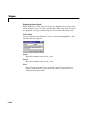
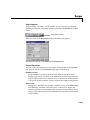
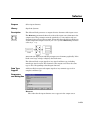
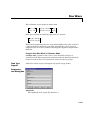
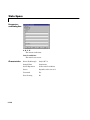
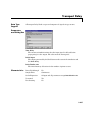
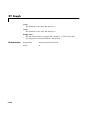
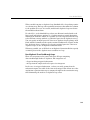
x-min
The minimum x-axis value. The default is -1.
x-max
The maximum x-axis value. The default is 1.
8-219