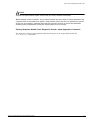
1
Advanced System
Diagnostics and
Troubleshooting Guide
ExtremeWare Software Version 7.8
Extreme Networks, Inc.
3585 Monroe Street
Santa Clara, California 95051
(888) 257-3000
http://www.extremenetworks.com
Published: May 2008
Part number: 100279-00 Rev 01
©2005 Extreme Networks, Inc. All rights reserved. Extreme Networks, ExtremeWare, Alpine, and BlackDiamond are
registered trademarks of Extreme Networks, Inc. in the United States and certain other jurisdictions. ExtremeWare Vista,
ExtremeWorks, ExtremeAssist, ExtremeAssist1, ExtremeAssist2, PartnerAssist, EPICenter, Extreme Standby Router
Protocol, ESRP, SmartTraps, Summit, Summit1i, Summit5i, Summit7i,Summit48i, Summit48si, SummitPx, Summit 200,
Summit Virtual Chassis, SummitLink, SummitGbX, SummitRPS and the Extreme Networks logo are trademarks of
Extreme Networks, Inc., which may be registered or pending registration in certain jurisdictions. The Extreme
Turbodrive logo is a service mark of Extreme Networks, which may be registered or pending registration in certain
jurisdictions. Specifications are subject to change without notice.
NetWare and Novell are registered trademarks of Novell, Inc. Solaris is a trademark of Sun Microsystems, Inc. F5,
BIG/ip, and 3DNS are registered trademarks of F5 Networks, Inc. see/IT is a trademark of F5 Networks, Inc.
“Data Fellows”, the triangle symbol, and Data Fellows product names and symbols/logos are
trademarks of Data Fellows.
F-Secure SSH is a registered trademark of Data Fellows.
All other registered trademarks, trademarks and service marks are property of their respective owners.
2
Contents
Preface
Introduction
9
Terminology
9
Conventions
9
Related Publications
Chapter 1
Chapter 2
Introduction
Introduction
11
Diagnostics: A Brief Historical Perspective
12
Overview of the ExtremeWare Diagnostics Suite
12
Supported Hardware
13
Applicable ExtremeWare Versions
13
“i” Series Switch Hardware Architecture
Diagnostics Support
15
The BlackDiamond Systems
BlackDiamond 6800 Series Hardware Architecture Differences
The BlackDiamond Backplane
BlackDiamond I/O Modules
Management Switch Modules
16
16
17
18
19
BlackDiamond MSM Redundancy
Causes of MSM Failover and System Behavior
Chapter 3
10
20
20
Alpine Systems
22
Summit “i” Series Systems
23
Packet Errors and Packet Error Detection
Overview
Advanced System Diagnostics and Troubleshooting Guide
25
3
Contents
Definition of Terms
26
Standard Ethernet Detection for Packet Errors on the Wire
27
Extreme Networks’ Complementary Detection of Packet Errors Between Wires
Hardware System Detection Mechanisms
Software System Detection Mechanisms
27
28
29
Failure Modes
Transient Failures
Systematic Failures
30
30
30
Soft-State Failures
Permanent Failures
Responding to Reported Failures
30
31
31
Health Check Messages
33
Alert Messages
Checksum Error Messages:
Corrective Behavior Messages
Chapter 4
33
34
35
Software Exception Handling
Overview of Software Exception Handling Features
System Watchdog Behavior
System Software Exception Recovery Behavior
Redundant MSM Behavior
37
37
38
38
Configuring System Recovery Actions
Related Commands
Configuring System Recovery Actions on “i” Series Switches
Configuring System Recovery Actions on “e” Series Switches
Usage Notes
40
40
40
41
41
Configuring Reboot Loop Protection
Related Commands
Configuring Reboot Loop Protection
43
43
43
Dumping the “i” Series Switch System Memory
Related Commands
Configuring an Automatic System Dump During System Recovery
Initiating a Manual System Dump
45
45
45
46
Example Log for a Software Exception
Chapter 5
Diagnostics
Diagnostic Test Functionality
How Diagnostic Tests are Run
How the Test Affects the Switch
49
49
50
System Health Checks: A Diagnostics Suite
Diagnostic Suite Components
The Role of Memory Scanning and Memory Mapping
52
52
53
Modes of Operation
4
47
54
Advanced System Diagnostics and Troubleshooting Guide
Contents
The Role of Processes to Monitor System Operation
Power On Self Test (POST)
Related Commands
Configuring the Boot-Up Diagnostics
Runtime (On-Demand) System Diagnostics
Runtime Diagnostics on “i” Series Systems
Related Commands
Running the Diagnostics on BlackDiamond Systems
Runtime Diagnostics on “i” Series Alpine and Summit Systems
System Impact of Running the Diagnostics on “i” Series Switches
Runtime Diagnostics on “e” Series Systems
Related Commands
Running the Diagnostics on Summit “e” Switches
System Impact of Running the Diagnostics on Summit “e” Series Switches
Automatic Packet Memory Scan (via sys-health-check)
Memory Scanning and Memory Mapping Behavior
Limited Operation Mode
Effects of Running Memory Scanning on “i” Series Switches
Summit, Alpine, or BlackDiamond with a Single MSM
BlackDiamond System with Two MSMs
Interpreting Memory Scanning Results
55
56
56
56
57
57
58
58
58
59
59
60
60
60
60
61
64
64
64
64
66
Per-Slot Packet Memory Scan on BlackDiamond Switches
Related Commands
Configuring the Packet Memory Scan Recovery Mode
System Impact of Per-Slot Packet Memory Scanning
Network Impact of Per-Slot Packet Memory Scanning
67
67
67
68
68
System (CPU and Backplane) Health Check
Health Check Packet Types
Backplane Health Check States
Related Commands
Health Check Functionality
70
70
70
71
71
Alarm-Level Response Action
Auto-Recovery Response Action
Backplane Health Check
Viewing Backplane Health Check Results—show log Command
Viewing Backplane Health Check Diagnostic Results—show diagnostics Command
Analyzing the Results
CPU Health Check
Viewing CPU Health Check Results—show log Command
Viewing CPU Health Check Diagnostic Results—show diagnostics Command
Analyzing the CPU Health Check Results
Transceiver Diagnostics
Usage Guidelines
Related Commands
Configuring the Transceiver Diagnostics
Adva nce d Sys te m Dia gnos tics a nd Trouble s hooting Guide
71
71
72
72
73
78
79
79
80
80
82
82
82
82
5
Contents
System Impacts of the Transceiver Diagnostics
Network Impact of the Transceiver Diagnostics
Viewing Diagnostics Results
Example Log Messages for Transceiver Diagnostic Failures
Examples, show diagnostics Command
Example—show switch Command
Transceiver Diagnostic Result Analysis
FDB Scan
Usage Guidelines
Related Commands
84
85
86
87
88
88
89
Enabling FDB Scanning
Disabling FDB Scanning
Configuring the FDB Scan Diagnostics
89
89
90
System Impact of the FDB Scan Diagnostic
Network Impact of the FDB Scan Diagnostic
Viewing Diagnostics Results
90
90
91
Example Log Messages for FDB Scan Diagnostic Failures
Example FDB Scan Results from the show diagnostics Command
Example Output from the show switch command
Example Output from the show fdb remap Command
Chapter 6
83
83
84
91
91
92
92
Additional Diagnostics Tools
Temperature Logging for Modular Switches
Related Commands
System Impacts of Temperature Logging
Network Impact of Temperature Logging
93
93
94
94
Syslog Servers
Related Commands
94
94
Enabling Logging to Remote Syslog Server Targets
Disabling Logging to Remote Syslog Server Targets
Adding a Syslog Server
Deleting a Remote Syslog Server
System Impact of the Syslog Server Facility
Network Impact of the Syslog Server Facility
94
95
95
95
95
96
Cable Diagnostics
96
Cable Diagnostics for the High-Density Gigabit Ethernet I/O Modules in “i” Series
Switches
96
Related Commands
Running Cable Diagnostics
Viewing and Interpreting CDM Test Data
Cable Diagnostics for “e” Series Switches
Chapter 7
101
Troubleshooting Guidelines
Contacting Extreme Technical Support
Americas TAC
6
96
97
98
103
103
Advanced System Diagnostics and Troubleshooting Guide
Contents
Asia TAC
EMEA TAC
Japan TAC
Appendix A
Appendix B
104
104
104
What Information Should You Collect?
105
Analyzing Data
105
Diagnostic Troubleshooting
106
Extreme Networks’ Recommendations
107
Using Memory Scanning to Screen I/O Modules
109
Limited Operation Mode and Minimal Operation Mode
Limited Operation Mode
Triggering Limited Operation Mode
Bringing a Switch Out of Limited Operation Mode
111
112
112
Minimal Operation Mode
Triggering Minimal Operation Mode
Bringing a Switch Out of Minimal Operation Mode
112
112
113
Reference Documents
General Information
115
Other Documentation Resources
115
Index
Index of Commands
Advanced System Diagnostics and Troubleshooting Guide
7
Contents
8
Advanced System Diagnostics and Troubleshooting Guide
Preface
This Preface provides an overview of this guide, describes guide conventions, and lists other
publications that might be useful.
Introduction
This guide describes how to use the ExtremeWare hardware diagnostics suite to test and validate the
operating integrity of Extreme Networks switches. The tools in the diagnostic suite are used to detect,
isolate, and treat faults in a system.
This guide is intended for use by network designers, planners, and operations staff.
Terminology
When features, functionality, or operation is specific to a modular or stand-alone switch family, the
family name is used. Explanations about features and operations that are the same across all product
families simply refer to the product as the “switch.”
Conventions
Table 1 and Table 2 list conventions that are used throughout this guide.
Table 1: Notice Icons
Icon
Notice Type
Alerts you to...
Note
Important features or instructions.
Caution
Risk of personal injury, system damage, or loss of data.
Warning
Risk of severe personal injury.
Advanced System Diagnostics and Troubleshooting Guide
9
Preface
Table 2: Text Conventions
Convention
Description
Screen displays
This typeface indicates command syntax, or represents information as it appears on the
screen.
The words “enter”
and “type”
When you see the word “enter” in this guide, you must type something, and then press
the Return or Enter key. Do not press the Return or Enter key when an instruction
simply says “type.”
[Key] names
Key names are written with brackets, such as [Return] or [Esc].
If you must press two or more keys simultaneously, the key names are linked with a
plus sign (+). Example:
Press [Ctrl]+[Alt]+[Del].
Letter in bold type
Letters within a command that appear in bold type indicate the keyboard shortcut for a
command. When entering the command, you can use just the bolded letters instead of
the entire word.
Words in italicized type
Italics emphasize a point or denote new terms at the place where they are defined in
the text.
Related Publications
The publications related to this one are:
• ExtremeWare Software User Guide, Software Version 7.7.
• ExtremeWare Software Command Reference, Software Version 7.7.
• ExtremeWare Error Message Decoder.
Documentation for Extreme Networks products is available on the World Wide Web at the following
location:
http://www.extremenetworks.com/services/documentation/Default.asp
10
Advanced System Diagnostics and Troubleshooting Guide
1
Introduction
This guide describes how to use the ExtremeWare hardware diagnostics suite to test and validate the
operating integrity of Extreme Networks switches. The tools in the diagnostic suite are used to detect,
isolate, and treat faults in a system.
This chapter contains the following sections:
• Diagnostics: A Brief Historical Perspective on page 12
• Overview of the ExtremeWare Diagnostics Suite on page 12
• Supported Hardware on page 13
• Applicable ExtremeWare Versions on page 13
Introduction
The purpose of this guide is to provide information and guidelines to assist you in implementing the
diagnostic suite within ExtremeWare. The Extreme Networks diagnostic software is intended to identify
possible faulty hardware or software error conditions and—depending on how the various diagnostics
features are configured—take the appropriate preconfigured action. The action might be to enable the
switch to write informative error messages to the switch log, attempt to recover itself and continue
operating, or simply remove the suspect system component from service.
It is important to note that while each diagnostic test—by itself—is not complicated, system
configuration, as a whole, must be evaluated to ensure ongoing, expected behavior both with the switch
and across the network itself. For example, in implementing the diagnostic suite, you must take into
consideration these operational variables:
• Redundancy mechanisms implemented
• Levels of redundancy within the network
• Acceptable outage windows (scheduled and unscheduled)
Advanced System Diagnostics and Troubleshooting Guide
11
Introduction
Diagnostics: A Brief Historical Perspective
Diagnostic utility programs were created to aid in troubleshooting system problems by detecting and
reporting faults so that operators or administrators could go fix the problem. While this approach does
help, it has some key limitations:
• It is, at its base, reactive, meaning a failure must occur before the diagnostic test can be used to look
for a cause for the failure.
• It can be time consuming, because the ability to troubleshoot a failure successfully based on the
information provided by the diagnostics test depends greatly on the types of information reported
by the test and the level of detail in the information.
Because users of mission-critical networks and network applications are becoming increasingly
dependent on around-the-clock network access and highest performance levels, any downtime or
service degradation is disruptive and costly. Time lost to an unexpected failure, compounded by more
time lost while someone attempts to isolate and fix the failure, has become increasingly less acceptable.
The process of improving diagnostic tests to minimize failures and their impact is a kind of feedback
system: What you learn through the use of the diagnostics improves your understanding of hardware
failure modes; what you learn from an improved understanding of hardware failure modes improves
your understanding of the diagnostics.
The goal of the current generation of ExtremeWare diagnostics is to help users achieve the highest
levels of network availability and performance by providing a suite of diagnostic tests that moves away
from a reactive stance—wherein a problem occurs and then you attempt to determine what caused the
problem—to a proactive state—wherein the system hardware, software, and diagnostics work together
to reduce the total number of failures and downtime through:
• More accurate reporting of errors (fewer false notifications; more information about actual errors)
• Early detection of conditions that lead to a failure (so that corrective action can be taken before the
failure occurs)
• Automatic detection and correction of packet memory errors in the system’s control and data planes
Administrators will now find a greatly reduced MTTR (mean time to repair) due to fast and accurate
fault identification. Multiple modules will no longer need to be removed and tested; faulty components
will usually be identified directly. Over time, there should be a significant reduction in the number of
problems found.
NOTE
In spite of the improved ExtremeWare hardware diagnostics, some network events might still occur,
because software is incapable of detecting and preventing every kind of failure.
Overview of the ExtremeWare Diagnostics Suite
The ExtremeWare diagnostic suite includes the following types of tools for use in detecting, isolating,
and treating faults in a switch. Each of these diagnostic types is summarized below, but is described in
greater detail in later sections of this guide.
• Power-on self test (POST)—A sequence of hardware tests that run automatically each time the switch
is booted, to validate basic system integrity. The POST runs in either of two modes: normal (more
thorough, but longer-running test sequence) or FastPOST (faster-running basic test sequence).
12
Advanced System Diagnostics and Troubleshooting Guide
Supported Hardware
• On-demand system hardware diagnostics—Run on demand through user CLI commands; runs in
either of two modes: normal (faster-running basic test sequence) or extended (more thorough, but
longer-running test sequence).
The extended diagnostics include the packet memory scan, which checks the packet memory area of
the switch fabric for defects and maps out defective blocks. This test can be run by itself, as part of
the slot-based extended diagnostics, or can be invoked from within the system health checks.
• Switch-wide communication-path packet error health checks—(Apply only to “i” series Summit,
Alpine, and BlackDiamond switches.) An integrated diagnostic subsystem—the system health check
feature—that consists of a number of different test types, operating proactively in the background to
detect and respond to packet error problems in module memory or on communication paths.
The system health checks for “i” series switches include the following kinds of tests:
— Backplane health checks
— CPU health checks
— Switch fabric checksum validation
— Dynamic memory scanning and memory mapping
— Transceiver diagnostics
— Forwarding database (FDB) scan
NOTE
One component of the system health check feature is a bus monitoring and data integrity verification
subsystem that monitors the operation of all data and control busses within the switch. This low-level
subsystem—composed of software and hardware components—passes the results of its tests to
another system health check subsystem, an intelligent layer that is responsible for interpreting the
test results and reporting them to the user. Since the inception of the use of this intelligent
interpretation and reporting layer in the system health check feature, the operation of this
interpretation and reporting subsystem has undergone significant changes. At its current level of
maturity, it represents an intelligent, integral component of the overall system health check system.
Supported Hardware
The ExtremeWare diagnostic suite applies only to Extreme Networks switch products based on the
“inferno” series chipset. Equipment based on this chipset are referred to as being “inferno” series or “i”
series products: the BlackDiamond family of core chassis switches (6804, 6808, and 6816), the Alpine
systems (3802, 3804, 3808), and the Summit “i”-series stackables (Summit1i, Summit5i, Summit7i,
Summit 48i, and Summit48Si).
A subset of the ExtremeWare diagnostic suite—runtime, slot-based diagnostics—applies only to Extreme
Networks Summit “e” series switch products. The Summit “e” series switches include the following
models: Summit 200-24, Summit 200-48, Summit 300-24, Summit 300-48, Summit 400-24p,
Summit 400-24t, and Summit 400-48t.
Applicable ExtremeWare Versions
The information in this guide is based on the features and feature attributes found in
ExtremeWare Version 7.4 or later.
Advanced System Diagnostics and Troubleshooting Guide
13
Introduction
14
Advanced System Diagnostics and Troubleshooting Guide
2
“i” Series Switch Hardware Architecture
This chapter provides a brief summary of the “i” series switch hardware features most relevant to
understanding the use of the Extreme Networks diagnostic suite.
This chapter contains the following sections:
• Diagnostics Support on page 15
• The BlackDiamond Systems on page 16
• Alpine Systems on page 22
• Summit “i” Series Systems on page 23
Diagnostics Support
The ExtremeWare diagnostic suite applies only to Extreme Networks switch products based on the
“inferno” series chipset. Equipment based on this chipset are referred to as being “inferno” series or “i”
series products: the BlackDiamond family of core chassis switches (6804, 6808, and 6816), the Alpine
systems (3802, 3804, 3808), and the Summit “i”-series stackables (Summit1i, Summit5i, Summit7i,
Summit 48i, and Summit48Si).
NOTE
These switches and the switch modules use naming conventions ending with an “i” to identify them as
“inferno” series or “i” series products. For the most current list of products supporting the “i” chipset,
such as the MSM-3 and other “3”-series modules, such as the G16X3, consult your release notes.
Unless otherwise specified, a feature requiring the “i” chipset requires the use of both an “i”
chipset-based management module, such as the MSM64i, and an “i” chipset-based I/O module, such as
the G8Xi.
Advanced System Diagnostics and Troubleshooting Guide
15
“i” Series Switch Hardware Architecture
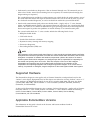
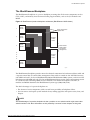
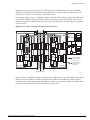
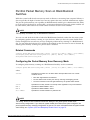
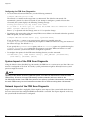
The BlackDiamond Systems
In the context of the advanced system diagnostics suite, the BlackDiamond family of core chassis
switches share the same fundamental hardware architecture: a multislot modular chassis containing a
passive backplane that supports redundant load-sharing, hot-swappable switch fabric modules. On
BlackDiamond systems, each I/O module and MSM represents an individual switch containing its own
switching fabric and packet memory.
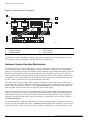
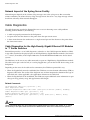
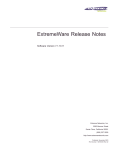
Figure 1: BlackDiamond 6800 Series architecture, general block diagram
Control Bus
Control Bus
CPLD
UART
MAC
To Backplane
FLASH
PQM
PBus
SRAM
To Backplane
MAC
SE
ASIC
(Twister)
MGMT
Packet
Memory
MAC
PBus
I/O Module (G8Xi)
OTP
AFQM
ASIC
(Quake)
MAC
To Backplane
To Backplane
To MSM-B
Backplane
INT MAC
VPST
FDB
Backplane
To MSM-A
INT MAC
VPST
Packet
Memory
Control Bus
CPU
Subassembly
PCMCIA
PQM
PBus
SE
ASIC
(Twister)
EXT MAC
To PHY
OTP
EXT MAC
AFQM
ASIC
(Quake)
PBus
To PHY
FDB
NVRAM
Master MSM Daughter Card
Control Bus
Data/Packet
Bus (PBus)
Transceiver
Control Bus
Master MSM (MSM-A)
(To all other slots)
DN_033A
BlackDiamond 6800 Series Hardware Architecture Differences
In the context of understanding the ExtremeWare diagnostics and their use in troubleshooting system
problems, these are the key hardware distinctions between the BlackDiamond 6816, 6808, and 6804.
• BlackDiamond 6816—Modular chassis with passive backplane; sixteen chassis slots for I/O modules;
four chassis slots for MSMs.
• BlackDiamond 6808—Modular chassis with passive backplane; eight chassis slots for I/O modules;
two chassis slots for MSMs.
• BlackDiamond 6804—Modular chassis with passive backplane; four chassis slots for I/O modules;
two chassis slots for MSMs.
16
Advanced System Diagnostics and Troubleshooting Guide
The BlackDiamond Systems
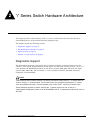
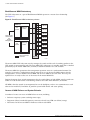
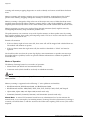
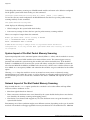
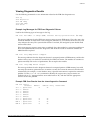
The BlackDiamond Backplane
The BlackDiamond backplane is a passive backplane, meaning that all the active components such as
CPUs, ASICs, and memory have been moved onto plug-in modules, such as the I/O modules and
MSMs.
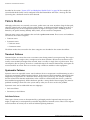
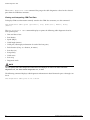
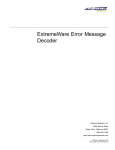
Figure 2: BlackDiamond passive backplane architecture (BlackDiamond 6808 shown)
1
Switch
Module
2
Switch
Module
3
Switch
Module
Eight Load-Shared
Gigabit Links
64 Gbps
Switch
Fabric
A
Fault-Tolerant
Switch Fabric
and System
Management
B
64 Gbps
Switch
Fabric
8
Switch
Module
DN_001A
The BlackDiamond backplane provides inter-slot electrical connections for both network data traffic and
a separate control bus for switch fabric management. Data traffic is carried on four AUI links between
each MSM and each I/O slot on BlackDiamond 6804 and BlackDiamond 6808 systems, and on two AUI
links between each MSM and each I/O slot on BlackDiamond 6816 systems. Device management occurs
on a 32-bit PCI bus connecting MSMs and I/O modules. The number of backplane slots for I/O
modules and MSMs determines the BlackDiamond system type (6804, 6808, 6816).
The chief advantages of a passive backplane are:
• The absence of active components yields a much lower possibility of backplane failure.
• You can remove and replace system modules faster, making upgrades and repairs easier, faster, and
cheaper.
NOTE
One disadvantage of a passive backplane is that a problem on one switch module might cause other
switch modules to fail. More information on this possibility is covered in later chapters of this guide.
Advanced System Diagnostics and Troubleshooting Guide
17
“i” Series Switch Hardware Architecture
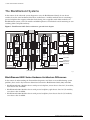
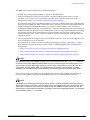
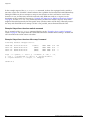
BlackDiamond I/O Modules
Each BlackDiamond I/O module has a built-in switching fabric (see Figure 3) giving the module the
capability to switch local traffic on the same module. Traffic that is destined for other modules in the
chassis travels across the backplane to the MSMs, where it is switched and sent to its destination I/O
module.
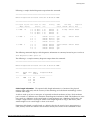
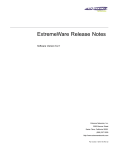
Figure 3: BlackDiamond I/O module architecture (G8Xi 32 Gb fabric shown)
PHY
SE
ASIC
MAC
SE
ASIC
PHY
SE
ASIC
PBUS
MAC
MAC
SRAM (Packet Mem + FDB)
SE
ASIC
MAC
AFQM
ASIC
OTP RAM
PQ RAM
VPST RAM
4x GbE to
MSM-A
4x GbE to
MSM-B
DN_026C
Each BlackDiamond I/O module has eight load-shared Gigabit Ethernet links to both MSMs through
the backplane. The load sharing algorithm distributes traffic across different channels through the
backplane’s Gigabit Ethernet links, providing bi-directional communication.
Each BlackDiamond I/O module is equipped with the following kinds of hardware components:
• PHY: An industry-standard ASIC responsible for physical layer (layer 1) signal, clocking, etc.
• MAC: The MAC handles the standard MAC layer functions as well as some other functions to
prepare a packet for transmission to the switch fabric or to the external network, including 802.1p
and DiffServ examination, VLAN insertion, MAC substitution, TTL decrement, 802.1p and DiffServ
replacement, etc.
Each I/O module has both external MACs and internal MACs. External MACs handle the interface to
the external ports; internal MACs handle the interface to the BlackDiamond backplane. Each MSM
provides four Gigabit Ethernet links to each I/O module.
• PBUS: The packet data bus that transfers packets between the MAC and the packet memory.
• Switch engine (distributed packet processor) ASIC (Twister) and its associated memories: packet
RAM and FDB RAM. The SE ASIC implements a high-speed, parallel data transfer bus for
transferring packets from MACs to packet memory and back.
• Address filtering and queue management ASIC (Quake) and its associated memories: OTP RAM, PQ
RAM, and VPST RAM.
When a data packet is received by the PHY, the PHY passes the packet to the MAC. The MAC handles
the layer 2 tasks, such as tagging and the MAC address, then transfers the packet across the PBUS to the
18
Advanced System Diagnostics and Troubleshooting Guide
The BlackDiamond Systems
packet memory for temporary storage. Based on the information in memory, such as the FDB, the
address filtering and queue management ASIC makes a forwarding decision. If the next hop is a local
port (on the same module), the packet is forwarded to the external MAC and PHY for the exit port. If
the packet is destined for another module (as either slow path traffic or fast path traffic), the packet is
transferred to the internal MAC and then on to the MSM (CPU).
All I/O modules share the management bus on the backplane, and use it to communicate to each other
and to the MSMs.
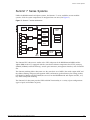
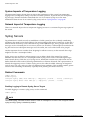
Management Switch Modules
As its name indicates, the Management Switch Fabric Module (MSM) serves a dual role in the system: it
is equipped to act as the internal switch fabric for data that is being transferred between I/O modules
in the chassis, and to handle the upper-layer processing and system management functions for the
switch. (See Figure 4.)
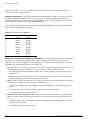
Figure 4: BlackDiamond MSM architecture (MSM64i shown)
CPU
Subsystem
AFQM
ASIC
CPU
CPU
SE
ASIC
MAC
SE
ASIC
MAC
SE
ASIC
MAC
SE
ASIC
MAC
SE
ASIC
MAC
SE
ASIC
MAC
SE
ASIC
MAC
SE
ASIC
MAC
OTP RAM
256 MB
DRAM
VPST RAM
Flash
NVRAM
AFQM
ASIC
OTP RAM
PCMCI
Slot
SRAM (Packet Mem + FDB)
PQ RAM
PQ RAM
VPST RAM
PBUS
DN_027C
An MSM is equipped with the following hardware components: CPU subsystem (dual CPUs, DRAM,
NVRAM, flash memory, and PCMCIA slot) and switch fabric subsystem (Quake ASICs, OTP, PQ, and
VPST RAM, packet memory and FDB SRAM, Twister ASICs, PBUS, and MAC ASICs).
Advanced System Diagnostics and Troubleshooting Guide
19
“i” Series Switch Hardware Architecture
BlackDiamond MSM Redundancy
The CPU subsystems on a pair of BlackDiamond MSMs operate in a master-slave relationship.
(See Figure 5.)
Figure 5: BlackDiamond MSM redundancy scheme
MSM64i (A)
I/O Module
CPU
Subsystem
Switching
Fabric
I/O Module
I/O Module
Fault Tolerant
Switch Fabric
and
System
Management
I/O Module
MSM64i (B)
CPU
Subsystem
I/O Module
Switching
Fabric
I/O Module
I/O Module
I/O Module
CPU Control Path
Data Path
Backplane
DN_028A
The master MSM CPU subsystem actively manages the switch and the task of switching packets in the
CPU control (or management) path. The slave MSM CPU subsystem is in standby mode, but is checked
periodically by the master MSM CPU (via EDP) to determine whether it is still available.
The master MSM also guarantees that management operations occur in a synchronized manner. For
example, if you make a configuration change and need to save it, the master MSM ensures that the
configuration is saved to both the master MSM and the slave MSM at the same time. That way, the
updated slave is ready to take over as the master if the master MSM fails.
Despite the master-slave switch management role, the switch fabrics on both MSMs actively switch core
traffic in a load-shared fashion. Load-sharing switches core traffic from different I/O modules.
All MSMs share the control (or management) bus on the backplane, and use it to communicate to each
other and to installed I/O modules to perform system health checks and status polling.
Causes of MSM Failover and System Behavior
A number of events can cause an MSM failover to occur, including:
• Software exception; system watchdog timer expiry
• Diagnostic failure (extended diagnostics, transceiver check/scan, FDB scan failure/remap)
• Hot removal of the master MSM or hard-reset of the master MSM
20
Advanced System Diagnostics and Troubleshooting Guide
The BlackDiamond Systems
The MSM failover behavior depends on the following factors:
• Platform type and equippage (Summit vs. Alpine vs. BlackDiamond)
• Software configuration settings for the software exception handling options such as system
watchdog, system recovery level, and reboot loop protection. (For more information on the
configuration settings, see Chapter 4, “Software Exception Handling.”)
In normal operation, the master MSM continuously resets the watchdog timer. If the watchdog timer
expires, the slave MSM will either 1) reboot the chassis and take over as the master MSM (when the
switch is equipped with MSM-64i modules), or 2) initiate a hitless failover (when the switch is
equipped with MSM-3 modules). The watchdog is a software watchdog timer that can be enabled or
disabled through CLI commands. The watchdog timer is reset as long as ExtremeWare is functioning
well enough to return to the main software exception handling loop where the critical software
exception handling tasks, such as tBGTask, handle the process of resetting the watchdog timer and
creating log entries.
• Software configuration settings for the system health check feature, or for any of the diagnostic tests
that you might choose to run manually.
For example, in the context of memory scanning and mapping, Chapter 5, “Diagnostics,” contains
three tables that describe the behavior of the switch for different platform types and diagnostics
configuration:
— Table 6: Auto-recovery memory scanning and memory mapping behavior
— Table 7: Manual diagnostics memory scanning and memory mapping behavior, normal
— Table 8: Manual diagnostics memory scanning and memory mapping behavior, extended
NOTE
On switches equipped with MSM64i modules, you should periodically use the synchronize command
to ensure that the slave MSM and master MSM are using matched images and configurations. If not
synchronized, the slave MSM might attempt to use the image it has loaded in conjunction with the
configuration from the master MSM, a mismatch that will most likely cause the switch to behave
differently after an MSM failover, thereby defeating the intended purpose of redundant peer MSMs.
If you need to insert a new MSM, you can duplicate the contents of the NVRAM and flash memory
from an existing MSM to the newly-installed MSM using one CLI synchronization command.
NOTE
The MSM-3 uses technology that provides “hitless” failover, meaning the MSM-3 transitions through a
failover with no traffic loss and no switch downtime, while it maintains active links and preserves layer 2
state tables. Contrast this performance to normal failover with MSM64i modules, which can take the
switch down for approximately 30 seconds. The MSM-3 makes hitless upgrades possible. It is supported
in ExtremeWare release 7.1.1 and later.
Advanced System Diagnostics and Troubleshooting Guide
21
“i” Series Switch Hardware Architecture
Alpine Systems
Like the BlackDiamond systems, the Alpine systems are also based on a multislot modular chassis that
uses the inferno chipset, but the Alpine switches differ from the BlackDiamond switches on these points
(see Figure 6):
• Active backplane—Alpine switches use an active backplane that uses the same basic set of ASICs
(the switch engine ASIC and the address filtering and queue management ASIC) and memory
(packet memory for storing packets; OTP RAM, PQ RAM, and VPST RAM) that are used on the
BlackDiamond MSMs and I/O modules, so it offers wire-speed switching.
But unlike the BlackDiamond MSM, the Alpine backplane has no CPU and no MAC. It does provide
PBUS links to all I/O modules. The number of backplane slots for I/O modules determines the
Alpine system type (3802, 3804, 3808).
• SMMi processor module instead on MSM—The SMMi processor module is similar to the CPU
subsystem of the BlackDiamond MSM in that it is equipped with the following hardware
components: CPU subsystem, DRAM, NVRAM, and flash memory, console port connectors,
management interface, and a PCMCIA slot. But unlike the MSM, the SMMi contains no switching
fabric.
• I/O modules provide PHY and MAC functionality, but no onboard switching fabric—Each
standard I/O module has two PBUS links to the switching fabric on the Alpine backplane.
Figure 6: Alpine architecture (Alpine 3804 shown)
PHY
Alpine 3804 (32 Gb Fabric)
MAC
SE
ASIC
FM-32Ti
SE
ASIC
MAC
SE
ASIC
PHY
PHY
SE
ASIC
PHY
WAN Subsystem
AFQM
ASIC
OTP RAM
PQ RAM
VPST RAM
MAC
CPU Subsystem
CPU DRAM
Flash
NVRAM
2x 10/100base-TX
SRAM (Packet Mem + FDB)
PHY
GM-4Xi
WM-4T1
PBUS
256 MB
DRAM
CPU
CPU
SMMi
DN_029C
22
Advanced System Diagnostics and Troubleshooting Guide
Summit “i” Series Systems
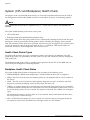
Summit “i” Series Systems
Unlike the BlackDiamond and Alpine systems, the Summit “i” series stackables are not modular
systems: all of the system components are integrated into one unit. (See Figure 7.)
Figure 7: Summit “i” series architecture
PHY
MAC
SE
ASIC
PHY
PHY
MAC
SE
ASIC
PHY
PHY
SE
ASIC
PHY
SRAM (Packet Mem + FDB)
SE
ASIC
AFQM
ASIC
OTP RAM
PQ RAM
VPST RAM
PHY
MAC
PHY
Flash
PHY
NVRAM
256 MB
DRAM
CPU
CPU
PBUS
DN_030A
The Summit CPU subsystem is similar to the CPU subsystem of the BlackDiamond MSM and the
Alpine SMMi in that it is equipped with the same basic hardware components: dual CPUs, memory
(DRAM, NVRAM, and flash memory), console port connectors, management interface, and a PCMCIA
slot.
The Summit switching fabric subsystem uses the same basic set of ASICs (the switch engine ASIC and
the address filtering and queue management ASIC) and memory (packet memory for storing packets;
OTP RAM, PQ RAM, and VPST RAM) that are used on the BlackDiamond and Alpine switches, so it,
too, offers wire-speed switching.
The Summit I/O subsystem provides PHY and MAC functionality in a variety of port configurations
(types of ports and numbers of ports).
Advanced System Diagnostics and Troubleshooting Guide
23
“i” Series Switch Hardware Architecture
24
Advanced System Diagnostics and Troubleshooting Guide
3
Packet Errors and Packet Error
Detection
This chapter describes some of the factors that might result in packet errors in the switch fabric and the
kinds of protection mechanisms that are applied to ensure that packet error events are minimized and
handled appropriately.
This chapter contains the following sections:
• Overview on page 25
• Definition of Terms on page 26
• Standard Ethernet Detection for Packet Errors on the Wire on page 27
• Extreme Networks’ Complementary Detection of Packet Errors Between Wires on page 27
• Failure Modes on page 30
• Health Check Messages on page 33
Overview
Complex, wire-speed switch fabrics are subject to electronic anomalies that might result in packet errors.
The Ethernet standard contains built-in protections to detect packet errors on the link between devices,
but these mechanisms cannot always detect packet errors occurring in the switch fabric of a device.
Extreme Networks has incorporated many protection mechanisms to ensure that packet error events are
minimized and handled properly.
These protection mechanisms include the following:
• Ethernet CRC (detects packet errors between switches)
• Switch fabric checksums (automatic detection of live packet errors)
• Packet memory scanning (offline detection of packet memory errors)
• System health check (automatic test of various CPU and data paths)
• FDB scan (background scan process scans entire FDB RAM pool on all switch fabrics)
• Transceiver check (background detects packet errors on internal control paths)
Advanced System Diagnostics and Troubleshooting Guide
25
Packet Errors and Packet Error Detection
Definition of Terms
To establish a basis for the descriptions in this chapter, Table 3 lists and defines terms that are used
repeatedly throughout this chapter and those that follow. When any of these terms are used for their
precise meaning, they are shown emphasized in bold type.
Table 3: Data Error Terms
Term
Description
Packet error event
When the contents of a network data or control packet are modified by the
transmission medium or a network device in a way that is not indicated by the rules
of standard network behavior such that the contents of the packet will be considered
invalid by upper layer protocols or applications, we say that a packet error event
has occurred.
Note that the term applies only to packet changes initiated by layer 1 interaction; that
is, if an error in the electrical or optical processing of the bit-level data in the packet
results in a change to the packet, we consider this a packet error event.
The term does not extend to systematic software or hardware errors that result in
valid but incorrect changes to the packet at higher OSI layers, such as inserting the
wrong next-hop MAC destination address into the packet header because of an
erroneous entry in the hardware forwarding database.
Checksum
A value computed by running actual packet data through a polynomial formula.
Checksums are one of the tools used by Extreme Networks in attempts to detect
and manage packet error events.
Packet checksum
A checksum value that is computed by the MAC chip when the packet is transferred
from the MAC chip to the switch fabric. This checksum value precedes the packet
as it transits the switch fabric.
Verification checksum
A checksum value that is computed by the MAC chip when the packet is transferred
from the switch fabric to the MAC chip for transmission.
Checksum error
When a packet exits the switch fabric, the packet checksum that follows the packet
must match the verification checksum computed as the packet leaves the switch
fabric. If the checksums do not match, then a checksum error results.
System health check
A series of system tests and associated reporting mechanisms that are used to notify
network operators of potential system problems and to isolate and diagnose faulty
components when problems occur. The checksum error reporting mechanism is a
part of the system health check system.
System health check error
This term refers to error messages in the system log that are generated by the
system health check system. Error messages generated by the system health
check system are prefaced by the text string “Sys-health-check.” Checksum error
messages are a subset of the system health check error messages.
Transient errors
Errors that occur as one-time events during normal system processing. These types
of errors will occur as single events, or might recur for short durations, but do not
have a noticeable impact on network functionality and require no user intervention to
correct.
Soft-state errors
These types of error events are characterized by a prolonged period of reported
error messages and might, or might not, be accompanied by noticeable degradation
of network service. These events require user intervention to correct, but are
resolved without replacing hardware.
Error messages of this type are the result of software or hardware systems entering
an abnormal operating state in which normal switch operation might, or might not, be
impaired.
Permanent errors
26
These types of errors result from permanent hardware defects that might, or might
not, affect normal switch operation. They cannot be resolved by user intervention
and will not resolve themselves. You must replace hardware to resolve permanent
errors.
Advanced System Diagnostics and Troubleshooting Guide
Standard Ethernet Detection for Packet Errors on the Wire
Table 3: Data Error Terms (continued)
Term
Description
Fast path
This term refers to the data path for a packet that traverses a switch and does not
require processing by the CPU. Fast path packets are handled entirely by ASICs
and are forwarded at wire rate.
Slow path
This term refers to the data path for packets that must be processed by the switch
CPU, whether they are generated by the CPU, removed from the network by the
CPU, or simply forwarded by the CPU.
Standard Ethernet Detection for Packet Errors on
the Wire
Data transiting from one switch to another is checked for packet errors using the Ethernet Cyclic
Redundancy Check (CRC) built into the IEEE 802.3 specification.
As the sending switch assembles a frame, it performs a CRC calculation on the bits in that frame and
stores the results of that calculation in the frame check sequence field of the frame. At the receiving end,
the switch performs an identical CRC calculation and compares the result to the value stored in the
frame check sequence field of the frame. If the two values do not match, the receiving switch assumes
that packet data has been illegally modified between CRC calculation and CRC validation and discards
the packet, and increments the CRC error counter in the MAC device associated with that port. In
Extreme Networks devices, ExtremeWare polls the MAC CRC error count registers and makes that
information available through the output of the show port rxerrors CLI command.
Extreme Networks’ Complementary Detection of Packet
Errors Between Wires
The 802.3 Ethernet specification provides a CRC check for validation of data on the wire, but offers no
guidance for handling data validation in the devices between the wires. Because these devices are far
more complicated than the wires connected to them, common sense indicates the requirement for some
mechanism for checking internal data integrity. To complement the Ethernet CRC data validation
scheme, Extreme Networks switches implement an internal data checksum validation scheme referred
to as the fabric checksum.
The switch fabric in a switch is essentially an extremely high-speed data path connecting multiple ports
and using a set of programmable lookup tables to make intelligent forwarding decisions when moving
data from point to point inside the switch. Figure 8 uses a generalized block diagram of a switch to
illustrate data movement within a switch.
Advanced System Diagnostics and Troubleshooting Guide
27
Packet Errors and Packet Error Detection
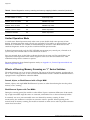
Figure 8: Generalized switch block diagram
4
5
3
ASIC
CPU
sub-system
ASIC
DMAC
6
2
1
MAC
MAC
CG_002B
1
PHY port and MAC device layer
4
Control bus
2
Packet bus (PBUS)
5
Packet memory
3
Forwarding ASICs
6
CPU subsystem
The following sections describe the hardware and software components that work together to detect
and manage packet error incidents within the Extreme Networks switch.
Hardware System Detection Mechanisms
All Extreme Networks switches based on the “i”-series switch fabric validate data integrity internal to
the switch fabric using a common checksum verification algorithm. Using Figure 8 as a generalized
model, when a packet is received at an Ethernet network interface, the receiving MAC ASIC verifies the
Ethernet CRC: it computes a CRC value by applying the same algorithm used to compute the CRC
value appended to the received packet data by the transmitting switch. If the algorithm and the data it
is applied to are the same on both ends of the Ethernet link, the CRC values should match. If they do
not, the packet is assumed to have been damaged and is discarded.
If the CRC values match, the MAC ASIC must then transfer the packet to the internal switch fabric.
Before doing this, however, it produces a checksum value based on the packet data being passed to the
switch fabric. This checksum value becomes the packet checksum. It is prepended to the packet and
both the packet checksum and packet are passed on to the switch fabric.
After the switch fabric is finished processing the packet and has made a decision regarding where the
packet is to be forwarded, it passes the packet to the transmitting MAC ASIC. The transmitting MAC
ASIC performs the reverse of the process performed by the receiving MAC ASIC. It first computes a
checksum value based on the packet data received from the switch fabric. We will call this value the
verification checksum.
The transmitting MAC ASIC then compares the verification checksum against the packet checksum. If
the two values do not match, the result is a checksum error. The MAC ASIC maintains a count of every
checksum error that occurs on every port. When a packet is found to have a checksum error, it is still
28
Advanced System Diagnostics and Troubleshooting Guide
Extreme Networks’ Complementary Detection of Packet Errors Between Wires
transmitted, but an invalid CRC value is included with the packet. Therefore, the receiving device will
detect an invalid CRC value and will drop the packet.
In Summit “i” series stackable switches, the packet checksum is calculated by the MAC ASIC on the
receiving port and is compared against the verification checksum calculated by the MAC ASIC on the
transmitting port, as described above.
In Alpine 3800 series switches, the packet checksum is calculated by the MAC ASIC on the receiving
port on the I/O module on which the packet is received. The packet checksum and packet are passed to
the switch fabric, which is on the Alpine switch backplane, and then from the switch fabric to the
transmitting MAC ASIC on the I/O module on which the packet is to be transmitted. There, the
verification checksum is computed and compared against the packet checksum.
In BlackDiamond 6800 series switches, the packet checksum is computed by the MAC ASIC on the
receiving port on the I/O module on which the packet is received. The packet checksum and the packet
traverse the switch fabric on the I/O module and are handed off to either an external MAC ASIC,
connected to a network port, or to an internal MAC ASIC, connected to a BlackDiamond backplane link.
In either case, the behavior of the MAC ASIC is the same: it computes the verification checksum and
compares it against the packet checksum to detect any changes in packet data. Similarly, whether the
packet is transmitted out the external port to the network, or out the internal port to the BlackDiamond
backplane, the packet is accompanied by an Ethernet CRC.
The behavior of the BlackDiamond MSM module is identical to that of the BlackDiamond I/O module,
except that all MAC ASICs on the MSM are internal (not to network ports). Regardless, the behavior of
the receiving and transmitting MAC ASICs is the same for packets traversing an MSM module as for
packets traversing an I/O module.
Thus far, all of the systems described have been involved in fast-path forwarding. Therefore, any
checksum errors detected using the mechanisms described above are referred to as fast-path checksum
errors.
Packets that must be processed by the switch CPU are also validated by checksum values. When a
packet is received, it might be destined specifically for the CPU (as in the case of protocol packets) or it
might be passed to the CPU for assistance in making a forwarding decision (if the switch fabric lacks
the information required to forward the packet correctly). In either case, the receiving MAC ASIC still
computes and prepends a packet checksum just as it does for fast-path packets, but because the packet
is not passed to a transmitting MAC ASIC before it is forwarded, the switch fabric itself is responsible
for computing the verification checksum and comparing it against the packet checksum. If a mismatch
is found, the switch fabric reports the checksum error condition to the CPU as it passes the packet up to
the CPU. These types of checksum errors are one instance of a class of checksum errors known as
slow-path checksum errors.
Software System Detection Mechanisms
As described above, each MAC ASIC maintains a port-by-port count of every checksum error detected.
ExtremeWare contains mechanisms that can retrieve the checksum error counts from the MAC ASICs in
the switch and act on it. Current versions of ExtremeWare retrieve the checksum error counts from all
MAC ASICs in the switch at twenty-second intervals. The counts at the end of the twenty-second
interval are compared with the counts at the beginning of the twenty-second interval on a port-by-port
basis. If, for any given port, the count is found to be different, then ExtremeWare is said to have
detected a checksum error.
Depending on the ExtremeWare version, the configuration settings, the frequency and count of
checksum errors, and a variety of other factors, ExtremeWare will initiate one of several actions,
Advanced System Diagnostics and Troubleshooting Guide
29
Packet Errors and Packet Error Detection
described in the section “System (CPU and Backplane) Health Check” on page 70. For example, the
system health check facility can be configured such that ExtremeWare will insert a message into the
system log that a checksum error has been detected.
Failure Modes
Although packet errors are extremely rare events, packet errors can occur anywhere along the data path,
along the control path, or while stored in packet memory. A checksum mismatch might occur due to a
fault occurring in any of the components between the ingress and egress points—including, but not
limited to, the packet memory (SRAM), ASICs, MAC, or bus transceiver components.
There are many causes and conditions that can lead to packet error events. These causes and conditions
can fall into one of these categories:
• Transient errors
• Systematic errors
— Soft-state errors
— Permanent errors
The failure modes that can result in the above categories are described in the sections that follow.
Transient Failures
Transient failures are errors that occur as one-time events during normal system processing. These types
of errors will occur as single events, or might recur for short durations. Because these transient events
usually occur randomly throughout the network, there is usually no single locus of packet errors. They
are temporary (do not persist), do not have a noticeable impact on network functionality, and require no
user intervention to correct: There is no need to swap a hardware module or other equipment.
Systematic Failures
Systematic errors are repeatable events: some hardware device or component is malfunctioning in such a
way that it persistently exhibits incorrect behavior. In the context of the ExtremeWare Advanced System
Diagnostics, the appearance of a checksum error message in the system log—for example—indicates
that the normal error detection mechanisms in the switch have detected that the data in a packet has
been modified inappropriately. While checksums provide a strong check of data integrity, they must be
qualified according to their risk to the system and by what you can do to resolve the problem.
Systematic errors can be subdivided into two subgroups:
• Soft-state failures
• Permanent, or hard failures
Soft-State Failures
These types of error events are characterized by a prolonged period of reported error messages and
might, or might not, be accompanied by noticeable degradation of network service. These events require
user intervention to correct, but are resolved without replacing hardware.
30
Advanced System Diagnostics and Troubleshooting Guide
Failure Modes
Failures of this type are the result of software or hardware systems entering an abnormal operating state
in which normal switch operation might, or might not, be impaired.
Permanent Failures
The most detrimental set of conditions that result in packet error events are those that result in
permanent errors. These types of errors arise from some failure within the switch fabric that causes data
to be corrupted in a systematic fashion. These permanent hardware defects might, or might not, affect
normal switch operation. They cannot be resolved by user intervention and will not resolve themselves.
You must replace hardware to resolve permanent errors.
Responding to Reported Failures
Before ExtremeWare 7.1, the fabric checksum validation mechanisms in ExtremeWare detected and
reported all checksum validation failures, so the resulting mix of message types reported in the system
log could cause confusion as to the true nature of the failure and the appropriate response. The
confusion over the error reporting scheme often led to unnecessary diversion of resources and often
unnecessary service interruptions because operators attempted to respond to reported errors that
presented no actual threat to network operation.
In ExtremeWare 7.1, the responsibility for reporting checksum errors shifted from the low-level bus
monitoring and data integrity verification subsystem that monitors the operation of all data and control
busses within the switch to the higher-level intelligent layer that is responsible for interpreting the test
results and reporting them to the user. Rather than simply insert every checksum validation error in the
system log, the higher-level interpreting and reporting subsystem monitors checksum validation failures
and inserts error messages in the system log when it is likely that a systematic hardware problem is the
cause for the checksum validation failures.
NOTE
The intent of the higher-level interpreting and reporting subsystem is to remove the burden of
interpreting and classifying of messages from the operator. The subsystem automatically differentiates
between harmless checksum error instances and service-impacting checksum error instances.
The interpreting and reporting subsystem uses measurement periods that are divided into a sequence of
20-second windows. Within the period of a window, reports from the low-level bus monitoring
subsystem are collected and stored in an internal data structure for the window. These reports are
divided into two major categories: slow-path reports and fast-path reports.
• Slow-path reports come from monitoring control busses and the CPU-to-switch fabric interface. The
slow-path reporting category is subdivided into different report message subcategories depending
on whether they come from CPU data monitoring, CPU health check tests, or backplane health check
tests.
• Fast-path reports come from direct monitoring of the switch fabric data path. The fast-path reporting
category is subdivided into different report message subcategories, depending on whether they come
from monitoring either internal or external MAC counters associated with each switch fabric in the
switching system.
Advanced System Diagnostics and Troubleshooting Guide
31
Packet Errors and Packet Error Detection
The slow-path and fast-path categories each have a separate configured threshold and associated action
that occurs at the end of the 20-second window:
• For the slow-path category, the three types of slow-path subcategory reports are tallied and
compared to the configured slow-path subcategory threshold.
• For the fast-path category, the two types of fast-path subcategory reports are tallied and compared to
the configured fast-path subcategory threshold.
If either of these thresholds is exceeded, that window is marked as a “bad” window. For each bad
window, the interpreting and reporting subsystem inserts a Sys-health-check error message into the
system log, indicating the primary reason why the window was marked bad.
The interpreting and reporting subsystem also maintains a running history of the windows it processes.
After it completes the window processing cycle, the interpreting and reporting subsystem examines the
window history list and counts the number of bad windows in the list. The bad window count is
compared to a configured window error parameter value. If the bad window count equals or exceeds
the window error parameter value, the interpreting and reporting subsystem alerts the system health
check system that there is a potential service-affecting condition. The system health check system will
then take the action specified in the configure sys-health-check command (for more information,
see “Health Check Functionality” on page 71):
• Insert an error message into the system log
• Send an SNMP trap to the configured trap receivers
• Take an offending module offline
• Take the entire switch offline
• Attempt to perform an automated recovery through the use of the packet memory scanning and
mapping capability
NOTE
The default system health check action is to insert an error message into the system log, but in many
environments, it is advisable to configure the system health check to send a trap to configured trap
receivers to provide faster notification of potentially service affecting conditions.
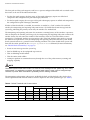
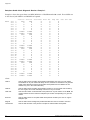
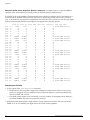
The interpreting and reporting subsystem is enabled by default, and the default values for the slowand fast-path thresholds and bad window counters depend on the switch platform type (see Table 4).
Table 4: Default Threshold and Counter Values
Minimum Summit “i”
Alpine
BlackDiamond
3802
3804
3808
6808/6804
Maximum
6816
Slow-path threshold
1
2
2
2
2
2
2
254
Fast-path threshold
1
1
1
2
3
6
12
254
Window history
1
3
3
3
3
3
3
32
Window errors
1
3
3
3
3
3
3
32
32
Advanced System Diagnostics and Troubleshooting Guide
Health Check Messages
The following examples describe how these values apply to a BlackDiamond 6808:
• On a BlackDiamond 6808, if more than six fast-path errors are detected within one 20-second
window, a message is inserted into the system log. If this pattern recurs three times within three
windows, the system health check subsystem takes the action specified in the
configure sys-health-check command.
• If fewer than six fast-path errors are detected within a single 20-second window, there is no
threshold violation, so no message is inserted in the system log.
• If more than six fast-path errors are detected within a single 20-second window, but no fast-path
errors are detected in other 20-second windows, an error message is inserted in the system log for
the fast-path window threshold violation, but no system health check action is taken.
NOTE
The state of the interpreting and reporting subsystem is configurable (enabled/disabled), as are the
values associated with the slow- and fast-path thresholds and bad window counters. However, these
attributes are currently accessible only under the instruction from Extreme Networks TAC personnel.
The default settings for these attributes have been found to work effectively under a broad range of
networking conditions and should not require changes.
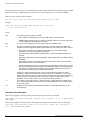
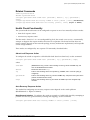
Health Check Messages
As stated earlier, ExtremeWare maintains five types of system health check error counters, divided into
two categories: three slow path counters and two fast path counters.
• Slow path counters:
— CPU packet error—Data (control or learning) packet processed by the CPU and found to be
corrupted (a passive health check).
— CPU diagnostics error—CPU health check (an active health check)
— Backplane diagnostics error—EDP diagnostics packets (an active health check)
• Fast path counters:
— Internal MAC checksum errors
— External MAC checksum errors
Each of these system health check counters has an associated system log message type, to help focus
attention during troubleshooting. These message types are reported in the system log according to the
level of threat to the system. The message levels are:
• Alert messages
• Corrective action messages
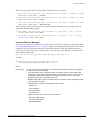
Alert Messages
These errors are inserted into the system log when the configured default error threshold is exceeded
within a given 20-second sampling window. When a threshold is exceeded, that window is marked as a
“bad” window and the interpreting and reporting subsystem inserts an error message into the system
log indicating the primary reason why the window was marked bad.
Advanced System Diagnostics and Troubleshooting Guide
33
Packet Errors and Packet Error Detection
The intent of these messages is to alert the NOC that the health check error threshold is being exceeded.
Closer monitoring is required, but these errors do not necessarily point to a systematic problem.
These messages take the general format:
date time <level:from> Sys-health-check type checksum error cat data
Example:
<CRIT:SYST> Sys-health-check [EXT] checksum error (fast path)
on slot 2,prev=73 cur=82
where:
level
The severity level, either CRIT or WARN.
•
CRIT indicates a critical failure in the system that requires corrective action.
•
WARN indicates that the error is most likely an isolated checksum occurrence and should
not be considered a critical failure to the system.
from
The source of the message, from either SYST (system) or KERN (kernel).
type
The type of test packet involved, possibly pointing to the packet origin and the diagnostic
subsystem involved. Supported packet type descriptors are: CPU, DIAG, EDP, EXT, and INT.
•
CPU, DIAG, and EDP refer to packets generated within the CPU health-checking
subsystem on the control (slow) path of the switch.
CPU packet types include DIAG and EDP packets, as well as data packets destined for
the CPU.
DIAG packet types refer to the CPU diagnostics packets generated by the health-checking
subsystem.
EDP packet types refer to the backplane health-checks used to test the communication
paths between the CPU and the I/O blades.
•
EXT and INT packet types refer to a checksum that is appended to each and every packet
that enters (ingresses) and exits (egresses) the switch fabric MACs on the data (fast) path.
EXT refers to an external fabric checksum (external, user-facing MAC); INT refers to an
internal fabric checksum (internal, backplane-facing MAC).
(Extreme “i” series switches pro-actively scan for fault conditions throughout the switch
architecture, and these packet types are all part of this effort. A checksum on one of these
packet types could have its root in packet memory, because all of these test packet types are
stored for a time in the packet memory. If the failure is within the packet memory and is
repeatable, run the packet memory scan to isolate and correct the failure.)
cat
The category—slow path counters vs. fast path counters—associated with the health check
error. This parameter indicates whether the window was marked bad due to fast-path reports
or slow-path reports.
data
Additional error information that summarizes the failure; content differs depending on the
associated type.
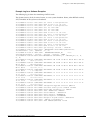
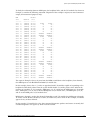
Checksum Error Messages:
This message appears in the log when packets received by the CPU are corrupted:
<Crit:KERN> Sys-health-check [CPU] checksum error (slow-path) on slot 7 701026-00-03
0003Y-00052
This message appears in the log when CPU Diagnostic packets received by the CPU are corrupted:
<Crit:SYST> Sys-health-check [DIAG] First 16 bytes of unknown pkt (slow-path) on
slot 7 701026-00-03 0003Y-00052
34
Advanced System Diagnostics and Troubleshooting Guide
Health Check Messages
These messages appear in the log when EDP packets received are corrupted:
• <Crit:SYST> Sys-health-check [EDP] checksum error (slow-path) on M-BRD, port 0x03
701026-00-03 0003Y-00052 — (Summit)
• <Crit:SYST> Sys-health-check [EDP] checksum error (slow-path) on BPLNE, port 0x03
701026-00-03 0003Y-00052 — (Alpine)
• <Crit:SYST> Sys-health-check [EDP] checksum error (slow-path) on MSM-A, port 0x03
701026-00-03 0003Y-00052 — (BlackDiamond)
These messages appear in the log when the hardware detects checksum errors in the fast path and
updates the corresponding registers:
• <Crit:KERN> Sys-health-check [EXT] checksum error (fast-path) on slot 4 prev=0
cur=100 701033-00-02 0047B-00008
• <Crit:KERN> Sys-health-check [INT] checksum error (fast-path) on slot 5 prev=0
cur=100 701033-00-02 0087E-00009
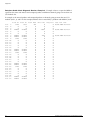
Corrective Behavior Messages
These error messages are inserted into the system log when the decision parameters (described earlier
in “Responding to Reported Failures” on page 31) used by the interpreting and reporting subsystem are
exceeded. These messages indicate that the system health check has taken the configured response
action (log, send traps, card down, system down, or auto recovery) upon detecting a systematic error
and take the general format:
date time <level:from> Sys-health-check [ACTION] problem-type error
Example:
<CRIT:SYST> Sys-health-check [ACTION] (PBUS checksum)
(CARD_HWFAIL_PBUS_CHKSUM_CPU_PKT_ERROR) slot 2
where:
problem-type
The type of problem detected, based on the health check diagnostic component that triggered
the action, from among the following:
•
CPU diag packet—Action was taken because an excessive number of CPU health check
packets were missed. Examine the CPU health check diagnostics. Errors on more than one
slot probably indicate MSM management bus transceiver issues. Errors on single slots
probably indicate that the specified slot is in error.
•
Backplane diag packet—Action was taken because an excessive number of backplane health
check packets were missed.
•
Hardware failure—Indicates a card diagnostic failure during:
- System boot
- Card initialization
- Manual diagnostics
- Transceiver test
•
PBUS checksum—Fabric checksum error detected for:
- Data traffic, [INT] or [EXT]
- CPU-bound traffic [CPU}
- EDP packets [EDP]
Advanced System Diagnostics and Troubleshooting Guide
35
Packet Errors and Packet Error Detection
error
•
Backplane link—Indicates that health check packets were lost on one or more backplane
links connecting an MSM module to an I/O module. Either module might be in error; check
the transceiver diagnostics.
•
FDB error—Indicates that a discrepancy was detected during the FDB scan of the RAM
memory pool.
The error condition that summarizes the failure. One of many values that points to a specific
hardware component or software test (for further problem isolation).
The PBUS checksum type might indicate a problem with the packet memory, but it might also point to
other problem types, indicating failures with other hardware components detected during additional
checking performed under the umbrella of the Extreme diagnostics suite. For example, any other
component in the path between the ingress and egress points could malfunction, resulting in a
corrupted checksum. You should be aware that PBUS checksum messages and conditions can be caused
by a packet memory failure, but that there are other possibilities as well. The packet memory scan
should always be used in conjunction with the extended diagnostics to check the integrity of all the
components.
Possible error conditions for PBUS action messages:
•
CARD_HWFAIL_PBUS_CHKSUM_INT_ERROR
•
CARD_HWFAIL_PBUS_CHKSUM_EXT_ERROR
•
CARD_HWFAIL_PBUS_CHKSUM_EDP_ERROR
•
CARD_HWFAIL_PBUS_CHKSUM_CPU_PKT_ERROR
•
CARD_HWFAIL_PBUS_CHKSUM_CPU_PKT_DIAG_ERROR
36
Advanced System Diagnostics and Troubleshooting Guide
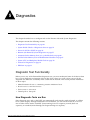
4
Software Exception Handling
This chapter describes the software exception handling features built into Extreme hardware and
software products to detect and respond to problems to maximize switch reliability and availability.
This chapter contains the following sections:
• Overview of Software Exception Handling Features on page 37
• Configuring System Recovery Actions on page 40
• Configuring Reboot Loop Protection on page 43
• Dumping the “i” Series Switch System Memory on page 45
Overview of Software Exception Handling Features
In the context of using the Extreme Advanced System Diagnostics—either manually or automatically,
there are several things you must keep in mind that can affect the operation of the diagnostics and/or
the reliable operation of the switch itself:
• System watchdog behavior
• System software exception recovery behavior (configuration options)
• Redundant MSM behavior (and failover, in BlackDiamond systems)
System Watchdog Behavior
The system watchdog is a system self-reliancy diagnostic mechanism to monitor the CPU and ensure
that it does not become trapped in a processing loop.
In normal operation, the system’s normal task processing periodically resets the watchdog timer and
restarts it, maintaining uninterrupted system operation. But if the watchdog timer expires before the
normal task processing restarts it, the system is presumed to be malfunctioning and the watchdog
expiry triggers a reboot of the master MSM.
Depending on the persistence of an error and the system recovery actions configured in the configure
sys-recovery-level command (reboot, shutdown, system dump, or—in the case of BlackDiamond
systems equipped with redundant MSMs—MSM failover), the reboot might cause the system to
perform the configured system recovery actions.
Advanced System Diagnostics and Troubleshooting Guide
37
Software Exception Handling
The system-watchdog feature is enabled by default. The CLI commands related to system-watchdog
operation are:
enable system-watchdog
disable system-watchdog
NOTE
During the reboot cycle, network redundancy protocols will work to recover the network. The impact on
the network depends on the network topology and configuration (for example, OSPF ECMP versus a
large STP network on a single domain).
Also, if the system-watchdog feature is not enabled, error conditions might lead to extensive service
outages. All routing and redundancy protocols use the CPU to calculate proper states. Using the OSPF
ECMP and STP networks as general examples, if the CPU becomes trapped in a loop, the system in
an OSPF network would be unable to process OSPF control messages properly, causing corruption in
routing tables, while in an STP network, spanning tree BPDUs would not be processed, causing all
paths to be forwarded, leading to broadcast storms, causing not only data loss, but loss of general
connectivity as well.
System Software Exception Recovery Behavior
ExtremeWare provides commands to configure system recovery behavior when a software exception
occurs.
• Recovery behavior—configure sys-recovery-level command
• Reboot behavior—configure reboot-loop-protection command
• System dump behavior—configure system-dump server command, configure system-dump
timeout command, and upload system-dump command
These commands and their uses are described in these sections:
• “Configuring System Recovery Actions” on page 40
• “Configuring Reboot Loop Protection” on page 43
• “Dumping the “i” Series Switch System Memory” on page 45
Redundant MSM Behavior
A number of events can cause an MSM failover to occur, including:
• Software exception; system watchdog timer expiry
• Diagnostic failure (extended diagnostics, transceiver check/scan, FDB scan failure/remap)
• Hot removal of the master MSM or hard-reset of the master MSM
The MSM failover behavior depends on the following factors:
• Platform type and equipage
• Software configuration settings for the software exception handling options such as system
watchdog, system recovery level, and reboot loop protection. (For more information on the
configuration settings, see Chapter 4, “Software Exception Handling.”)
In normal operation, the master MSM continuously resets the watchdog timer. If the watchdog timer
expires, the slave MSM will either 1) reboot the chassis and take over as the master MSM (when the
38
Advanced System Diagnostics and Troubleshooting Guide
Overview of Software Exception Handling Features
switch is equipped with MSM-64i modules), or 2) initiate a hitless failover (when the switch is
equipped with MSM-3 modules). The watchdog is a software watchdog timer that can be enabled or
disabled through CLI commands. The watchdog timer is reset as long as ExtremeWare is functioning
well enough to return to the main software exception handling loop where the critical software
exception handling tasks, such as tBGTask, handle the process of resetting the watchdog timer and
creating log entries.
• Software configuration settings for the system health check feature, or for any of the diagnostic tests
that you might choose to run manually.
For example, in the context of memory scanning and mapping, Chapter 5, “Diagnostics,” contains
three tables that describe the behavior of the switch for different platform types and diagnostics
configuration:
— Table 6: Auto-recovery memory scanning and memory mapping behavior
— Table 7: Manual diagnostics memory scanning and memory mapping behavior, normal
— Table 8: Manual diagnostics memory scanning and memory mapping behavior, extended
NOTE
On switches equipped with MSM64i modules, you should periodically use the synchronize command
to ensure that the slave MSM and master MSM are using matched images and configurations. If not
synchronized, the slave MSM might attempt to use the image it has loaded in conjunction with the
configuration from the master MSM, a mismatch that will most likely cause the switch to behave
differently after an MSM failover, thereby defeating the intended purpose of redundant peer MSMs.
The significance in the MSM failover behavior is that is affected by, and affects the use of the
diagnostics, and can also affect and be affected by the way you configure the software exception
handling options such as the system watchdog, system recovery level, and reboot loop protection. For
example, if you select the “shutdown” option in the configure sys-recovery-level command, one of
the actions the software routine performs is to instruct the slave MSM in a BlackDiamond switch not to
monitor the master MSM, to prevent MSM failover from occurring.
NOTE
The MSM-3 uses technology that provides “hitless” failover, meaning the MSM-3 transitions through a
failover with no traffic loss and no switch downtime, while it maintains active links and preserves layer 2
state tables. Contrast this performance to the failover process of MSM64i modules, which can take the
switch down for approximately 30 seconds. The MSM-3 makes hitless upgrades possible. It is supported
in ExtremeWare release 7.1.1 and later.
Advanced System Diagnostics and Troubleshooting Guide
39
Software Exception Handling
Configuring System Recovery Actions
ExtremeWare provides a user-configurable system recovery software diagnostic tool whose main
function is to monitor the system boot processes. If an error occurs during the POST, the system enters
a fail-safe mode that allows the network or system administrator to view logs and troubleshoot the
fault.
The system recovery behavior can also be configured to ensure that no software exception errors occur
during normal runtime operation. Although exception errors are extremely rare, they are possible. Task
exceptions can lead to unpredictable network behavior. For this reason, it is important to plan for such
a situation and configure the system to react in the appropriate manner: several configurable variables
can be set to determine the action the system takes should an exception error occur.
Related Commands
configure sys-recovery-level
configure system-dump
Configuring System Recovery Actions on “i” Series Switches
To specify a system recovery scheme for “i” series switches when a software exception occurs, use this
command:
configure sys-recovery-level [none | [all | critical] [msm-failover | reboot |
shutdown | system-dump [maintenance-mode | msm-failover | reboot | shutdown]]]
where:
none
No recovery action is taken when a software exception occurs (no system shutdown or
reboot, etc.). This is the default action.
all
If any task exception occurs, ExtremeWare logs an error in the system log and
automatically initiates the configured response action, selected from among the
following options:
•
msm-failover—(BlackDiamond switches only.) If there is a software exception on
the master MSM, the slave MSM takes over control of the switch.
•
reboot—Reboots the switch.
•
shutdown—Shuts down the switch (see “Usage Notes,” below).
•
system-dump—(Available only on switches with Ethernet management ports.) This
option should be used only with assistance from TAC. Initiates a memory dump
transfer to a remote TFTP dump server, followed by one of the following completion
actions: msm-failover, reboot, shutdown, or maintenance-mode.
Three of the completion actions under the system-dump option—msm-failover,
reboot, and shutdown—are the same as described above. The remaining
completion action for the system-dump option, maintenance-mode, leaves the
switch in whatever state the dump transfer puts it in. Some subsystems might not
work correctly, or work at all after a system dump.
These four system dump completion actions specify the action to be taken when the
system dump is complete. These actions occur whether or not the system dump
was successful.
critical
40
If a critical task exception occurs, ExtremeWare logs an error in the system log and
automatically initiates the configured response action, selected from among the
configuration options described for all, above. Critical tasks include the tBGTask,
tNetTask, tEdpTask, and tEsrpTask.
Advanced System Diagnostics and Troubleshooting Guide
Configuring System Recovery Actions
Configuring System Recovery Actions on “e” Series Switches
To specify a system recovery scheme for “e” series switches when a software exception occurs, use this
command:
configure sys-recovery-level [none | [all | critical]] [reboot]
where:
none
No recovery action is taken when a software exception occurs (no system shutdown or
reboot, etc.). This is the default action.
all
If any task exception occurs, ExtremeWare logs an error in the system log and, if
configured, automatically initiates the optional response action reboot (reboots the
switch).
critical
If a critical task exception occurs, ExtremeWare logs an error in the system log and, if
configured, automatically initiates the optional response action reboot (reboots the
switch). Critical tasks include the tBGTask, tNetTask, tEdpTask, and tEsrpTask.
Usage Notes
When you configure the shutdown option, and a software exception occurs, the system takes these
actions:
• All watchdogs and timers are stopped.
• All tasks except the following are suspended:
— tSwFault
— tLogTask
— tSyslogTask
— tShell
— tConsole
— tExtTask
— tExcTask
— The root task
• On BlackDiamond and Alpine switches, the I/O modules are powered down.
• On BlackDiamond switches, the slave MSM is instructed not to monitor the master MSM.
When the MSM-failover option is configured on a system equipped with MSM-64i modules and an
error occurs, the system requires a system reboot, so the impact to the system is basically the same as
for the reboot option.
When the MSM-failover option is configured on a system equipped with MSM-3 modules and an error
occurs, the system does not require a system reboot, so there is no service outage.
When the reboot option is configured on a system and an error occurs, the system is rebooted, causing
loss of connectivity to all modules. All software tasks are restarted, so any exception error is cleared and
the task restarted. If the task cannot be restarted, the system will fail the POST and will remain in
limited operation mode for further troubleshooting.
When the shutdown option is configured on the system and an error occurs, the system is shut down
and held out of service. This option offers administrators the ability to restore the system and reinsert it
Advanced System Diagnostics and Troubleshooting Guide
41
Software Exception Handling
back into the network during a scheduled outage window. This might be an advantage if all connected
nodes are dual-homed, as a reinsertion will trigger a network reconvergence and an additional service
outage.
NOTE
Under the reboot or shutdown options, network redundancy protocols will work to recover the network.
The only difference between these two options, in this case, is that under the reboot option the
reinsertion of the system triggers a second network convergence. The impact of the reconvergence
depends on the network topology and configuration (for example, OSPF ECMP versus a large STP
network on a single domain).
Also, if the system-recovery-level condition is set to none, the network might become subject to
unpredictable system behavior and—possibly—extensive system outages. Depending on the task that
experiences the exception error, the result might be corrupt routing tables and routing/broadcast loops.
42
Advanced System Diagnostics and Troubleshooting Guide
Configuring Reboot Loop Protection
Configuring Reboot Loop Protection
Reboot loop protection prevents a failure that persists across a reboot from putting the switch into an
endless cycle of reboots. Reboot loop protection is helpful to increase network stability in the event that
some systematic problem is causing the watchdog timer to expire or a software exception to be
triggered repeatedly. You can configure a reboot threshold and a history timer. If more than the
threshold number of automatic reboots occurs within the history timer interval, the system boots into
minimal mode with all ports disabled. For more information about minimal mode, see Appendix A.
NOTE
This capability can be helpful when there are two systems in a redundant configuration: If the reboot
loop happens, the rebooting system will end up offline and its redundant peer will take over until the
switch stuck in the reboot loop has been fixed.
In a non-redundant configuration, the use of this feature might result in the lone switch being taken
offline permanently.
Related Commands
configure reboot-loop-protection threshold
show switch
show configuration
Configuring Reboot Loop Protection
To configure reboot loop protection, use the following command:
configure reboot-loop-protection threshold <time-interval> <count>
where:
time-interval
The time period, in minutes, during which the switch is permitted to reboot the number
of times specified in count, before entering minimal mode. The period is a number in
the range from 0 to 255 minutes. The recommended setting is 10 minutes.
count
The number of reboots within the period specified as time-interval. The count is a
number in the range from 1 reboot to 7 reboots.
• By default, the reboot loop protection feature is disabled. If you enable the feature, the
recommended period for the time-interval threshold is 10 minutes.
• Specifying a time interval of 0 minutes disables the feature; specifying any other value enables it.
• If you specify a value for time-interval, but not for count, the default value for count is 3 reboots.
• If you reboot the switch manually, or use either the run msm-failover command or the
show configuration command, the time interval and count are both reset to 0.
• To view the current settings, use the show switch or show configuration commands.
• The reboot loop protection settings are stored in the switch memory, but are not saved in the switch
configuration. In a BlackDiamond switch equipped with redundant MSM64i modules, the
synchronize command does transfer the reboot loop protection settings to the synchronized
MSM64i.
Advanced System Diagnostics and Troubleshooting Guide
43
Software Exception Handling
On BlackDiamond switches you can configure the number of times the slave MSM can reboot within a
configured time limit or configure the slave MSM to use the global reboot-loop-protection configuration.
Use on the of the following commands:
configure reboot-loop-protection backup-msm threshold <time-interval> <count>
Or
configure reboot-loop-protection backup-msm threshold use-master-config
Use this command to configure the switch to use the global reboot-loop-protection configuration.
where:
time-interval
The time period, in minutes, during which the slave MSM is permitted to reboot the
number of times specified in count, before entering minimal mode. The period is a
number in the range from 0 to 255 minutes. The recommended setting is 10 minutes.
count
The number of reboots within the period specified as time-interval. The count is a
number in the range from 1 reboot to 7 reboots.
44
Advanced System Diagnostics and Troubleshooting Guide
Dumping the “i” Series Switch System Memory
Dumping the “i” Series Switch System Memory
On “i” series switches, you can dump (copy and transfer) the contents of the system DRAM memory to
a remote TFTP host so that it can be passed to an Extreme Networks technical support representative
who will examine and interpret the dump results. The system dump only works through the Ethernet
management port.
NOTE
The system dump procedure is used only for troubleshooting, and should be used only with assistance
from Extreme Networks technical support.
Related Commands
configure sys-recovery-level
configure system-dump server
configure system-dump timeout
upload system-dump
show system-dump
Configuring an Automatic System Dump During System Recovery
You can configure the system dump as an automatic response to a software exception using the
configure sys-recovery-level command. You can also initiate a system dump manually using the
upload system-dump command.
NOTE
The system dump commands are available only on the “i” series switches.
To configure an automatic system dump as the system recovery response action, perform these steps:
• Configure the IP address of the remote TFTP dump server.
To configure the IP address of the remote TFTP dump server to which the dump is to be transferred
(if the system-dump option is specified in the configure sys-recovery-level system-dump
command), use this command:
configure system-dump server <ip address>
The IP address must be reachable through the VLAN mgmt. This IP address is also used if no
IP address is specified in the upload system-dump command.
• Set a system dump timeout (optional).
To configure an optional timeout for the dump transfer (if the system-dump option is specified in the
configure system-recovery-level system-dump command), use this command:
configure system-dump timeout <seconds>
The minimum non-zero value is 120 seconds. The recommended value is 480 seconds. The default is
0 seconds (no timeout).
Advanced System Diagnostics and Troubleshooting Guide
45
Software Exception Handling
• Configure the system dump as a system recovery response action.
To specify a system memory dump if a software exception occurs, use this command:
configure sys-recovery-level [all | critical] system-dump [maintenance-mode |
msm-failover | reboot | shutdown]]]
where:
all
If any task exception occurs, ExtremeWare logs an error in the system log and
automatically initiates a memory dump transfer to a remote TFTP dump server,
followed by one of the following completion actions: msm-failover, reboot,
shutdown, or maintenance-mode. These completion actions are described in
“Configuring System Recovery Actions” on page 40.
critical
If a critical task exception occurs, ExtremeWare logs an error in the system log and
automatically initiates a memory dump transfer to a remote TFTP dump server,
followed by one of the following completion actions: msm-failover, reboot,
shutdown, or maintenance-mode. These completion actions are described in
“Configuring System Recovery Actions” on page 40.
• To turn off the system dump action in the system-recovery-level process, use this command:
unconfigure system-dump
• To display the configured values for the system-dump server and system-dump timeout settings,
use this command:
show system-dump
When neither the server IP address nor the timeout parameter has been configured, the
show system-dump command display looks like this:
Server ip : none
Dump timeout : none
When both the server IP address and the timeout parameter have been configured, the
show system-dump command display looks similar to this example:
Server ip : 10.5.2.82 (ok)
Dump timeout : 300 seconds
When the configured server IP address is unreachable, the show system-dump command display
looks similar to this example:
Server ip : 10.45.209.100 - currently unreachable via “Mgmt” vlan
dump timeout : none
Initiating a Manual System Dump
To initiate a manual system dump to a remote TFTP dump server, identified by its IP address, use the
following command:
upload system-dump [<ip address>]
If you do not specify an IP address, the system attempts to use the IP address specified in the
configure system-dump server command.
46
Advanced System Diagnostics and Troubleshooting Guide
Dumping the “i” Series Switch System Memory
Example Log for a Software Exception
The following log is taken after simulating a BGTask crash.
The System recovery level, for critical events, is set to system shutdown. Hence, when BGTask crashed,
all I/O modules in the system was shutdown.
12/23/2000 23:15:14.87 <Info:SYST> Set card 9 to Non-operational
12/23/2000 23:15:14.85 <Info:SYST> Card in slot 9 is off line
12/23/2000 23:15:13.75 <Info:SYST> Set card 8 to Non-operational
12/23/2000 23:15:13.73 <Info:SYST> Port 8:3 link down
12/23/2000 23:15:13.73 <Info:SYST> Port 8:2 link down
12/23/2000 23:15:13.73 <Info:SYST> Port 8:1 link down
12/23/2000 23:15:13.72 <Info:SYST> Card in slot 8 is off line
12/23/2000 23:15:11.62 <Info:SYST> Set card 7 to Non-operational
12/23/2000 23:15:11.58 <Info:SYST> Card in slot 7 is off line
12/23/2000 23:15:10.48 <Info:SYST> Set card 6 to Non-operational
12/23/2000 23:15:10.45 <Info:SYST> Card in slot 6 is off line
12/23/2000 23:15:08.35 <Info:SYST> Set card 4 to Non-operational
12/23/2000 23:15:08.27 <Info:SYST> Card in slot 4 is off line
12/23/2000 23:15:07.17 <Info:SYST> Set card 3 to Non-operational
12/23/2000 23:15:07.15 <Info:SYST> Card in slot 3 is off line
12/23/2000 23:15:07.15 <Crit:SYST> sys-recovery: critical - shutdown
12/23/2000 23:15:07.15 <Warn:SYST> 00x80793b70 twisterMemoryToBuffer+48 :
fetchPacketMore ( 381 , &gXBuffer , 0 , 0 )
12/23/2000 23:15:07.11 <Warn:SYST> 00x800b9500 BGTask2_G2
+7cc:
twisterMemoryToBuffer ( eeeeeeee , eeeeeeee , eeeeeeee , 200bb )
12/23/2000 23:15:07.04 <Warn:SYST> 00x80e0f63c vxTaskEntry +c : BGTask2_G2 (
0 , 0 )
12/23/2000 23:15:07.01 <Summ:KERN> 0x81848670: 00 38 00 39 00 3a 00 3b 00
00 3e 00 3f
*8*9*:*;*<*=*>*?
12/23/2000v23:15:07.01 <Summ:KERN> 0x81848660: 00 30 00 31 00 32 00 33 00
00 36 00 37
*0*1*2*3*4*5*6*7
12/23/2000 23:15:07.01 <Summ:KERN> 0x81848650: 00 28 00 29 00 2a 00 2b 00
00 2e 00 2f
*(*)***+*,*-*.*/
12/23/2000 23:15:07.01 <Summ:KERN> 0x81848640: 00 20 00 21 00 22 00 23 00
00 26 00 27
* *!*"*#*$*%*&*'
12/23/2000 23:15:07.01 <Summ:KERN> 0x81848630: ff ff ff ff ff ff ff ff ff
ff ff ff ff
****************
12/23/2000 23:15:07.01 <Summ:KERN> 0x81848620: ff ff ff ff ff ff ff ff ff
ff ff ff ff
****************
12/23/2000 23:15:07.01 <Summ:KERN> 0x81848610: ff ff ff ff ff ff ff ff ff
ff ff ff ff
****************
12/23/2000 23:15:07.01 <Summ:KERN> 0x81848600: ff ff ff ff ff ff ff ff ff
ff ff ff ff
****************
12/23/2000 23:15:07.01 <Crit:KERN> inFlags=120 eType=bb offset=1a gMbuf=0
12/23/2000 23:15:07.01 <Crit:KERN> Line=5476 card=5 pt=1ec chsub=0 len=400
12/23/2000 23:15:07.01 <Crit:KERN> Crash Dump Information for tBGTask
12/23/2000 23:15:07.01 <Warn:SYST> Task: 0x8da2fe30 "tBGTask"
12/23/2000 23:15:07.01 <Warn:SYST> Access Address : 0x8da2f11d
12/23/2000 23:15:07.01 <Warn:SYST> Cause Register: 0x00001010
12/23/2000 23:15:07.01 <Warn:SYST> Status Register: 0x3400ad00
12/23/2000 23:15:07.01 <Warn:SYST> Exception Program Counter: 0x80791f10
12/23/2000 23:15:07.01 <Warn:SYST> Address load Exception
12/23/2000 23:15:07.01 <Crit:SYST> Task tBGTask(8da2fe30) failed
Advanced System Diagnostics and Troubleshooting Guide
0 , 0 ,
3c 00 3d
34 00 35
2c 00 2d
24 00 25
ff ff ff
ff ff ff
ff ff ff
ff ff ff
47
Software Exception Handling
48
Advanced System Diagnostics and Troubleshooting Guide
5
Diagnostics
This chapter describes how to configure and use the Extreme Advanced System Diagnostics.
This chapter contains the following sections:
• Diagnostic Test Functionality on page 49
• System Health Checks: A Diagnostics Suite on page 52
• Power On Self Test (POST) on page 56
• Runtime (On-Demand) System Diagnostics on page 57
• Automatic Packet Memory Scan (via sys-health-check) on page 60
• Per-Slot Packet Memory Scan on BlackDiamond Switches on page 67
• System (CPU and Backplane) Health Check on page 70
• Transceiver Diagnostics on page 82
• FDB Scan on page 88
Diagnostic Test Functionality
Before you use any of the ExtremeWare diagnostic tests, you must understand some of the basics about
how a given diagnostic test functions (what it does; how it does it) as well as how your use of that
diagnostic test affects the availability of the switch and the network. This section provides information
on these topics:
• Manual initiation of tests vs. automatic, proactive initiation of tests
• Invasive tests vs. non-invasive tests
• Passive tests vs. active tests
• Control path vs. data path
How Diagnostic Tests are Run
Some diagnostic tests, such as the POST, run automatically each time the switch is booted, to validate
basic system integrity. Through ExtremeWare CLI commands, you can turn the POST off, or set it to
run in either of three modes: FastPOST (faster-running, basic test sequence), normal (basic test
sequence), or extended (more thorough, but longer-running test sequence).
Advanced System Diagnostics and Troubleshooting Guide
49
Diagnostics
Some diagnostic tests, such as the slot-based hardware diagnostics (including the packet memory scan),
for example, can be run on demand through user CLI commands. Other tests can be run on demand by
user CLI commands and can also be configured to observe specific user-selected settings.
All of the ExtremeWare diagnostic tests can be coordinated under the umbrella of the ExtremeWare
system health check feature, which runs automatic background checks to detect packet memory errors
and take automatic action when errors are found. The system health check feature is enabled by a CLI
command on a switch-wide basis, and the operating parameters and failure responses of the various
diagnostic subsystems can be configured through CLI commands. As a diagnostic system, the system
health check tests try to detect and resolve possible problem situations before they become a problem,
using the diagnostic subsystems in a manner that parallels operator-initiated tests in manual mode.
Operating in manual mode, when the system log reports errors or failures, you would run the
appropriate diagnostic test set to isolate the source of the problem. Depending on the nature of the
diagnostic test (suppose the diagnostic test takes the module or switch offline while the diagnostic test
runs), you must be aware of the downtime impact when you run the diagnostic test.
Operating in automatic mode, the proactive nature of the system health checker and its diagnostic test
subsystems means that a module or switch might be taken offline automatically when an error is
detected, possibly resulting in extensive network outages.
The key to effective diagnostic use in optimizing network availability lies in understanding what
happens in the switch when a given test is run.
How the Test Affects the Switch
The impact a diagnostic test has on switch operation is determined by the following characteristics:
• Invasive versus non-invasive
• Passive versus active
• Control path versus data path
Some diagnostic tests are classed as invasive diagnostics, meaning that running these diagnostics
requires the switch to be partly or entirely offline (system traffic is interrupted). Some invasive
diagnostics take down just the module in the targeted chassis slot for the duration of the test; some
diagnostics take down the entire switch. Some invasive diagnostics can be invoked manually through a
CLI command; other diagnostics can be configured as part of the system health checks to become active
only when certain kinds of packet memory errors occur within configured window periods or at
configured threshold levels.
Other diagnostic tests are classed as non-invasive, meaning that running them does not take the switch
offline, but that they can still affect the overall performance, depending on whether the non-invasive
test is a passive test or an active test, and uses the management or control bus (see Figure 10) or the data
bus during the test:
• In a passive test, the test merely scans switch traffic (packet flow) for packet memory errors.
• In an active test, the test originates test messages (diagnostic packets) that it sends out and then
validates to verify correct operation.
Figure 9 and Figure 10 show the same simplified BlackDiamond architecture block diagram of an I/O
module, backplane links, and MSM, but each illustrates how different tests use the management bus
(also referred to as the CPU control bus or the slow path) and the data bus (or fast path).
50
Advanced System Diagnostics and Troubleshooting Guide
Diagnostic Test Functionality
Diagnostic tests are processed by the CPU. When invoked, each diagnostic tests looks for different
things (device problems, communication-path problems, etc.), and uses either the control bus or the
data bus, or—in some cases—both buses to perform the test.
For example, Figure 9 shows a simplified example of the CPU health check test. The CPU health check
test sends five different diagnostic packets across the control bus to each I/O module. From the I/O
module, the packets are looped back to the CPU across the control bus. The CPU inspects the packets
for loss or errors.
Figure 9: CPU health check path (BlackDiamond architecture)
Control Bus
Control Bus
CPLD
UART
To Backplane
MAC
SRAM
PQM
PBus
To Backplane
MAC
SE
ASIC
(Twister)
FLASH
MGMT
Packet
Memory
MAC
PBus
I/O Module (G8Xi)
OTP
AFQM
ASIC
(Quake)
MAC
To Backplane
To Backplane
To MSM-B
Backplane
INT MAC
VPST
FDB
Backplane
To MSM-A
INT MAC
VPST
Packet
Memory
Control Bus
CPU
Subassembly
PCMCIA
PQM
PBus
SE
ASIC
(Twister)
EXT MAC
To PHY
OTP
EXT MAC
AFQM
ASIC
(Quake)
PBus
To PHY
FDB
NVRAM
Master MSM Daughter Card
CPU transmits test
packet to SE ASIC
on Control bus.
SE ASIC transmits
back to CPU on
Control bus.
Control Bus
Master MSM (MSM-A)
(To all other slots)
DN_031A
Figure 10 shows a simplified example of the backplane health check test. In the backplane health check,
the CPU uses the control bus to load test packets into the fabric of the MSM. The packets are then
transferred across the backplane from the MSM to the fabric on a given I/O module. The health check
packets are then returned to the CPU which processes the results.
Advanced System Diagnostics and Troubleshooting Guide
51
Diagnostics
Figure 10: Backplane health check paths (BlackDiamond architecture)
Control Bus
Control Bus
CPLD
UART
MAC
To Backplane
FLASH
PQM
PBus
SRAM
To Backplane
MAC
SE
ASIC
(Twister)
MGMT
Master MSM Daughter Card
CPU loads test packet
to MSM Fabric.
Packet
Memory
PBus
MAC
I/O Module (G8Xi)
OTP
MAC
To Backplane
AFQM
ASIC
(Quake)
Backplane
To Backplane
To MSM-B
INT MAC
VPST
FDB
Backplane
INT MAC
To MSM-A
VPST
Packet
Memory
Control Bus
CPU
Subassembly
PCMCIA
PQM
PBus
SE
ASIC
(Twister)
EXT MAC
To PHY
OTP
EXT MAC
AFQM
ASIC
(Quake)
PBus
To PHY
FDB
NVRAM
Test packet transferred to
I/O module Fabric on data
bus (fast path).
Control Bus
Master MSM (MSM-A)
Test packet returned to
CPU on Control bus.
(To all other slots)
DN_032A
System Health Checks: A Diagnostics Suite
Keep in mind that the goal of the diagnostics suite is to help users achieve the highest levels of network
availability and performance by having system hardware, software, and diagnostics work together to
reduce the total number of failures and downtime through:
• More accurate reporting of errors (fewer false notifications; more information about actual errors)
• Early detection of conditions that lead to a failure (so that corrective action can be taken before the
failure occurs)
• Automatic detection and correction of packet memory errors in the system’s control and data planes
Diagnostic Suite Components
The components that make up the diagnostic test suite include:
• Power on self test (POST)
— Runs at system boot
— Offers configurable levels
• Runtime, slot-based diagnostics
— Normal, extended, and packet memory scan
— Run on demand by user command
52
Advanced System Diagnostics and Troubleshooting Guide
System Health Checks: A Diagnostics Suite
— Offer configurable levels
— Remove the switch fabric from service for the duration of the tests
• Background packet memory scanning and mapping
— Checks all packet storage memory for defects
— Potentially maps out defective blocks
• Backplane and CPU health checks
— Checks end-to-end integrity on communication paths between the CPU and all I/O modules
— Takes automatic action when errors are detected
• Upper layer protocol validation
— Extreme Discovery Protocol (EDP) continuous polling
— Validation of TCP and other protocols
• FDB check
— Run on demand by user
— Compares existing software FDB entries with hardware forwarding tables
• Background FDB memory scanning
— Tied to the system health check configuration
— Runs in background
— Scans the FDB memory for possible defects
— Remap function marks suspect entries against future use
• Background transceiver scanning
— Tied to the system health check configuration
— Runs in background to detect potential control path faults
— Tests internal transceiver data paths
— Tests all ASICs for proper read/write operations
The Role of Memory Scanning and Memory Mapping
The memory scanning and memory mapping functions identify and attempt to correct switch fabric
checksum errors. When you are in the process of implementing the ExtremeWare diagnostics, keep in
mind that these functions are an underlying base for much of what takes place in the diagnostic tests
that make up the system health checks diagnostic suite. For more information, see Chapter 3, “Packet
Errors and Packet Error Detection.”
NOTE
Memory scanning addresses switch fabric checksum errors detected in the packet memory area of the
switching fabric. The memory scanning and mapping features are supported only on “i” series Summit,
Alpine, and BlackDiamond switches.
The ExtremeWare memory scanning and memory mapping diagnostics are analogous to hard disk
scanning tools, which are used to detect and map out bad sectors so that the drive can remain
operational with no adverse effects on performance, capacity, or reliability. The ExtremeWare memory
Advanced System Diagnostics and Troubleshooting Guide
53
Diagnostics
scanning and memory mapping diagnostics are used to identify and correct switch fabric checksum
errors.
Memory scanning and memory mapping are two separate functions: scanning detects the faulted
portion of the memory; mapping re-maps the memory to remove the faulted memory section.
Memory scanning is designed to help isolate one of the major root causes of fabric checksum errors:
single-bit permanent (hard) failures. Memory scanning detects—with a high probability—all current
single-bit permanent (hard) failures in the switch memory that would result in fabric checksum errors.
Memory mapping can correct up to eight of these detected permanent (hard) single-bit errors by
reconfiguring the memory maps around the problem areas.
The packet memory scan examines every node of packet memory to detect packet errors by writing
data to packet memory, then reading and comparing results. The test is invasive and takes the switch
fabric offline to perform the test.
Errored cell correction:
• If the test detects eight or fewer error cells, those error cells will be mapped and excluded from use.
The module will continue to operate.
• If the test detects more than eight error cells, the module is identified as “failed” and must be
replaced.
You should use this test when the system log displays some intermittent or sporadic error messages
that might indicate a problem, but do not provide sufficient information to confirm the problem or
isolate the fault.
Modes of Operation
The Memory Scanning feature has two modes of operation:
• Manual mode (the default and recommended mode)
• Automatic mode (which should be used only in redundant networks)
NOTE
The memory scanning facility is a highly CPU intensive application and will consume full CPU cycles
when executed.
Memory scanning is supported on the following “i” series platforms and modules:
• BlackDiamond 6816, BlackDiamond 6808, and BlackDiamond 6804
• BlackDiamond modules: MSM, F96Ti, F48Ti, G8Xi, G8Ti, G12SXi, G16Xi, G16Ti, 10G Xenpak
• Alpine 3808, Alpine 3804, and Alpine 3802 (manual mode only)
• Summit48i, Summit7i, Summit5i, Summit1i, and Summit48si (manual mode only)
Manual Mode. A manual CLI command issued from any administrator level session initiates the
manual mode, as its name implies, for initiating memory scanning. Note that when memory scanning is
executed, it should be done so with the awareness that other tasks requiring CPU service cycles will be
impacted.
54
Advanced System Diagnostics and Troubleshooting Guide
System Health Checks: A Diagnostics Suite
Automatic Mode. Automatic mode for initiating a memory scan is set up when the system health
check auto-recovery option is enabled (see “System (CPU and Backplane) Health Check” on page 70).
When system health checks fail at the specified frequency, packet memory is invoked automatically.
Automatic mode status is listed in the “sys-health-check” field of the display for the show switch
command.
When auto-recovery is configured, an automated background polling task checks every 20 seconds to
determine whether any fabric checksums have occurred. Three consecutive samples must be corrupted
for any module to invoke autoscan.
CAUTION
If the automatic mode is invoked—regardless of the “i” series platform type or number of errors—there
is an initial period where the device is taken offline so that the scan can be run.
The ExtremeWare diagnostics suite provides packet memory checking capabilities on “i” series Summit,
Alpine, and BlackDiamond systems at four levels:
• Manually, as a subset of the extended system diagnostic, through the command:
run diagnostics extended
• Manually, through the command:
run diagnostics packet-memory
These two options are available on “i” series Summit, Alpine, and BlackDiamond systems, and are
described in “Runtime Diagnostics on “i” Series Systems” on page 57.
• Automatically, as a background task under the global system health check umbrella, as configured
in the commands:
enable sys-health-check
configure sys-health-check auto-recovery <number of tries> [offline | online]
(BlackDiamond)
configure sys-health-check alarm-level auto-recovery [offline | online] (Alpine or Summit)
This option is available on “i” series Summit, Alpine, and BlackDiamond systems, and is described
in “System (CPU and Backplane) Health Check” on page 70.
• Automatically, on a per-slot basis, to scan and check the health of a specific BlackDiamond module,
as configured in the command:
configure packet-mem-scan-recovery-mode
This option is available on BlackDiamond systems only, and is described in “Per-Slot Packet Memory
Scan on BlackDiamond Switches” on page 67.
The Role of Processes to Monitor System Operation
When you are in the process of implementing the ExtremeWare diagnostics, keep in mind the software
fault recovery features built into Extreme hardware and software products to detect and respond to
problems to maximize switch reliability and availability. The System-Watchdog,
System-Recovery-Mode, and Reboot-Loop-Protection functions ensure that the switch can not only pass
all POST test diagnostics, but also verify that all processes continue to perform properly during runtime
operation. For more information, see Chapter 4, “Software Exception Handling”.
Advanced System Diagnostics and Troubleshooting Guide
55
Diagnostics
Power On Self Test (POST)
The POST actually consists of two test processes: a “pre-POST” portion that runs before the POST, and
the POST itself. The entire POST (both portions) runs every time the system is booted. It tests hardware
components and verifies basic system integrity. The POST can be configured to run in normal or
extended mode. The default is normal mode because it consumes less time.
The pre-POST test is a bootup process that tests CPU memory, Universal Asynchronous
Receiver/Transmitter (UART) parts, ASIC registers and memory.
The POST tests the following switch elements (depending on the module type: MSM or I/O module):
• Register ASIC on the CPU
• Real Time Clock
• Management port PCI memory, PCI interface, and transceiver loopback
• Register ASICs (Twister, Quake, MAC, Triumph ASICs)
• Memory (Twister ACL, Quake external memory, MAC memory, Triumph external memory)
• Built-in self test (BIST) in ASICs (Twister, MAC, Triumph)
• Loop-back test (ready state initialization; MAC loop-back test; IP route loop-back test)
Related Commands
configure diagnostics [extended | fastpost | normal | off | verbose | quiet]
unconfigure switch all
show diagnostics {slot [msm-a | msm-b | <slot number>]}
show switch
Configuring the Boot-Up Diagnostics
To configure the boot-up diagnostics, use this command:
configure diagnostics [extended | fastpost | normal | off | verbose | quiet]
where:
extended
Specifies that the extended diagnostic routine be run each time the switch boots. The
extended POST routine takes the switch fabric and ports offline, and performs extensive
ASIC, ASIC-memory, and packet memory tests.
fastpost
Specifies that the fastpost diagnostic routine be run each time the switch boots. The
fastpost routine takes the switch fabric offline and performs a simple ASIC test. The fastpost
routine is the default.
normal
Specifies that the normal diagnostic routine be run each time the switch boots. The normal
POST routine takes the switch fabric and ports offline, and performs a simple ASIC and
packet loopback test on all the ports.
off
Specifies that no diagnostic routine be run when the switch boots.
verbose
Specifies that the results of every test are recorded in the log. The verbose option is not
saved through a reboot, so you must reconfigure verbose mode after running diagnostics.
quiet
Specifies that only the pass or fail result is recorded in the log.
56
Advanced System Diagnostics and Troubleshooting Guide
Runtime (On-Demand) System Diagnostics
Runtime (On-Demand) System Diagnostics
The ExtremeWare diagnostics test suite offers a set of one-time test routines that can be run on demand
by user command. Depending on the switch platform and model—differences in hardware architecture
determine what aspects of the diagnostic tests apply, these tests are activated by different commands
and different user-configurable options.
• “i” series switches—The BlackDiamond family of core chassis switches (6804, 6808, and 6816), the
Alpine systems (3802, 3804, 3808), and the Summit “i”-series stackables (Summit1i, Summit5i,
Summit7i, Summit 48i, and Summit48Si).
• “e” series switches—Summit 200-24, Summit 200-48, Summit 300-24, Summit 300-48,
Summit 400-24p, Summit 400-24t, and Summit 400-48t.
NOTE
Only run these diagnostics when the switch or module can be brought off-line. The tests performed are
extensive and affect traffic that must be processed by the system CPU, because the diagnostics are
processed by the system CPU.
Runtime Diagnostics on “i” Series Systems
On “i” series systems, there are three categories of runtime diagnostics:
• Normal System Diagnostics—These tests take the switch fabric and ports offline and perform a
simple, fast ASIC and packet loopback test on all switch fabric ports. The normal tests are completed
in approximately 30 seconds.
The normal system diagnostics test the following switch elements (depending on the switch
type—Summit or Alpine vs. BlackDiamond, and—for BlackDiamond systems—the module type
being tested: MSM or I/O module):
— Register ASIC on the CPU
— Real Time Clock
— Management port PCI memory, PCI interface, and transceiver loopback
— Register ASICs (Twister, Quake, MAC, Triumph ASICs)
— Memory (Twister ACL, Quake external memory, MAC memory, Triumph external memory)
— Built-in self test (BIST) in ASICs (Twister, MAC, Triumph)
— Loop-back test (ready state initialization; MAC loop-back test; IP route loop-back test)
• Extended System Diagnostics—These tests take the switch fabric and ports offline and perform
extensive ASIC, ASIC-memory, and packet loopback tests. The extended tests take a maximum of 15
minutes.
These diagnostics test hardware components to verify basic system integrity. These diagnostics are
invasive. You should use these diagnostics when the syslog displays some intermittent or sporadic
error messages that might indicate a problem, but does not provide sufficient information to confirm
the problem or isolate the fault. The extended system diagnostics help verify whether the error
messages indicate soft, transient errors or hard faults.
The extended system diagnostics test the same set of switch elements as the normal diagnostics
described above (depending on the switch type—Summit or Alpine vs. BlackDiamond, and—for
Advanced System Diagnostics and Troubleshooting Guide
57
Diagnostics
BlackDiamond systems—whether the module type being tested is an MSM or an I/O module), but
adds the following two test sets:
— Packet memory test (where possible, this test also attempts to remap up to eight errors)
— Additional loop-back tests: Big packet (4k) MAC, transceiver, VLAN
• On Demand Packet Memory Scan—The packet memory test scans the switch fabric in the switch
(Summit or Alpine) or the module in the specified slot (BlackDiamond only) for single-bit packet
memory defects.
While the packet memory scan is normally invoked and runs as part of the extended system
diagnostics, it can also be run independently to identify and correct errors in the packet memory
area.
The packet memory scan diagnostic scans the specified module (in a BlackDiamond switch), the
passive backplane of an Alpine switch, or the switch fabric in a Summit switch to detect single-bit
memory defects and their associated buffer locations.
Related Commands
run diagnostics normal slot [msm-a | msm-b | <slot number>]
run diagnostics_noslot [normal | extended | packet-memory]
configure diagnostics [extended | fastpost | normal | off]
show diagnostics {slot [msm-a | msm-b | <slot number>]}
show diagnostics packet-memory slot <slot number>
(Alpine and Summit only)
Running the Diagnostics on BlackDiamond Systems
These runtime diagnostics can be run on specific slots in a BlackDiamond switch. These tests check the
CPU subsystem, the switch fabric subsystem (MSMs and I/O modules), and control and data path
communication.
To run the diagnostics on a BlackDiamond system, use this command:
run diagnostics [extended | normal | packet-memory] slot [<slot-number> |
msm-a | msm-b]
where:
extended
Runs the extended diagnostic routine.
normal
Runs the normal diagnostic routine.
packet-memory
Runs packet memory diagnostics.
slot number
Specifies an I/O module installed in a particular slot of a BlackDiamond chassis.
msm-a
Specifies the MSM installed in slot A of a BlackDiamond chassis.
msm-b
Specifies the MSM installed in slot B of a BlackDiamond chassis.
The command is only executed on one module at a time, but you can queue up two run diagnostics
commands at a time.
Runtime Diagnostics on “i” Series Alpine and Summit Systems
To run the diagnostics on an Alpine or a Summit system, use this command:
run diagnostics_noslot [normal | extended | packet-memory]
58
Advanced System Diagnostics and Troubleshooting Guide
Runtime (On-Demand) System Diagnostics
System Impact of Running the Diagnostics on “i” Series Switches
These diagnostics are invasive diagnostics. The diagnostics perform different tests, depending on
whether the test is being performed on the CPU subsystem or an individual I/O module. The
diagnostics reset and erase all current hardware states. The impact of the diagnostics depends on the
switch type and—in the case of the BlackDiamond switch—whether the module type being tested is an
MSM or an I/O module (see Table 5).
Table 5: System Response to Invasive Diagnostics
Platform
Condition
Response
BlackDiamond;
two MSM64i modules
Master MSM fails or diagnostics are run on
master MSM
Switch fails over to standby MSM.
BlackDiamond;
two MSM64i modules
Slave MSM fails or diagnostics are run on slave
MSM
Switch transitions to single MSM
operation (no backup MSM).
BlackDiamond;
one MSM64i
MSM fails or diagnostics are run on MSM
Switch reboots.
Alpine
Switch fails or diagnostics are run on switch
Switch reboots.
Summit
Switch fails or diagnostics are run on switch
Switch reboots.
NOTE
When you run the packet memory diagnostic, the system displays a message warning about potential
impacts on your switch and network (because the module—in a BlackDiamond switch—or the entire
switch—for Alpine and Summit switches—will be taken offline during the time the diagnostic is running)
and prompts you to confirm or cancel the test.
When you enter the run diagnostics normal command on a BlackDiamond with one MSM, an
Alpine, or a Summit system, the system displays the following message and prompts you to confirm
the action:
Running Normal diagnostics will reset the switch and disrupt network traffic.
Are you sure you want to continue? yes/no
When you enter the run diagnostics extended command on a BlackDiamond with one MSM, an
Alpine, or a Summit system, the system displays the following message and prompts you to confirm
the action:
Running Extended diagnostics will reset the switch and disrupt network traffic.
Extended diagnostic will also execute Packet Memory Scan........
WARNING: Device may be taken offline. To prevent this
first configure “sys-health-check alarm-level auto-recovery online”
Are you sure you want to continue? yes/no
Runtime Diagnostics on “e” Series Systems
The ExtremeWare diagnostics tests for the “e” series switches is a set of one-time test routines that can
be run on demand by user command. These tests check the CPU subsystem, the switch fabric
subsystem, and control and data path communication.
Advanced System Diagnostics and Troubleshooting Guide
59
Diagnostics
NOTE
Only run these diagnostics when the switch can be brought off-line. The tests performed are extensive
and affect traffic that must be processed by the system CPU, because the diagnostics themselves are
processed by the system CPU.
Related Commands
run diagnostics
show diagnostics
Running the Diagnostics on Summit “e” Switches
To run the diagnostics on a Summit “e” system, use this command:
run diagnostics [extended | normal | stack-port]
where:
extended
(All Summit “e” switches.) The extended test routine takes the switch fabric and ports
offline and perform extensive ASIC, ASIC-memory, and packet loopback tests. The
extended tests take a maximum of 15 minutes.
normal
(All Summit “e” switches.) The normal test routine takes the switch fabric and ports
offline and perform a simple, fast ASIC and packet loopback test on all switch fabric
ports. The normal tests are completed in approximately 30 seconds.
stack-port
(Summit 400 switches only.) The stack-port option runs the diagnostic test routine on
the stacking port of the Summit 400 switch.
System Impact of Running the Diagnostics on Summit “e” Series Switches
These diagnostics are invasive diagnostics. The diagnostics perform different tests, depending on
whether the test is being performed on the CPU subsystem or an individual I/O module. The
diagnostics reset and erase all current hardware states. On the Summit “e” series switches, when the
runtime diagnostics are activated (or the switch fails), the switch is offline and reboots.
When you enter the run diagnostics command on a Summit “e” series switch, the test routine will
display a message prompting you to confirm the diagnostic action. For example,
Running Normal diagnostics will reset the switch and disrupt network traffic.
Are you sure you want to continue? yes/no
Automatic Packet Memory Scan (via sys-health-check)
An automatic packet memory scan is set up when the system health check auto-recovery option is
enabled (see “System (CPU and Backplane) Health Check” on page 70). When system health checks fail
at the specified frequency, packet memory scanning is invoked automatically.
NOTE
The automatic packet memory scan and system health check features are supported only on “i” series
Summit, Alpine, and BlackDiamond switches.
60
Advanced System Diagnostics and Troubleshooting Guide
Automatic Packet Memory Scan (via sys-health-check)
Automatic mode status is listed in the “sys-health-check” field of the display for the show switch
command.
When auto-recovery is configured, an automated background polling task checks every 20 seconds to
determine whether any fabric checksums have occurred. Three consecutive samples must be corrupted
for any module to invoke autoscan.
CAUTION
If automatic packet memory scanning is invoked—regardless of ‘i” series platform type or number of
errors—there is an initial period where the device is taken offline so that the scan can be run.
Memory Scanning and Memory Mapping Behavior
Memory scanning and memory mapping behavior differs depending on the “i” series switch platform,
whether you run the diagnostics manually or configure the auto-recovery option of the system health
checker, and the mode you configure (online or offline).
For BlackDiamond systems, once the test is initiated (either automatically or by manual control), the
memory scanning feature takes the selected module offline and initiates a thorough memory write/read
operation to detect any permanent single-bit errors in the memory of the module. This scan takes
approximately 90 seconds and the module remains offline for the duration of the scan.
For Summit “i” series and Alpine systems, the test is initiated by manual command, the entire switch is
taken offline during the time test is running and is then rebooted.
Table 6 describes the behavior of the switch if you configure auto-recovery using the
configure sys-health-check CLI command. The scan behavior differs based on the hardware
configuration, the mode selected (online or offline), and the number of errors to be detected.
Table 6: Auto-recovery memory scanning and memory mapping behavior
Platform
Alpine
Summit “i” series
BlackDiamond with
one MSM64i (or
slave MSM64i is
offline)
New
Online Offline Errors
Mode Mode Detected
•
•
•
•
•
•
Switch kept online.
Errors mapped; switch kept online.
Errors not mapped; switch kept online.
Switch enters limited commands mode.
Errors mapped; switch kept online.
Errors not mapped; switch enters limited commands mode.
•
•
•
0
1-7
>7
0
1-7
>7
Switch kept online.
Errors not mapped; switch kept online.
Errors not mapped; switch kept online.
Switch enters limited commands mode.
Errors mapped; switch kept online.
Errors not mapped; switch enters limited commands mode.
•
•
•
0
1-7
>7
0
1-7
>7
Switch kept online.
Errors not mapped; switch kept online.
Errors not mapped; switch kept online.
Switch enters limited commands mode.
Errors mapped; switch kept online.
Errors not mapped; switch enters limited commands mode.
•
•
•
•
•
•
Advanced System Diagnostics and Troubleshooting Guide
Behavior
0
1-7
>7
0
1-7
>7
61
Diagnostics
Table 6: Auto-recovery memory scanning and memory mapping behavior (continued)
Platform
New
Online Offline Errors
Mode Mode Detected
BlackDiamond with
two MSM64i
modules; error on
master
•
•
•
BlackDiamond with
two MSM64i
modules; error on
slave
•
•
•
BlackDiamond with
two MSM64i
modules; errors on
both
•
•
•
BlackDiamond 6816
MSM64i modules in
slots C and D
•
•
•
Alpine and
BlackDiamond “i”
series I/O modules
Behavior
•
•
•
0
1-7
>7
0
1-7
>7
MSM64i kept online.
Errors mapped; MSM64i kept online.
Errors not mapped; MSM64i kept online.
Master MSM64i fails over.
Errors mapped; MSM64i kept online.
Errors not mapped; master MSM64i fails over.
•
•
•
0
1-7
>7
0
1-7
>7
MSM64i kept online.
Errors mapped; MSM64i kept online.
Errors not mapped; MSM64i kept online.
Slave MSM64i taken offline.
Errors mapped; MSM64i kept online.
Errors not mapped; slave MSM64i taken offline.
•
•
•
0
1-7
>7
0
1-7
>7
Both kept online.
Errors mapped; both kept online.
Errors not mapped; both kept online.
Both enter limited commands mode.
Errors mapped; both kept online.
Errors not mapped; both enter limited commands mode.
•
•
•
0
1-7
>7
0
1-7
>7
MSM64i kept online.
Errors mapped; MSM64i kept online.
Errors not mapped; MSM64i kept online.
MSM64i taken offline.
Errors mapped; MSM64i kept online.
Errors not mapped; MSM64i taken offline.
•
•
•
0
1-7
>7
0
1-7
>7
Module kept online.
Errors mapped; module kept online.
Errors not mapped; module kept online.
Module taken offline.
Errors mapped; module kept online.
Errors not mapped; module taken offline.
•
•
•
Table 7 describes the behavior of the switch if you run diagnostics manually on “i” series switches using
the run diagnostics CLI command with the normal option. The behavior differs based on the
hardware configuration, the mode selected (online or offline) using the configure sys-health-check
CLI command, and the number of errors to be detected.
Table 7: Manual diagnostics memory scanning and memory mapping behavior, normal
Platform
Alpine
New
Online Offline Errors
Mode Mode Detected
•
•
•
•
•
•
62
0
1-7
>7
0
1-7
>7
Behavior
Switch kept online.
Errors mapped; switch kept online.
Errors not mapped; switch kept online.
Switch kept online.
Errors mapped; switch kept online.
Errors not mapped; switch enters limited commands mode.
Advanced System Diagnostics and Troubleshooting Guide
Automatic Packet Memory Scan (via sys-health-check)
Table 7: Manual diagnostics memory scanning and memory mapping behavior, normal (continued)
Platform
Summit “i” series
New
Online Offline Errors
Mode Mode Detected
•
•
•
BlackDiamond with
one MSM64i (or
slave MSM64i is
offline)
•
•
•
BlackDiamond with
two MSM64i
modules; error on
master
•
•
•
BlackDiamond with
two MSM64i
modules; error on
slave
•
•
•
BlackDiamond 6816
MSM64i modules in
slots C and D
•
•
•
Alpine and
BlackDiamond “i”
series I/O modules
Behavior
•
•
•
0
1-7
>7
0
1-7
>7
Switch kept online.
Errors mapped; switch kept online.
Errors not mapped; switch kept online.
Switch kept online.
Errors mapped; switch kept online.
Errors not mapped; switch enters limited commands mode.
•
•
•
0
1-7
>7
0
1-7
>7
Switch kept online.
Errors mapped; switch kept online.
Errors not mapped; switch kept online.
Switch kept online.
Errors mapped; switch kept online.
Errors not mapped; switch enters limited commands mode.
•
•
•
0
1-7
>7
0
1-7
>7
MSM64i kept online.
Errors mapped; MSM64i kept online.
Errors not mapped; MSM64i kept online.
Master MSM64i kept online.
Errors mapped; MSM64i kept online.
Errors not mapped; master MSM64i fails over.
•
•
•
0
1-7
>7
0
1-7
>7
MSM64i kept online.
Errors mapped; MSM64i kept online.
Errors not mapped; MSM64i kept online.
MSM64i kept online.
Errors mapped; MSM64i kept online.
Errors not mapped; slave MSM64i enters limited commands
mode.
•
•
•
0
1-7
>7
0
1-7
>7
MSM64i kept online.
Errors mapped; MSM64i kept online.
Errors not mapped; MSM64i kept online.
MSM64i kept online.
Errors mapped; MSM64i kept online.
Errors not mapped; MSM64i taken offline.
•
•
•
0
1-7
>7
0
1-7
>7
Module kept online.
Errors mapped; module kept online.
Errors not mapped; module kept online.
Module kept online.
Errors mapped; module kept online.
Errors not mapped; module taken offline.
•
•
•
Table 8 describes the behavior of the switch if you run diagnostics manually on “i” series switches using
the run diagnostics CLI command with the extended option. The behavior differs based on the
hardware configuration and whether errors are detected (the mode selected has no effect).
Table 8: Manual diagnostics memory scanning and memory mapping behavior, extended
Platform
Errors Detected?
Behavior
Alpine
Yes
No
Switch enters limited commands mode.
Switch kept online.
Summit “i” series
Yes
No
Switch enters limited commands mode.
Switch kept online.
Advanced System Diagnostics and Troubleshooting Guide
63
Diagnostics
Table 8: Manual diagnostics memory scanning and memory mapping behavior, extended (continued)
Platform
Errors Detected?
Behavior
BlackDiamond with one MSM64i
(or slave MSM64i is offline)
Yes
No
Switch enters limited commands mode.
Switch kept online.
BlackDiamond with two MSM64i
modules; errors on master
Yes
No
Master MSM64i fails over.
MSM64i kept online.
BlackDiamond with two MSM64i
modules; errors on slave
Yes
No
MSM64i taken offline.
MSM64i kept online.
BlackDiamond 6816 MSM64i
modules in slots C and D
Yes
No
Module taken offline.
Module kept online.
Alpine and BlackDiamond
“i”-series I/O modules
Yes
No
Module taken offline.
Module kept online.
Limited Operation Mode
A switch enters limited operation mode when some system health check action prevents it from
booting. In limited operation mode, all tasks are suspended, I/O modules are powered down, and a
limited set of commands are available for troubleshooting or corrective action. Both manual and
automatic diagnostics results can put the switch into limited operation mode.
In limited operation mode, only the CPU, NVRAM, management port, console port, a limited set of
system tasks, and a limited subset of CLI commands are active.
Ports are powered down so that links to adjacent devices do not come up. The switch fabric is not
operational. Limited operation mode allows diagnostic work to be done on failed devices while
redundant backup devices continue to operate.
For more information about limited operation mode, see Appendix A, “Limited Operation Mode and
Minimal Operation Mode.”
Effects of Running Memory Scanning on “i” Series Switches
The packet memory scan is an invasive diagnostic. The impact of the packet memory scan depends on
the “i” series switch type and—in the case of the BlackDiamond switch—whether the BlackDiamond is
equipped with a single MSM or redundant MSMs.
Summit, Alpine, or BlackDiamond with a Single MSM
Summit, Alpine, and single-MSM BlackDiamond systems are taken down during the time the packet
memory scan is running.
BlackDiamond System with Two MSMs
During the scanning period, the module is taken offline. Expect a minimum offline time of 90 seconds.
Up to eight correctable single-bit errors are corrected, with minimal loss to the total memory buffers.
In extremely rare cases, non-correctable errors are detected by memory scanning. In these
circumstances, the condition is noted, but no corrective action is possible. When operating in the
manual mode of memory scanning, the module is returned to online service after all possible corrective
actions have been taken.
64
Advanced System Diagnostics and Troubleshooting Guide
Automatic Packet Memory Scan (via sys-health-check)
During the memory scan, the CPU utilization is high and mostly dedicated to executing the
diagnostics—as is normal for running any diagnostic on the modules. During this time, other network
activities where this system is expected to be a timely participant could be adversely affected, for
example, in networks making use of STP and OSPF.
The alarm-level option of the global system health check facility does not attempt to diagnose a
suspected module; instead, it simply logs a message at a specified level.
The auto-recovery option does attempt to diagnose and recover a failed module a configured number of
times. You should plan carefully before you use this command option. If you enable the system health
check facility on the switch and configure the auto-recovery option to use the offline auto-recovery
action, once a module failure is suspected, the system removes the module from service and performs
extended diagnostics. If the number of auto-recovery attempts exceeds the configured threshold, the
system removes the module from service. The module is permanently marked “down,” is left in a
non-operational state, and cannot be used in a system running ExtremeWare 6.2.2 or later. A log
message indicating this will be posted to the system log.
NOTE
Keep in mind that the behavior described above is configurable by the user, and that you can enable
the system health check facility on the switch and configure the auto-recovery option to use the online
auto-recovery action, which will keep a suspect module online regardless of the number of errors
detected.
Example log messages for modules taken offline:
01/31/2005 01:16.40 <CRIT:SYST> Sys-health-check [ACTION] (PBUS checksum)
(CARD_HWFAIL_PBUS_CHKSUM_EDP_ERROR) slot 3
01/31/2005 01:16.40 <INFO:SYST> Card in slot 1 is off line
01/31/2005 01:16.40 <INFO:SYST> card.c 2035: Set card 1 to Non-operational
01/31/2005 01:16.40 <INFO:SYST> Card in slot 2 is off line
01/31/2005 01:16.44 <INFO:SYST> card.c 2035: Set card 2 to Non-operational
01/31/2005 01:16.44 <INFO:SYST> Card in slot 3 is off line
01/31/2005 01:16.46 <INFO:SYST> card.c 2035: Set card 3 to Non-operational
01/31/2005 01:16.46 <INFO:SYST> Card in slot 4 is off line
01/31/2005 01:16.46 <INFO:SYST> card.c 2035: Set card 4 to Non-operational
Advanced System Diagnostics and Troubleshooting Guide
65
Diagnostics
Interpreting Memory Scanning Results
If single-bit permanent errors are detected on an “i” series switch during the memory scanning process,
these errors will be mapped out of the general memory map with only a minimal loss to the total
available memory on the system.
Example show diagnostics messages for memory scanning:
-----------------------------------------------------------------------Diagnostic Test Result run on Thu May 23 14:24:44 2005
-----------------------------------------------------------------------Slot
:
B
-----------------------------------------------------------------------CPU System
|
Passed
-----------------------------------------------------------------------Registers Test |
Passed
-----------------------------------------------------------------------Memory Test
Packet memory test Passed
NOTICE: Packet memory test found 2 error(s) that
have been successfully remapped
|
Passed
-----------------------------------------------------------------------System Test
Passed
------------------------------------------------------------------------
-----------------------------------------------------------------------Packet memory defect info for card MSM-B
-----------------------------------------------------------------------Num of defects = 2, num of recoverable defects = 2
Defect information:
Defect entry 1
recoverable: Yes
mem ID = 4
bit position = 4
address = 0x2d2
Defect entry 2
recoverable: Yes
mem ID = 0
bit position = 8
address = 0x8ca0
------------------------------------------------------------------------
66
Advanced System Diagnostics and Troubleshooting Guide
Per-Slot Packet Memory Scan on BlackDiamond Switches
Per-Slot Packet Memory Scan on BlackDiamond
Switches
While the system health check auto-recovery mode is effective at recovering from suspected failures, it
does not provide the depth of control over recovery options that many network administrators require.
The per-slot packet memory scan capability on BlackDiamond switches gives administrators the ability
to set the recovery behavior for each module—an important distinction when only certain modules can
be taken offline, while others must remain online no matter what the error condition.
NOTE
This capability is available only on BlackDiamond switches.
You can scan and check the health of individual BlackDiamond modules rather than the entire system
by configuring packet memory scanning on a per slot basis. When you have the system health check
facility configured for auto-recovery and you configure packet memory scanning on a BlackDiamond
slot, you can define the behavior to be applied to the module in that slot when an error is detected. By
default, packet memory scanning on a per slot basis is disabled.
Related Commands
configure packet-mem-scan-recovery-mode [offline | online] slot [msm-a | msm-b | <slot number>]
unconfigure packet-mem-scan-recovery-mode slot [msm-a | msm-b | <slot number>]
show packet-mem-scan-recovery-mode
Configuring the Packet Memory Scan Recovery Mode
To configure packet memory scanning on a BlackDiamond module, use this command:
configure packet-mem-scan-recovery-mode [offline | online] slot [msm-a | msm-b | <slot number>]
where:
offline
Specifies that a module is to be taken offline and kept offline when one of these
conditions is true:
•
More than eight defected are detected.
•
No new defects were found by the memory scanning and mapping process.
•
The same checksum errors are again detected by the system health checker.
online
Specifies that a faulty module is to be kept online regardless of any errors detected.
msm-a
Specifies the MSM installed in slot A.
msm-b
Specifies the MSM installed in slot B.
slot number
Specifies the module installed in a particular slot.
NOTE
The setting values for this command override the settings in the global system health check
auto-recovery configuration. If you have the system health check alarm-level option configured, the
per-slot packet memory scanning configuration is ignored. For more information about the system health
check facility, see “System (CPU and Backplane) Health Check” on page 70.
Advanced System Diagnostics and Troubleshooting Guide
67
Diagnostics
To disable packet memory scanning on a BlackDiamond module and return to the behavior configured
for the global system health check facility, use this command:
unconfigure packet-mem-scan-recovery-mode slot [msm-a | msm-b | <slot number>]
To view the recovery mode configuration for BlackDiamond slots that have per-slot packet memory
scanning enabled, use this command:
show packet-mem-scan-recovery-mode
which displays the following information:
• Global settings for the system health check facility
• Auto-recovery settings for slots that have per-slot packet memory scanning enabled
Here is an example of output from this command:
Global sys-health-check ‘online’ setting is ONLINE
slot 3: AUTORECOVERY MODE is OFFLINE
MSM-B: AUTORECOVERY MODE is ONLINE
# NOTE Global setting is always online for sys-health-check alarm-level
configurations. It is only offline when ‘sys-health-check auto-recovery <#> offline’
is configured.
System Impact of Per-Slot Packet Memory Scanning
System impact depends on the command option selected (offline vs. online) and the modules in service.
Choosing offline causes failed modules to be removed from service. This action triggers recovery
protocols both within the system housing the modules and within attached devices. If the disabled
module is an MSM64i and is the master, the system will reboot, causing the slave MSM to assume the
role of master MSM. If the MSM is an MSM3 and is the master, a failure causes a hitless failover to the
slave MSM3. As a consequence, MSM-3 and redundant line modules are great candidates for the offline
option.
Choosing online keeps the module in service no matter how many errors are detected, causing
communication issues within the system, as well as affecting or corrupting traffic traversing the switch.
You should take great care to ensure that a module in this state is identified and replaced as soon as
possible.
Network Impact of Per-Slot Packet Memory Scanning
Keep in mind that the offline option specifies that a module is to be taken offline and kept offline
when one of these conditions is true:
• More than eight defected are detected.
• Three consecutive checksum errors were detected by the system health checker, but no new defects
were found by the memory scanning and mapping process.
• After defects were detected and mapped out, the same checksum errors are again detected by the
system health checker.
Encountering one of these conditions might cause different reactions, depending on the type of module
involved. Line modules will trigger applicable recovery mechanisms for all attached devices. MSM-64i
68
Advanced System Diagnostics and Troubleshooting Guide
Per-Slot Packet Memory Scan on BlackDiamond Switches
modules will trigger a reboot if the failed module is the master MSM. A failed MSM-64i in the slave slot
is simply removed from service.
In general, network redundancy protocols will work to recover the network. The impact on the network
depends on the network topology and configuration (for example, OSPF ECMP versus a large STP
network on a single domain).
In an OSPF network, for example, after the shutdown/reboot is initiated, the adjacent OSPF routers will
drop routes to the faltering switch. Very little traffic loss should occur during the network
reconvergence, because traffic is simply routed around the affected switch via pre-learned routes.
Because of this quick reconvergence factor, the reboot triggering a second reconvergence might be
absorbed as long as small network outages are acceptable. If no amount of loss is acceptable, the
shutdown option should be selected, so that a maintenance window can be scheduled to reinsert the
system.
As an example of impact in an STP network, the STP network will detect the outage and trigger a
spanning tree reconvergence. The shutdown option keeps the system out of service, so no second
reconvergence will occur, keeping service outages to a minimum. This redundancy protocol is designed
to be slow and methodical to ensure that no loops exist in the network. While this protocol works very
well, administrators might wish to reinsert the system during a scheduled maintenance window. If the
reboot option is selected, once the system has recovered, a second spanning tree reconvergence will be
triggered and connectivity will be restored upon completion.
Advanced System Diagnostics and Troubleshooting Guide
69
Diagnostics
System (CPU and Backplane) Health Check
The purpose of the system health check feature is to ensure that communication between the CPU on
the management switch module (MSM) and all I/O cards within the chassis is functioning properly.
NOTE
The system health check feature is supported only on “i” series Summit, Alpine, and BlackDiamond
switches.
The system health checking cycle consists of two parts:
• CPU health check
• Backplane health check (BlackDiamond platform only)
These health checks detect data-path packet errors by automatically checking the end-to-end data path
through the switch by periodically sending packets and then checking the integrity of those packets.
They take automatic action when errors are found. All error messages are logged in the system log and
can also be reviewed using the displayed output of CLI show commands. These health checks are
enabled by default, run in the background, and are non-invasive.
Health Check Packet Types
The CPU health check has five types of diagnostic packets, each consisting of 1024 bytes. The CPU
health check packets are generated by the CPU on the I/O slots and sent back to the CPU through the
CPU packet path.
The backplane health check packet is a 384-byte packet generated by the CPU on the MSM and sent
across the chassis backplane to each backplane link.
Backplane Health Check States
The system health check performs its diagnostic tasks according to the following states:
• INITIALIZATION—Health check functionality is initialized after the boot cycle is completed.
• SEND—The CPU sends 10 successive 384-byte packets to each backplane link on an I/O module in
the chassis.
• WAIT—The CPU waits 5 seconds for each backplane diagnostic test and 3 seconds for each CPU
diagnostic test before performing a check on the packets that were sent.
• CHECK—A packet integrity test is performed on all of the health check packets for an I/O module
to determine whether each packet was successfully sent across the backplane without error or loss. If
five health check packets are lost or errored, the sequence cycles back to the SEND state and begins
again.
The health check feature is run three times on an I/O module. If the health check fails three times,
the CPU generates a failure message.
• SNC—If all health check packets on an I/O module are received and pass the integrity check, the
test sequence cycles back to the SEND state and begins on the next I/O module.
70
Advanced System Diagnostics and Troubleshooting Guide
System (CPU and Backplane) Health Check
Related Commands
enable sys-health-check
disable sys-health-check
configure sys-health-check alarm-level [card-down | default | log | system-down |
traps]
configure sys-health-check auto-recovery <number of tries> [offline | online] (BlackDiamond)
configure sys-health-check alarm-level auto-recovery [offline | online] (Alpine or Summit)
Health Check Functionality
The system health check feature can be configured to operate in one of two mutually-exclusive modes:
• alarm-level response action
• auto-recovery response action
The first mode—alarm-level—is a user-configurable log level; the second—auto-recovery—automatically
attempts to diagnose the suspect module and restore it to operation. The choice between these two
modes normally depends on the network topology, recovery mechanisms implemented, and acceptable
service outage windows.
These modes are configured by two separate CLI commands, described below.
Alarm-Level Response Action
To configure the switch to respond to a failed health check based on alarm-level, use this command:
configure sys-health-check alarm-level [card-down | log | system-down | traps]
where:
card-down
(BlackDiamond only.) Posts a CRIT message to the log, sends an SNMP trap, and
turns off the BlackDiamond module.
default
Resets the alarm level to log.
log
Posts a CRIT message to the local system log, NVRAM, and to a remote syslog (if
configured).
system-down
Posts a CRIT message to the log, sends an SNMP trap, and powers the system down
(reboots in limited function mode).
traps
Posts a CRIT message to the log and sends an SNMP trap to the configured trap
receivers.
Auto-Recovery Response Action
The method for configuring auto-recovery response action depends on the switch platform
(BlackDiamond vs. Alpine or Summit).
BlackDiamond Switches. To configure the switch to respond to a failed health check by attempting to
perform auto-recovery (packet memory scanning and mapping), use this command:
configure sys-health-check auto-recovery <number of tries> [offline | online]
Advanced System Diagnostics and Troubleshooting Guide
71
Diagnostics
where:
number of tries
Specifies the number of times that the health checker attempts to auto-recover a faulty
module. The range is from 0 to 255 times. The default is 3 times.
offline
Specifies that a faulty module is to be taken offline and kept offline if one of the
following conditions is true:
online
•
More than eight defects are detected.
•
No new defects were found by the memory scanning and mapping process.
•
The same checksum errors are again detected by the system health checker.
Specifies that a faulty module is to be kept online, regardless of memory scanning or
memory mapping errors.
Alpine or Summit “i” series Switches. To configure the switch to respond to a failed health check by
attempting to perform auto-recovery (packet memory scanning and mapping), use this command:
configure sys-health-check alarm-level auto-recovery [offline | online]
When system health checks fail at a specified frequency, packet memory scanning and mapping is
invoked automatically. Once auto-recovery mode is configured, an automated background polling task
checks every 20 seconds to determine whether any fabric checksums have occurred. To invoke the
automatic memory scanning feature, three consecutive samples for a module must be corrupted. When
the automatic memory scanning feature has been invoked—regardless of platform type or number of
errors, the device is taken offline for an initial period so that the memory scan can be performed.
Backplane Health Check
On BlackDiamond switches, the backplane health check routine in the system health checker tests the
communication path between the CPU subsystem on the MSM and all I/O modules in the chassis for
data-path packet errors. It does this by causing the CPU subsystem on the MSM to generate a backplane
health check packet that is sent across the chassis backplane to each backplane I/O module link.
Viewing Backplane Health Check Results—show log Command
The backplane health check uses the same system log reporting mechanism as checksum validation, so
you can use the show log command to view health check status information. Log messages take the
following form (date, time, and severity level have been omitted to focus on the key information):
Sys-health-check [type] checksum error on <slot> prev= <0xm> cur= <0xn>
where type indicates the health check test packet type (INT, EXT, CPU), and slot indicates the probable
location of the error, from among the following:
• M-BRD—The main board of a Summit system.
• BPLANE—The backplane of an Alpine system.
• MSM-A, MSM-B, MSM-C, or MSM-D—The MSM modules of a BlackDiamond system.
• Slot n—The slot number for an I/O module in a BlackDiamond system.
When you have observed log messages indicating missed or corrupted health check packets, use the
show diagnostics command as the next source of information about health check failures.
72
Advanced System Diagnostics and Troubleshooting Guide
System (CPU and Backplane) Health Check
NOTE
Frequent corrupted packets indicate a failure that you need to address immediately.
Missed packets are also a problem, but you should consider the total number of missed packets as only
a general check of the health of the system. Small numbers (fewer than five) can generally be ignored,
as they can be caused by conditions where the CPU becomes too busy to receive the transmitted
packets properly, subsequently causing the missed packet count to increase.
Viewing Backplane Health Check Diagnostic Results—show diagnostics Command
The diagnostic results for the backplane health check are part of the output displayed by the
show diagnostics command.
Advanced System Diagnostics and Troubleshooting Guide
73
Diagnostics
Backplane Health Check Diagnostic Results—Example 1.
Example 1 shows the report from one MSM, MSM-A in a BlackDiamond 6808 switch. If two MSMs are
in the chassis, both MSM-A and MSM-B are reported.
MSM-A
Port
Port
Port
Port
Port
Port
Port
Port
Port
Port
Port
Port
Port
Port
Port
Port
Port
Port
Port
Port
Port
Port
Port
Port
Port
Port
Port
Port
Port
Port
Port
Port
1:
2:
3:
4:
5:
6:
7:
8:
9:
10:
11:
12:
13:
14:
15:
16:
17:
18:
19:
20:
21:
22:
23:
24:
25:
26:
27:
28:
29:
30:
31:
32:
Total Tx
6140
0
0
0
0
0
214020
214010
6140
0
0
0
0
0
214020
214010
6140
0
0
0
0
0
214020
214010
6140
0
0
0
0
0
214020
214010
Total Rv
6140
0
0
0
0
0
214020
214010
6140
0
0
0
0
0
214020
214010
6140
0
0
0
0
0
214020
214010
6140
0
0
0
0
0
214020
214010
Total miss
0
0
0
0
0
0
0
0
0
0
0
0
0
0
0
0
0
0
0
0
0
0
0
0
0
0
0
0
0
0
0
0
Error Pkt
0
0
0
0
0
0
0
0
0
0
0
0
0
0
0
0
0
0
0
0
0
0
0
0
0
0
0
0
0
0
0
0
Diag fail
0
0
0
0
0
0
0
0
0
0
0
0
0
0
0
0
0
0
0
0
0
0
0
0
0
0
0
0
0
0
0
0
Last fail time
where:
Total Tx
Lists the total number of health check packets transmitted by the CPU to an I/O module.
The statistics for any I/O module will always be zero, because I/O modules do not generate
health check packets (the switch sends health check packets from the MSM to the I/O
modules only, not in the reverse direction).
Total Rx
Lists the total number of health check packets received on an I/O module and counted by
the CPU. Again, this counter will always read zero for any I/O module.
Total miss
Lists the total number of missed health check packets for any I/O module. On the MSM, the
number reflected is shown under the backplane port number corresponding to a given I/O
module.
Error Pkt
Lists the total number of corrupted health check packets counted by the CPU on a given
backplane port.
Diag fail
Lists the total number of diagnostic packets that failed from the I/O module to the CPU.
Last fail time
Lists the date and time of the previous corrupted or missed health check packet.
74
Advanced System Diagnostics and Troubleshooting Guide
System (CPU and Backplane) Health Check
To clarify the relationship between MSM ports, the backplane links, and the I/O module slots shown in
Example 1, consider the following annotated adaptation of the example’s output (not actual command
output; for instructional purposes only):
MSM
Port
------Port 1:
Port 2:
Port 3:
Port 4:
Port 5:
Port 6:
Port 7:
Port 8:
Port 9:
Port 10:
Port 11:
Port 12:
Port 13:
Port 14:
Port 15:
Port 16:
Port 17:
Port 18:
Port 19:
Port 20:
Port 21:
Port 22:
Port 23:
Port 24:
Port 25:
Port 26:
Port 27:
Port 28:
Port 29:
Port 30:
Port 31:
Port 32:
Channel
------(chan0,
(chan0,
(chan0,
(chan0,
(chan0,
(chan0,
(chan0,
(chan0,
(chan1,
(chan1,
(chan1,
(chan1,
(chan1,
(chan1,
(chan1,
(chan1,
(chan2,
(chan2,
(chan2,
(chan2,
(chan2,
(chan2,
(chan2,
(chan2,
(chan3,
(chan3,
(chan3,
(chan3,
(chan3,
(chan3,
(chan3,
(chan3,
Module
Slot
-----slot1)
slot2)
slot3)
slot4)
slot5)
slot6)
slot7)
slot8)
slot1)
slot2)
slot3)
slot4)
slot5)
slot6)
slot7)
slot8)
slot1)
slot2)
slot3)
slot4)
slot5)
slot6)
slot7)
slot8)
slot1)
slot2)
slot3)
slot4)
slot5)
slot6)
slot7)
slot8)
6140
0
0
0
0
0
214020
214010
6140
0
0
0
0
0
214020
214010
6140
0
0
0
0
0
214020
214010
6140
0
0
0
0
0
214020
214010
6140...
0...
0...
0...
0...
0...
214020...
214010...
6140...
0...
0...
0...
0...
0...
214020...
214010...
6140...
0...
0...
0...
0...
0...
214020...
214010...
6140...
0...
0...
0...
0...
0...
214020...
214010...
The report in Example 1 shows 32 ports from the MSM switch fabric to the backplane; four channels;
four MSM ports to each BlackDiamond 6808 I/O module slot.
In this example, chassis slots 1, 7, and 8 are populated with I/O modules capable of responding to the
backplane health check packets from the system health checker. Tx and Rv packet values indicate the
presence of a module, so—for example—MSM ports 1, 9, 17, and 25 are the MSM ports to I/O module
slot 1, MSM ports 7, 15, 23, and 31 are the MSM ports to I/O module slot 7, and MSM ports 8, 16, 24,
and 32 are the MSM ports to I/O module slot 8.
MSM ports 1 through 8 are the first channel (channel0) to each I/O module slot, MSM ports 9 through
16 are the second channel (channel1) to each I/O module slot, and so forth. In this example, no failures
appear for any of these channels.
In this example, I/O module slot 1 has fewer reported diagnostics packets sent because it recently had
extended diagnostics run against it, which reset the counter.
Advanced System Diagnostics and Troubleshooting Guide
75
Diagnostics
Backplane Health Check Diagnostic Results—Example 2. Example 2 shows a report for MSM-A
again, but this time with missed and corrupted packets on different channels going to more than one
I/O module slot.
In example 2, the missed packets and corrupted packets on channels going to more than one I/O
module (slots 1, 4, and 7 in this example) indicate what is most likely a problem with MSM-A, itself.
Port
Port
Port
Port
Port
Port
Port
Port
Port
Port
Port
Port
Port
Port
Port
Port
Port
Port
Port
Port
Port
Port
Port
Port
Port
Port
Port
Port
Port
Port
Port
Port
76
1:
2:
3:
4:
5:
6:
7:
8:
9:
10:
11:
12:
13:
14:
15:
16:
17:
18:
19:
20:
21:
22:
23:
24:
25:
26:
27:
28:
29:
30:
31:
32:
Total Tx
6140
0
0
214020
0
0
214020
214010
6140
0
0
0
0
0
214020
214010
6140
0
0
0
0
0
214020
214010
6140
0
0
0
0
0
214020
214010
Total Rv
5939
0
0
214020
0
0
214020
214010
6140
0
0
0
0
0
214020
214010
6140
0
0
0
0
0
214020
214010
6140
0
0
0
0
0
214020
214010
Total miss
201
0
0
0
0
0
0
0
0
0
0
0
0
0
0
0
0
0
0
0
0
0
0
0
0
0
0
0
0
0
0
0
Error Pkt
0
0
0
38882
0
0
1288
0
0
0
0
0
0
0
0
0
0
0
0
0
0
0
0
0
0
0
0
0
0
0
0
0
Diag fail
0
0
0
0
0
0
0
0
0
0
0
0
0
0
0
0
0
0
0
0
0
0
0
0
0
0
0
0
0
0
0
0
Last fail time
03/08/2005 05:28:46
03/08/2005 05:28:51
03/08/2003 05:28:50
Advanced System Diagnostics and Troubleshooting Guide
System (CPU and Backplane) Health Check
Backplane Health Check Diagnostic Results—Example 3. Example 3 shows a report for MSM-A
again, but with missed and corrupted packets on channels going to the same slot.
In example 3, the corrupted packets on channels going to the same I/O module (slot 7 in this example)
indicate what is most likely a problem with the I/O module in slot 7.
Port
Port
Port
Port
Port
Port
Port
Port
Port
Port
Port
Port
Port
Port
Port
Port
Port
Port
Port
Port
Port
Port
Port
Port
Port
Port
Port
Port
Port
Port
Port
Port
1:
2:
3:
4:
5:
6:
7:
8:
9:
10:
11:
12:
13:
14:
15:
16:
17:
18:
19:
20:
21:
22:
23:
24:
25:
26:
27:
28:
29:
30:
31:
32:
Total Tx
6140
0
0
0
0
0
214020
214010
6140
0
0
0
0
0
214020
214010
6140
0
0
0
0
0
214020
214010
6140
0
0
0
0
0
214020
214010
Total Rv
6140
0
0
0
0
0
214020
214010
6140
0
0
0
0
0
214020
214010
6140
0
0
0
0
0
214020
214010
6140
0
0
0
0
0
214020
214010
Advanced System Diagnostics and Troubleshooting Guide
Total miss
0
0
0
0
0
0
0
0
0
0
0
0
0
0
0
0
0
0
0
0
0
0
0
0
0
0
0
0
0
0
0
0
Error Pkt
0
0
0
0
0
0
1288
0
0
0
0
0
0
0
38882
0
0
0
0
0
0
0
2982
0
0
0
0
0
0
0
0
0
Diag fail
0
0
0
0
0
0
0
0
0
0
0
0
0
0
0
0
0
0
0
0
0
0
0
0
0
0
0
0
0
0
0
0
Last fail time
03/08/2005 05:28:51
03/08/2005 05:28:50
03/08/2003 05:28:46
77
Diagnostics
Backplane Health Check Diagnostic Results—Example 4. Example 4 shows a report for MSM-A
again, but with small numbers of missed packets on channels going to different slots.
In example 4, the small numbers of missed packets (fewer than five) indicate what is most likely not a
serious hardware problem. Either the CPU was too busy during that period and missed a round of
tests, or the hardware experienced an intermittent error. That the CPU is too busy to run the tests might
indicate other network problems that might be investigated if the situation persists.
Port
Port
Port
Port
Port
Port
Port
Port
Port
Port
Port
Port
Port
Port
Port
Port
Port
Port
Port
Port
Port
Port
Port
Port
Port
Port
Port
Port
Port
Port
Port
Port
1:
2:
3:
4:
5:
6:
7:
8:
9:
10:
11:
12:
13:
14:
15:
16:
17:
18:
19:
20:
21:
22:
23:
24:
25:
26:
27:
28:
29:
30:
31:
32:
Total Tx
6140
0
0
0
0
0
214020
214010
6140
0
0
0
0
0
214020
214010
6140
0
0
0
0
0
214020
214010
6140
0
0
0
0
0
214020
214010
Total Rv
6137
0
0
0
0
0
214018
214007
6137
0
0
0
0
0
214018
214007
6137
0
0
0
0
0
214018
214007
6137
0
0
0
0
0
214018
214007
Total miss
3
0
0
0
0
0
2
3
3
0
0
0
0
0
2
3
3
0
0
0
0
0
2
3
3
0
0
0
0
0
2
3
Error Pkt
0
0
0
0
0
0
0
0
0
0
0
0
0
0
0
0
0
0
0
0
0
0
0
0
0
0
0
0
0
0
0
0
Diag fail
0
0
0
0
0
0
0
0
0
0
0
0
0
0
0
0
0
0
0
0
0
0
0
0
0
0
0
0
0
0
0
0
Last fail time
03/08/2005 05:28:51
03/08/2005 05:28:51
03/08/2005 05:28:51
03/08/2005 05:28:51
03/08/2005 05:28:51
03/08/2005 05:28:51
03/08/2005 05:28:51
03/08/2005 05:28:51
03/08/2005 05:28:51
03/08/2005 05:28:51
03/08/2005 05:28:51
03/08/2005 05:28:51
Analyzing the Results
• In the output of the show diagnostics command:
— Small counts of missed packets might mean nothing more than that the CPU was busy and a
packet was dropped; excessive numbers of missed packets indicate a systematic problem that
must be isolated and resolved.
— Corrupted packets might occur occasionally; excessive numbers of corrupted packets indicate a
systematic problem that must be isolated and resolved.
• Backplane health check failures might indicate a faulty transceiver or MAC device on one of the
MSMs or on an I/O module, but might also be the result of other problems.
78
Advanced System Diagnostics and Troubleshooting Guide
System (CPU and Backplane) Health Check
• If a health check checksum error message appears in the log, and the output of the
show diagnostics command shows excessive backplane health check error counts, you can usually
use those two sources of information to determine the location of the problem.
• If backplane health check counts for missing or corrupted packets are increasing, but the log shows
no checksum error messages, the problem is probably a low-risk, transient problem—possibly a busy
CPU.
• If the log shows checksum error messages and the backplane health check counts for missing or
corrupted packets are increasing:
— Control data is probably being disrupted.
— The combination of the channel/slot information for the health check counters in the output of
the show diagnostics command and the checksum message information in the log can help
isolate the faulty module.
— Compare the backplane health check results to the results of the CPU health check. Because
backplane health check packets are sent out across the backplane data bus, but read back across
the same bus used by the CPU health check, packet errors might be occurring on the CPU control
path (slow path). In that case, user traffic might be largely unaffected, but protocol-level traffic
could be having problems.
• If the backplane health check shows no failures, but the log shows checksum error messages:
— If the checksum error messages occur infrequently, it might indicate a packet memory problem
that is being triggered sporadically; it might be a low-risk situation, but—if possible—you should
run the packet memory scan.
— If the checksum error messages occur frequently, user data is probably being affected; run the
packet memory scan as soon as possible.
CPU Health Check
The CPU health check routine in the system health checker tests the communication path between the
CPU and all I/O modules. The CPU health check uses five types of diagnostic packet. Those packets are
generated by the CPU on the I/O slots and sent back to the CPU through the CPU packet path.
Viewing CPU Health Check Results—show log Command
The CPU health check uses the same system log reporting mechanism as checksum validation, so you
can use the show log command to view health check status information.
Log messages take the following form (date, time, and severity level have been omitted to focus on the
key information):
Sys-health-check [type] checksum error on <slot> prev= <0xm> cur= <0xn>
where type indicates the health check test packet type (INT, EXT, CPU), and slot indicates the probable
location of the error, from among the following:
• M-BRD—The main board of a Summit system.
• BPLANE—The backplane of an Alpine system.
• MSM-A, MSM-B, MSM-C, or MSM-D—The MSM modules of a BlackDiamond system.
• Slot n—The slot number for an I/O module in a BlackDiamond system.
Advanced System Diagnostics and Troubleshooting Guide
79
Diagnostics
NOTE
Be aware that the slot information in the log message might be symptomatic of a problem occurring on
another module in the system rather than on the indicated module.
When you have observed log messages indicating missed or corrupted health check packets, use the
show diagnostics command as the next source of information about health check failures.
Viewing CPU Health Check Diagnostic Results—show diagnostics Command
The diagnostic results for the CPU health check are part of the output displayed by the
show diagnostics command.
CPU system health diag results
Total Tx
Total Rx
Slot 1 Type 0:
5315
5315
Type 1:
5315
5315
Type 2:
5315
5315
Type 3:
5315
5315
Type 4:
5315
5315
#
#
Slot 7 Type 0:
5315
5315
Type 1:
5315
5315
Type 2:
5315
5315
Type 3:
5315
5315
Type 4:
5315
5315
#
#
Slot 8 Type 0:
5314
5314
Type 1:
5314
5314
Type 2:
5314
5314
Type 3:
5314
5314
Type 4:
5314
5314
Total miss
0
0
0
0
0
Error Pkt
0
0
0
0
0
0
0
0
0
0
0
0
0
0
0
0
0
0
0
0
0
0
0
0
0
For each slot, the CPU health check sends five different CPU health check test patterns (Type 0 through
Type 4). Counts are maintained for transmitted, received, missed, and corrupted health check packets
for each I/O module in the switch. As in the backplane health check, small numbers of missed health
check packets are probably okay; large numbers of missed health check packets indicate a systematic
problem, such as an MSM control bus transceiver problem or other serious problem. Small numbers of
corrupted packets, appearing occasionally, are probably okay; large numbers of corrupted health check
packets indicate a systematic problem, such as an MSM control bus transceiver problem or other serious
problem.
Analyzing the CPU Health Check Results
• In the output of the show diagnostics command:
— Small counts of missed packets might mean nothing more than that the CPU was busy and a
packet was dropped; excessive numbers of missed packets indicate a systematic problem that
must be isolated and resolved.
— Corrupted packets might occur occasionally; excessive numbers of corrupted packets indicate a
systematic problem that must be isolated and resolved.
80
Advanced System Diagnostics and Troubleshooting Guide
System (CPU and Backplane) Health Check
• CPU health check failures might indicate a faulty transceiver on one of the MSMs, but might also
indicate other I/O control bus failures. Always use log messages in conjunction with the output of
the show diagnostics command.
• If a health check checksum error message appears in the log, and the output of the
show diagnostics command shows excessive backplane health check error counts, you can usually
use those two sources of information to determine the location of the problem.
• If backplane health check counts for missing or corrupted packets are increasing, but the log shows
no checksum error messages, the problem is probably a low-risk, transient problem—possibly a busy
CPU.
• If the log shows checksum error messages and the backplane health check counts for missing or
corrupted packets are increasing:
— Live data is probably being disrupted.
— The combination of the health check counters in the output of the show diagnostics command
and the checksum message information in the log can help isolate the faulty module.
— Examine which modules are reporting CPU health check counters in the output of the
show diagnostics command. If many modules are reporting errors, the MSM might be faulty; if
only one module is reporting errors, the I/O module is probably faulty.
• If the backplane health check shows no failures, but the log shows checksum error messages:
— If the checksum error messages occur infrequently, it might indicate a packet memory problem
that is being triggered sporadically; it might be a low-risk situation, but—if possible—you should
run the packet memory scan.
— If the checksum error messages occur frequently, user data is probably being affected; run the
packet memory scan as soon as possible.
Advanced System Diagnostics and Troubleshooting Guide
81
Diagnostics
Transceiver Diagnostics
The transceiver diagnostics test the integrity of the management bus transceivers used for
communication between the ASICs in the Inferno chipset and the CPU subsystem. (See Figure 10.)
These diagnostics write test patterns to specific ASIC registers, read the registers, then compare results,
looking for errors in the communication path.
NOTE
The transceiver diagnostics are intended for modular “i” series switches only.
Usage Guidelines
These diagnostics were introduced with ExtremeWare Version 6.2.2b108. They operate as a non-invasive
background process under the umbrella of the system health check, and are disabled by default.
These diagnostics offer configurable threshold and window values that trigger system health check
actions when excessive hard failures are detected.
Related Commands
enable transceiver-test [all | slot <slot number> {backplane}] (Alpine)
enable transceiver-test [all | slot <slot number> | msm-a | msm-b] (BlackDiamond)
disable transceiver-test
clear transceiver-test
configure transceiver-test failure-action [log | sys-health-check]
configure transceiver-test period <1-60>
configure transceiver-test threshold <1-8>
configure transceiver-test window <1-8>
unconfigure transceiver-test failure-action
unconfigure transceiver-test period
unconfigure transceiver-test threshold
unconfigure transceiver-test window
These commands are described in the sections that follow. The default settings are: disabled, log,
1 second, 3 errors in 8 windows.
Configuring the Transceiver Diagnostics
• To enable or disable the transceiver diagnostics on an Alpine system, use this command:
enable | disable transceiver-test [all | slot <slot number> {backplane}]]
• To enable or disable the transceiver diagnostics on a BlackDiamond system, use this command:
enable | disable transceiver-test [all | slot <slot number> | msm-a | msm-b]
• To configure how often the transceiver diagnostic test is run, use this command:
configure transceiver-test period <1-60>
where period specifies the delay, in seconds, between iterations of the test. The delay period is a
number in the range from 1 to 60 seconds. If you do not specify a value, the test uses the default of
1 second.
82
Advanced System Diagnostics and Troubleshooting Guide
Transceiver Diagnostics
To configure the transceiver diagnostic threshold and window values, use these commands:
• To configure the number of 20-second periods (windows) within which the configured number of
errors can occur, use this command:
configure transceiver-test window <1-8>
where window specifies the number of 20-second periods (windows) within which the configured
number of errors can occur. The window value is a number in the range from 1 to 8. If you do not
specify a value, the test uses the default of 8 windows.
NOTE
This configuration command provides a sliding observation window. For example, using the default
window value of 8, the diagnostic checks for errors within the eight previous 20-second windows.
• To configure the number of transceiver test errors the system-health-check accepts before taking
action, use this command:
configure transceiver-test threshold <1-8>
where threshold specifies the number of failures within the number of windows specified in the
configure transceiver-test window command. The threshold value is a number in the range
from 1 to 8. If you do not specify a value, the test uses the default of 3 errors.
NOTE
Extreme Networks recommends against changing the default transceiver test threshold value. The
default value of 3 errors is adequate for most networks.
• To configure the action the system health check takes when too many transceiver test failures are
detected within the specified transceiver test window, use this command:
configure transceiver-test failure-action [log | sys-health-check]
If you specify the log option, and no auto-recovery option was specified using the
configure sys-health-check command, the response to transceiver diagnostic failures is to log
one instance of the failure message.
If you specify the sys-health-check option, and an auto-recovery option was specified using the
configure sys-health-check command, the response to transceiver diagnostic failures is to take
whatever action the system health check is configured to perform.
System Impacts of the Transceiver Diagnostics
Because of the way the diagnostics operate, a negligible amount of system latency might occur. The
frequency and number of test messages is extremely small in comparison to the capacity of the
communication path being tested. Impact should only be experienced in switches with extremely high
bandwidth use, in which case, the test frequency may be reduced. Threshold windows can also be
configured to customize behavior to specific network environments.
Network Impact of the Transceiver Diagnostics
Impact on network traffic is negligible. There might be some impact if sys-health-check has been
selected and the configured threshold for the transceiver test is exceeded. The impact depends on the
way the system-health-check feature is configured.
Advanced System Diagnostics and Troubleshooting Guide
83
Diagnostics
Viewing Diagnostics Results
Use the following commands to view information related to the transceiver diagnostic test:
show log
show diagnostics
show switch
Example Log Messages for Transceiver Diagnostic Failures
• If the transceiver diagnostic test detects a failure, any of the following messages will appear in the
log one time. To determine the severity of the problem, use the show diagnostics command to
display diagnostics results and examine the transceiver diagnostic portion of the display.
Transceiver
Transceiver
Transceiver
Transceiver
Transceiver
Transceiver
Transceiver
Transceiver
ENET test failed on slot n
NVRAM test failed on slot n
FLASH test failed on slot n
UART test failed on slot n
SRAM test failed on slot n
MAC test failed on slot n
TWISTER test failed on slot n
QUAKE test failed on slot n
• The following log message indicates that a transceiver diagnostic test detected transceiver problems
on multiple modules, possibly caused by a failure on the module in the slot specified as slot n.
Diags detected n other i/o blade(s) with a transceiver problem. Problem may lie
on slot n
• The following message indicates that a transceiver diagnostic test failure has triggered the failure
response action configured using the configure sys-health-check command.
... Sys-health-check [ACTION] (hardware failure) (hardware failure type) slot n
Where hardware failure type can be any one of the following:
•
CARD_HWFAIL_ACL_TWISTER_TIMEOUT
•
CARD_HWFAIL_PKTCACHEPBUFFXFER_TWISTER_TIMEOUT
•
CARD_HWFAIL_FDB_QUAKE0_TIMEOUT
•
CARD_HWFAIL_FDB_QUAKE1_TIMEOUT
•
CARD_HWFAIL_FDB_COUNT_QUAKE0_TIMEOUT
•
CARD_HWFAIL_FDB_COUNT_QUAKE1_TIMEOUT
•
CARD_HWFAIL_OT_RAM_QUAKE0_TIMEOUT
•
CARD_HWFAIL_OT_RAM_QUAKE1_TIMEOUT
•
CARD_HWFAIL_QD_RAM_QUAKE0_TIMEOUT
•
CARD_HWFAIL_QD_RAM_QUAKE1_TIMEOUT
•
CARD_HWFAIL_SCHED_RAM_QUAKE0_TIMEOUT
•
CARD_HWFAIL_SCHED_RAM_QUAKE1_TIMEOUT
•
CARD_HWFAIL_AFC_STATUS_QUAKE0_TIMEOUT
•
CARD_HWFAIL_AFC_STATUS_QUAKE1_TIMEOUT
•
CARD_HWFAIL_SW2CPU_QUAKE0_TIMEOUT
•
CARD_HWFAIL_CPU_CNTRL_QUAKE0_TIMEOUT
•
CARD_HWFAIL_RR_DECODER_REG_TIMEOUT
84
Advanced System Diagnostics and Troubleshooting Guide
Transceiver Diagnostics
•
CARD_HWFAIL_RR_SCNTRL_REG_TIMEOUT
•
CARD_HWFAIL_BLIZZARD_REGOP_TIMEOUT
•
CARD_HWFAIL_BLIZZARD_SER_MGMT_REG_TIMEOUT
•
CARD_HWFAIL_BLIZZARD_STAT_CTRL_REG_TIMEOUT
•
CARD_HWFAIL_TSUNAMI_REGOP_TIMEOUT
•
CARD_HWFAIL_TSUNAMI_SER_MGMT_REG_TIMEOUT
•
CARD_HWFAIL_TSUNAMI_STAT_CTRL_REG_TIMEOUT
•
CARD_HWFAIL_BLADE_STATUS_REG_TIMEOUT
•
CARD_HWFAIL_BLADE_CONTROL_REG_TIMEOUT
•
CARD_HWFAIL_VLAN_LKUP_REG_TIMEOUT
•
CARD_HWFAIL_DIAG_FAILED
•
CARD_HWFAIL_DIAG_PMS_FAILED
•
CARD_HWFAIL_TRANCEIVER_TEST_FAILED
•
CARD_HWFAIL_SYNC_TEST_FAILED
Examples, show diagnostics Command
This section provides two examples of the results from the show diagnostics command. The first is
for a BlackDiamond system; the second is for an Alpine system.
Example—show diagnostics command (BlackDiamond System). The following example of the
show diagnostics command displays the results of the transceiver diagnostics for a BlackDiamond
system.
Transceiver system health diag result
Pass/Fail Counters are in HEX
Slot
CardType Cardstate
Test
Pass
----------- ------------------slot 1 G8Xi
Operational MAC
7613e
slot 1 G8Xi
Operational QUAKE
3b09f
slot 1 G8Xi
Operational TWISTER
3b09f
slot 2 Unknown
slot 3 Unknown
slot 4 Unknown
slot 5 Unknown
slot 6 Unknown
slot 7 Unknown
slot 8 F48Ti
Operational MAC
7613e
slot 8 F48Ti
Operational QUAKE
3b09f
slot 8 F48Ti
Operational TWISTER
3b0a0
MSM-A
CPU
Operational UART
3b0a7
MSM-A
CPU
Operational FLASH
3b0a7
MSM-A
CPU
Operational SRAM
3b0a7
MSM-A
CPU
Operational NVRAM
3b0a7
MSM-A
CPU
Operational ENET
3b0a7
MSM-A
FABRIC
Operational QUAKE
3b0a7
MSM-A
FABRIC
Operational TWISTER
3b0a7
MSM-B
SLAVE
Operational MAC
3b0a7
MSM-B
SLAVE
Operational QUAKE
3b0a7
MSM-B
SLAVE
Operational TWISTER
3b0a7
Advanced System Diagnostics and Troubleshooting Guide
Fail
---0
0
0
Time_last_fail
--------------
0
0
0
0
0
0
0
0
0
0
0
0
0
85
Diagnostics
Example—show diagnostics command (Alpine system). The following example of the
show diagnostics command displays the results of the transceiver diagnostics for an Alpine system.
Transceiver system health diag
Pass/Fail Counters are in HEX
Slot
CardType Cardstate
----------- --------slot 1 GM4X
Operational
slot 2 FM32T
Operational
slot 3 Unknown
slot 4 Unknown
BPLNE
SMMI
Operational
BPLNE
SMMI
Operational
BPLNE
SMMI
Operational
BPLNE
SMMI
Operational
BPLNE
SMMI
Operational
BPLNE
Basbrd
Operational
BPLNE
Basbrd
Operational
result
Test
---MAC
MAC
UART
FLASH
SRAM
NVRAM
ENET
QUAKE
TWISTER
Pass
-------443
443
Fail
---0
0
442
442
442
442
442
442
440
0
0
0
0
0
0
2
Time_last_fail
--------------
01/31/2003 05:28:50
Example—show diagnostics command (Alpine System). The following example of the
show diagnostics command displays the results of the transceiver diagnostics for an Alpine system.
Transceiver system health diag result
Pass/Fail Counters are in HEX
Slot
CardType Cardstate
Test
Pass
----------- ------------------slot 1 G8Xi
Operational MAC
7613e
slot 1 G8Xi
Operational QUAKE
3b09f
slot 1 G8Xi
Operational TWISTER
3b09f
slot 2 Unknown
slot 3 Unknown
slot 4 Unknown
slot 5 Unknown
slot 6 Unknown
slot 7 Unknown
slot 8 F48Ti
Operational MAC
7613e
slot 8 F48Ti
Operational QUAKE
3b09f
slot 8 F48Ti
Operational TWISTER
3b0a0
MSM-A
CPU
Operational UART
3b0a7
MSM-A
CPU
Operational FLASH
3b0a7
MSM-A
CPU
Operational SRAM
3b0a7
MSM-A
CPU
Operational NVRAM
3b0a7
MSM-A
CPU
Operational ENET
3b0a7
MSM-A
FABRIC
Operational QUAKE
3b0a7
MSM-A
FABRIC
Operational TWISTER
3b0a7
MSM-B
SLAVE
Operational MAC
3b0a7
MSM-B
SLAVE
Operational QUAKE
3b0a7
MSM-B
SLAVE
Operational TWISTER
3b0a7
Fail
---0
0
0
Time_last_fail
--------------
0
0
0
0
0
0
0
0
0
0
0
0
0
Example—show switch Command
The following is a display example for the show switch command.
Sysname:
...
86
BD6808
Advanced System Diagnostics and Troubleshooting Guide
Transceiver Diagnostics
License:
...
SysHealth Check:
Recovery Mode:
Transceiver Diag:
Fdb-Scan Diag:
System Watchdog:
...
Full L3 + Security
Enabled.
None
Enabled.
Enabled.
Enabled.
Alarm Level = Log
Failure action: sys-health-check
Failure action: sys-health-check
Transceiver Diagnostic Result Analysis
• If transceiver test error counters are incrementing, but there is no associated log message, the
problem is probably a transient problem. You should continue to monitor the counter.
• If transceiver test error counters are incrementing and there is a log message, you should perform
further analysis and diagnostics to isolate the problem.
Advanced System Diagnostics and Troubleshooting Guide
87
Diagnostics
FDB Scan
The FDB scan diagnostic test addresses the possibility of hardware FDB memory issues where FDB
hardware table entries do not match what was written to them by software.
The test is a non-invasive test that scans the entire FDB RAM memory pool on all switch fabrics,
compares existing software table entries against what is in the hardware table, and reports or otherwise
acts on any discrepancies it detects.
NOTE
The FDB scan diagnostic is supported only on “i” series Summit, Alpine, and BlackDiamond switches.
Usage Guidelines
The FDB scan diagnostic test can be run on demand by a user through the enable fdb-scan CLI
command, or it can be configured to run as a background process in the system health checker.
You can scan the FDB on a stand-alone switch, or scan on a slot-by-slot or backplane basis on a
modular switch. Using the enable fdb-scan command is independent of, and does not affect, the
system health check configuration.
Depending on which version of ExtremeWare you are using, the FDB scan diagnostic is either enabled
by default or disabled by default. For ExtremeWare 6.2.2b108, the default for the FDB scan is enabled.
For ExtremeWare 6.2.2b134 or later, the default for the FDB scan diagnostic is disabled.
If you load your saved ExtremeWare 6.2.2b108 configurations on a switch with ExtremeWare 6.2.2b134
or later, the FDB scan diagnostic is enabled. If you want the FDB scanning feature disabled, you must
manually disable FDB scanning.
To determine whether you have FDB scanning enabled and what failure action the switch will take in
the event of an error, use the show switch command.
For empty memory locations, data is written to those sites and then read back, checking for consistent
values. Inconsistency between writing and reading indicates a corrupt bit.
Used memory locations are compared against data stored in the software tables. If the comparison is
inconsistent, the bit is deemed faulty. Upon detecting a faulty bit of memory, the test function maps out
the bit so that it is not used in future forwarding decisions. Table entries that require extensive
rebuilding are marked as suspect.
If you enable the FDB scan diagnostic and the system health checker, a section of the FDB memory on
each module’s switching fabric undergoes a non-invasive check that compares it to the software copy of
the FDB. If the diagnostic detects a suspect entry, the system health checker takes one of the following
actions:
• If the suspect entry is not in use: Remap around it.
• If the suspect entry is in use, but can be removed safely (most MAC and IP-DA entries): Remove the
suspect entry and allow the table to be rebuilt naturally.
• If the entry is in use and cannot be removed safely (MAC_NH, IPSA, IPMCDA, IPDP, IPSP, or
IPXSN): Write a warning message to the log.
88
Advanced System Diagnostics and Troubleshooting Guide
FDB Scan
The failure action that the FDB scan test performs depends on the sys-health-check command
configuration. The command configurations options available under the system health check are
described in “Health Check Functionality” on page 71.
Related Commands
enable fdb-scan [all | slot {{backplane} | <slot number> | msm-a | msm-b}]
disable fdb-scan
configure fdb-scan failure-action [log | sys-health-check]
configure fdb-scan period <1-60>
unconfigure fdb-scan failure-action
unconfigure fdb-scan period
These commands are described in the sections that follow. The default settings are: disabled, log,
30 seconds.
Enabling FDB Scanning
You can scan the FDB on a stand-alone switch, on the backplane of a modular switch, or on a module in
a slot of a modular switch.
To enable FDB scanning, use this command:
enable fdb-scan [all | slot {{backplane} | <slot number> | msm-a | msm-b}]
where:
all
Specifies all of the slots in the chassis. This option applies only on modular switches.
slot
Specifies a particular switch element to be tested. The possible choices are:
•
backplane—Specifies the backplane of the chassis. This option applies only on
Alpine switches.
•
<slot number>—Specifies the slot number of the module to be scanned. This option
applies only to BlackDiamond switches.
•
msm-x —Specifies the MSM in slot x, where x is either A or B. This option applies
only to BlackDiamond switches.
NOTE
This command and its settings are independent of, and in addition to the system health check
configuration: the local settings do not affect the system health check configuration settings.
Disabling FDB Scanning
To disable FDB scanning, use this command:
disable fdb-scan [all | slot {{backplane} | <slot number> | msm-a | msm-b}]
NOTE
If you disable FDB scanning for a slot and the system health check is enabled, the slot is still scanned
by the system health checker.
Advanced System Diagnostics and Troubleshooting Guide
89
Diagnostics
Configuring the FDB Scan Diagnostics
• To set the interval between FDB scans, use the following command:
configure fdb-scan period <1-60>
The interval is a number in the range from 1 to 60 seconds. The default is 30 seconds. We
recommend a period of at least 15 seconds. If you attempt to configure a period of fewer than
15 seconds, the system displays the following warning message:
Setting period below (15) may starve other tasks.
Do you wish to do this? (yes, no, cancel) 06/19/2003 10:29:28 <INFO:SYST> serial
admin: configure fdb-scan period 1
Enter a “y” to proceed with the change; enter an “n” to reject the change.
• To configure the action taken when too many FDB scan test failures are detected within the specified
FDB scan period, use this command:
configure fdb-scan failure-action [log | sys-health-check]
If you specify the log option, or no auto-recovery option was specified using the
configure sys-health-check command, the response to FDB scan failures is to log one instance of
the failure message. The default is log.
If you specify the sys-health-check option, and an auto-recovery option was specified using the
configure sys-health-check command, the response to too many FDB scan failures is to take
whatever action the system health check is configured to perform.
• To configure the options for the FDB error checking function, use this command:
run fdb-check [all | index <bucket> <entry> | [<mac_address> | broadcast-mac]
{<vlan name>}] {extended} {detail}
System Impact of the FDB Scan Diagnostic
Using the default values (disabled, log, 30 seconds), the FDB Scan is a non-invasive test. But if the scan
interval is configured to less than 12 seconds, system performance might be affected, because system
processes might be starved.
NOTE
Generally, at the default 30 second FDB Scan period, it will take 30*128 seconds to scan the entire
FDB memory. Of course, for lower FDB memory locations, detection will occur earlier in the
30*128 second window. At an FDB Scan period of one second, it will take 128 seconds to scan through
the entire FDB memory, but it will consume more than 50% of CPU use during those 128 seconds.
Network Impact of the FDB Scan Diagnostic
Impact on network traffic is negligible. There might be some impact if the system health check feature
has been selected and the configured FDB Scan threshold is exceeded. The impact depends on the way
the system health check feature is configured.
90
Advanced System Diagnostics and Troubleshooting Guide
FDB Scan
Viewing Diagnostics Results
Use the following commands to view information related to the FDB Scan diagnostic test:
show log
show diagnostics
show fdb remap
clear fdb remap
show switch
Example Log Messages for FDB Scan Diagnostic Failures
Look for the following types of messages in the log:
FDB Scan: max number of remaps (num) exceeded. Calling sys-health-check. slot entry
This message indicates that the FDB scan cannot re-map any more FDB entries. The value num is the
maximum number of entries than can be remapped (should be 8), slot indicates the chassis slot, and
entry indicates the entry. The system health checker is invoked; the configured system health check
action will be taken.
If this error message appears many times on multiple slots, there might be a transceiver problem on
the master MSM. Run the transceiver diagnostics and check the results to determine whether the
MSM should be replaced.
FDB Scan: entry entry marked ‘remapped’
This message indicates that the diagnostic detected a corrupted portion of FDB memory, and that the
database entry entry was marked as unusable by the FDB scan routine. The module can continue to
operate normally with no loss of performance. Do not replace the module.
FDB Scan: entry entry marked ‘suspect’
This message indicates that the diagnostic detected a corrupted portion of FDB memory, but could
not remap that memory portion because it contains an entry that cannot be removed and relearned
automatically (for example, a static database entry). Operator intervention is required to correct this
problem. Use the show fdb remap command to identify the suspect entry (suspect entries are
marked with an “S,” remapped entries are marked with an “R”) and then take the appropriate
action to resolve the problem.
Example FDB Scan Results from the show diagnostics Command
FDB Scan results
Cardstate
slot 1 : Operational
slot 2 : Unknown
slot 3 : Unknown
slot 4 : Unknown
slot 5 : Unknown
slot 6 : Unknown
slot 7 : Operational
slot 8 : Operational
MSM-A : Operational
MSM-B : Operational
NumFail
0
NumScan
62
0
0
0
0
62
62
62
62
Advanced System Diagnostics and Troubleshooting Guide
Entry
LastFailTime
91
Diagnostics
In the example output of the show diagnostics command, in those slots equipped with a module, a
non-zero value in the “NumFail” column indicates that a problem has been detected with FDB memory.
During the FDB scan, the test attempts to map an error location so that it will not be used. If that
location is in use, and the entry cannot be removed safely, FDB scan marks it as suspect (see the
description of the example log messages in “Example Log Messages for FDB Scan Diagnostic Failures”
on page 91, and the show fdb remap command, below). If entries are marked “suspect,” then traffic
might be forwarded incorrectly for that specific entry (all other entries will be okay). Manually remove
the entry and allow FDB scan to remap it. If this is not possible, contact Extreme Network TAC.
Example Output from the show switch command
For an example of the show switch command display, see the “Example—show switch Command”
section on page 86. The output from this command will indicate whether FDB scanning is enabled and
will also indicate the failure action to be taken.
Example Output from the show fdb remap Command
Forwarding database remapped entries:
80fc0-206
80fc1-fff
80fc2-fff
80fc3-fff
FF:FF:FF:FF:FF:FF
00:E0:2B:FF:FF:FF
00:E0:2B:FF:FF:FF
00:E0:2B:FF:FF:FF
v1(4093)
(0000)
(0000)
(0000)
0000
0000
0000
0000
0000
0000
0000
0000
Ss
RS
RS
RS
m
m
m
m
CPU
-------
Flags : d - Dynamic, s - Static, p - Permanent, m - Mac, i - IP,
x - IPX, l - lockdown MAC, M - Mirror, B - Egress Blackhole,
b - Ingress Blackhole, S - Suspect, R - Remapped.
SW-202:24 #
92
Advanced System Diagnostics and Troubleshooting Guide
6
Additional Diagnostics Tools
This chapter describes additional diagnostic tools to detect and help resolve system problems.
This chapter contains the following sections:
• Temperature Logging for Modular Switches on page 93
• Syslog Servers on page 94
• Cable Diagnostics on page 96
Temperature Logging for Modular Switches
One of the leading causes of early failure in all electrical equipment is excessive heat. To achieve
maximum service life for equipment, adhere to the recommended environmental requirements for the
equipment. The ExtremeWare temperature-logging feature for modular switches aids in maintaining
optimum operating conditions by reporting the internal operating temperature (celsius) of a switch once
an hour to both the internal system log and to a syslog server, if configured.
The recommended ambient operating temperature for Extreme Networks switches is 32° to 104° F (0° to
40° C), but this range represents the absolute limits of the equipment. Whenever possible, the
temperature should be kept at approximately 78° F (25° C). Operating humidity should be kept between
10 and 95% relative humidity. For more information, refer to the Consolidated Hardware Installation Guide.
NOTE
Inadequate cooling airflow through the chassis causes excessive internal heat. Maintain at least
3 inches (76 mm) in front of all air intake and exhaust vents. The recommended clearance is 5 inches
(127 mm). Empty slots must be covered with blank panels to preserve air flow within the chassis.
Related Commands
enable temperature-logging
disable temperature-logging
show log
clear log
The temperature logging feature is disabled by default.
Advanced System Diagnostics and Troubleshooting Guide
93
Additional Diagnostics Tools
System Impacts of Temperature Logging
The temperature logging feature does not impact the performance of the system, but temperature
logging causes one log entry during every hour of switch operation. To prevent the loss of important
log messages, Extreme Networks recommends the use of an external syslog server. For more
information about the use of an external syslog server, refer to “Syslog Servers” on page 94.
Network Impact of Temperature Logging
There is no network impact due to temperature logging, because it is an internal log message option of
the switch.
Syslog Servers
Log information is critical not only to troubleshoot a failed system, but also to identify contributing
conditions that might lead to future failures. One major problem with internal switch logs is that only a
limited amount of memory can be allocated for logs. After 1,000 messages, the log wraps and the first
messages are lost. Normally, this is not an issue, but in case of failure, a failure might be recorded in the
log, but lost because subsequent messages cause the earlier, true cause of the failure to be purged.
Another important fact to consider when designing for effective recovery is that network device logs
might be lost after a catastrophic failure.
Syslog servers are an effective and inexpensive way to address both of the internal log capacity
limitation and the risk of loss in a catastrophic failure. Syslog servers receive and store log messages
from network devices. With the use of syslog servers, information remains intact after failure and no
buffer threshold will be reached, allowing administrators or Extreme Networks TAC representatives to
identify the triggering event in a failure. Syslog servers also offer the added advantage of integrated
tools to store, sort, scan, and issue alerts on configured error conditions. This capability enables greater
control of the networking environment, especially when planning for effective recovery.
Related Commands
enable syslog
disable syslog
configure syslog {add} <host name/ip> {: <udp-port>} [local0 ... local7] {<severity>}
configure syslog delete <host name/ip> {: <udp-port>} [local0 ... local7]
Enabling Logging to Remote Syslog Server Targets
To enable logging to a remote syslog server, use this command:
enable syslog
NOTE
The enable syslog command must be issued in order for messages to be sent to the configured remote
syslog server(s). Syslog is disabled by default.
94
Advanced System Diagnostics and Troubleshooting Guide
Syslog Servers
Disabling Logging to Remote Syslog Server Targets
To disable logging to all remote syslog server targets, use this command:
disable syslog
NOTE
This command disables logging to all remote syslog server targets, not to the switch targets. This
setting is saved in FLASH and will be in effect upon boot up.
Adding a Syslog Server
A total of four syslog servers can be configured at one time.
To configure the remote syslog server, use this command:
configure syslog {add} <host name/ip> {: <udp-port>} [local0 ... local7] {<severity>}
where:
host name
Specifies the host name of the remote syslog server. This option is valid only when a
domain name server has been configured.
ip
Specifies the IP address of the remote syslog server.
udp-port
Specifies the UDP port number for the syslog target. If a UDP port number is not
specified, the default port number 514 is used.
local0 ... local7
Specifies the syslog facility level for local use (local0 through local7). This option is
used to group syslog data.
severity
Specifies a filter level to be applied to messages sent to the remote syslog server.
Messages having the specified severity level or higher (more critical) are sent to the
remote syslog server. Severity levels are: critical, error, warning, notice, info,
debug-summary, debug-verbose, and debug-data. If no severity level is specified, all
messages are sent to the remote syslog server target.
NOTE
When a remote syslog server is added, it is associated with the filter DefaultFilter. Use the
configure log target filter command to associate a different filter.
Deleting a Remote Syslog Server
To delete a remote syslog server target, use this command:
configure syslog delete <host name/ip> {: <udp-port>} [local0 ... local7]
System Impact of the Syslog Server Facility
The syslog server facility has no impact on the performance of the system. All log messages that are
written to the local log of the system are simply copied to the configured syslog server.
Advanced System Diagnostics and Troubleshooting Guide
95
Additional Diagnostics Tools
Network Impact of the Syslog Server Facility
Network impact depends on the volume of log messages sent to the syslog server. But even under
extreme conditions, the relative brevity of log messages means that even a very large message volume
should not adversely affect network throughput.
Cable Diagnostics
The cable diagnostics provided in ExtremeWare are to assist in detecting severe cable problems
including, but not limited to, the following:
• A cable not properly terminated at the link partner
• An open circuit and the distance to the point where the open circuit occurs
• A short circuit between the conductors in a single twisted-pair and the distance to the point where
the short circuit occurs
Cable Diagnostics for the High-Density Gigabit Ethernet I/O Modules
in “i” Series Switches
ExtremeWare provides a set of cable diagnostics, referred to as the Cable Diagnostics Module or CDM,
to test cables attached to the physical ports on the High-Density Gigabit Ethernet modules (also known
as “3” series I/O modules) in the Alpine 3800 series and the BlackDiamond 6800 series chassis-based
systems.
The CDM tests can be run on any cable connected to a port on a High-Density Gigabit Ethernet module.
The cable can be open at the far end, or it can be plugged into a port on the far-end device acting as the
link partner.
Depending on the status of the cable and its connections, the CDM tests proceed this way:
• When the Gigabit link cannot be established, the CDM tests use time domain reflectometry (TDR) to
diagnose cable faults. The results of the diagnostic test are then interpreted to determine the type of
cable fault and—when applicable—the approximate distance to the cable fault.
• When the Gigabit link can be established, the CDM tests report additional status information on pair
skew, pair swap, polarity swap, and approximate cable length.
Related Commands
run diagnostics cable port [<portlist> | all]
abort diagnostics cable
configure diagnostics cable time <time> {reset-port-on-failure [enable | disable]}
enable diagnostics cable port [<portlist> | all]
disable diagnostics cable port [<portlist> | all]
show diagnostics cable {ports {<portlist> | all}} {mode {auto | manual | both}}
{detail}
NOTE
These commands apply only to the High-Density Gigabit Ethernet modules (also known as “3” series
I/O modules) in the Alpine 3800 series and the BlackDiamond 6800 series chassis-based systems.
96
Advanced System Diagnostics and Troubleshooting Guide
Cable Diagnostics
Running Cable Diagnostics
You can run the CDM tests manually at any time, or you can schedule them to be run automatically.
Running CDM tests Manually. To run the tests manually, use this command:
run diagnostics cable port [<portlist> | all]
This command initiates the CDM to obtain cable diagnostics values for the specified physical ports of
the system.
NOTE
Running the cable diagnostics takes the link down, disrupting any network traffic on the specified port
and its link.
To stop a CDM run that is currently in progress, use this command:
abort diagnostics cable
Running CDM Tests Automatically. To run the CDM tests automatically, perform these steps:
1 First, create a template for auto diagnostics that specifies two parameters:
• Start time for the cable diagnostics
• Whether a port is to be restarted if the diagnostics run results in a failure for a particular port
To create the auto diagnostics template, use this command:
configure diagnostics cable time <time> {reset-port-on-failure [enable | disable]}
where time is the time at which the diagnostics must be started, specified in the form hh:mm:ss.
NOTE
If you specify reset-port-on-failure and set it to disable, and the diagnostics fail for a port, the
port, which is disabled prior to running the diagnostics, will remain disabled and the status LED
corresponding to the failed port will blink continuously. If you do not explicitly enable such ports, the
status LED corresponding to the failed port will continue to blink.
2 Next, enable auto diagnostics for specific ports by using this command:
enable diagnostics cable port [<portlist> | all]
NOTE
Running the cable diagnostics automatically takes the link down, disrupting any network traffic on the
specified port and its link.
To disable the automatic running of cable diagnostics for selected physical ports of the system, use this
command:
disable diagnostics cable port [<portlist> | all]
Advanced System Diagnostics and Troubleshooting Guide
97
Additional Diagnostics Tools
The disable diagnostics cable command also purges the cable diagnostics values for the selected
ports from the CDM data structures.
Viewing and Interpreting CDM Test Data
To display CDM test information currently stored in the CDM data structures, use this command:
show diagnostics cable {ports {<portlist> | all}} {mode {auto | manual | both}}
{detail}
The show diagnostics cable command displays or prints the following cable diagnostics data for
each specified port:
• Time and date of test
• Port identity
• Speed (Mbps)
• Cable length (meters)
• Cable pair (subcategory information for each of the four pairs)
• Fault location (if any, as a distance, in meters)
• Pair skew (ns)
• Pair polarity
• Cable status
• Pair swap
• Diagnostic mode
NOTE
You can specify that cable diagnostics data should be displayed for either the latest automatic
diagnostics run, the latest manual diagnostics run, or both.
The following command displays cable diagnostics information in detail format for ports 1 through 3 on
slot 6:
show diagnostics cable ports 6:1-6:3 detail
98
Advanced System Diagnostics and Troubleshooting Guide
Cable Diagnostics
Following is sample detailed diagnostic output from this command:
========================================================
Manual Diagnostics Collected @ Thu Jan 29 02:48:29 2004
========================================================
Port Speed Avg Len Pair Fault Loc Skew
Polarity
Cable
Pair-Swap
Diagnostic
(Mbps) (meters)
(meters)
(ns)
Status Chan-AB Chan-CD Mode
---------------------------------------------------------------------------------------------6:1 1000
10
1-2
No Fault
8 ns
Unknown
Ok
No-Swap Unknown Manual
3-6
No Fault
0 ns
Unknown
Ok
4-5
No Fault
8 ns
Unknown
Ok
7-8
No Fault
8 ns
Unknown
Ok
6:2 1000
5
1-2
3-6
4-5
7-8
6
6
6
5
Unknown
Unknown
Unknown
Unknown
Positive
Negative
Positive
Positive
Open
Open
Open
Open
Swap
6:3 1000
6
1-2
3-6
4-5
7-8
0
0
0
0
Unknown
Unknown
Unknown
Unknown
Unknown
Unknown
Unknown
Unknown
Imp-Err Unknown
Open
Open
Open
Unknown
Manual
Unknown
Manual
The following command displays cable diagnostics information in summary format for port 1 on slot 6:
show diagnostics cable ports 6:1
The following is a sample summary diagnostic output from this command:
=========================================================
Manual Diagnostics Collected @ Fri Jan 16 03:41:54 2004
=========================================================
Port
Speed Pair Cable
Diagnostic-Mode
(MB)
Status
---------------------------------------------6:1
1000
1-2
Ok
Manual
3-6
Ok
4-5
Ok
7-8
Ok
Cable Length Information. The reported cable length information is a function of the physical
makeup of the cable itself, and the accuracy of the technology and calculation methodology used to
estimate cable length.
A cable is made up of one or more pairs of separately insulated conductors or lines. Each conductor
pair is twisted at a different rate to minimize electromagnetic interference (EMI). This difference in twist
rates results in a difference in the actual length of each conductor pair: a 100-meter CAT5 cable—for
example—might contain a twisted pair whose actual length might be as long as 103 meters, while
another might have an actual length as short as 99 meters.
Estimating cable length is usually based on a default value for the speed of wave propagation in a
cable, and any error in this default value translates directly into an error in the estimation of cable
Advanced System Diagnostics and Troubleshooting Guide
99
Additional Diagnostics Tools
length. For example, a 2% error in the default value of the speed of wave propagation results in a
two-meter error for a 100-meter cable.
Cable Pair Information. Twisted pair conductors in the RJ-45 Ethernet cable are connected to pins of
the PHY in the following pairings: 1-2, 3-6, 4-5, and 7-8. In a straight-through (MDI) cable, these
conductor pairings are associated with channel designators (A, B, C, and D), which refer to the roles
that the MDI pairs might assume under the IEEE definition.
Table 9 lists the logical channel assignments for straight-through (MDI) and crossover (MDI-X) cable
types as defined by IEEE 802.3 clause 40.8.
Table 9: IEEE 802.3 Cable Mapping
Contact
MDI
MDI-X
1
BI_DA+
BI_DB+
2
BI_DA–
BI_DB–
3
BI_DB+
BI_DA+
4
BI_DC+
BI_DD+
5
BI_DC–
BI_DD–
6
BI_DB–
BI_DA–
7
BI_DD+
BI_DC+
8
BI_DD–
BI_DC–
Cable Fault Information (no Gigabit link established). When the Gigabit link cannot be established,
the CDM tests use time domain reflectometry (TDR) to diagnose cable faults. The results of the
diagnostic test are then interpreted to determine the type of cable fault (described below) and—when
applicable—the approximate distance to the cable fault.
• Short—If the positive and negative conductors of the same cable pair make an electrical contact, the
cable diagnostic reports that condition as a short on that pair. The possible causes are:
— The cable pair conductors might be shorted if they are both touching metal in a wiring closet
patch panel.
— Within the cable, the insulation on cable pair conductors might be worn from constant flexing
and fail, allowing the conductors to make electrical contact.
• Open—If one or both of the conductors in a cable pair are severed, the cable diagnostic reports that
condition as an open on that cable pair. The possible causes are:
— The conductors of this cable pair might have been left unconnected at the wiring closet patch
panel.
— The conductors of this cable pair might have been severed within the cable.
— The far end of the cable is not connected.
• Impedance mismatch (impedance error)—When the effective impedance on a cable pair is not 100
Ohms, the cable diagnostic reports that condition as an impedance mismatch. The possible causes
are:
— Different quality cables—for example, a 100-Ohm segment and a 120-Ohm segment—are joined
through a cable extender.
— A cable of unsatisfactory quality is used.
100
Advanced System Diagnostics and Troubleshooting Guide
Cable Diagnostics
Extended Cable Status Information (Gigabit link established). When the Gigabit link can be
established, the CDM tests report additional status information on approximate cable length, pair skew,
polarity swap, and pair swap.
• Cable length—After link, the cable diagnostics use a non-TDR method to determine and report the
approximate cable length between the near-end port and its far-end link partner.
• Pair skew—The cable diagnostics can detect skew among the four pairs of the cable that connects
the near-end port to its far-end link partner. Three of the four pairs report their delay skew with
respect to the fastest pair in increments of 8 nanosecond (ns).
• Polarity swap—The cable diagnostics can detect and report when any of the cable pairs connected to
the PHY was inverted.
• Pair swap—The cable diagnostics can detect when the auto-crossover capability of the port’s PHY
has adjusted the role of its MDI pairs in the process of establishing link to its link partner. The cable
diagnostics report the channels associated with the MDI pairs.
Cable Diagnostics for “e” Series Switches
If you are having a problem establishing a link, you might have a faulty Ethernet cable. An Ethernet
cable is composed of four pairs of unshielded twisted-pair (UTP) conductors. Of those four pairs, two
pairs are required to create the link. In addition to checking the cable visually, you can also run a CLI
command to test the cable.
To test an Ethernet cable connected to an “e” series switch, use this command:
run diagnostics cable ports <portlist>
This command tests each of the four unshielded twisted pair (UTP) wire pairs. When the test ends, it
displays a message prompting you to enter the show ports cable diagnostics command to display
the cable diagnostic test results.
To display the output of the cable diagnostic test on an “e” series switch, use this command:
show ports <portlist> cable diagnostics
Advanced System Diagnostics and Troubleshooting Guide
101
Additional Diagnostics Tools
102
Advanced System Diagnostics and Troubleshooting Guide
7
Troubleshooting Guidelines
When a problem arises in the network, you should gather consistent information and deliver that
information to Extreme Networks for ongoing historical issue tracking and trend analysis. This chapter
describes the kinds of information you should collect and the general analytical processes you should
follow.
This chapter contains the following sections:
• Contacting Extreme Technical Support on page 103
• What Information Should You Collect? on page 105
• Analyzing Data on page 105
• Diagnostic Troubleshooting on page 106
• Extreme Networks’ Recommendations on page 107
• Using Memory Scanning to Screen I/O Modules on page 109
Contacting Extreme Technical Support
The Extreme Networks Global Technical Assistance Centers (TACs) are the focal point of contact for
post-sales technical and network-related questions or issues. Extreme Networks maintains several TACs
around the world. If you have a network issue that you are unable to resolve, contact the nearest
Extreme Networks TAC. The TAC will create a service request (SR) and manage all aspects of the
service request until the question or issue that spawned the service request is resolved.
Americas TAC
Covers Canada, the United States, and Latin America
Located in Santa Clara, CA USA
Toll free telephone: 1-800-998-2408
Direct telephone: 408-579-2826
E-mail: [email protected]
Web site: http://www.extremenetworks.com/support/techsupport.asp/
Office hours: Monday–Sunday, 6 A.M.–4 P.M., Pacific Standard Time
Advanced System Diagnostics and Troubleshooting Guide
103
Troubleshooting Guidelines
Asia TAC
Asia Pacific Rim, except Japan
Located in Santa Clara, CA USA
Toll free telephone: 1-800-998-2408
Direct telephone: 408-579-2826
E-mail: [email protected]
Web site: http://www.extremenetworks.com/support/techsupport.asp/
Office hours: Monday–Sunday, 3 P.M.–12 A.M., Pacific Standard Time
EMEA TAC
Located in Utrecht, Netherlands
Direct telephone: +31-30-800-5000
E-mail: [email protected]
Web site: http://www.extremenetworks.com/support/techsupport.asp/
Office hours: Monday–Sunday, 8 A.M.–5 P.M., Central European Time
Japan TAC
Located in Tokyo, Japan
Regional Support: Japan only
Direct telephone: +81-3-5842-4020
Fax: +81-3-5842-4021
E-mail: [email protected]
Web site: http://www.extremenetworks.com/support/techsupport.asp/
Office hours: Monday–Friday, 9 A.M.–6 P.M.
NOTE
The Extreme Networks TAC provides 24x7x365 service. Call received outside the normal business
hours by the Americas, Asia Pacific Rim, and EMEA TACs are forwarded to the TAC that is available at
that moment.
There are a variety of conditions under which customers and partners are entitled to use the TAC. If
you have questions about what you can expect of TAC services, please do one of the following:
• EMEA end users—Please contact your Extreme Networks supplier for an ExtremeWorks proposal,
or contact your Extreme Networks sales representative.
• Americas, Japan, and Asia-Pacific Rim—Please send an e-mail to [email protected].
A service representative will respond to you within one business day.
For a detailed description of the Extreme Networks TAC program and its procedures, including service
request information requirements and return materials authorization (RMA) information requirements,
please refer to the Extreme Networks What You Need to Know TAC User Guide at this Web location:
http://www.extremenetworks.com/services/wwtac/TacUserGuide.asp
104
Advanced System Diagnostics and Troubleshooting Guide
What Information Should You Collect?
What Information Should You Collect?
• Mandatory technical information:
— Before reboot, use the show tech CLI command to collect system information.
— System log (switch log—volatile, NVRAM; external log—complete remote SYSLOG file for the
day of the event)
— Topology diagram
• Background information:
— Any recent hardware or configuration changes
— Detailed description of all the known symptoms
— Was there a service impact?
— Define the scope of the service impact (For example: Only one user? All users on one
BlackDiamond system? All users in the IDC? Multiple switches? Random or pattern? Which
modules? Which ports? Etc.
— Trend: Recurrent event? Frequency? Etc.
— If the problem was resolved, what steps did you take to diagnose and resolve the problem?
• Optional information (upon request from Extreme Networks TAC personnel)
— System dump (CPU memory dump)
• Additional CLI commands for information include:
— show diagnostics
— show log (do the complete log, rather than just part of the log)
— show configuration
— show switch
— show version
Analyzing Data
• Check the log and the output from the show diags command to determine whether a hardware
fault was indicated.
• If a hardware fault is indicated:
— Determine whether a module was taken off line. If “yes,” it should be obvious which module
must be replaced.
— If not, refer to the “Diagnostic Troubleshooting” section (below).
• If the module can be identified clearly from the diagnostic messages, and the outage was
service-affecting, replace the faulty module.
• If the module cannot be identified clearly from the diagnostic messages, contact TAC for further
troubleshooting.
Advanced System Diagnostics and Troubleshooting Guide
105
Troubleshooting Guidelines
Diagnostic Troubleshooting
For “i” series switches, observe the following troubleshooting guidelines:
• If there are no checksum errors appearing in the system log, but the health check counts for missing
or corrupted packets are increasing, it is probably a transient problem, of low risk (possibly a busy
CPU).
• If the log shows checksum error messages, and the system health check counters for missing or
corrupted packets are increasing:
— Live data is being probably being disrupted.
— The combination of the health check counters in the output of the show diagnostics command
and the checksum messages in the log can help isolate the faulty module.
— Compare with CPU health check information from show diagnostics command; the packet
error might be occurring on the CPU data path and not on the backplane (in which case user
traffic would be largely unaffected, but protocol traffic could be having problems).
— If errors are frequent, user data is probably affected; run the packet memory scan as soon as
possible
• If system health check shows no failures, but the log shows checksum errors:
— If the checksum errors occur infrequently, it might indicate a packet memory problem that is
being triggered sporadically; it might be a low-risk situation, but—if possible—you should run
the packet memory scan.
— If the checksum errors occur frequently, user data is probably being affected; run the packet
memory scan as soon as possible.
• In the output from the show diagnostics command, if FDB scan error counters are non-zero, it
indicates that a problem has been detected with FDB memory. FDB scan attempts to map the error
location so that it will not be used. If the location is in use and the entry cannot be safely removed,
FDB scan will mark it as suspect (suspect entries are marked with an “S”). Look at the output of the
show fdb remap command. Address suspect entries by manually removing the entries and
re-adding them. Consult Extreme Networks TAC if this is not possible.
• In the output from the show diagnostics command, if transceiver test error counters are
incrementing, it might indicate a transceiver problem.
— If there is no associated log message, then the problem is probably a transient problem and
requires no action.
— If there is a log message, then there is most likely an issue that needs to be addressed. Use the log
message and the output of the show diagnostic command to isolate the problem.
106
Advanced System Diagnostics and Troubleshooting Guide
Extreme Networks’ Recommendations
Extreme Networks’ Recommendations
Extreme Networks strongly recommends that you observe the process shown in Figure 11 and outlined
in the steps that follow when dealing with checksum errors.
Figure 11: Diagnostic Troubleshooting Process
Customer experiences
checksum errors on
Inferno/Triumph
products.
Customer
responsibility
Are these
hard errors?
No
Monitor closely.
No action
needed.
Yes
Is
Extremeware
Software version
6.2.2 or higher?
No
Upgrade to latest EW
and use the packet
memory scan software
to detect and remap
the errors.
Yes
Run extended diags/
packet memory scan.
Are
errors detected by
packet memory scan/
extended diags?
No
TAC
responsibility
Call TAC. Next action
will be determined on the
error frequency and
problem details.
Yes
Are
errors recoverable?
Yes
Errors will be
mapped out. No further
action needed.
No
Call TAC. Product
needs to be replaced.
TAC creates RMA.
Product
replaced.
CG_003
1 Is the checksum error a hard error?
The first occurrence of a checksum error doesn’t determine whether the error is a hard error or a soft
error. If the error is persistent (doesn’t disappear after a reboot) and is accompanied by continuous
and consistent checksum error messages in the system log, it might be a temporary hard error.
If any hardware has been changed recently, and this switch is a modular chassis, try reseating the
affected blade.
Advanced System Diagnostics and Troubleshooting Guide
107
Troubleshooting Guidelines
2 Did the problem go away?
If it did, monitor the operation of the switch, but no immediate action is required.
If it did not disappear, it is probably a permanent hard error, is service-affecting, and must be dealt
with immediately by running the ExtremeWare extended diagnostics (including the packet memory
scan).
3 Because the extended diagnostics require down time, schedule an appropriate maintenance window
to minimize the impact on the rest of the network.
4 If the switch is not currently running the latest version of ExtremeWare software, the switch
software should be upgraded to gain availability to the latest ExtremeWare diagnostics.
5 Isolate the target switches, either physically or logically, from the network while the diagnostics are
being run because of the high CPU utilization of the diagnostics. Isolating the core switches ensures
that various network features converge properly.
6 Run the extended diagnostics in manual mode (which automatically invokes the packet memory
scan).
In addition to the extended diagnostics, you should also run the transceiver diagnostics and FDB
scan diagnostics within this same maintenance window, because run together these tests can detect
not only problems with the packet memory, but also any other problems within the system.
If possible, perform memory scanning while actual fabric checksums are being reported in the log.
Although this is not an absolute requirement (and is—in fact—not a factor in the actual memory
scan), by executing manual memory scanning while there are checksum errors occurring provides
the best correlation between this diagnostic and the actual event.
NOTE
For fully-redundant systems (for example, when ESRP has been enabled), the system health
checker can be run in automatic (auto-recovery) mode.
Did the extended diagnostics (plus the packet memory scan) detect errors?
• If no errors were detected, you should call the Extreme Networks TAC. The next action will be
determined by the frequency with which the error occurs and other problem details.
• If errors were detected, were the errors recoverable (mapped out of use)?
— If they were, no further action is required.
— If they were not mapped out of use, call the Extreme Networks TAC. The product must be
replaced. TAC will initiate the RMA process.
108
Advanced System Diagnostics and Troubleshooting Guide
Using Memory Scanning to Screen I/O Modules
Using Memory Scanning to Screen I/O Modules
NOTE
Memory scanning is available in ExtremeWare 6.2.2 and later releases, and applies only to “i” series
Summit, Alpine, and BlackDiamond switches.
To check modules supported by the memory scanning feature, you can screen existing or new modules
without having to upgrade or certify new ExtremeWare software on your networks. No particular
configuration or traffic load is needed to execute memory scanning on the supported modules. Simply
load ExtremeWare 6.2.2 or a later release onto a spare chassis with a default configuration and scan the
modules as needed.
If your environment does not support a spare chassis or it would be impractical to rotate through the
installed modules, then consider temporarily loading ExtremeWare 6.2.2 or a later release onto your
existing systems during an extended maintenance window to perform memory scanning on modules in
the field.
To do this, schedule an extended maintenance window and prepare the system for a temporary
ExtremeWare upgrade. Do not convert or save the configuration on the switch. It is not possible to run
an ExtremeWare 6.2.2 (or later) configuration correctly on an older version of ExtremeWare.
In temporarily upgrading your systems, plan to roll back the systems to the original working code
image and configuration. This means you need the original ExtremeWare code version in hand and
accessible by TFTP server from the switch. In addition you also need the latest saved configuration
uploaded and also accessible to download back to the switch from a TFTP server.
No particular configuration is needed to support running memory scanning. You can use the existing
default configuration to scan the supported modules and then restore the system to the original
ExtremeWare version and configuration.
If you must support a large campus environment with several BlackDiamond or Alpine systems for this
screening operation, you can temporarily dedicate a single MSM to the latest version of ExtremeWare
for the exercise and manually move this around all the systems with a default configuration to scan the
modules. For stackable platforms, you must load the latest ExtremeWare on every switch to run this
test.
Be aware that any memory defect found and mapped out under this exercise does not remain mapped
out when those modules are returned to a previous version of ExtremeWare. ExtremeWare does not
have the capability to use the mapped out information located in the detected module's EEPROM. The
validity of this temporary screening exercise is limited to identifying modules with memory defects.
Advanced System Diagnostics and Troubleshooting Guide
109
Troubleshooting Guidelines
110
Advanced System Diagnostics and Troubleshooting Guide
A Limited Operation Mode and
Minimal Operation Mode
This appendix describes two switch operational modes wherein switch behavior is restricted to protect
the stability of the switch and network and to allow troubleshooting or corrective action. The two
switch operational modes are limited operation mode and minimal operation mode. They result from
different failure conditions, but respond to similar procedures for troubleshooting and correcting their
respective failure conditions.
This appendix contains the following sections:
• Limited Operation Mode on page 111
• Minimal Operation Mode on page 112
Limited Operation Mode
A switch enters limited operation mode after a catastrophic reboot. As the switch boots, it checks to see
whether a catastrophe caused this reboot. If that is the case, the switch enters limited operation mode.
In this context, a catastrophe is defined as:
• When diagnostics fail on an Alpine or Summit switch;
• When diagnostics fail when run on an MSM in a BlackDiamond that has only a single MSM;
• When a hardware device/component fails and triggers a system “panic” event;
• When the POST fails.
NOTE
Running diagnostics on an Alpine or Summit switch causes the switch to reboot twice: once to clear the
state of the switch, again after the diagnostics have run, to make the switch available for use. The
decision whether to enter limited operation mode is made before the second boot occurs.
In effect, limited mode “stunts” the bring-up process so that ports are not enabled, many system tasks
are not spawned, and I/O modules are not powered up.
In limited operation mode, only the CPU, NVRAM, management port, console port, a limited set of
system tasks, and a limited subset of CLI commands are active.
Advanced System Diagnostics and Troubleshooting Guide
111
Limited Operation Mode and Minimal Operation Mode
Triggering Limited Operation Mode
On a BlackDiamond system with a single MSM, if a diagnostics test detects errors or if the POST fails,
the system goes into limited operation mode. Similarly, on a Summit or Alpine system, if a diagnostics
test detects errors, the Summit or Alpine switch will go into limited operation mode. When a failure
occurs, the system retains an error code.
In limited operation mode, you must use the clear log diag-status command to clear the hardware
error code so that the module—in the case of a BlackDiamond system, or the switch—in the case of an
Alpine or Summit system, can be brought up after the next reboot.
Bringing a Switch Out of Limited Operation Mode
To bring a switch out of limited operation mode, perform these steps:
1 Begin collecting background information that might help isolate the causes of the problem and
contact Extreme Networks technical support and notify them about the problem.
a Note any recent hardware or configuration changes.
b Create a detailed description of all the known symptoms.
c
Capture the output from the show log command.
d Capture the output from the show diagnostics command.
e On a sheet of paper, write down the state of all LEDs on the switch.
2 Use the clear log diag-status command to clear the hardware error codes.
3 Use the reboot command to reboot the system.
4 Use the show tech CLI command to collect system information.
5 Send all of the information about the problem to Extreme Networks technical support.
Minimal Operation Mode
If the system reboots due to a failure that persists after the reboot, the system will reboot again when it
detects the failure again, and will continue that behavior across an endless cycle of reboots—referred to
as a reboot loop.
The ExtremeWare reboot loop protection feature provides a mechanism to detect a reboot loop and
force the system into minimal operation mode. In minimal mode, only the CPU, NVRAM, management
port, a minimal set of system tasks, and a minimal subset of CLI commands are active.
Triggering Minimal Operation Mode
To protect against reboot loops, you can configure reboot loop protection using the command:
configure reboot-loop-protection threshold <time-interval> <count>
If the switch reboots the specified number of times (<count>) within the specified time interval
(<time-interval>), the switch stops rebooting and comes up in minimal operation mode.
For more information on the use of this command, see “Configuring Reboot Loop Protection” on
page 43.
112
Advanced System Diagnostics and Troubleshooting Guide
Minimal Operation Mode
To detect a reboot loop, a timestamp and a counter are saved. Each time the switch reboots because of a
software crash or exception, the counter is incremented. A user-executed reboot command clears the
timestamp and counter to prevent a false reboot loop protection. This action also allows the user to
bring the switch out of minimal operation mode so that the system can come up normally after the
failure has been identified and fixed.
Bringing a Switch Out of Minimal Operation Mode
To bring a switch out of minimal operation mode, perform these steps:
1 Begin collecting background information that might help isolate the causes of the problem and
contact Extreme Networks technical support and notify them about the problem.
a Note any recent hardware or configuration changes.
b Create a detailed description of all the known symptoms.
c
Capture the output from the show log command.
d Capture the output from the show diagnostics command.
e On a sheet of paper, write down the state of all LEDs on the switch.
2 Use the clear log diag-status command to clear the hardware error codes.
3 Use the reboot command to reboot the system.
4 Use the show tech CLI command to collect system information.
5 Send all of the information about the problem to Extreme Networks technical support.
Advanced System Diagnostics and Troubleshooting Guide
113
Limited Operation Mode and Minimal Operation Mode
114
Advanced System Diagnostics and Troubleshooting Guide
B Reference Documents
This appendix lists additional documentation and other information resources that support the use of
the ExtremeWare advanced system diagnostics suite in testing and validating the operating integrity of
Extreme Networks switches.
This appendix contains the following sections:
• General Information on page 115
• Other Documentation Resources on page 115
General Information
Please refer to the following documents for general information about parity errors and soft/hard
failures in general.
http://www.research.ibm.com/journal/rd/401/curtis.html
http://www.pcguide.com/ref/ram/err.htm
http://www.eetimes.com/news/98/1012news/ibm.html
Other Documentation Resources
Extreme Networks customer documentation is available at the following Web site:
http://www.extremenetworks.com/services/documentation/
The customer documentation support includes:
• ExtremeWare Software User Guide
• ExtremeWare Command Reference Guide
Use the user guide and the command reference guide to verify whether the configuration is correct.
• ExtremeWare Error Message Decoder
Use the error message decoder to determine whether there are any available explanations or actions
for mitigating the problem.
Advanced System Diagnostics and Troubleshooting Guide
115
Reference Documents
• White papers and solutions documentation:
— Advanced technologies
— Applications in the networking world
• Additional troubleshooting tools:
— ExtremeWare Release Notes
Use the release notes to check for known issues, supported limits, bug fixes from higher
ExtremeWare versions, etc.
(Release notes are available to all customers who have a service contract with Extreme Networks
via eSupport. The release notes are provided by product, under the Software Downloads area of
eSupport.)
— Virtual Information Center (VIC)
Use this site to check for any available information about the problem.
— Extreme Knowledge Base
Use this site to search for any known issues, or to search for known solutions.
www.extremenetworks.com → Services → eSupport-Login → Known Issues → Find
www.extremenetworks.com → Services → eSupport-Login → Solutions → Find
— ExtremeWare Field Notices
Use the field notices to check for any known field alerts.
• Preventive Maintenance
— Preventive maintenance practices
Use the preventive maintenance area to check for any available special preventive programs.
www.extremenetworks.com → Services → Documentation → Overview →
Preventive Maintenance
— Regularly scheduled visual inspections
116
Advanced System Diagnostics and Troubleshooting Guide
Index
Symbols
"e" series
"hitless" MSM failover
"i" series
"inferno" series
13, 59, 101
21, 39
13
13
A
active backplane (Alpine systems)
active tests
Alpine hardware architecture
Alpine systems
active backplane
I/O module architecture
SMMi processor module
ASICs
automatic system dump
22
50
22
22
22
22
28
45
B
backplane
active
passive
backplane health check (BlackDiamond only)
BlackDiamond
backplane
hardware architecture
I/O modules
MSM
MSM-3
redundancy
22
17
70
17
16
18
21, 39
20
Advanced System Diagnostics and Troubleshooting Guide
10
34
70
51
51
28
25
34
40, 41
D
data path. See also PBUS and fast path
DIAG
diagnostics
active tests
extended
FDB scan
invasive
memory mapping
memory scanning
non-invasive
passive test
slot-based system hardware tests
switch fabric checksums
transceiver check
dump, system memory
34
50
57
25, 88
50
53
53
50
50
13
25
25
45
E
C
cable diagnostics
"e" series switches
"i" series switches
checksums
checksum error defined (table)
defined (table)
packet memory
severity level
CRIT
WARN
switch fabric
control bus. See slow path
conventions
notice icons, About This Guide
text, About This Guide
CPU health check
packet type descriptors
system health check test
CPU subsystem
backplane health check
CPU health check test
diagnostic processing (figure)
CRC, Ethernet
CRIT
critical task exception
Cyclical Redundancy Check. See CRC
101
96
26
26
28
34
34
25
EDP
errored cell correction
errors
systematic, permanent
systematic, soft-state
transient
Ethernet CRC
EXT
Extreme Knowledge Base
Extreme Virtual Information Center (VIC)
ExtremeWare Error Message Decoder
34
54
30
30
30
25
34
116
116
115
F
9
fabric checksums
117
Index
defined
error detection mechanisms
fast-path checksum error
fast path
checksum errors
defined
forwarding
FastPOST
FDB
background scan process
scan diagnostic
field notices
forwarding ASICs
27
28
29
29
27
29
49
25
88
116
28
H
hardware architecture
Alpine
BlackDiamond
Summit
22
16
23
I
INT
invasive diagnostics
64, 111
M
MAC device layer
maintenance mode
management bus. See slow path
Management Switch Fabric Module. See MSM
manual system dump
mean time to repair. See MTTR
memory mapping
memory scanning
minimal operation mode
MSM
recovery action
redundancy
MSM-3
MTTR
28
40
46
53
53
112
40
20
21, 39
12
N
non-invasive diagnostics
50
P
packet bus. See PBUS
packet checksum
packet error events
packet memory
checksums
scan test
passive tests
PBUS. See also fast path
permanent errors
PHY port layer
PM. See packet memory
POST
CPU register ASIC test
introduced
118
56
R
Real Time Clock (RTC)
reboot
recovery action
maintenance mode
MSM failover
reboot
shutdown
system dump
response action
alarm-level
auto-recovery
root task
runtime diagnostics
"e" series switches
"i" series switches
56
40, 41
40
40
40, 41
40
40
71
71
41
59
57
S
34
50
L
limited operation mode
test routines
Power-on self test. See POST
26
26, 30
28
25, 58
50
26
28
56
12
severity level
CRIT
WARN
shutdown
slow path
checksum errors
defined
SMMi
soft-state errors
software exception handling
critical task exception
maintenance mode
MSM failover
reboot
shutdown
system dump
Summit systems
architecture (figure)
CPU subsystem
hardware architecture
I/O subsystem
non-modular "i"-series stackables
switching fabric subsystem
SYSLOG file
system dump
automatic
manual
system health check
alarm-level response action
auto-recovery response action
configuration and use
defined
described
states
CHECK
INITIALIZATION
SEND
SNC
WAIT
system log
system tasks
root task
34
34
40
29
27
22
26
40, 41
40
40
40, 41
40
40
23
23
23
23
23
23
105
45
46
25
71
71
70
26
13
70
70
70
70
70
105
41
Advanced System Diagnostics and Troubleshooting Guide
Index
tBGTask
tConsole
tEdpTask
tEsrpTask
tExcTask
tExtTask
tLogTask
tNetTask
tShell
tSwFault
tSyslogTask
systematic errors
40, 41
41
40, 41
40, 41
41
41
41
40, 41
41
41
41
30
T
tasks
root task
tBGTask
tConsole
tEdpTask
tEsrpTask
tExcTask
tExtTask
tLogTask
tNetTask
tShell
tSwFault
tSyslogTask
tBGTask
tConsole
tEdpTask
tEsrpTask
test packet type, system health check
tExcTask
tExtTask
tLogTask
tNetTask
transceiver diagnostics
background check
configuration and use
transient errors
troubleshooting
cables
Ethernet UTP cable problems
tShell
tSwFault
tSyslogTask
41
40, 41
41
40, 41
40, 41
41
41
41
40, 41
41
41
41
40, 41
41
40, 41
40, 41
34
41
41
41
40, 41
25
82
26, 30
96
96, 101
41
41
41
U
UTP cable problems
96, 101
V
verification checksum
26
W
WARN
white papers
Advanced System Diagnostics and Troubleshooting Guide
34
116
119
Index
120
Advanced System Diagnostics and Troubleshooting Guide
Index of Commands
A
abort diagnostics cable
96, 97
C
clear fdb remap
91
clear log
93
clear log diag-status
112, 113
configure diagnostics
56
configure diagnostics cable
96
configure diagnostics cable time
97
configure fdb-scan failure-action
89, 90
configure fdb-scan period
89, 90
configure log target filter
95
configure packet-mem-scan-recovery-mode
55, 67
configure reboot-loop-protection threshold
43, 112
configure reboot-loop-protection threshold backup-msm
44
configure reboot-loop-protection threshold backup-msm use-master-config
44
configure sys-health-check alarm-level
55, 71
configure sys-health-check auto-recovery
55, 71
configure syslog
94
configure syslog add
95
configure syslog delete
94, 95
configure sys-recovery-level
"e" series switches
41
"i" series switches
37, 40, 46
configure system-dump server
45
configure system-dump timeout
45
configure transceiver-test failure-action
83
configure transceiver-test period
82
configure transceiver-test threshold
83
configure transceiver-test window
83
disable syslog
disable system-watchdog
disable temperature-logging
disable transceiver-test (Alpine)
disable transceiver-test (BlackDiamond)
94, 95
38
93
82
82
E
enable diagnostics cable
enable diagnostics cable port
enable fdb-scan
enable sys-health-check
enable syslog
enable system-watchdog
enable temperature-logging
enable transceiver-test (Alpine)
enable transceiver-test (BlackDiamond)
96
97
88, 89
55
94
38
93
82
82
R
reboot
run diagnostics cable
run diagnostics cable ports
run diagnostics extended
"e" series switches
"i" series switches
run diagnostics normal
"e" series switches
"i" series switches
run diagnostics packet-memory
run diagnostics stack-port
run diagnostics_noslot
run fdb-check
run msm-failover
112, 113
96, 97
101
60
55, 58
60
58
55, 58
60
58
90
43
S
D
disable diagnostics cable
disable diagnostics cable port
disable fdb-scan
Advanced System Diagnostics and Troubleshooting Guide
96
97
89
show configuration
43, 105
show diagnostics
56, 73, 84, 91, 105, 106, 112, 113
show diagnostics cable
96, 98
show diagnostics packet-memory
58
121
Index of Commands
show fdb remap
91, 106
show log
72, 84, 91, 93, 105, 112, 113
show packet-mem-scan-recovery-mode
67
show port rxerrors
27
show ports cable diagnostics
101
show switch
43, 56, 84, 91, 105
show system-dump
46
show tech
105, 112, 113
show version
105
synchronize
43
synchronize command
21
U
unconfigure fdb-scan failure-action
unconfigure fdb-scan period
unconfigure packet-mem-scan-recovery-mode
unconfigure switch all
unconfigure system-dump
upload system-dump
122
89
89
67
56
46
46
Advanced System Diagnostics and Troubleshooting Guide