1
S c h l ü t e r ®- B E K O T E C - T H E R M
Service and planning materials
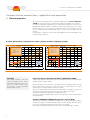
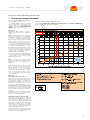
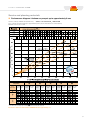
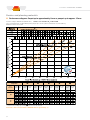
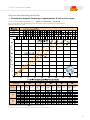
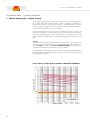
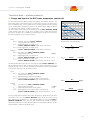
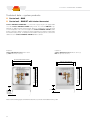
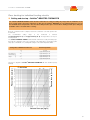
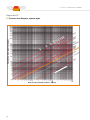
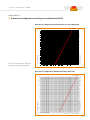
Performance diagram (example)
The following pages explain the system specific
results of thermal technology tests.
The individual diagrams differ by the thermal
resistance factors of the corresponding surface
covering. The adjoining output diagram, with
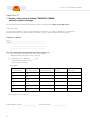
examples, refers to the Schlüter®-BEKOTECTHERM ceramic thermal comfort floor.
Tested according to DIN EN 1264 (BS EN 1264).
Floor covering: Ceramic tile, natural stone and cast stone incl. Schlüter®-DITRA 25 mat.
Average screed cover: approximately 20 mm.
Application:
The heating output is shown as heat flow
density on the lower scale (see example: at
71W/ m2 ).
Moving up vertically from the desired heating
output, one can determine the corresponding installation distances of the heating pipes
(75, 150, 225, or 300 mm). When we transfer
the intersection of 71 W/m2 with an installation
distance of 150 to the left scale, we see the
corresponding excess heating temperature of
12.5 °C. This temperature indicates how many
degrees Celsius the heating water must exceed
the desired room temperature on average.
Consequently, if a room temperature of 20 °C
is desired, the heating water on average must
be heated to 32.5 °C to achieve an output of
71 W/m2 with an installation distance of
150 mm between the heating pipes.
If we stay with an excess heating temperature
of 12.5 °C, the table shows the heating output
of other distance options between heating
pipes at the intersections.
Note: To determine the necessary average
heating water temperature, add the excess
heating temperature to the desired room temperature.
When you extend a line from the value (example: 71 W/m2) for the heat output (heat flow
density) vertically to the top of the diagram,
you can read the necessary average surface
temperatures associated with the corresponding room temperatures (example: approx.
26.6 °C average surface temperature at 20 °C
room temperature).
Limit curves
Limit curve 9 K (for living spaces)
This indicates at which point the maximum permissible surface temperature for living spaces
is reached. For example, the surface temperature should be limited to 29 °C if a room
temperature of 20 °C is desired. If the desired
heat output is above the limit curve, a closer
installation distance of the heating pipes should
be considered. If there is no way to bring the
heating pipes closer together, the floor heating
alone is not able to provide the necessary heating output.
The points on the limit curve indicate the maximum heat output of the corresponding installation distances of the heating pipes.
Limit curve 15 K (for peripheral zones)
This indicates at which point the maximum
permissible surface temperature for peripheral
zones is reached. Peripheral zones apply, e.g.
to the area in front of full length windows and
usually extend 1 m into the room. This allows
for reaching a maximum surface temperature
of 35 °C with a room temperature of 20 °C to
counter the cold air coming in through large
windows with higher heat output.
The points on the limit curve indicate the maximum heat output of the corresponding installation distances of the heating pipes.
29