1
D-View 5.1
Network Management System
User’s Guide
First Edition (Jan 2003)
6DS510….01
Printed In Taiwan
RECYCLABLE
Table of Contents
About This Guide ......................................................................................................................... 2
Overview of this User’s Guide .................................................................................................. 2
Introduction ................................................................................................................................. 4
System Requirements ............................................................................................................. 4
Installation.............................................................................................................................. 4
Start Run .............................................................................................................................. 14
Architecture ............................................................................................................................... 17
Organization ......................................................................................................................... 17
Features................................................................................................................................ 18
How to Manage a Network Using D-View 5.1 .............................................................................. 24
Orientation .............................................................................................................................. 24
Using D-View ........................................................................................................................ 24
Basic Operations ..................................................................................................................... 28
Network Basic Information .................................................................................................... 28
Repolling Configuration......................................................................................................... 30
Community String Configuration .......................................................................................... 30
Saving D-View Database ....................................................................................................... 31
Clear Database ..................................................................................................................... 31
Find Object ........................................................................................................................... 32
Domain Control..................................................................................................................... 33
Device Control....................................................................................................................... 36
Multiple View Settings in D-View........................................................................................... 38
Device SNMP Configuration................................................................................................... 41
Starting Off in D-View 5.1........................................................................................................ 41
Discover ................................................................................................................................ 41
How to Monitor and Manage a Network ................................................................................... 43
Monitoring Device ................................................................................................................. 43
Managing Device ................................................................................................................... 45
Changing device properties ................................................................................................... 51
ii
Collect Trap Information to Log File ......................................................................................... 55
Log On Trap .......................................................................................................................... 56
Log Off Trap .......................................................................................................................... 57
View Trap and Edit................................................................................................................ 58
Install Plug-in Management Module......................................................................................... 59
Managing SNMP Devices Without a Management Module ........................................................ 65
Background on MIBs ............................................................................................................ 65
GET/SET Operations ............................................................................................................ 66
MIB Listing ........................................................................................................................... 67
MIB Browser ......................................................................................................................... 68
How to Use the MIB Browser................................................................................................. 68
MIB Compiler........................................................................................................................ 75
How to Use the MIB Complier ............................................................................................... 76
More on the MIB Compiler .................................................................................................... 81
Creating a Topology ................................................................................................................. 91
Create a New Topology .......................................................................................................... 92
Manipulating Icons and Images............................................................................................. 94
MIB Utilities ............................................................................................................................. 114
MIB II Menus......................................................................................................................... 115
Information ......................................................................................................................... 116
MIB II Read-only Windows .................................................................................................. 118
IF MIB Tables ........................................................................................................................ 136
Entity .................................................................................................................................... 138
Bridge 802.1d ........................................................................................................................ 152
Bridge 802.1d Information and Port Table........................................................................... 152
Spanning Tree ....................................................................................................................... 155
Spanning Tree Information.................................................................................................. 155
Spanning Tree Port Table .................................................................................................... 157
Transparent Bridge Forwarding & Static Filtering Tables .................................................... 158
Transparent Bridge Port Counter Table & Port Traffic Graph............................................... 160
RMON.................................................................................................................................... 161
RMON History ..................................................................................................................... 167
RMON Alarm....................................................................................................................... 172
RMON Event ....................................................................................................................... 177
802.1P & 802.1Q ................................................................................................................... 180
iii
802.1P ................................................................................................................................ 180
802.1Q................................................................................................................................ 186
Traffic Statistics .................................................................................................................. 192
Port VLAN Statistics ............................................................................................................ 193
Layer 3 Utilities ..................................................................................................................... 193
IP Forwarding...................................................................................................................... 194
RIP 2................................................................................................................................... 195
OSPF................................................................................................................................... 197
IP Mroute ............................................................................................................................ 203
DVMRP ............................................................................................................................... 206
PIM ..................................................................................................................................... 208
SNMPv3 Configuration........................................................................................................... 211
Internet Tools........................................................................................................................... 215
DIAP ...................................................................................................................................... 215
TFTP...................................................................................................................................... 216
BOOTP Server........................................................................................................................ 218
PING Test .............................................................................................................................. 220
Advanced Management ............................................................................................................ 222
Trap Management.................................................................................................................. 222
Traps .................................................................................................................................. 222
Trap Editor ......................................................................................................................... 223
Clear Trap Alerts ................................................................................................................. 224
Sort Trap Alerts................................................................................................................... 224
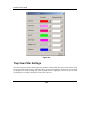
Trap Type Properties ........................................................................................................... 224
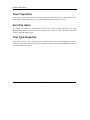
Trap View Filter Settings ..................................................................................................... 225
How to Edit a TRF File ........................................................................................................ 227
Trap Log.............................................................................................................................. 228
SMTP Setting Form ............................................................................................................. 229
Trap Mail Settings Forms .................................................................................................... 230
Alarm Mail Interval ............................................................................................................. 231
Adding Plug-In Utilities.......................................................................................................... 238
How to install self-developed device SNMP module .............................................................. 238
Install common tools and plug-in to menu item .................................................................. 245
Account ................................................................................................................................. 247
iv
Client Update ...................................................................................................................... 249
Client Manager.................................................................................................................... 250
How to Manage a Client ...................................................................................................... 252
Client Record Query ............................................................................................................ 253
Client Online Query ............................................................................................................ 253
Client Abnormal Situation................................................................................................... 254
Device Utilization ................................................................................................................ 255
Device Group Manager ........................................................................................................ 256
Pay Rate Configuration ....................................................................................................... 257
Troubleshooting ....................................................................................................................... 259
Menu/Command Quick Reference ........................................................................................... 265
Index........................................................................................................................................ 266
v
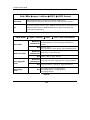
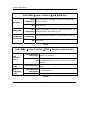
The following entries from the Table of Contents above are Professional Edition features only—all other items
are both Standard and Professional Edition features:
802.1P & 802.1Q
802.1P
802.1Q
Traffic Statistics
Port VLAN Statistics
Layer 3 Utilities
IP Forwarding
RIP 2
OSPF
IP Mroute
DVMRP
PIM
SNMPv3 Configuration
Account
Client Update
Client Manager
How to Manage a Client
Client Record Query
Client Online Query
Client Abnormal Situation
Device Utilization
Device Group Manager
Pay Rate Configuration
vi
D-View 5.1 User’s Guide
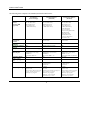
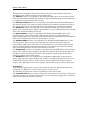
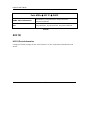
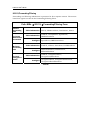
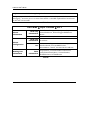
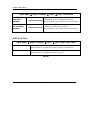
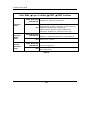
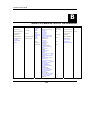
The following chart compares Trial, Standard, and Professional features:
D-View 5.1
Trial Edition
(Free of Charge)
Features
D-View 5.1
Standard Edition
(DS-510S)
D-View 5.1
Professional Edition
(DS-510P)
Advanced MIB
Utilities
(Standard MIB
supported)
MIB-II (RFC1213)
802.1D (RFC1493)
RMON (RFC1757)
Entity (RFC2737)
IF MIBs (RFC2233))
MIB-II (RFC1213)
802.1D (RFC1493)
RMON (RFC1757)
Entity (RFC2737)
IF MIBs (RFC2233)
Network
Management
Protocol
Port base accounting
capability
Automatic company
grouping
Expiry Date
SNMP V1
SNMP V1
D-Link DIAP
MIB-II (RFC1213)
802.1D (RFC1493)
RMON (RFC1757)
Entity (RFC2737)
IF MIBs (RFC2233))
VLAN (RFC2674)
Layer 3 Utilities :
IP Forwarding (RFC2096)
PIM (RFC2934)
OSPF (RFC1850)
DVMRP (RFC1075)
IP Mroute (RFC2932)
RIP2 (RFC1724)
SNMP V1 – V3
D-Link DIAP
N.A
N.A.
YES
YES
YES (D Link brand only)
YES
MIB Browser &
MIB Complier
(1)Get only
(2)MIB Editor (read only)
(3)SNMP V1
(4)Loadable MIBs:15
64
(1)Get only
(2)MIB Editor (read/write)
(3)SNMP V1
(4)Loadable MIBs : 30
256
(1)Get/Set
(2)MIB Editor (read/write)
(3)SNMP V1~V3
(4)Loadable MIBs : Unlimited
Unlimited
5
Unlimited
Unlimited
N.A.
YES
(1) TFTP Server
(2) BOOTP
(3) PING
(1)Advance filter and alarm/ trap
list view
(2)Trap editor allows manager to
add/ modify trap items
(3)History log support
(4)Alarm/ trap message
notification by e-mail
YES
(1) TFTP Server
(2) BOOTP
(3) PING
(1)Advance filter and alarm/
trap list view
(2)Trap editor allows manager
to add/ modify trap items
(3)History log support
(4)Alarm/ trap message
notification by e-mail
Managed IP Nodes
number (max.)
No. of Topology
Map
Internet Tools
Alarm/Trap Manager
60 days (No after-sale support) Unlimited
(1)Advance filter and alarm/
trap list view
(2)Trap editor allows manager
to add / modify trap items
(3)History log support
1
Unlimited
D-View 5.1 User’s Guide
A BOUT T HIS G UIDE
This User’s guide provides brief descriptions of how to use the various menus and operations
found in the D-View Network Management System. This guide does not discuss network design or
management concepts, nor does it provide detailed explanation or definitions of SNMP, MIBs,
RMON or associated concepts. It is assumed that the reader is familiar with these standardized
networking concepts and protocols; hence variables presented in the D-View menus are selfexplanatory. Variables such as MIB objects are listed exactly as they appear on the D-View GUI.
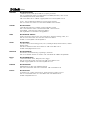
Overview of this User’s Guide
♦
Chapter 1, “Introduction.” Lists system requirements, gives
procedures. Shows you how to get D-View 5.1 up and running.
♦
Chapter 2, “Architecture” Explains D-View 5.1’s organization and highlights
features.
♦
Chapter 3, “How to Manage a Network Using D-View 5.1.” Describes how to
manage a network with D-View 5.1. Topics include: Discover, How to Monitor
and Manage a network, Using Telnet, Changing Device Properties, Collect trap
information to log file, Install Plug-in management module, Managing SNMP
Devices without a management module (MIB Compiler/Browser), Topology.
♦
Chapter 4, “MIB Utilities.” Shows how to use D-View’s user-friendly dialogs to
manage without using plug-in modules. This chapter is organized according to
the drop-down menu items under “MIBs” on the D-View 5.1 GUI.
♦
Chapter 5, “Internet Tools.” Explains items in the “Tools” drop-down menu in
the order of the descending menu items.
♦
Chapter 6, “Advanced Management.” Explains how to use trap management
functionalities.
2
installation
D-View 5.1 User’s Guide
♦
Appendix, “Troubleshooting.”
scenarios.
Provides solutions to different troubleshooting
3
D-View 5.1 User’s Guide
1
I NTRODUCTION
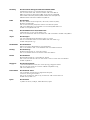
This section gives systems requirements and explains installation procedures.
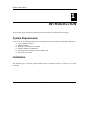
System Requirements
D-View 5.1 can be installed and operated on a computer that meets the following minimum requirements:
♦ CPU: 550 MHz and above
♦ DRAM: 256MB
♦ Hard Drive Available space: 100MB
♦ Ethernet Adapter: 10/100BASE-T
♦ Operating System: Windows 2000 or Windows XP
♦ Microsoft Access 2000
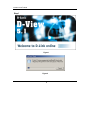
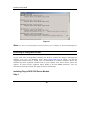
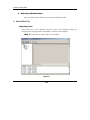
Installation
The following is a pictorial guide showing how to install D-View 5.1 and get it up and
running:
4
D-View 5.1 User’s Guide
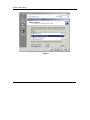
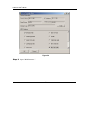
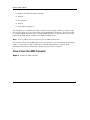
Step 1
Figure 1
Figure 2
5
D-View 5.1 User’s Guide
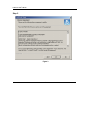
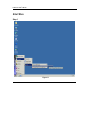
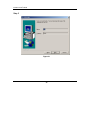
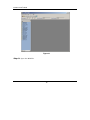
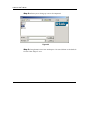
Step 2
Figure 3
6
D-View 5.1 User’s Guide
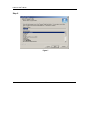
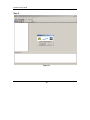
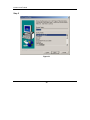
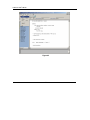
Step 3
Figure 4
7
D-View 5.1 User’s Guide
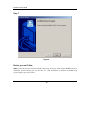
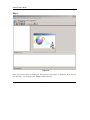
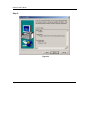
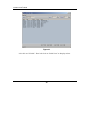
Step 4
Figure 5
8
D-View 5.1 User’s Guide
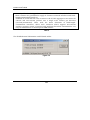
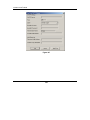
Step 5
Figure 6
Typical: Installs D-View 5.1, D-Link SNMP Solutions Modules, DES-3225G, DES-3624i,
DES-6000, DGS-3208TG, DGS-3208F, DHS-3226, DHS-3218, DHS-3210, DES-3226,
DHS-3224V, DGS-3224TG, DHS-102, and Wireless AP.
Compact: Installs D-View 5.1 and D-Link SNMP Solutions.
9
D-View 5.1 User’s Guide
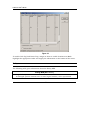
Step 6
Figure 7
10
D-View 5.1 User’s Guide
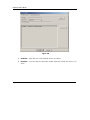
Step 7
Figure 8
Before you run D-View
Note:. If the device can’t be found under discovery, then you must enable SNMP service in
Windows service before you run D-View 5.1, and remember to disable the SNMP trap
service before you run D-View.
11
D-View 5.1 User’s Guide
Figure 9
12
D-View 5.1 User’s Guide
Figure 10
13
D-View 5.1 User’s Guide
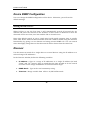
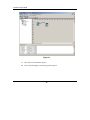
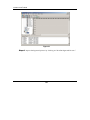
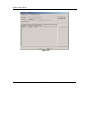
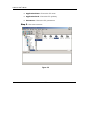
Start Run
Step 1
Figure 11
14
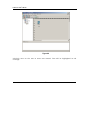
D-View 5.1 User’s Guide
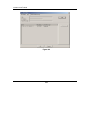
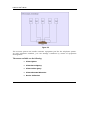
Step 2
Figure 12
15
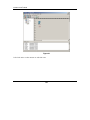
D-View 5.1 User’s Guide
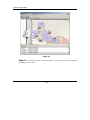
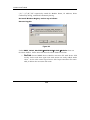
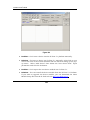
Step 3
Figure 13
Once the screen above is displayed, the Discovery procedure is finished. Now you can
use D-View 5.1 to manage your SNMP-enabled device!
16
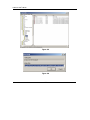
D-View 5.1 User’s Guide
2
A RCHITECTURE
This chapter explains the organization and highlights new features of D-View 5.1.
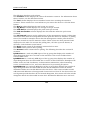
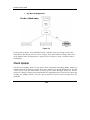
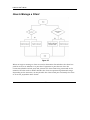
Organization
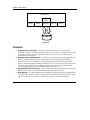
D-View is organized into five main components
♦
Alarm/Trap Manager: Primarily responsible for monitoring abnormal situations,
real-time management of network device status. Allows the network manager to
monitor events in a timely and effective manner. Other functions include Trap
filter, editor, setting of abnormal criteria, and contacting network administrator
by e-mail.
♦
Discover & Parsing: Discover device in network, collect basic information,
grouping and display for use.
♦
MIB Utilities: Supports often-used MIB utilities, offers the most convenient
management. Can manage through device module. If there is no module, can
still manage device through MIB utility.
♦
Internet Tool: Tools that support device management include BOOTP/TFTP
Server, PING/DIAP.
♦
Account: Account is a simple account management system to keep track of the
bills.
17
D-View 5.1 User’s Guide
D-View5.1
Plug-in
Modules
Alarm/Trap
Manager
Discover &
Parsing
MIB Utilities
Internet tools
Accounts
Access Database
Figure 14
Features
♦
♦
♦
♦
Graphical User Interface – D-View’s graphical interface is based on the
Windows interface. It draws symbolic icons on the screen to identify devices and
their links on the network. Pull-down and pop-up menus are used with all
command options listed.
Multiple Device Management – D-View lets you monitor and manage different
devices simultaneously. The system displays the management modules of
selected devices on a window for easy management and monitoring of these
devices. The management modules display the current status of the device and
its ports. The module also provides a menu bar for accessing commands for
retrieving MIB objects from the SNMP agent of the device.
Automatic Device Discovery – D-View discovers the network for the connected
SNMP and IP devices and then automatically groups the devices.
Map Editing – D-View provides map editing tools for tailoring the topology map
of a particular network. These tools allow you to add devices, link devices, add
labels, modify device attributes, delete map objects, and add wallpaper.
18
D-View 5.1 User’s Guide
♦
Software Download – D-View provides a TFTP server function that allows you
to configure your management console as a TFTP server on the network. As a
TFTP server, your management console will be responsible for providing image
files for downloading from your system to all requesting network devices.
Software downloading is necessary when upgrading or rebuilding software in
the Flash memory of a device.
♦ BOOTP Server Function – D-View comes with a BOOTP server function that
allows you to configure your management console as a BOOTP server on the
network. As a BOOTP server, your management console will be responsible for
assigning IP addresses to all requesting network devices.
♦ Connectivity Testing – D-View provides the Validate and ICMP PING test
facilities for checking the status and connectivity of network devices. The first
facility validates a map by checking the current status of the displayed network
devices; ICMP PING checks the connectivity of any device TCP/IP on the
network
♦ Layer 3 utilities – A number of powerful Layer 3 utilities, including IP
Forwarding, RIP 2, OSPF, IP MRoute, DVMRP, and PIM functions, have been
added to accommodate the increasing presence of Layer 3 switches and
advanced routers in enterprise networks
♦ DIAP – The DIAP proprietary administrative protocol used in D-Link SOHO
broadband routers has been added so you do not need any additional utility to
administer these devices.
♦ Accounts – An array of Accounts information functions has been added for
client record maintenance.
♦ Topology – A topology creation program is an embedded function of D-View.
This can be used to create diagrams and schematics useful for network design
and layout planning.
♦ SNMP V3 for major MIBs – MIB II, IF-MIB(RFC2233), Entity MIB(RFC2737),
Bridge 802.1D(RFC1493), RMON,802.1P(RFC2674), 802.1Q(RFC2674).
♦ Trap/Alarm notification via e-mail.
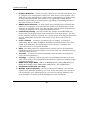
♦ Multiple views for platform – After Auto Discover is finished, you can view
objects in the Ethernet domain by tree view. At the same time, you can have a
list view display open. Additionally you can create a topology domain in the
same workspace to make network management more convenient.
19
D-View 5.1 User’s Guide
Figure 15
♦
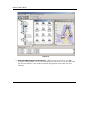
Powerful MIB Compiler and Browser – With an easy to use GUI, the MIB
Compiler and Browser can be used independent of D-View or can be used with
the D-View software. This makes network management more effective and
efficient.
20
D-View 5.1 User’s Guide
Figure 16
21
D-View 5.1 User’s Guide
Figure 17
♦
User Account management – Account is a simple account management system
to keep track of the bills.
22
D-View 5.1 User’s Guide
It has the following features:
1.
Each client assigned an account with personal authorization IP
Address
2.
Different groups of clients can generate statements with different
schedules
3.
Detects abnormal usage for clients
4.
Assigns custom taxes to service charges
5.
Credit adjust function
allow you to insert credit records
manually and give credit for wrong or misdialed work.
6.
Late fee assessment function
7.
Real-time reporting
23
D-View 5.1 User’s Guide
3
H OW TO M ANAGE A N ETWORK
U SING D-V IEW 5.1
This chapter describes how to use the various menus and operations found in the DView Network Management System with different example scenarios.
Orientation
Using D-View
D-View uses the same conventions as other Windows-based programs in its GUI. Leftclick to select a device or domain, left-click to carry out a function from the drop-down
menu, and so on. If you double-click on an SNMP device, this will launch the devicespecific module if it is installed. If it is not installed, you will be offered an opportunity
to download the module from the D-Link website.
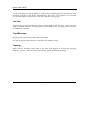
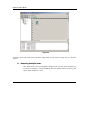
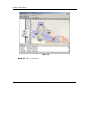
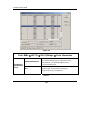
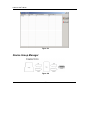
The three display panels of the D-View Main Menu:
24
D-View 5.1 User’s Guide
Smart Icons
Tree View
List View
Messages/Trap
Figure 18
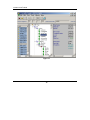
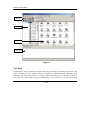
Tree View
Presents the entire network grouped into major domains extending from Root. The
major domains for the default setup are Ethernet, CompanyGroup, Favorites, and
Topology. The Favorites group is a vacant domain available as a convenient means of
tracing devices that require frequent monitoring. It can contain any or all devices and
25
D-View 5.1 User’s Guide
can be arranged into sub-domains as needed. The Company group is divided into subdomains according to the device manufacturer. The “tree” in this panel or any domain
can be expanded or contracted to view the contents of any group.
List View
Displays the contents of whatever group is highlighted in the tree view. Large icons are
used by default; however, you may choose to use small icons, a simple list or a list that
includes device details.
Traps/Messages
Displays Trap and connect/disconnect messages.
Use the View drop-down menu to customize the display panels.
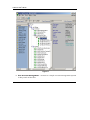
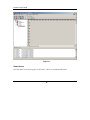
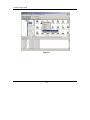
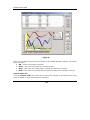
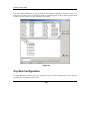
Topology
Right-click on Topology under Root in the Tree View display to launch new topology
diagram. Use the “Tool” pad and “User Define” pad to modify the topology.
26
D-View 5.1 User’s Guide
Figure 19
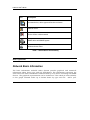
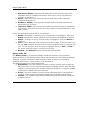
Smart Icons
The five main icons that appear in D-View 5.1 GUI are summarized below.
27
D-View 5.1 User’s Guide
Icon
Description
Unknown device, device type and function not known.
RADIUS server.
Device off line or disconnected.
SNMP device with SNMP agents.
Wireless Access Point
Table 1. General Device Icon Summary
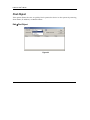
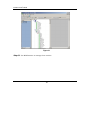
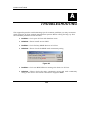
Basic Operations
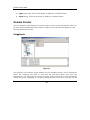
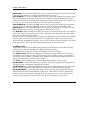
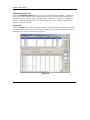
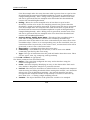
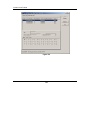
Network Basic Information
The basic information available under System provides graphical and numerical
information about device type and role distribution. The information represents the
sum total of the basic information communicated by every device including non-SNMP
devices. The graphical representation can be viewed as a color-coded pie chart (default)
or bar graph. Network make up is broken down by type and role. Select your
28
D-View 5.1 User’s Guide
preference of graph style by clicking the graph icon of choice in the middle of the menu.
View network role or type distribution by selecting the appropriate tab. The reference
key explains the colors used for the graphs and displays the number of devices in each
category.
SystemÆAll Basic Information
Figure 20
29
D-View 5.1 User’s Guide
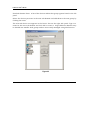
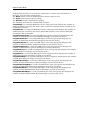
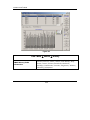
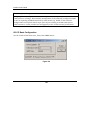
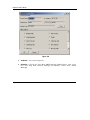
Repolling Configuration
By default D-View polls the network for status updates every 30 seconds. This repolling
configuration can be changed or turned off using the Repolling Configuration menu
under System. Adjust the polling interval from 10 to 60 and the time out (1-10 seconds)
and click the Set button to put the settings into effect. Turn off repolling by checking
the Don’t Repoll box and clicking Set. Default repolling configuration = 30 sec Interval,
3 sec Time Out.
SystemÆRepolling Configuration
Figure 21
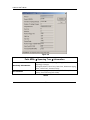
Community String Configuration
Set the Read and Write Community String to allow D-View management access to
SNMP devices.
SystemÆCommunity String Configuration
♦
Read Community String: input read community string
♦
Write Community String: input write community string
♦
OK: click to put settings into effect
30
D-View 5.1 User’s Guide
Figure 22
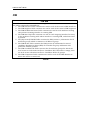
Note: Read/Write Community String settings must be correct otherwise you will not be
able to find devices.
Saving D-View Database
Save the current settings arrangement for D-View using the Save Database function
located under System. This will save any domains that have been created.
SystemÆSave To Database
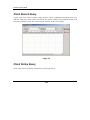
Clear Database
To delete the saved arrangements and settings, use the Clear Database function under
system.
SystemÆClear Database
Note: Make sure that the database is one you wish to clear otherwise you will lose your
settings (Topology and Favorites).
31
D-View 5.1 User’s Guide
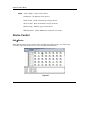
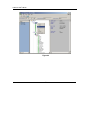
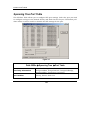
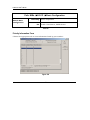
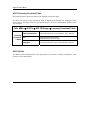
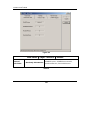
Find Object
This option allows the user to quickly find a particular device in the system by entering
Alias Name, IP Address, or Module Name.
EditÆFind Object
Figure 23
32
D-View 5.1 User’s Guide
♦
Input Search By: Select Alias Name, IP Address, or Module Name.
♦
Input String: Enter Alias Name, IP Address, or Module Name.
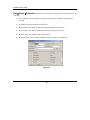
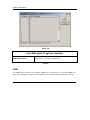
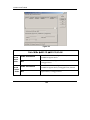
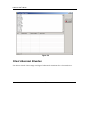
Domain Control
Select a domain or sub-domain in D-View to add or create a new sub-domain. This can
be done under the Edit drop-down menu or right click on the selected domain to view
the New Sub-domain Form.
EditÆDomain
Figure 24
For example, the Company Group domain can be expanded using a list of companies.
Select the company you wish to add from the pull-down menu and click OK.
Alternatively, you may select a specific company group and create a new sub-domain
within that group. Highlight the company group from the main menu and pull up the
33
D-View 5.1 User’s Guide
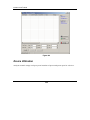
New Sub-domain Form. A list of the devices within that group appears listed in the left
panel.
Select the devices you want in the new sub-domain and add them to the new group by
clicking the arrow
The selected device now appears in the Device List on the right side panel. Type in a
name for the new sub-domain and click OK to create it. Large Ethernet domains may
be divided into smaller work groups and are more easily managed using this function.
Figure 25
34
D-View 5.1 User’s Guide
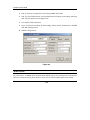
EditÆNew Device
You may create a new device to be managed along with the other domains that already
exist via the New Device option. Enter the Device name, IP Address, Read/Write
Community Strings, Module Type, and check appropriate boxes in the MIB Database.
Figure 26
35
D-View 5.1 User’s Guide
Input Device Name: name of the device
IP Address: IP address of the device
Read Comm: Read Community string of device
Write Comm: Write Community string of device
Module Type: Module type of new device
MIB Database: Check MIBs that comprise new device
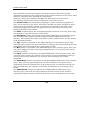
Device Control
EditÆDevice
Through the Device menu item under the Edit drop-down menu, you may keep
inventory and edit the devices in your management database.
Figure 27
36
D-View 5.1 User’s Guide
EditÆDeviceÆProperties allows you to control the settings of a particular device by
entering
♦
Device Name: Name of device usually in the form of numbers separated by
periods.
♦
IP Address: The IP address of the device.
♦
Read Comm: The Read Community String setting of the device.
♦
Write Comm: The Write Community String setting of the device.
♦
Module Type: The Module type of the device.
♦
MIB Database: Check boxes of MIBs of which device are comprised.
Figure 28
37
D-View 5.1 User’s Guide
Press OK to execute property settings or Cancel to cancel.
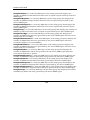
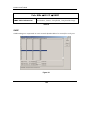
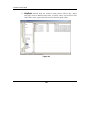
Multiple View Settings in D-View
1. ViewÆTopology ViewÆ50 % , 75% , 100% , 125% , 150% , Custom
Allows you to have different views of the topology.
Figure 29
38
D-View 5.1 User’s Guide
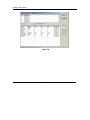
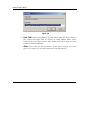
ViewÆTopology ViewÆBackground Color
Allows you to set background color of the topology.
ViewÆTopology ViewÆGrid
Gives you the option of having a grid on the topology.
2. ViewÆTree View
Allows you to see devices in the management network displayed in a tree
on the left panel.
3. ViewÆList View
Allows you to view devices in different ways: Icon, Small Icon, List,
Report.
39
D-View 5.1 User’s Guide
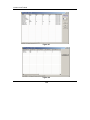
4. ViewÆMessages/Traps View
Allows you to view messages and traps on the bottom panel of the
display screen.
5. ViewÆ Background Color
Allow you to set the background color for the Tree View, List View,
Messages, and Traps displays.
Figure 30
40
D-View 5.1 User’s Guide
Device SNMP Configuration
You can change the SNMP configuration of the device. Otherwise, you will use the
default settings.
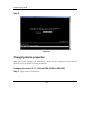
Starting Off in D-View 5.1
When D-View is run the first time it will automatically search all around the net
domain and parse the contents in the network. It then creates a database to store the
data and creates tree lists, icon lists and the like in its work area.
Since this default search is just a rough search with quick response time it usually
loses some hosts. Hosts not discovered the first time could be found using the Discover
functionality by giving it a net domain and using unicast SNMP rule. You can search
more thoroughly using Discover but this search will be slower than the initial one.
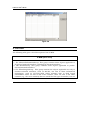
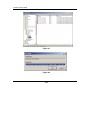
Discover
Use this menu to search for a single device or several devices using the IP address or a
selected range of IP addresses.
In the Discover window, define the following variables:
♦
IP Address – Type in a range of IP addresses or a single IP address (in both
“From” and “To” spaces). Keep in mind that the time needed to do the search
increases as the range of addresses searched becomes larger.
♦
SNMP Read – Type in the read community string.
♦
Time Out – Range variable from 1000 to 10,000 milliseconds
41
D-View 5.1 User’s Guide
♦
Search Approach – Select Unicast (default) or Broadcast. A Broadcast request
is not IP address specific and will cause every device connected at the moment
of broadcast to reply.
♦
Discover Scheme – Select SNMP or ICMP. ICMP will only report the IP address
of connected devices. SNMP discoveries reply with available device information.
♦
Search Method – Choose to find a single SNMP agent defined below by the
Enterprise ID or all agents in the previously refined search field.
Click on the Start button to begin the discover process. Unicast discovery will send
Ping packets to the selected range of IP addresses in ascending consecutive order and
repost each reply as it is received. Use the Save & Exit button to insert the device into
the Tree View.
42
D-View 5.1 User’s Guide
Figure 31
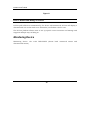
How to Monitor and Manage a Network
D-View polls all devices automatically. If a device is disconnected, D-View will display a
disconnected icon in the work area. Otherwise, it will show a device icon.
The D-View platform allows users to set up special cases to monitor and manage and
supports multiple ways of doing so.
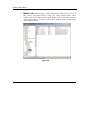
Monitoring Device
Monitoring Device 10.1.1.194 DES-3225G (shows both connected status and
disconnected status).
43
D-View 5.1 User’s Guide
Connected
Figure 32
Disconnected (When device does not respond during Repolling)
44
D-View 5.1 User’s Guide
Figure 33.
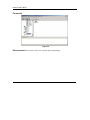
Managing Device
Using “Web Configure”
Step 1: Right click on mouse to execute “Web Configure”
45
D-View 5.1 User’s Guide
Figure 34
46
D-View 5.1 User’s Guide
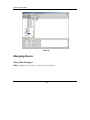
Step 2:
Figure 35
Using the “D-View Module”
Double-click on the device Icon or right-click on “D-View Module” to execute:
47
D-View 5.1 User’s Guide
Figure 36
48
D-View 5.1 User’s Guide
Figure 37
Using Telnet
Right-click on mouse to execute Telnet.
49
D-View 5.1 User’s Guide
Step 1
Figure 38
50
D-View 5.1 User’s Guide
Step 2
Figure 39
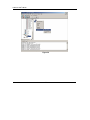
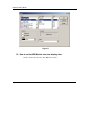
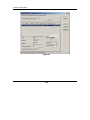
Changing device properties
When you need to modify an IP address for a device use the “Properties” menu item on
the device pop-up menu to change its identity.
Changing the device 10.1.1.194 from DES-3225G to DES-3226
Step 1: Right-click on “Properties.”
51
D-View 5.1 User’s Guide
Figure 40
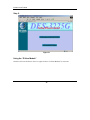
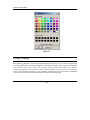
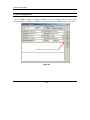
Step 2: Press the “Type” Button.
52
D-View 5.1 User’s Guide
Figure 41
Step 3: Select D-Link and DES-3226. Then Press OK.
53
D-View 5.1 User’s Guide
Figure 42
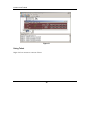
Step 4: Properties have been changed.
54
D-View 5.1 User’s Guide
Figure 43
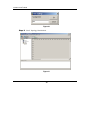
Collect Trap Information to Log File
The user can log the trap history. The trap filename and path is
/DLINK_INSTALL_PATH/var/log/trap.log. The user can clear it by using any editor to
view and clear it.
55
D-View 5.1 User’s Guide
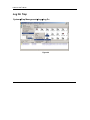
Log On Trap
SystemÆTrap ManagementÆLogÆLog On
Figure 44
56
D-View 5.1 User’s Guide
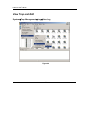
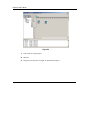
Log Off Trap
SystemÆTrap ManagementÆLogÆLog Off
Figure 45
57
D-View 5.1 User’s Guide
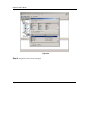
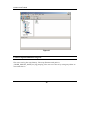
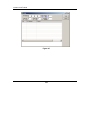
View Trap and Edit
SystemÆTrap ManagementÆLogÆView Log
Figure 46
58
D-View 5.1 User’s Guide
Figure 47
Note:
For more on trap management functions please refer to Chapter 6: Advanced Management.
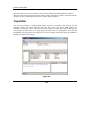
Install Plug-in Management Module
If you need more management modules for devices, install the plug-in management
module. You can get modules from http://www.dlink.com.tw where all D-View
supported modules can be found. You can download all of these modules. When the
module has been installed, double-click on your chosen icon and a device panel will
appear. To date D-View supports many kinds of D-Link SNMP products. You are
welcome to visit the D-Link web page for more information.
Installing Plug-in DES-3326 Device Module
Step 1
59
D-View 5.1 User’s Guide
Figure 48
Step 2
Figure 49
60
D-View 5.1 User’s Guide
Step 3
Figure 50
61
D-View 5.1 User’s Guide
Step 4
Figure 51
62
D-View 5.1 User’s Guide
Step 5
Figure 52
63
D-View 5.1 User’s Guide
Step 6
Figure 53
64
D-View 5.1 User’s Guide
Step 7
Figure 54
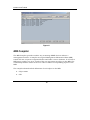
Managing SNMP Devices Without a Management Module
Background on MIBs
The Management Information Base (MIB) refers to various information describing the
physical and logical characteristics of an SNMP device. These individual pieces of
65
D-View 5.1 User’s Guide
information, called MIB objects, are kept in an SNMP device, where they can be readily
accessed and modified by the device agent at the request of the network administrator.
Basically, management is achieved through transactions between the SNMP agent on
the device and the management console. The management console sends SNMP
request packets to the agent, which in turn complies by sending response packets.
There are five types of SNMP requests: Get, GetNext, GetResponse, Set, and Trap. The
following describes some of the requests supported by the system:
GET – This request queries the SNMP agent for the current value of one or more MIB
objects in an SNMP device. The agent retrieves the values of the requested objects and
then sends them to the management console.
SET – This request asks the SNMP agent to modify the value of one or more MIB
objects in an SNMP device. Be reminded that MIB objects can be read-only, read-write,
write-only, or not-accessible. Read-only MIBs are either fixed constants or changing
variables such as the number of ports in a bridge or hub and number of packets
passing through a port. Read-write MIBs are variables usually related to userconfigurable parameters such as the IP address and name of the device. Since you can
only set read-write and write-only MIB objects, the SET request therefore can only be
used on these types of objects.
MIB objects are logically arranged in a hierarchy called a MIB tree structure. The name
of each MIB object, called MIB object ID, in the hierarchy is the sequence of numeric
labels on the nodes along a path from the root down to the actual MIB object. The
actual MIB object is the last node in the path.
GET/SET Operations
When the management console needs to retrieve the value of a particular MIB object
from an SNMP device, it sends a GET request to the device SNMP agent and the
numerical representation of the target MIB object. For example: if the management
console wants to retrieve the value of the MIB object ipInReceives from a device, it
sends a GET request to the device SNMP agent followed by the numerical
representation of the MIB object, which is 1.3.6.1.2.1.4.3.0. The agent uses this value
to search for the corresponding value of the specified MIB object and then sends the
value to the requesting management console.
66
D-View 5.1 User’s Guide
When the management console needs to modify the value of a particular MIB object, it
sends a SET request to the device SNMP agent and the numerical representation of the
target MIB object followed by the new value.
For example, if the management console wants to assign a new name to a device, it
sends a SET request to the device SNMP agent followed by the numerical
representation of the sysName MIB object, which is 1.3.6.1.2.1.1.5.0. This is then
followed by the corresponding value of the new name. The agent uses the provided
values to search for the specified MIB object in the device and then sets its value
accordingly.
MIB Listing
Normally, related MIB objects are listed in a group called Object Group. Each group
contains an Object ID, Syntax, Access Right, Status, and Description. The following
describes each term:
♦ Object ID – This is the numeric representation of the MIB object in the tree.
♦ Syntax – This specifies the object type (that is, integer, string, counter, etc.).
♦ Access Right – This specifies the access right of the MIB object.
♦ Status – This provides information about the status of the MIB object. It can be
mandatory, optional, obsolete, or deprecated. Mandatory means that the object
must be implemented (standard MIBs always have this status), optional means
that the object may be implemented, obsolete indicates the object is no longer
supported, and deprecated indicates the object is soon to be phased out.
♦ Description – This usually describes the function of the MIB object.
Here is a sample of a standard MIB-II listing:
Object Group: system
MIB sysUpTime
OBJECT-ID (1.3.6.1.2.1.1.3.0)
SYNTAX TimeTicks
ACCESS read-only
STATUS mandatory
DESCRIPTION The time (in hundredths of a second) since the network management
portion of the system was last re-initialized.
67
D-View 5.1 User’s Guide
MIB Browser
When you need to manage a SNMP device without a plug-in module in the D-View
platform use a D-View supported MIB browser with the associated MIBs. Right-click on
the chosen icon and you will see a “Properties” item on the pop-up menu. Click it and a
dialog box will appear with an area listing many MIBs with checkboxes. Select which
MIBs the device supports. Then click OK. Go back to the work area, right-click on the
icon again. Select “MIB browser.” This will invoke the MIB browser with the MIBs that
you selected. Now you can use the MIB browser to manage devices.
Note: Before using the MIB browser, you have to retrieve MIB files from a vendor who develops
SNMP devices. You can then use the MIB compiler to compile MIBs. If compilation is successful, then
the MIB compiler will store MIBs to database, and you will see the entire MIBs list under device
properties.
How to Use the MIB Browser
Step 1: Choose the device you wish to browse, right-click to bring up a menu and
left-click on “Properties.”
68
D-View 5.1 User’s Guide
Figure 55
Step 2: Enter settings and press OK.
69
D-View 5.1 User’s Guide
Figure 56
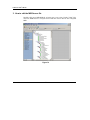
Step 3: Open “MIB Browser.”
70
D-View 5.1 User’s Guide
Figure 57
71
D-View 5.1 User’s Guide
Figure 58
Step 4: Double-click on RFC1213-MIB.
72
D-View 5.1 User’s Guide
Figure 59
Step 5: Use MIB Browser to manage these entities.
73
D-View 5.1 User’s Guide
Figure 60
74
D-View 5.1 User’s Guide
Figure 61
MIB Compiler
The MIB Compiler provides another way to manage SNMP devices without a
management module. It compiles an original Management Information Base (MIB)
textual file into a system recognized format and loads it into a database. It converts a
MIB into a graphic tree view. A node of the tree represents an object in the MIB. The
relationship between nodes of the tree reflects OIDs of corresponding objects in the
MIB.
The compiler shows detailed definitions of each object in the MIB:
♦
Object name
♦
OID
75
D-View 5.1 User’s Guide
♦
Module to which the object belongs
♦
Syntax
♦
Access limit
♦
Status
♦
Description, and so on.
The compiler can communicate with a remote device (bridge, switch, or router) to get
the current value or to set a new value for the MIB object of interest. This is achieved
by sending SNMP requests and receiving SNMP responses to get/set the value of the
object of the MIB, which resides in an SNMP enabled device.
Note: Not every MIB needs to be implemented in an SNMP-enabled device.
The current values of the MIB objects of a specific device can be obtained in two ways:
“Info” or “Table View.” “Info” shows more detailed information for objects, both
definitions and values. “Table view” shows only the values of objects.
How to Use the MIB Complier
Step 1: Invoke the MIB Compiler.
76
D-View 5.1 User’s Guide
Figure 62
Step 2: Open the MIB File.
77
D-View 5.1 User’s Guide
Figure 63
78
D-View 5.1 User’s Guide
Figure 64
Step 3: Compile the MIB file.
79
D-View 5.1 User’s Guide
Figure 65
80
D-View 5.1 User’s Guide
Figure 66
More on the MIB Compiler
1. How to find the MIB values of a device.
Step 1: Enter Device IP Address by entering the Browser Agent IP address,
Read and Write Community settings. Then left-click on the MIB module you
wish to view.
81
D-View 5.1 User’s Guide
Figure 67
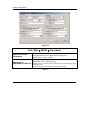
Step 2: Right-click on object and execute “Info.”
82
D-View 5.1 User’s Guide
Figure 68
Left-click on “If Table.” Then left-click on “Table View” to display values.
83
D-View 5.1 User’s Guide
Figure 69
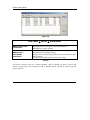
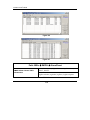
2. How to set Device MIB values.
After completing 1, left-click on “MIB Entry.” Execute “Set” or “Set Table” to set
MIB values. Or double click on “Entry.”
84
D-View 5.1 User’s Guide
Figure 70
Figure 71
85
D-View 5.1 User’s Guide
3. How to edit the MIB Source file:
Double-click on a MIB Module to bring up a tree-view. Under “View” leftclick on “MIB Source” and proceed to edit the source file for the compiled
MIB.
Figure 72
86
D-View 5.1 User’s Guide
Figure 73
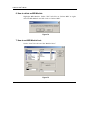
4. How to print an MIB Source file:
After opening the MIB Source file by left-clicking “MIB Source” under
File left-click on “Print.”
5. How to save an MIB Source file:
Under “File” left-click on “Save” or “Save As.”
87
D-View 5.1 User’s Guide
6. How to delete an MIB Module:
Highlight MIB Module. Under “File” left-click on “Delete MIB” or rightclick on MIB Module and left-click on “Delete MIB.”
Figure 74
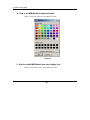
7. How to set MIB Module font:
Under “View” left-click on “Set Module Font.”
Figure 75
88
D-View 5.1 User’s Guide
8. How to set MIB Module background color:
Under “View” left-click on “Set Module Color.”
Figure 76
9. How to set the MIB Module tree-view display font:
Under “View” left-click on “Set MIB Tree Font.”
89
D-View 5.1 User’s Guide
Figure 77
10. How to set the MIB Module tree-view display color:
Under “View” left-click on “Set MIB Tree Color.”
90
D-View 5.1 User’s Guide
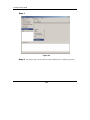
Figure 78
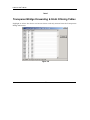
Creating a Topology
The Topology diagram creation program included with D-View 5.1 is used to graphically
represent planned or existing networks to aid network design. This program is designed
to be flexible and easy to use. The primary tool for this application is the mouse.
Topology diagrams can incorporate user created symbols. You can also use live device
icons copied from any domain in the network. The diagrams may be further customized
with user selected icons and bitmap files used for the background.
91
D-View 5.1 User’s Guide
Create a New Topology
To create a new topology right-click on the Topology icon in the Tree View display
panel.
Step 1: Right-click on “Topology.”
Figure 79
Step 2: Name New Topology.
92
D-View 5.1 User’s Guide
Figure 80
Step 3: “New” Topology Established.
Figure 81
93
D-View 5.1 User’s Guide
Manipulating Icons and Images
Use the “Tool” pad and “User Define” pad under the tool bar to manipulate icons and
images in your new topology.
Figure 82
1. Tool tab
The Tool tab presents a number of tools used to select and move items in the
diagram. This guide discusses its functions from left to right order on the tab.
Left-click on “Tool” icon to bring up Tool tab:
94
D-View 5.1 User’s Guide
Figure 83
a. Connecting Objects
Objects can be connected using a choice of visually distinct lines, solid
lines, dotted lines etc. These lines will remain attached to the connected
objects if the object is moved around the diagram.
To connect objects first click on the “line” icon in the toolbar. Clicking on
the “down” arrow to the right of the line icon gives you a choice of lines
to use in your drawing.
95
D-View 5.1 User’s Guide
Figure 84
1. Left-click on origin object.
2. Release.
3. Drag line from point of origin to destination object.
96
D-View 5.1 User’s Guide
Figure 85
1. Left-click on destination object.
2. A line should appear connecting both objects.
97
D-View 5.1 User’s Guide
Figure 86
Note: You need to click on open space to discontinue drawing. Otherwise, you will continue
to be in drawing mode. You can also double-click on the line drawn to undo.
b. Creating a new domain
You can click on the white bubble to place a new domain on the
topology.
98
D-View 5.1 User’s Guide
Figure 87
c. Writing text
Left-click on the text tool “T” to select the text option then left-click again
on diagram to place a text box on the diagram.
99
D-View 5.1 User’s Guide
Figure 88
Left-click once on the text to move text around. Text will be highlighted in red
rectangle.
100
D-View 5.1 User’s Guide
Figure 89
Left-click twice on the mouse to edit the text.
101
D-View 5.1 User’s Guide
Figure 90
To delete text, left-click once and then right-click on the text to bring up the “Delete”
option.
d. Selecting multiple items
The multi-select tool (rectangular-shaped icon on tool pad) enables you
to select a number of items (holding the left button down to select) and
move these items as a unit.
102
D-View 5.1 User’s Guide
e. Selecting individual items
You can click on the “hand” icon to select individual items.
2. User Define Tab
Importing Icons
Icons from any of the domains may be used in the diagram simply by
selecting and copying them and pasting it into the new diagram.
Step 1: Left-click on “New” under “User Define.”
Figure 91
103
D-View 5.1 User’s Guide
Step 2: Allows you to bring up icon to be imported.
Figure 92
Step 3: Drag domain icon into workspace. Pictured below is the default
D-Link “New Object” icon.
104
D-View 5.1 User’s Guide
Figure 93
An Example: Creating a Topology Diagram
Step 1: Click on New Topology.
105
D-View 5.1 User’s Guide
Figure 94
Step 2: Name new topology and press OK.
Figure 95.
Step 3: New Topology created:
106
D-View 5.1 User’s Guide
Figure 96
Step 4: Import background picture by clicking on “New Background Picture.”
107
D-View 5.1 User’s Guide
Figure 97
Step 5: Import .jpg or .bmp file.
108
D-View 5.1 User’s Guide
Figure 98
Step 6: Set background size and press OK.
Figure 99
Step 7: Background picture imported.
109
D-View 5.1 User’s Guide
Figure 100
Step 8: You can drag devices directly from Tree View onto the Topology
diagram or copy and paste.
110
D-View 5.1 User’s Guide
Figure 101
Step 9: Use the line function on the tool pad to connect devices in the topology
drawing and set colors.
111
D-View 5.1 User’s Guide
Figure 102
Step 10: Save to Database.
112
D-View 5.1 User’s Guide
Figure 103
113
D-View 5.1 User’s Guide
4
MIB U TILITIES
This chapter explains how to use MIBs tools and other utilities located under the MIBs
drop-down menu. It is organized according to the top to bottom, left to right order of
the menu items. These menus will allow you to view statistics and to configure Layer 2
and Layer 3 functions. For many of the menu items an information table (RFCs—
technical reports called Internet Requests for Comments) is presented along with a
path diagram to illustrate how to utilize the particular functionality.
Note: In order to use MIB Utilities you need to first select an SNMP-enabled device.
The menus in this group include:
♦
Device SNMP Configuration
♦
MIB II Information and Statistics Windows
♦
IF MIB Information Tables
♦
Entity MIB Information Tables
♦
Bridge 802.1d Information and Port Configuration Table
♦
Spanning Tree Information and Port Configuration Table
♦
Transparent Bridge Forwarding and Static Filter Tables and Port Counter
♦
RMON Statistics, History and Event Windows
114
D-View 5.1 User’s Guide
♦
802.1p Priority Configuration Including GMRP and GARP
♦
802.1Q VLAN Information and Configuration Including Forwarding/Filtering
and Unicast/Multicast Configuration
♦
Port VLAN Traffic Statistics
♦
Layer 3 Utilities Including IP Forwarding, RIP2, OSPF, IP Multicast, DVMRP
and PIM Configuration
♦ SNMP Configuration
Figure 104
MIB II Menus
By convention, all SNMP devices implement MIB-II objects for management information
that are common among these devices. You can read these MIB objects and modify
115
D-View 5.1 User’s Guide
their respective values depending on your specific needs. Modifications though can only
be performed on MIB objects with read-write or write-only attributes. To access MIB-II
objects from an SNMP device, perform these steps:
1. Select the corresponding icon of the device from the map.
2. From the General menu, choose MIB II.
Information
Choosing this command displays the MIB-II Information dialog box:
The following describes each MIB object:
SysDescr is a read-only MIB object of the system group that provides textual
description of the device. These include the name and version identification of the
device hardware, software operating system, and networking software.
SysOID is a read-only MIB object of the system group that specifies the corresponding
enterprise ID of the device.
SysUpTime is a read-only MIB object of the system group that displays the time since
the network management portion of the device was last re-initialized.
SysName is a read-write MIB object of the system group that allows you to specify a
name for the device. By convention, this will be the device domain name. For
information on how to set this object, see the discussion below.
SysLocation is a read-write MIB object of the system group that allows you to specify
the actual location of the device. For information on how to set this object, see the
discussion below.
SysContact is a read-write MIB object of the system group that allows you to specify
the person to contact in case problems are encountered in the device. For information
on how to set this object, see the discussion below.
Network Interfaces correspond to the IfNumber MIB object of the interface group. This
read-only object displays the total number of interfaces (regardless of their current
states) available on the device.
First NI PhysAddress corresponds to the IfPhysAddress MIB object of the interface
group. This read-only object displays the MAC address of the device interface at the
protocol layer immediately below the network layer in the protocol stack. Hubs usually
have one interface, whereas routers have more than one.
Forwarding State corresponds to the IpForwarding MIB object of the ip group. This
read-write object indicates whether or not the device is acting as an IP gateway in
116
D-View 5.1 User’s Guide
respect to the forward ing of received datagrams that are not addressed to the device. IP
gateways forward datagrams, while IP hosts do not (except those sourcerouted via the
host).
IP Time-to-Live corresponds to the IpDefaultTTL MIB object of the ip group. This readwrite object displays the default value inserted into the Time-To-Live field of the IP
headers of the datagrams originating from the device when a TTL value is not supplied
by the transport layer protocol.
IP Reasm Timeout corresponds to the IpReasmTimeout MIB object of the ip group.
This read-only object displays the maximum time (in seconds) received fragments are
held while awaiting reassembly at the device.
SNMP Authentication corresponds to the SnmpEnableAuthenTraps MIB object of the
snmp group. This read-write object allows you to specify whether or not the SNMP
agent of the device is permitted to generate authentication-failure traps. For
information on how to set this object, see the discussion below.
The Refresh button refreshes the table. You need to refresh the table once in a while to
ensure all updates performed by other network administrators on the displayed objects
are reflected on this table. Be reminded that you are not the only one managing the
device.
The Set button sets those MIB objects above with read-write attributes. To set some of
the MIB objects (above) with read-write attributes, follow these steps:
1. From the MIB-II Information dialog box, click the Set button. The MIBII
Configurations dialog box appears on the screen:
2. This dialog box displays the configurable MIB objects with their
respective current values. Name, Location, Contact, and Enable SNMP
Auth Traps correspond to the SysName, SysLocation, SysContact, and
SnmpEnableAuthenTraps MIB objects.
3. In the Name text box, type in the new name you want to assign to the
device. Remember that this new name will also be used as the device
domain name.
4. In the Location text box, specify the actual location of the device.
5. In the Contact text box, type in the name and probably the telephone
number of the person to contact in case problems occur in the device.
6. Click Set button to set new value to device.
117
D-View 5.1 User’s Guide
Figure 105
The remaining menus under MIB II are the following read-only table and counter
windows (examples pictured on next page):
♦
♦
♦
♦
♦
♦
♦
♦
IF Table
IF Counters
IP Counters
IP Routing
IP Address Table
ICMP Counters
UDP Counters
SNMP Counters
MIB II Read-only Windows
IF Table
118
D-View 5.1 User’s Guide
This command accesses the contents of the device IF table. This table provides
information pertaining to the configuration of the various interfaces on the device. Each
interface is assumed to be attached to a subnetwork.
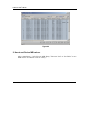
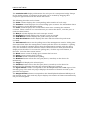
When you choose this command, the MIB-II IF Table appears on the screen:
The following describes the various components on the above screen:
The interface table lists information pertaining to various interfaces (regardless of
their current states) on the device. This table is divided into twelve columns as listed
below. Except for the Index column at the far left, all columns in this table can be
resized by dragging their respective right borders with the mouse left button. The
following describes each column:
The Index column displays the corresponding index number of each entry. Each entry
corresponds to a specific interface on the device.
The Description column corresponds to the IfDescr MIB object of the interface group.
This read-only object displays textual strings containing information about the
interface. These include the name of the device vendor, product name, and the version
of the hardware interface.
The Type column corresponds to the IfType MIB object of the interface group. This
read-only object displays the type of interface according to the physical/link protocol(s)
immediately below the network layer in the protocol stack.
The Mtu column corresponds to the IfMtu MIB object of the interface group. This readonly object displays the size of the largest datagram that can be sent/received on the
interface (in octets).
The Speed column corresponds to the IfSpeed MIB object of the interface group. This
read-only object displays an estimate of the interface’s current bandwidth in bits per
second. If no accurate estimation can be made, this will display the nominal
bandwidth.
The PhysAddress column corresponds to the IfPhysAddress MIB object of the interface
group. This read-only object displays the interface’s address at the protocol layer
immediately below the network layer in the protocol stack. For interfaces that do not
have such addresses (for example, serial lines), this displays an octet string of zero
length.
The Admin Status column corresponds to the IfAdminStatus MIB object of the
interface group. This read-only object displays the desired state for the interface.
Testing state indicates that no operational packets can be forwarded on the interface.
119
D-View 5.1 User’s Guide
The Oper Status column corresponds to the IfOperStatus MIB object of the interface
group. This read-only object displays the actual operational state of the interface.
Testing state means that no operational packets can be passed.
The Last Change column corresponds to the IfLastChange MIB object of the interface
group. This read-only object displays the value of the SysUpTime object when the
interface entered its current operational state. If the current state was entered prior to
the last re-initialization of the local network management subsystem, then this displays
a zero value.
The OutputQLen column corresponds to the IfOutQLen MIB object of the interface
group. This read-only object displays the size of the interface’s output queue buffer (in
packets).
The Specific column corresponds to the IfSpecific MIB object of the interface group.
This read-only object displays a reference to the MIB definition specific to the particular
media being used to realize the interface. For example, if the interface is realized by an
Ethernet, then this displays a value that refers to the document defining objects
specific to Ethernet.
The Refresh button refreshes the table. You need to refresh the table once in a while to
ensure all hardware modifications done on the interfaces of the device are reflected on
this table.
IF Counters
This command displays the values of the device IF counters. These counters report on
the performance of the various interfaces on the device. Each interface is assumed to
be attached to a subnetwork. When you choose this command, the MIB-II IF Counters
table appears on the screen: The following describes the various components on the
above table.
The Name field displays the name of the device. This should reflect the setting on the
device SysName MIB object.
The Opened field displays the time and date when this current management session
with the selected device was started.
The IP Address field displays the IP address of the device.
The Target field identifies which part of the device this option applies to; in this case, it
applies to an interface (port).
The Samples field displays the number of times the device was polled to retrieve the
displayed values.
120
D-View 5.1 User’s Guide
The statistics table lists the values of the device IF counters. Except for the Index
column, all columns in this table can be resized by dragging their respective right
borders with the mouse left button.
The following describes each column:
The Counters column displays the various IF statistics counters. For information
about these counters, see the discussion below.
The Total column displays the accumulated count since resetting the statistics
counters. These counters are reset whenever you restart the device, reset the port, or
click the Reset button.
The Rate/s column displays the total count per second.
The Avg Rate/s column displays the average count per second.
The Peak Rate/s column displays the peak count per second.
The Peak Occurred At column displays the date and time when the peak count
occurred.
The Poll Interval buttons set the polling time of the management console. Polling time
determines how often the management console polls the device for statistics. A polling
time of 5 seconds for example means that the management console polls the device
every five seconds to retrieve statistics values. These values are then processed and
displayed on the table. To increase the polling time, click the up-arrow button; to
decrease, click the down-arrow button.
The Reset button resets all IF statistics counters back to zero.
The Pause button pauses device polling.
The InOctets counter corresponds to the IfInOctets MIB object of the interface group.
This read-only object displays the total number of octets received on the interface. This
count includes framing characters.
The InUcastPkts counter corresponds to the IfInUcastPkts MIB object of the interface
group. This read-only object displays the number of subnetwork-unicast packets
delivered to a higher-level protocol.
The InNUcastPkts counter corresponds to the IfNUcastPkts MIB object of the interface
group. This readonly object displays the number of non-unicast packets delivered to a
higher-level protocol. Non-unicast packets include subnetwork-broadcast and
subnetwork-multicast packets.
The InDiscards counter corresponds to the IfInDiscards MIB object of the interface
group. This read-only object displays the number of inbound packets that were
121
D-View 5.1 User’s Guide
discarded even though no errors were detected on them. One possible reason for
discarding such packets could be to free buffer space.
The InErrors counter corresponds to the IfInErrors MIB object of the interface group.
This read-only object displays the number of inbound packets that were not delivered
to a higher-level protocol because of errors.
The InUnknownProtos counter corresponds to the IfInUnknownProtos MIB object of
the interface group. This read-only object displays the number of packets received on
the interface that were discarded because of an unknown or unsupported protocol.
The OutOctets counter corresponds to the IfOutOctets MIB object of the interface
group. This read-only object displays the number of octets transmitted on the interface.
This count includes framing characters.
The OutUcastPkts counter corresponds to the IfOutUcastPkts MIB object of the
interface group. This readonly object displays the number of packets that were
requested by higher-level protocols to be transmitted to a subnetwork-unicast address.
This count includes those that were discarded or not sent.
The OutNUcastPkts counter corresponds to the IfOutNUcastPkts MIB object of the
interface group. This read-only object displays the number of packets that were
requested by higher-level protocols to be transmitted to a non-unicast address (nonunicast packets include subnetwork-broadcast and subnetwork-multicast packets).
This count includes those that were discarded or not sent.
The OutDiscards counter corresponds to the IfOutDiscards MIB object of the interface
group. This readonly object displays the number of packets that were discarded even
though no errors were detected on them. One possible reason for discarding such
packets could be to free buffer space.
The OutErrors counter corresponds to the IfOutErrors MIB object of the interface
group. This read-only object displays the number of outbound packets that were not
transmitted because of errors. If you want to close the MIB-II IF Counters table to
display other MIB objects from other options, just double-click its Control-menu box.
IP Counters
This command displays the values of the device IP counters. When you choose this
command, the MIB-II IP Counters table appears on the screen.
The following describes the various components on the above table:
The statistics table lists the values of the various IP counters of the device. Except for
the Index column, all columns in this table can be resized by dragging their respective
right borders with the mouse left button.
122
D-View 5.1 User’s Guide
The following describes each column:
The Counters column displays the various IP statistics counters. For information about
these counters, see the discussion below.
The Total column displays the accumulated count since resetting the statistics
counters. These counters are reset whenever you restart the device or click the Reset
button.
The Rate/s column displays the total count per second.
The Avg Rate/s column displays the average count per second.
The Peak Rate/s column displays the peak count per second.
The Peak Occurred At column displays the date and time when the peak count
occurred.
The Poll Interval buttons set the polling time of the management console. Polling time
determines how often the management console polls the device for statistics. A polling
time of 5 seconds for example means that the management console polls the device
every five seconds to retrieve statistics values. These values are then processed and
displayed on the table. To increase the polling time, click the up-arrow button; to
decrease, click the down-arrow button.
The Reset button resets all IP statistics counters back to zero.
The Pause button pauses device polling.
The Resume button resumes device polling. The following describes the various IP
counters:
IpInReceives is a read-only MIB object of the ip group that displays the number of
input datagrams that were received on the interfaces. This count includes those
received with errors.
IpInHdrErrors is a read-only MIB object of the ip group that displays the number of
input datagrams that were discarded due to errors in their IP headers. Examples of IP
header errors are bad checksums, version number mismatches, other formatting
errors, exceeded time-to-live, and errors discovered in processing IP options.
IpInAddrErrors is a read-only MIB object of the ip group that displays the number of
input datagrams that were discarded because the IP addresses in their IP header
destination fields were invalid addresses for this device. This count includes invalid
addresses and addresses of unsupported classes such as Class E. For devices that are
not IP gateways and therefore do not forward datagrams, this counter will also include
datagrams which were discarded because their destination addresses were not local.
123
D-View 5.1 User’s Guide
IpForwDatagrams is a read-only MIB object of the ip group that displays the number
of input datagrams for which this device was not their final IP destination; as a result,
an attempt was made to find a route to forward them to their final destinations. For
devices that are not IP gateways, this counter will only include those packets that were
successfully source-routed through the device.
IpInUnknownProtos is a read-only MIB object of the ip group that displays the
number of locally-addressed datagrams which were received successfully but discarded
due to an unknown or unsupported protocol.
IpInDiscards is a read-only MIB object of the ip group that displays the number of
input IP datagrams for which no problems were encountered to prevent their
continuous processing, but were discarded. One possible reason for discarding such
packets could be the lack of buffer space. This counter does not include datagrams
which were discarded while awaiting reassembly.
IpInDelivers is a read-only MIB object of the ip group that displays the number of
input datagrams which were successfully delivered to IP user-protocols (including
ICMP).
IpOutRequests is a read-only MIB object of the ip group that displays the number of
datagrams which local IP userprotocols (including ICMP) supplied to IP in transmission
requests. This count does not include datagrams included in the IpForwDatagrams
counter.
IpOutDiscards is a read-only MIB object of the ip group that displays the number of
output datagrams for which no problems were encountered to prevent their
transmission to their respective destinations, but were discarded. One possible reason
for discarding such packets could be the lack of buffer space. This count also considers
datagrams included in the IpForwDatagrams counter if they met the same discard
criterion.
IpOutNoRoutes is a read-only MIB object of the ip group that displays the number of
IP datagrams that were discarded because no routes can be found to forward them to
their destinations. This count includes all datagrams that a host cannot route because
all of its default gateways are down.
IP Routing
This command accesses the contents of the device IP routing table. This table contains
routing entries currently known to the device. When you choose this command, the
MIB-II IP Routing Table appears on the screen:
The following describes the various components on the above table:
124
D-View 5.1 User’s Guide
The routing table lists information pertaining to the routes presently known to the
device. Each entry corresponds to one route. This table is divided into fourteen
columns as listed below. Except for the Index column, all columns in this table can be
resized by dragging their respective right borders with the mouse left button. The
following describes each column:
The Index column displays the corresponding index number of each entry. Each entry
corresponds to a route.
IpRouteDest is a read-write MIB object of the ip group that displays the destination IP
address for this route. Multiple routes to a single destination can appear in the table.
An entry of 0.0.0.0 means that it is the default route.
IpRouteIfIndex is a read-write MIB object of the ip group that displays the index value
that uniquely identifies the interface on the device through which the next hop for this
route can be reached.
IpRouteMetric1 is a read-write MIB object of the ip group that displays the primary
routing metric for this route. Routing metric is the cost for taking a particular route; it
is used primarily to configure preferred paths. Preferred paths assume relatively low
metrics, while less preferred paths assume higher metric values. If the route does not
use this particular metric, a -1 appears in this column.
IpRouteMetric2 is a read-write MIB object of the ip group that displays the alternate
routing metric for this route.
IpRouteMetric3 is a read-write MIB object of the ip group that displays the alternate
routing metric for this route.
IpRouteMetric4 is a read-write MIB object of the ip group that displays the alternate
routing metric for this route.
IpRouteNextHop is a read-write MIB object of the ip group that displays the IP address
of the next hop for this route. Next hop is the immediate IP gateway after the device
that leads to the destination.
IpRouteType is a read-write MIB object of the ip group that displays the route type.
Route type can be Direct, Indirect, Invalid, or Other. The first two refer to direct and
indirect routing in the IP architecture; Invalid means the route is invalid (the system
ignores all entries of such type); Other means the route is none of the types mentioned
above.
IpRouteProto is a read-only MIB object of the ip group that displays the routing
mechanism through which this route was learned. Routing mechanism can be local
(manually added route), netmgmt (via network management protocol), icmp (obtained
via ICMP), egp, ggp, hello, rip, is-is, es-is, ciscoIgrp, bbnSpfIgp, ospf, or bgp.
125
D-View 5.1 User’s Guide
IpRouteAge is a read-write MIB object of the ip group that displays the time since this
route was last updated or otherwise determined to be correct.
IpRouteMask is a read-write MIB object of the ip group that displays the subnet mask
for the destination IP address of this route. This mask is used to identify the subnet
field of an IP address. Depending on the internet class, subnet mask can be 255.0.0.0
for Class A, 255.255.0.0 for Class B, or 255.255.255.0 for Class C.
IpRouteMetric5 is a read-write MIB object of the ip group that displays the alternate
routing metric for this route. Routing metric is used to configure preferred paths.
IpRouteInfo is a read-only MIB object of the ip group that displays a reference to the
MIB definition specific to the routing protocol used for this route.
The Refresh button refreshes the table. You need to refresh the table once in a while to
ensure all updates performed on the device (specially those that affect the above MIB
objects) are reflected on this table.
For this option, the system does not support modifications to the settings of those MIB
objects (above) with read-write attributes. To modify these objects, you can use the
device-specific management module, or the device onboard console program (if it comes
with one). Please refer to the appropriate manuals for more information.
IP Address Table
This command accesses IP addressing information from the device IP address table.
Choosing this command displays the MIB-II IP Address Table:
The following describes the various components on the above table:
The address table displays IP addressing information about the device. This table is
divided into six columns as listed below. Except for the Index column, all columns in
this table can be resized by dragging their respective right borders with the mouse left
button. The following describes each column:
The Index column displays the corresponding index number of each entry.
IpAdEntAddr is a read-only MIB object of the ip group that displays the IP address to
which the entry’s addressing information pertains.
IpAdEntIfIndex is a read-only MIB object of the ip group that displays the index value
which uniquely identifies the interface on the device to which this entry applies.
IpAdEntNetMask is a read-only MIB object of the ip group that displays the subnet
mask associated with the IP address of this entry. This mask is used to identify the
subnet field of an IP address. Depending on the internet class, subnet mask can be
255.0.0.0 for Class A, 255.255.0.0 for Class B, or 255.255.255.0 for Class C.
126
D-View 5.1 User’s Guide
IpAdEntBcastAddr is a read-only MIB object of the ip group that displays the value of
the least-significant bit in the IP broadcast address used for sending datagrams on the
interface (logical) associated with the IP address. For example, when the Internet
standard all-ones broadcast address is used, the value will be 1. This value applies to
both the subnet and network broadcast addresses used by the device on the interface
(logical).
IpAdEntReasmMaxSize is a read-only MIB object of the ip group that displays the size
of the largest IP datagram that this device can reassemble from IP fragmented
datagrams received on the interface.
The Refresh button refreshes the table. You need to refresh the table once in a while to
ensure all updates performed on the device (specially those that affect the above MIB
objects) are reflected on this table.
ICMP Counters
This command displays the values of the device ICMP counters. When you choose this
command, the MIB-II ICMP Counters table appears on the screen:
The following describes the various components on the above table:
The statistics table lists the values of the device ICMP counters. Except for the Index
column, all columns in this table can be resized by dragging their respective right
borders with the mouse left button. The following describes each column:
The Counters column displays the various ICMP statistics counters. For information
about these counters, see the discussion below.
The Total column displays the accumulated count since resetting the statistics
counters. These counters are reset whenever you restart the device or click the Reset
button.
The Rate/s column displays the total count per second.
The Avg Rate/s column displays the average count per second.
The Peak Rate/s column displays the peak count per second.
The Peak Occurred At column displays the date and time when the peak count
occurred.
The Poll Interval buttons set the polling time of the management console. Polling time
determines how often the management console polls the device for statistics. A polling
time of 5 seconds for example means that the management console polls the device
every five seconds to retrieve statistics values. These values are then processed and
127
D-View 5.1 User’s Guide
displayed on the table. To increase the polling time, click the up-arrow button; to
decrease, click the down-arrow button.
The Reset button resets all ICMP statistics counters back to zero.
The Pause button pauses device polling.
The Resume button resumes device polling.
The following describes the various ICMP counters:
IcmpInMsgs is a read-only MIB object of the icmp group that displays the number of
ICMP messages received by the device. This count also considers those counted by the
icmpInErrors counter.
IcmpInErrors is a read-only MIB object of the icmp group that displays the number of
ICMP messages received by the device with ICMP-specific errors such as bad ICMP
checksums and bad lengths.
IcmpInDestUnreachs is a read-only MIB object of the icmp group that displays the
number of ICMP Destination Unreachable messages received by the device.
IcmpInTimeExcds is a read-only MIB object of the icmp group that displays the
number of ICMP Time Exceeded messages received by the device.
IcmpInParmProbs is a read-only MIB object of the icmp group that displays the
number of ICMP Parameter Problem messages received by the device.
IcmpInSrcQuenchs is a read-only MIB object of the icmp group that displays the
number of ICMP Source Quench messages received by the device.
IcmpInRedirects is a read-only MIB object of the icmp group that displays the number
of ICMP Redirect messages received by the device.
IcmpInEchos is a read-only MIB object of the icmp group that displays the number of
ICMP Echo (request) messages received by the device.
IcmpInEchoReps is a read-only MIB object of the icmp group that displays the number
of ICMP Echo Reply messages received by the device.
IcmpInTimestamps is a read-only MIB object of the icmp group that displays the
number of ICMP Timestamp (request) messages received by the device.
IcmpInTimestampReps is a read-only MIB object of the icmp group that displays the
number of ICMP Timestamp Reply messages received by the device.
IcmpInAddrMasks is a read-only MIB object of the icmp group that displays the
number of ICMP Address Mask Request messages received by the device.
IcmpInAddrMaskReps is a read-only MIB object of the icmp group that displays the
number of ICMP Address Mask Reply messages received by the device.
128
D-View 5.1 User’s Guide
IcmpOutMsgs is a read-only MIB object of the icmp group that displays the number of
ICMP messages the device attempted to send. This count also considers those counted
by the icmpOutErrors counter.
IcmpOutErrors is a read-only MIB object of the icmp group that displays the number
of ICMP messages the device failed to send due to problems discovered within ICMP
(such as lack of buffers). This count does not include errors discovered outside the
ICMP layer such as inability of IP to route the resulting datagram.
IcmpOutDestUnreachs is a read-only MIB object of the icmp group that displays the
number of ICMP Destination Unreachable messages sent by the device.
IcmpOutTimeExcds is a read-only MIB object of the icmp group that displays the
number of ICMP Time Exceeded messages sent by the device.
IcmpOutParmProbs is a read-only MIB object of the icmp group that displays the
number of ICMP Parameter Problem messages sent by the device.
IcmpOutSrcQuenchs is a read-only MIB object of the icmp group that displays the
number of ICMP Source Quench messages sent by the device.
IcmpOutRedirects is a read-only MIB object of the icmp group that displays the
number of ICMP Redirect messages sent by the device. For a host, this object will
always be zero since hosts do not send redirects.
IcmpOutEchos is a read-only MIB object of the icmp group that displays the number
of ICMP Echo (request) messages sent by the device.
IcmpOutEchoReps is a read-only MIB object of the icmp group that displays the
number of ICMP Echo Reply messages sent by the device.
IcmpOutTimestamps is a read-only MIB object of the icmp group that displays the
number of ICMP Timestamp (request) messages sent by the device.
IcmpOutTimestampReps is a read-only MIB object of the icmp group that displays the
number of ICMP Timestamp Reply messages sent by the device.
IcmpOutAddrMasks is a read-only MIB object of the icmp group that displays the
number of ICMP Address Mask Request messages sent by the device.
IcmpOutAddrMaskReps is a read-only MIB object of the icmp group that displays the
number of ICMP Address Mask Reply messages sent by the device.
UDP Counters
This command displays the values of the device UDP counters. When you choose this
command, the MIB-II UDP Counters table appears on the screen:
The following describes the various components on the above table:
129
D-View 5.1 User’s Guide
The statistics table lists the values of the various UDP counters of the device. Except
for the Index column, all columns in this table can be resized by dragging their
respective right borders with the mouse left button. The following describes each
column:
The Counters column displays the various UDP statistics counters. For information
about these counters, see the discussion below.
The Total column displays the accumulated count since resetting the statistics
counters. These counters are reset whenever you restart the device or click the Reset
button.
The Rate/s column displays the total count per second.
The Avg Rate/s column displays the average count per second.
The Peak Rate/s column displays the peak count per second.
The Peak Occurred At column displays the date and time when the peak count
occurred.
The Poll Interval buttons set the polling time of the management console. Polling time
determines how often the management console polls the device for statistics. A polling
time of 5 seconds for example means that the management console polls the device
every five seconds to retrieve statistics values. These values are then processed and
displayed on the table. To increase the polling time, click the up-arrow button; to
decrease, click the down-arrow button.
The Reset button resets all UDP statistics counters back to zero.
The Pause button pauses device polling.
The Resume button resumes device polling. The following describes the various UDP
counters:
UdpInDatagrams is a read-only MIB object of the udp group that displays the number
of UDP datagrams delivered to UDP users.
UdpNoPorts is a read-only MIB object of the udp group that displays the number of
received UDP datagrams for which there was no application at the destination port.
UdpInErrors is a read-only MIB object of the udp group that displays the number of
received UDP datagrams that cannot be delivered due to lack of application at the
destination port.
UdpOutDatagrams is a read-only MIB object of the udp group that displays the
number of UDP datagrams sent by the device.
SNMP Counters
This command displays the values of the device SNMP counters.
130
D-View 5.1 User’s Guide
When you choose this command, the MIB-II SNMP Counters table appears on the
screen:
The following describes the various components on the above table:
The statistics table displays the values of the various SNMP counters of the device.
Except for the Index column, all columns in this table can be resized by dragging their
respective right borders with the mouse left button. The following describes each
column.
The Counters column displays the various SNMP statistics counters. For information
about these counters, see the discussion below.
The Total column displays the accumulated count since resetting the statistics
counters. These counters are reset whenever you restart the device or click the Reset
button.
The Rate/s column displays the total count per second.
The Avg Rate/s column displays the average count per second.
The Peak Rate/s column displays the peak count per second.
The Peak Occurred At column displays the date and time when the peak count
occurred.
The Poll Interval buttons set the polling time of the management console. Polling time
determines how often the management console polls the device for statistics. A polling
time of 5 seconds for example means that the management console polls the device
every five seconds to retrieve statistics values. These values are then processed and
displayed on the table. To increase the polling time, click the up-arrow button; to
decrease, click the down-arrow button.
The Reset button resets all SNMP statistics counters back to zero.
The Pause button pauses device polling.
The Resume button resumes device polling.
The following describes the various SNMP counters:
SnmpInPkts is a read-only MIB object of the snmp group that displays the number of
SNMP messages sent to the device from the transport service.
SnmpOutPkts is a read-only MIB object of the snmp group that displays the number
SNMP messages that were passed from the device SNMP agent to the transport service.
SnmpInBadVersions is a read-only MIB object of the snmp group that displays the
number of SNMP messages that were delivered to the device SNMP agent with
unsupported SNMP version.
131
D-View 5.1 User’s Guide
SnmpInBadCommunityNames is a read-only MIB object of the snmp group that
displays the number of SNMP messages that were delivered to the device SNMP agent
with SNMP community names unknown to the device.
SnmpInBadCommunityUses is a read-only MIB object of the snmp group that displays
the number of SNMP messages that were delivered to the device SNMP agent with
SNMP operations not permitted for the specified community names.
SnmpInASNParseErrs is a read-only MIB object of the snmp group that displays the
number of ASN.1 BER errors encountered by the device SNMP agent when decoding the
received SNMP messages.
SnmpInTooBigs is a read-only MIB object of the snmp group that displays the number
of SNMP PDUs which were delivered to the device SNMP agent with their error-status
fields set to “tooBig”.
SnmpInNoSuchNames is a read-only MIB object of the snmp group that displays the
number of SNMP PDUs that were delivered to the device SNMP agent with their errorstatus fields set to “noSuchName”.
SnmpInBadValues is a read-only MIB object of the snmp group that displays the
number of SNMP PDUs that were delivered to the device SNMP agent with their errorstatus fields set to “badValue”.
SnmpInReadOnlys is a read-only MIB object of the snmp group that displays the
number of valid SNMP PDUs that were delivered to the device SNMP agent with their
errorstatus fields set to “readOnly”. This MIB object is used primarily for detecting
incorrect SNMP implementations.
SnmpInGenErrs is a read-only MIB object of the snmp group that displays the number
of SNMP PDUs that were delivered to the device SNMP agent with their error-status
fields set to “genErr”.
SnmpInTotalReqVars is a read-only MIB object of the snmp group that displays the
number of MIB objects that have been successfully retrieved by the device SNMP agent
for all valid Get-Request and Get-Next PDUs.
SnmpInTotalSetVars is a read-only MIB object of the snmp group that displays the
number of MIB objects that were successfully set by the device SNMP agent for all valid
Set- Request PDUs.
SnmpInGetRequests is a read-only MIB object of the snmp group that displays the
number of SNMP Get-Request PDUs that have been accepted and processed by the
device SNMP agent.
132
D-View 5.1 User’s Guide
SnmpInGetNexts is a read-only MIB object of the snmp group that displays the
number of SNMP Get-Next PDUs that have been accepted and processed by the device
SNMP agent.
SnmpInSetRequests is a read-only MIB object of the snmp group that displays the
number of SNMP Set-Request PDUs that have been accepted and processed by the
device SNMP agent.
SnmpInGetResponses is a read-only MIB object of the snmp group that displays the
number of SNMP Get-Response PDUs that have been accepted and processed by the
device SNMP agent.
SnmpInTraps is a read-only MIB object of the snmp group that displays the number of
SNMP Trap PDUs that have been accepted and processed by the device SNMP agent.
SnmpOutTooBigs is a read-only MIB object of the snmp group that displays the
number of SNMP PDUs that were generated by the device SNMP agent with their errorstatus fields set to “tooBig”.
SnmpOutNoSuchNames is a read-only MIB object of the snmp group that displays the
number of SNMP PDUs that were generated by the device SNMP agent with their
errorstatus fields set to “noSuchName”.
SnmpOutBadValues is a read-only MIB object of the snmp group that displays the
number of SNMP PDUs that were generated by the device SNMP agent with their errorstatus fields set to “badValue”.
SnmpOutGenErrs is a read-only MIB object of the snmp group that displays the
number of SNMP PDUs which were generated by the device SNMP agent with their
error-status fields set to “genErr”.
SnmpOutGetRequests is a read-only MIB object of the snmp group that displays the
number of SNMP Get-Request PDUs that were generated by the device SNMP agent.
SnmpOutGetNexts is a read-only MIB object of the snmp group that displays the
number of SNMP Get-Next PDUs that were generated by the device SNMP agent.
SnmpOutSetRequests is a read-only MIB object of the snmp group that displays the
number of SNMP Set-Request PDUs that were generated by the device SNMP agent.
SnmpOutGetResponses is a read-only MIB object of the snmp group that displays the
number of SNMP Get- Response PDUs that were generated by the device SNMP agent.
SnmpOutTraps is a read-only MIB object of the snmp group that displays the number
of SNMP Trap PDUs that were generated by the device SNMP agent.
133
D-View 5.1 User’s Guide
Figure 106
134
D-View 5.1 User’s Guide
Figure 107
Figure 108
135
D-View 5.1 User’s Guide
Figure 109
IF MIB Tables
The following table gives a brief description of the IF MIB:
IF-MIB (RFC 2233)
1. The ifGeneralInformationGroup. This group contains those objects applicable to
all types of network interfaces, including bit-oriented interfaces.
2. The ifPacketGroup. This group contains those objects applicable to packetoriented network interfaces.
3. The ifFixedLengthGroup. This group contains the objects applicable not only to
character-oriented interfaces, such as RS-232, but also to those subnetwork
technologies, such as cell-relay/ATM, which transmit data in fixed length
transmission units. As well as the octet counters, there are also a few other
counters (e.g., the error counters) that are useful for this type of interface, but are
136
D-View 5.1 User’s Guide
currently defined as being packet-oriented. To accommodate this, the definitions of
these counters are generalized to apply to character-oriented interfaces and fixedlength-transmission interfaces.
It should be noted that the octet counters in the if Table aggregate octet counts for
unicast and non-unicast packets into a single octet counter per direction
(received/transmitted). Thus, with the above definition of fixed-lengthtransmission interfaces, where such interfaces which support non-unicast
packets, separate counts of unicast and multicast/broadcast transmissions can
only be maintained in a media-specific MIB module.
Table 2
The IF MIB General Information and IF Stack tables:
Figure 110
137
D-View 5.1 User’s Guide
Figure 111
To enable Link Up/Link Down Trap, assign an Alias or enable Promiscuous Mode
highlight the appropriate index and supply the information at the bottom of the menu.
Entity
The following table gives information about the Entity MIB:
Entity MIB (RFC 2737)
- Logical Entity
A managed system contains one or more logical entities, each represented
138
D-View 5.1 User’s Guide
by at most one instantiation of each of a particular set of MIB objects. A set
of management functions is associated with each logical entity. Examples of
logical entities include routers, bridges, print-servers, etc.
- Physical Entity
A "physical entity" or "physical component" represents an identifiable
physical resource within a managed system. Zero or more logical entities
may utilize a physical resource at any given time. It is an implementationspecific manner as to which physical components are represented by an
agent in the EntPhysicalTable. Typically, physical resources (e.g.,
communications ports, back planes, sensors, daughter-cards, power
supplies, the overall chassis) that can be managed via Functions associated
with one or more logical entities are included in the MIB.
- Containment Tree
Each physical component may be modeled as 'contained' within another
physical component. A "containment-tree" is the conceptual sequence of
entPhysicalIndex values that uniquely specifies the exact physical location of
a physical component within the managed system. It is generated by
'following and recording' each 'entPhysicalContainedIn' instance 'up the tree
towards the root', until a value of zero indicating no further containment is
found.
Table 3
139
D-View 5.1 User’s Guide
Figure 112
Figure 113
140
D-View 5.1 User’s Guide
Accessing Bridge MIBs
The system provides three commands in the General menu for use in accessing various
bridge MIBs from IEEE 802.1D-1990 MAC bridges on LAN segments. These commands
include:
Bridge 802.1d—Use this command to access bridge MIB objects included in the
dot1dBase group. These objects are applicable to all types of bridges.
Spanning Tree—Use this command to access and set some of the MIB objects included
in the dot1dStp group. This group only applies to bridges that implement the Spanning
Tree Protocol (STP).
Transparent Bridge—Use this command to access and set some of the MIB objects
included in the dot1dTp and dot1dStatic groups. These groups only apply to bridges
that implement transparent bridging and destination-address filtering. You can also
use this command to access some MIB objects (for statistics) from the dot1dTp group.
To access the above MIBs from a bridge, select the corresponding icon of the target
bridge from the map. Then, choose the appropriate command from the General menu
to select the MIB group(s) you want to access. Each command provides a submenu for
selecting specific objects from the selected group. See the sections below for more
information.
Bridge 802.1d →Information
This command provides some basic information about the selected bridge.
When you choose this command, the Information dialog box appears:
The following describes each column:
The Objects column lists the available MIB objects. For information about these
objects, see the discussion below.
The Description column displays the current value of each displayed object.
The Refresh button refreshes the table. You need to refresh the table once in a while to
ensure all updates performed on the device are reflected on this table. The following
describes the various MIB objects displayed on the above table:
The Bridge Address object corresponds to the Dot1dBaseBridgeAddress MIB object of
the dot1dBase group. This read-only object displays the MAC address of the selected
bridge. MAC address is a unique, fixed hardware address burned into the interface of
the device. This address is sometimes used when deriving the device IP address.
141
D-View 5.1 User’s Guide
The Number of Ports object corresponds to the Dot1dBaseNumPorts MIB object of the
dot1dBase group. This read-only object displays the number of ports the bridge
controls.
The Bridge Type object corresponds to the Dot1dBaseType MIB object of the
dot1dBase group. This read-only object indicates what type of bridging this bridge can
perform (for example, transparent only, source route only, or srt).
The Learned Entry Discarded object corresponds to the Dot1dTpLearnedEntryDiscards MIB object of the dot1dTp group. This read-only object displays the
number of forwarding database entries, which have been or could have been learned,
but were discarded due to lack of space in the mentioned database. A high value for
this object indicates that the database is regularly becoming full—a condition which
has unpleasant performance effects on the network.
Bridge 802.1d →Port Table
This command displays the contents of the device bridge port table. This table provides
generic information pertaining to the ports (that is, transparent, source-route, and srt
ports) associated with the bridge. Choosing this command displays the Bridge 802.1d
Port Table:
The bridge port table displays information for each port on the bridge. This table is
divided into six columns as listed below. Except for the Index column, all columns in
this table can be resized by dragging their respective right borders with the mouse left
button. Each entry corresponds to one port on the bridge.
The following describes each column:
The Index column displays the corresponding index number of each entry.
The Port column corresponds to the Dot1dBasePort MIB object of the dot1dBase
group. This read-only object identifies the port for which this entry pertains.
The IFIndex column corresponds to the Dot1dBasePortIfIndex MIB object of the
dot1dBase group. This read-only object displays the value of the IfIndex object instance
(defined in MIB-II) for the interface corresponding to this port.
The Circuit column corresponds to the Dot1dBasePortCircuit MIB object of the
dot1dBase group. This read-only object displays the name of an object instance unique
for the port when this port has the same dot1dBasePortIfIndex value as another port on
the bridge.
The DelayExceedDiscards column corresponds to the Dot1dBasePortDelayExceededDiscards MIB object of the dot1dBase group. This read-only object
142
D-View 5.1 User’s Guide
displays the number of frames that were discarded by this port due to excessive transit
delay through the bridge.
The MtuExceedDiscards column corresponds to the Dot1dBasePortMtuExceededDiscards MIB object of the dot1dBase group. This read-only object
displays the number of frames that were discarded by this port due to excessive size.
The Refresh button refreshes the table. You need to refresh the table once in a while to
ensure all updates performed on the device are reflected on this table.
Spanning Tree →Information
This command allows you to access and set MIB objects that specify the bridge state
with respect to the Spanning Tree Protocol (STP). If the bridge does not implement such
protocol, then this command becomes irrelevant.
STP is primarily for detecting and preventing network loops, which occur when multiple
paths exist between any two communicating nodes. With STP, all redundant paths are
blocked and are placed in backup mode; if the path for which there is a backup path
fails, then its backup will be automatically activated to take over the path. This feature
is particularly useful in a multibridged network where redundant path occurrences are
frequent.
The Objects column lists the available MIB objects. For information about these
objects, see the discussion below.
The Description column displays the current value of each displayed object.
The Refresh button refreshes the table. You need to refresh the table once in a while to
ensure all updates performed by other network administrators on the displayed objects
are reflected on this table. Be reminded that you are not the only one managing the
device.
The Set button sets MIB objects with read-write attributes. The following describes the
various MIB objects displayed on the above table:
The Protocol object corresponds to the Dot1dStpProtocolSpecification MIB object of the
dot1dStp group. This read-only object indicates the STP version implemented on the
bridge. An “ieee8021d(3)” value means that the STP version is IEEE 802.1d.
The Priority object corresponds to the Dot1dStpPriority MIB object of the dot1dStp
group. This read-write object displays the priority number of the bridge. This value is
used in conjunction with the bridge MAC address to set the bridge ID that in turn is
used when determining the root bridge of a multibridged network. The root bridge is
responsible for processing data packets when network loops occur on the network.
143
D-View 5.1 User’s Guide
The Time Since Topology Changed object corresponds to the Dot1dStpTimeSinceTopologyChange MIB object of the dot1dStp group. This read-only object
displays the last time changes were made to the network topology. These changes
usually occur when backup paths are activated due to primary path failures.
The Number of Topology Changes object corresponds to the Dot1dStpTop-Changes
MIB object of the dot1dStp group. This read-only object displays the number of times
(since this current management session with the device was started) changes were
made to the network topology. Changes usually occur on the network when backup
paths are activated.
The Designated Root object corresponds to the Dot1dStpDesignatedRoot MIB object of
the dot1dStp group. This read-only object displays the bridge ID of the current root
bridge on the network as determined by STP.
The Root Cost object corresponds to the Dot1dStpRootCost MIB object of the dot1dStp
group. This read-only object displays the cost for the path between this bridge and the
root bridge. If the selected bridge is the root bridge, then this displays zero.
The Root Port object corresponds to the Dot1dStpRootPort MIB object of the dot1dStp
group. This read-only object identifies the port (on this bridge) that offers the least path
cost from this bridge to the root bridge. In the event of a network loop, data packets will
pass through the root port.
The Maximum Aging Time object corresponds to the Dot1dStpMaxAge MIB object of
the dot1dStp group. This read-only object indicates the maximum age of STP
information learned from the network (on any port) before it is discarded.
The Hello Time object corresponds to the Dot1dStpHelloTime MIB object of the
dot1dStp group. This read-only object displays the amount of time between
transmission of configuration BPDUs by this bridge on any port when operating as the
root or trying to become so.
The Hold Time object corresponds to the Dot1dStpHoldTime MIB object of the
dot1dStp group. This read-only object displays the time interval during which no more
than two configuration BPDUs shall be transmitted by this bridge.
The Forward Delay object corresponds to the Dot1dStpForwardDelay MIB object of the
dot1dStp group. This read-only object indicates how fast any port on the bridge can
change its spanning state when moving towards the forwarding state. This value
determines how long the port stays in each of the listening and learning states, which
precede the forwarding state.
The Aging Time (If Root) object corresponds to the Dot1dStpBridgeMax-Age MIB
object of the dot1dStp group. This read-write object determines how long this bridge
144
D-View 5.1 User’s Guide
will wait for BPDUs from the root bridge before it starts sending its own BPDUs for
permission to become the root bridge. If it turns out that this bridge has the lowest
bridge ID among the bridges on the network, it will then become the root bridge.
The Hello Time (If Root) object corresponds to the Dot1dStpBridgeHello-Time MIB
object of the dot1dStp group. This read-write object sets the hello time of the bridge for
use when operating as the root bridge on the network. This value determines the
interval between transmission of configuration BPDUs sent by the bridge (acting as the
root) to all other bridges on the network to inform them that it is still alive as the root
bridge.
The Forward Delay (If Root) object corresponds to the Dot1dStpBridge-ForwardDelay
MIB object of the dot1dStp group. This read-write object determines the forward delay
value that all bridges will use when this bridge becomes the root bridge. Forward delay
is the time any port on a bridge spends in each of the listening and learning states
when moving towards the forwarding state. To set the MIB objects (above) with readwrite attributes, follow these steps:
1. From the Information dialog box, click the Set button. The STP
Configurations dialog box appears on the screen:
2. This dialog box displays the configurable MIB objects. Priority, Aging
Time, Hello Time, and Forward Delay correspond to the
Dot1dStpPriority, Dot1dStpBridgeMaxAge, Dot1dStpBridgeHelloTime,
and Dot1dStpBrid-geForwardDelay MIB objects, respectively.
3. If you want to refresh the displayed values, click the Refresh button. You
need to do this to ensure all modifications performed by other network
administrators are reflected in this dialog box.
4. In the Priority text box, specify the bridge priority. Valid values range
from 0 to 65535, with 0 being the highest bridge priority.
5. In the Aging Time text box, specify the maximum aging time for the
bridge. Valid values range from 6 to 40 seconds.
6. In the Hello Time text box, type in the bridge hello time. Valid values
range from 1 to 10 seconds.
7. In the Forward Delay text box, specify the bridge forward delay. Valid
values range from 4 to 30 seconds.
8. Click the Set button to affect the new settings for the above MIB objects.
145
D-View 5.1 User’s Guide
The object table reflects the changes you made to the configurable MIB objects. If you
want to close the Information dialog box to view other MIB objects from other options,
just double-click its Control-menu box.
Spanning Tree →Port Table
This command displays the contents of the device spanning tree port table. This table
provides information maintained by each port regarding its spanning state.
When you choose this command, the STP Port Table appears on the screen.
The following describes the various components on the above table:
The port table displays spanning information about each port on the bridge. This table
is divided into eleven columns as listed below. Except for the Index column, all
columns in this table can be resized by dragging their respective right borders with the
mouse left button. Each entry corresponds to one port on the bridge.
The following describes each column:
The Index column displays the corresponding index number of each entry.
The Port column corresponds to the Dot1dStpPort MIB object of the dot1dStp group.
This read-only object displays the physical number of the port for which this entry
pertains. This value is used in conjunction with the port priority to set the port ID.
The Priority column corresponds to the Dot1dStpPortPriority MIB object of the
dot1dSTp group. This read-write object displays the priority number of the port. This
value is used in conjunction with the physical port number to set the port ID that in
turn is used when determining the root port of a bridge. The root port is responsible for
forwarding packets from the bridge to the root bridge.
The State column corresponds to the Dot1dStpPortState MIB object of the dot1dStp
group. This read-only object indicates the current spanning state of the port. A port can
have the following states: disabled, blocking, listening, learning, forwarding, and
broken. A broken state means that the link on the port has been broken because the
port is malfunctioning. Blocking means that the port has been blocked because it is
neither a root port nor a designated port. In STP, only root and designated ports are
used.
The Status column corresponds to the Dot1dStpPortEnable MIB object of the dot1dStp
group. This read-write object enables or disables the port.
The Path Cost column corresponds to the Dot1dStpPortPathCost MIB object of the
dot1dStp group. This read-write object specifies the path cost for the network segment
attached to the port. By convention, a 10Mbps LAN has a path cost of 100, while
146
D-View 5.1 User’s Guide
100Mbps has a path cost of 10. The lower the path cost, the more chance the port has
of becoming the root port of the bridge.
The Designated Root column corresponds to the Dot1dStpPortDesig-natedRoot MIB
object of the dot1dStp group. This read-only object displays the bridge ID of the current
root bridge on the network.
The Cost column corresponds to the Dot1dStpPortDesignatedCost MIB object of the
dot1dStp group. This read-only object displays the corresponding path cost of the
designated port for the segment the port connects to.
The Designated Bridge column corresponds to the Dot1dStpPortDesig-natedBridge
MIB object of the dot1dStp group. This read-only object displays the bridge ID of the
designated bridge for the segment the port connects to.
The Des Brg Port column corresponds to the Dot1dStpPortDesignated-Port MIB object
of the dot1dStp group. This read-only object displays the port ID of the designated port
for the segment the port connects onto.
The Forward Trans column corresponds to the Dot1dStpPortForward-Transitions MIB
object of the dot1dStp group. This read-only object displays the number of times this
port moved from learning state to forwarding state.
The Refresh button refreshes the table. You need to refresh the table once in a while to
ensure all updates performed on the device (specially those that affect the above MIB
objects) are reflected on this table.
The More button displays the values of the next set of ports. For this option, the
system does not support modifications on the settings of those MIB objects (above) with
read-write attributes. To modify these objects, you can use the device front panel
graphics, or the device onboard console program (if it comes with one). Please refer to
the appropriate manuals for more information. To close the STP Port Table, doubleclick its Control-menu box.
Transparent Bridge →Forwarding Table
This command displays the contents of the forwarding database for transparent
bridging. This database contains information about unicast entries for which the bridge
has forwarding and/or filtering information. The transparent bridging function uses
this information when deciding how a received frame will be propagated over the
network. When you choose this command, the Forwarding Table appears on the screen:
The forwarding table displays information about specific unicast MAC addresses for
which the bridge has some forwarding and/or filtering information. This table is divided
147
D-View 5.1 User’s Guide
into four columns as listed below. Except for the Index column, all columns in this
table can be resized by dragging their respective right borders with the mouse left
button. The following describes each column:
The Index column displays the corresponding index number of each entry.
The Port column corresponds to the Dot1dTpFdbPort MIB object of the dot1dTp group.
This read-only object displays the port number on which a frame with source address
equal to the value displayed in the Address column was received. A value of “0”
indicates that the port number has not been learned but the bridge does have some
forwarding/filtering information about this address (for example, in the static table).
The Address column corresponds to the Dot1dTpFdbAddress MIB object of the dot1dTp
group. This read-only object displays the unicast MAC address for which the bridge has
forwarding and/or filtering information.
The Status column corresponds to the Dot1dTpFdb MIB object of the dot1dTp group.
This read-only object displays the entry status that can be mgmt, self, learned, invalid,
or other. Mgmt means that the address is included in the static table; self indicates
that the address represents one of the bridge addresses; learned indicates that the
address was auto-learned (dynamic) by the system, and is being used; invalid means
that the address is no longer valid; other means that the status is none of the above.
The Refresh button refreshes the table. You need to refresh the table once in a while to
ensure all updates performed on the device (specially those that affect the above MIB
objects) are reflected on this table.
The Next button displays the next set of entries on the above table. If there are more
than 200 entries on the table, you will need to click this button to display the other
entries. The Forwarding Table can only display 200 entries at a time. To close the
Forwarding Table, double-click its Control-menu box.
Transparent Bridge →Static Table
This command allows you to access the contents of the static (destination-address
filtering) database. This database contains filtering information configured into the
bridge by network administrators specifying the set of ports to which received frames
(with specific destination addresses) from specific ports will be forwarded.
When you choose this command, the Static Filter Table appears on the screen:
The following describes each column:
The Index column displays the corresponding index number of each entry.
148
D-View 5.1 User’s Guide
The Receive Port column corresponds to the Dot1dStaticReceivePort MIB object of the
dot1dStatic group. This read-write object identifies the port number from which a
frame must be received in order for this filtering entry to be valid. A value of “0”
indicates that this entry applies to all ports on the bridge for which there is no other
applicable entry.
The Address column corresponds to the Dot1dStaticAddress MIB object of the
dot1dStatic group. This read-write object specifies the destination MAC address of a
frame to which this filtering entry applies. Address can be unicast, group, or broadcast.
The Forwarding Port column corresponds to the Dot1dStaticAllowed-ToGoTo MIB
object of the dot1dStatic group. This read-write object selects the ports to which frames
received from a specific port will be forwarded.
The Status column corresponds to the Dot1dStaticStatus MIB object of the dot1dStatic
group. This read-write object indicates the status of this entry. It can assume one of the
following values: deleteOnTime-out, deleteOnReset, permanent, invalid, or other. The
first option means that this entry is currently in use and will remain so until it is aged
out; deleteOnReset means that this entry is currently in use and will remain so until
the bridge is restarted; permanent indicates that the entry is currently in use and will
remain so even after resetting the bridge; invalid deletes the respective entry from the
table; other means that the entry is currently in use but the conditions under which it
will remain so are different from the above.
The Refresh button refreshes the table. You need to refresh the table once in a while to
ensure all updates performed by other network administrators on the displayed objects
are reflected on this table. Be reminded that you are not the only one managing the
device.
Transparent Bridge →Port Counters
This command allows you to access performance statistics for the ports that are
associated with transparent bridging. If the selected bridge does not implement
transparent bridging, then this command becomes irrelevant.
When you choose this command, a submenu appears on the screen for selecting the
type of display:
The first option corresponds to tabular form display, while the next two are for
graphical displays. Select the option you want depending on your specific needs. If you
select the tabular form display, the Bridge Port Counters table appears:
The following describes the various components on the above table:
149
D-View 5.1 User’s Guide
The statistics table displays information for each port of a transparent bridge. Except
for the Index column, all columns in this table can be resized by dragging their
respective right borders with the mouse left button.
The following describes each column:
The Index column displays the corresponding index number of each entry.
The Counters column displays the various bridge port counters. For information about
these counters, see the discussion below.
The Total column displays the accumulated count since resetting the statistics
counters. These counters are reset whenever you restart the device, reset the port, or
click the Reset button.
The Rate/s column displays the total count per second.
The Avg Rate/s column displays the average count per second.
The Peak Rate/s column displays the peak count per second.
The Peak Occurred At column displays the date and time when the peak count
occurred.
The Poll Interval buttons set the polling time of the management console. Polling time
determines how often the management console polls the device for statistics. A polling
time of 5 seconds for example means that the management console polls the device
every five seconds to retrieve statistics values. These values are then processed and
displayed on the table. To increase the polling time, click the up-arrow button; to
decrease, click the down-arrow button.
The Reset button resets all bridge port counters back to zero.
The Pause button pauses device polling.
The Resume button resumes device polling.
The NextPort button selects the next port (that is, interface) on the device for
monitoring.
The Target field displays the selected port.
The FirstPort button selects the first port (that is, interface) on the device for
monitoring. The following describes the various bridge port counters:
The Input Frames counter corresponds to the Dot1dTpPortInFrames MIB object of the
dot1dTp group. This read-only object displays the number of frames received by the
port from its segment.
The Output Frames column corresponds to the Dot1dTpPortOutFrames MIB object of
the dot1dTp group. This read-only object displays the number of frames transmitted by
the port to its segment.
150
D-View 5.1 User’s Guide
The Discard Frames column corresponds to the Dot1dTpPortInDiscards MIB object of
the dot1dTp group. This read-only object displays the number of received valid frames
that were discarded (that is, filtered) by the system filters.
If you select the line curve display, the Bridge Port Counters graph appears:
The following describes the various components on the above table:
The Name field displays the name of the device. This should reflect the setting on the
device SysName MIB object.
The Opened field displays the time and date when this current management session
with the selected device was started.
The IP Address field displays the IP address of the device.
The Target field identifies which part of the device this option applies to; in this case, it
applies to an interface (port).
The graph area displays the bridge port statistics in graphical format. From this area,
you can simultaneously monitor the graphical representation of the Input Frames,
Output Frames, and Discard Frames counters. The following describes the controls you
can use to set the graph configuration:
The Up- and Down- Arrow controls set the range on the y-axis. Use these controls to
enhance the graph readability if they appear too small or too big. If the graphs appear
too big to fit the screen, click the up-arrow control to increase the range on the y-axis.
If the graphs appear too small, click the down-arrow control to decrease the range on
the y-axis. You can also control the graph width via the Dur buttons.
The Graph Color control sets the background color of the graph. To set, click this
control and select the color you want from the displayed menu.
The Grid control toggles between enabling and disabling the grid.
The Graph Slider control toggles between enabling and disabling the graph slider.
When enabled, an inverted triangle appears above the graph. You can move this slider
by simply dragging it with the mouse left button to the desired location.
The Statistics Selector controls select which bridge port statistics will be displayed on
the screen. To select for a particular control, click the respective down-arrow button. A
list appears with the following options: Set Color, No Selection, Input Frames, Output
Frames, and Discard Frames. The first option allows you to set the line and word
colors; No Selection means no graph will be displayed for this particular control; the
last three are the available bridge port statistics. The label on each control reflects your
choice.
151
D-View 5.1 User’s Guide
Below the graph area are message boxes for displaying some information about the
displayed graphs and other system messages. The boxes at the right display the total
count per second for each graph, the current position of the graph marker (in the range
from 0 up to 99; with 0 being the leftmost part and 99 the rightmost part of the graph),
and the system time and date.
The statistics table displays the values of a particular statistics counter. To select a
statistics counter, just click the down-arrow button at the right of this table. A list
appears displaying the following counters: Input Frames, Output Frames, and Discard
Frames. Click the counter you want. The label on this table reflects your choice.
The following describes the displayed values:
Avg displays the average count per second.
Peak displays the peak count per second.
Pk At displays the time when the peak count occurred.
The Rate buttons set the polling time of the management console. Polling time
determines how often the management console polls the device for statistics. A polling
time of 5 seconds for example means that the management console polls the device
every five seconds to retrieve statistics values. These values are then processed and
displayed on the screen. To increase the polling time, click the up-arrow button; to
decrease, click the down-arrow button.
The Dur buttons set the range on the x-axis. Use these buttons to enhance the graph
readability if they appear too wide or too narrow. If the graphs appear too wide, click
the down-arrow button to increase the range on the x-axis. If the graphs appear too
small, click the up-arrow button to decrease the range.
The Pause button pauses device polling.
The Start button resumes device polling.
Bridge 802.1d
Bridge 802.1d Information and Port Table
First some Bridge 802.1D (RFC 1493) MIB Group Definitions:
152
D-View 5.1 User’s Guide
Bridge 802.1D (RFC 1493) MIB Groups
The dot1dBase Group
This mandatory group contains the objects, which are applicable to all types of
bridges.
The dot1dStp Group
This group contains the objects that denote the bridge's state with respect to the
Spanning Tree Protocol. If a node does not implemented the Spanning Tree Protocol,
this group will not be implemented.
The dot1dSr Group
This group contains the objects that describe the entity's state with respect to source
route bridging. If source routing is not supported this group will not be implemented.
This group is applicable to source route only, and SRT bridges. This group will be
described in a separate document applicable only to source route bridging.
The dot1dTp Group
This group contains objects that describe the entity's state with respect to transparent
bridging. If transparent bridging is not supported this group will not be implemented.
This group is applicable to transparent only and SRT bridges.
The dot1dStatic Group
This group contains objects that describe the entity's state with respect to destinationaddress filtering. If destination-address filtering is not supported this group will not be
implemented. This group is applicable to any type of bridge that performs destinationaddress filtering.
Relationship to Other MIBs
As described above, some IEEE 802.1d management objects have not been included in
this MIB because they overlap with objects in other MIBs applicable to a bridge
implementing this MIB. In particular, it is assumed that a bridge implementing this
MIB will also implement (at least) the 'system' group and the 'interfaces' group defined
in MIB-II.
Relationship to the 'system' group
In MIB-II, the 'system' group is defined as being mandatory for all systems such that
each managed entity contains one instance of each.
Table 4
153
D-View 5.1 User’s Guide
Bridge aging time can be adjusted in the Information window; otherwise Bridge 802.1
windows are read-only.
Figure 114
154
D-View 5.1 User’s Guide
Figure 115
Path: MIBs Æ 802.1D Information/Port Table
Bridge 802.1D
Information
Bridge Address, Number of Ports, Bridge Type, Learned
Entry Discard
Port Table Information
Port, IfIndex, Circuit, DelayExceededDiscards,
MtuExceededDiscards
Table 5
Spanning Tree
Spanning Tree Information
Use the STP Information window for global changes to the selected device. User
configurable global STP settings include Priority, Maximum Aging Time, Hello Time
and Forward Delay.
155
D-View 5.1 User’s Guide
Figure 116
Path: MIBs Æ Spanning Tree Æ Information
Read-only Information
Protocol, Time Since Topology Change, Number of
Topology Changes,
Designated Root, Root Cost, Root Port, Maximum Aging
Time, Hello Time, Forward Delay
Set Variables
Maximum Aging Time(600-4000), Hello Time(1001000), Forward Delay(400-3000)
Table 6
156
D-View 5.1 User’s Guide
Spanning Tree Port Table
The STP Port Table allows you to configure STP port settings. Select the port you wish
to configure and type in the desired Priority and Path Cost for the port. The Status pulldown menu is used to enable or disable the STP settings for the port.
Figure 117
Path: MIBs Æ Spanning Tree Æ Port Table
Read-only Information
Port, Port Priority, State, Status, Path Cost,
DesignatedRoot, DesignatedCost, DesignatedBridge,
DesignatedPort, Forwarding Transitions
Set Variables
Priority, Status, Path Cost
157
D-View 5.1 User’s Guide
Table 7
Transparent Bridge Forwarding & Static Filtering Tables
Highlight to select the device and access these read-only menus from the Transparent
Bridge side menu.
Figure 118
158
D-View 5.1 User’s Guide
Figure 119
Path: MIBs Æ Transparent Bridge ÆForwarding Table/Static Table
Transparent Bridge Forwarding Table
Information
Address, Port, Status
Transparent Bridge Static Filtering
Table Information
Address, ReceivePort, AllowedtoGoTo,
Status
Table 8
159
D-View 5.1 User’s Guide
Transparent Bridge Port Counter Table & Port Traffic
Graph
Counter tables and traffic graphs can be paused or reset as desired. The user can
change the Poll Interval and Count, graphs may use a three dimensional line by
checking the 3D Line box.
Figure 120
160
D-View 5.1 User’s Guide
Path: MIBs Æ Transparent Bridge Æ Port Counter
Transparent Bridge Port
Counter Table
dot1dTpPort, dot1dTpPortMaxInfo, Port Number,
Max Info
Name, Value, Delta, Rate, Peak, Peak Occ.
Table 9
RMON
This chapter provides some information about the D-View RMON Module.
Network management works by placing a small degree of intelligence into network
devices (routers, bridges, hubs, workstations, etc.) to be managed. This intelligence
takes the form of an agent that is capable of collecting statistics and status
information, as well as performing control operations that affect the operation of the
network. The agent responds to queries for information from the centralized network
management system, allowing the health and performance of the network to be
monitored and controlled. RMON, an acronym for Remote Monitoring, was developed by
the IETF (Internet Engineering Task Force) to provide a standard protocol for
monitoring and managing different groups of information over a network. The features
of RMON are organized into cohesive collections simply called groups. These groups are
the basic unit of performance. The D-Link devices utilize four key RMON groups. These
four groups are described in the table below†.
161
D-View 5.1 User’s Guide
Remote Network Monitoring Object Groups
The Ethernet Statistics Group
The Ethernet statistics group contains statistics measured by the probe for each
monitored Ethernet interface on this device. This group consists of the
etherStatsTable. In the future other groups will be defined for other media types
including Token Ring and FDDI.
These groups should follow the same model as the Ethernet statistics group.
The History Control Group
The history control group controls the periodic statistical sampling of data from various
types of networks. This group consists of the historyControlTable.
The Alarm Group
The alarm group periodically takes statistical samples from variables in the probe and
compares them to previously configured thresholds.
If the monitored variable crosses a threshold, an event is generated. A hysteresis
mechanism is implemented to limit the generation of alarms. This group consists of
the alarmTable and requires the implementation of the event group.
The Event Group
The event group controls the generation and notification of events from this device.
This group consists of the event Table and the log Table.
Table 10. RMON Statistics
162
D-View 5.1 User’s Guide
Figure 121
There are 4 buttons located near the bottom of the RMON Statistics window: OK, Reset,
Stop, and Start.
♦ OK – Closes the Statistics window.
♦ Reset – This resets all statistics counters to zero.
♦ Stop – This stops the polling (stops reading the statistics counters).
♦ Start – This starts the polling with an initial reading of the statistics counters.
Control Table Tab
Click the Control Table tab to open the Control Table window. A new data source entry
must be added to begin keeping device statistics:
163
D-View 5.1 User’s Guide
1. Click Add to display the Add box.
2. It is sufficient to click OK/ Cancel (as appropriate) or edit any of the three fields
displayed:
♦ Index (1..65535) – This value is randomly generated upon opening the Add
box. The value uniquely identifies this entry. Other than numerical position in
the Control Table, there is no benefit or disadvantage in choosing a specific
index value.
♦ Data Source ifIndex – This entry identifies the source of the data that this
etherStats entry is configured to analyze. This source can be any Ethernet
interface on the device.
♦ Owner – This entry is the entity that initiated the entry and is using the
resources assigned to it. Other functions of the Control Table are as follows:
♦ Modify – To modify an existing entry, click the entry to highlight it, and click
Modify Data Source and Owner can be modified as desired.
♦ Delete – To delete an entry, click the entry to highlight it, and click Delete to
remove it.
♦ View – If more than one entry exists in the Control Table, it will be necessary to
use the View function, because only one entry’s statistics may be viewed at any
time. To view an entry, click the entry to highlight, and click View – if View is
not active, then that entry is currently set for view.
♦ Refresh – The Refresh function rewrites the Control Table.
Statistics Table Tab
The Statistics Table is a collection of statistics kept for a particular Ethernet interface.
It consists of 17 statistic counters under 4 categories: Absolute, Delta, Peak, and Rate.
♦ Absolute – The current count since the initiation of the data source or last
reset, at which the counter begins at zero.
♦ Delta – This is the number of frames counted for a particular datum since the
last polling.
♦ Peak – This is the largest Delta value since creation of the table or last reset.
♦ Rate(Pkt/Sec) – This is the Delta value divided by the polling interval – Rate =
(P/t)
The different statistics and data are described below:
♦ Owner – The entity that configured this entry and is therefore using the
resources assigned to it.
♦ Index – The value uniquely identifies this etherStats entry.
164
D-View 5.1 User’s Guide
♦
♦
♦
♦
♦
♦
♦
♦
♦
♦
Data Source – This identifies the source of the data that this etherStats entry is
configured to analyze. This source can be any Ethernet interface on this device.
In order to identify a particular interface, this object is identified by the instance
of the ifIndex object, defined in RFC 1213 and RFC 1573 [4,6], for the desired
interface. For example, if an entry were to receive data from interface #1, this
object would be set to ifIndex.1.
Drop Events – The total number of events in which packets were dropped by
the probe due to lack of resources. Note that this number is not necessarily the
number of packets dropped; it is just the number of times this condition has
been detected.
Octets – The total number of octets of data (including those in bad packets)
received on the network (excluding framing bits but including FCS octets).
Packets – The total number of packets (including bad packets, broadcast
packets, and multicast packets) received.
Broadcast Packets – The total number of good packets received that were
directed to the broadcast address. Note that this does not include multicast
packets.
Multicast Packets – The total number of good packets received that were
directed to a multicast address. Note that this number does not include packets
directed to the broadcast address.
CRCAlign Errors – The total number of packets received that had a length
(excluding framing bits, but including FCS octets) of between 64 and 1518
octets, inclusive, but had either a bad Frame Check Sequence (FCS) with an
integral number of octets (FCS Error) or a bad FCS with a nonintegral number
of octets (Alignment Error).
Undersize Packets – The total number of packets received that were less than
64 octets long (excluding framing bits, but including FCS octets) and were
otherwise well formed.
Oversize Packets – The total number of packets received that were longer than
1518 octets (excluding framing bits, but including FCS octets) and were
otherwise well formed.
Fragments – The total number of packets received that were less than 64 octets
in length (excluding framing bits but including FCS octets) and had either a bad
Frame Check Sequence (FCS) with an integral number of octets (FCS Error) or a
bad FCS with a non-integral number of octets (Alignment Error).
165
D-View 5.1 User’s Guide
♦
♦
♦
♦
♦
♦
♦
♦
Jabbers – The total number of packets received that were longer than 1518
octets (excluding framing bits, but including FCS octets), and had either a bad
Frame Check Sequence (FCS) with an integral number of octets (FCS Error) or a
bad FCS with a non-integral number of octets (Alignment Error).
Collisions – The best estimate of the total number of collisions on this Ethernet
segment.
64 Octets – The total number of packets (including bad packets) received that
were 64 octets in length (excluding framing bits but including FCS octets).
65-127 Octets – The total number of packets (including bad packets) received
that were between 65 and 127 octets in length inclusive (excluding framing bits
but including FCS octets).
128-255 Octets – The total number of packets (including bad packets) received
that were between 128 and 255 octets in length inclusive (excluding framing
bits but including FCS octets).
256-511 Octets – The total number of packets (including bad packets) received
that were between 256 and 511 octets in length inclusive (excluding framing
bits but including FCS octets).
512-1023 Octets – The total number of packets (including bad packets)
received that were between 512 and 1023 octets in length inclusive (excluding
framing bits but including FCS octets).
1024-1518 Octets – The total number of packets (including bad packets)
received that were between 1024 and 1518 octets in length inclusive (excluding
framing bits but including FCS octets).
Utilization Tab
Click the Utilization tab to open the Utilization window. Utilization is given as the
measure packets per second (P/t, where P is packets received during the polling
interval, t). The display window plots packets per second, each poll interval, in linechart or 3D bar-chart graphs. The data below the graph represents the last measure of
packets per second over the poll interval.
Error Tab
Click the Error tab to open the Error window. Error is given as the measure packets per
second and is plotted each poll interval. The data below the graph represents the last
measure of packets per second, for each frame error type.
166
D-View 5.1 User’s Guide
Packet Distribution Tab
Click the Packet Distribution tab to open the Packet Distribution window. Packet
distribution is given as the measure packets per second and is plotted each poll
interval. The data below the graph represents the last measure of packets per second,
for each frame length type.
Path: MIBs Æ RMON Æ Statistics
RMON Statistics Table
Information
Index, Data source, Owner, Ststus, Name, Value,
Delta, Rate, Pea,
Peak Occurred At
Table 11
RMON History
The History Control Group controls the periodic statistical sampling of data from
various types of networks. The Ethernet History Group records periodic statistical
samples from an Ethernet network and stores them for later retrieval. Each such
entry defines one sample, and is associated with the History Control Group that
caused the sample to be taken.
Control Table Tab
Click the Control Table tab to open the Control Table window. A new data source entry
must be added to begin keeping device history statistics:
1. Click Add to display the Add box.
2. It is sufficient to click OK/ Cancel (as appropriate) or edit any of the five fields
displayed:
♦ Index (1..65535) – This value is randomly generated upon opening the Add
box. The value uniquely identifies this entry. Other than numerical position in
the Control Table, there is no benefit or disadvantage in choosing a specific
index value.
167
D-View 5.1 User’s Guide
♦
♦
♦
♦
Data Source ifIndex – This entry identifies the source of the data that this
etherStats entry is configured to analyze. This source can be any Ethernet
interface on the device.
Owner – This entry is the entity that initiated the entry and is using the
resources assigned to it.
Buckets (1..65535) – The requested number of discrete time intervals over
which data is to be saved.
Interval (1..3600) – The interval in seconds over which the data is sampled for
each bucket. This interval can be set to any number of seconds between 1 and
3600 (1 hour).
Other functions of the Control Table are as follows:
♦ Modify – To modify an existing entry, click the entry to highlight it, and click
Modify. Data Source, Owner, Buckets, and Interval can be modified as desired.
♦ Delete – To delete an entry, click the entry to highlight it, and click Delete to
remove it.
♦ View – If more than one entry exists in the Control Table, it will be necessary to
use the View function, because only one entry’s statistics may be viewed at any
time. To view an entry, click the entry to highlight, and click View – if View is
not active, then that entry is currently set for view.
♦ Refresh – The Refresh function rewrites the Control Table.
History Table Tab
The History Table is an historical sample of Ethernet statistics on a particular
Ethernet interface. The History Control Group sets parameters for the History Statistics
Group for a regular collection of these samples. These samples are collected in
historical data entries, called buckets, each poll interval.
The different statistics are described below:
♦ Drop Events – The total number of events in which packets were dropped by
the probe due to lack of resources during this sampling interval. Note that this
number is not necessarily the number of packets dropped, it is just the number
of times this condition has been detected.
♦ Octets – The total number of octets of data (including those in bad packets)
received on the network (excluding framing bits but including FCS octets).
♦ Packets – The number of packets (including bad packets) received during this
sampling interval.
168
D-View 5.1 User’s Guide
♦
♦
♦
♦
♦
♦
♦
♦
♦
Broadcast – The number of good packets received during this sampling interval
that were directed to the broadcast address.
Multicast – The number of good packets received during this sampling interval
that were directed to a multicast address. Note that this number does not
include packets addressed to the broadcast address.
CRC Align – The number of packets received during this sampling interval that
had a length (excluding framing bits but including FCS octets) between 64 and
1518 octets, inclusive, but had either a bad Frame Check Sequence (FCS) with
an integral number of octets (FCS Error) or a bad FCS with a nonintegral
number of octets (Alignment Error).
Undersize – The number of packets received during this sampling interval that
were less than 64 octets long (excluding framing bits but including FCS octets)
and were otherwise well formed.
Oversize – The number of packets received during this sampling interval that
were longer than 1518 octets (excluding framing bits but including FCS octets)
but were otherwise well formed.
Fragment – The total number of packets received during this sampling interval
that were less than 64 octets in length (excluding framing bits but including
FCS octets) had either a bad Frame Check Sequence (FCS) with an integral
number of octets (F CS Error) or a bad FCS with a non-integral number of octets
(Alignment Error). Note that it is entirely normal for etherHistoryFragments to
increment. This is because it counts both runts (which are normal occurrences
due to collisions) and noise hits.
Jabber – The number of packets received during this sampling interval that
were longer than 1518 octets (excluding framing bits but including FCS octets),
and had either a bad Frame Check Sequence (FCS) with an integral number of
octets (FCS Error) or a bad FCS with a non-integral number of octets (Alignment
Error). Note that this definition of jabber is different than the definition in IEEE802.3 section 8.2.1.5 (10BASE5) and section 10.3.1.4 (10BASE2). These
documents define jabber as the condition where any packet exceeds 20 ms. The
allowed range to detect jabber is between 20 ms and 150 ms.
Collision – The best estimate of the total number of collisions on this Ethernet
segment during this sampling interval.
Utilization – The best estimate of the mean physical layer network utilization
on this interface during this sampling interval, in hundredths of a percent.
169
D-View 5.1 User’s Guide
Utilization/ Errors Tab
Click the Utilization/Errors tab to open the Utilization/Errors window. Utilization is
given as the best estimate of the mean physical layer network utilization during the
sampling interval. Error is given as (CRC_Align + Undersize + Oversize + Fragment +
Jabber + Collision)/polling_time. The data is graphed, in line-chart or 3D bar-chart
graphs, each poll interval.
Packet Tab
Click the Packet tab to open the Packet window. The data below the graph represents
the last measure of packets per second, for frame types. The data is plotted each poll
interval in line-chart or 3D bar-chart graphs.
Figure 122
170
D-View 5.1 User’s Guide
Figure 123
Path: MIBs Æ RMON Æ History
RMON History Table
Information
Index, Data source, Buckets Requested, Buckets
Granted, Interval, Owner, Status, Time Stamp, Drop
Events, Octets, Packets, Broadcast, Multicast,
CRCAlign, Umndersize, Oversize, Fragments, Jabbers,
Collisions, Utilizations
Table 12
171
D-View 5.1 User’s Guide
RMON Alarm
Alarm Group
The Alarm Group periodically takes statistical samples from variables in the probe and
compares them to previously configured thresholds. If the monitored variable crosses a
threshold, an event is generated. A hysteresis mechanism is implemented to limit the
generation of alarms. This group consists of the alarmTable and requires the
implementation of the event group.
The Alarm Table consists of a list of Alarm entries that are made up of parameters that
are set up to periodically check for alarm conditions. To use the Alarm Group, a new
data entry must be added to define threshold parameters:
1. Click Add to display the Alarm Table Add box.
2. Descriptions of the fields are as follows:
♦ Index – This value is randomly generated upon opening the Add box. The value
uniquely identifies this entry. Other than numerical position in the Alarm Table,
there is no benefit or disadvantage in choosing a specific index value.
♦ Interval – The interval in seconds over which the data is sampled and
compared with the rising and falling thresholds. When setting this variable, care
should be taken in the case of deltaValue sampling – the interval should be set
short enough that the sampled variable is very unlikely to increase or decrease
by more than 2^31 + 1 during a single sampling interval.
♦ Sampling – The method of sampling the selected variable and calculating the
value to be compared against the thresholds. If the value of this object is
absoluteValue(1), the value of the selected variable will be compared directly
with the thresholds at the end of the sampling interval. If the value of this object
is deltaValue(2), the value of the selected variable at the last sample will be
subtracted from the current value, and the difference compared with the
thresholds.
♦ Variable – The object identifier of the particular variable to be sampled. Only
variables that resolve to an ASN.1 primitive type of INTEGER (INTEGER,
Counter, Gauge, or TimeTicks) may be sampled.
♦ Threshold Value – These are threshold values for the sampled statistic.
♦ Rising – When the current sampled value is greater than or equal to this
threshold, and the value at the last sampling interval was less than this
threshold, a single event will be generated. A single event will also be generated
172
D-View 5.1 User’s Guide
if the first sample after this entry becomes valid is greater than or equal to this
threshold and the associated alarmStartupAlarm is equal to risingAlarm(1) or
risingOrFallingAlarm(3). After a rising event is generated, another such event
will not be generated until the sampled value falls below this threshold and
reaches the alarmFallingThreshold.
♦ Falling – When the current sampled value is less than or equal to this
threshold, and the value at the last sampling interval was greater than this
threshold, a single event will be generated. A single event will also be generated
if the first sample after this entry becomes valid is less than or equal to this
threshold and the associated alarmStartupAlarm is equal to fallingAlarm(2) or
risingOrFallingAlarm(3). After a falling event is generated, another such event
will not be generated until the sampled value rises above this threshold and
reaches the alarmRisingThreshold.
♦ Activate Rising/ Falling Event Index – The index of the eventEntry that is
used when a rising threshold is crossed. The eventEntry identified by a
particular value of this index is the same as identified by the same value of the
eventIndex object. If there is no corresponding entry in the eventTable, then no
association exists. In particular, if this value is zero, no associated event will be
generated, as zero is not a valid event index.
♦ Description – A comment describing this event entry.
♦ Community – If an SNMP trap is to be sent, it will be sent to the SNMP
community specified by this octet string.
♦ Type – The type of notification that the probe will make about this event. There
are four types: none, log, snmp-trap, and log-and-trap.
3. Click OK or Cancel, as appropriate.
The Alarm parameters are described below:
♦ Owner – The entity that configured the entry and is therefore using the
resources assigned to it.
♦ Index – An index uniquely identifying an entry in the alarm table. Each such
entry defines a diagnostic sample at a particular interval.
♦ Interval –The interval in seconds over which the data is sampled and compared
with the rising and falling thresholds. When setting this variable, care should be
taken in the case of deltaValue sampling – the interval should be set short
enough that the sampled variable is very unlikely to increase or decrease by
more than 2^31 + 1 during a single sampling interval.
♦ Variable – The object identifier of the particular variable to be sampled.
173
D-View 5.1 User’s Guide
♦
♦
♦
♦
♦
Sample Type – The method of sampling the selected variable and calculating
the value to be compared against the thresholds. If the value of this object is
absoluteValue(1), the value of the selected variable will be compared directly
with the thresholds at the end of the sampling interval. If the value of this object
is deltaValue(2), the value of the selected variable at the last sample will be
subtracted from the current value, and the difference compared with the
thresholds.
Value – The value of the statistic during the last sampling period. For example,
if the sample type is deltaValue, this value will be the difference between the
samples at the beginning and end of the period. If the sample type is
absoluteValue, this value will be the sampled value at the end of the period.
Startup Alarm – The alarm that may be sent when this entry is first set to valid.
If the first sample after this entry becomes valid is greater than or equal to the
risingThreshold and alarmStartupAlarm is equal to risingAlarm(1) or
risingOrFallingAlarm(3), then a single rising alarm will be generated. If the first
sample after this entry becomes valid is less than or equal to the
fallingThreshold and alarmStartupAlarm is equal to fallingAlarm(2) or
risingOrFallingAlarm(3), then a single falling alarm will be generated.
Rising Threshold – A threshold for the sampled statistic. When the current
sampled value is greater than or equal to this threshold, and the value at the
last sampling interval was less than this threshold, a single event will be
generated. A single event will also be generated if the first sample after this
entry becomes valid is greater than or equal to this threshold and the associated
alarmStartupAlarm is equal to risingAlarm(1) or risingOrFallingAlarm(3). After a
rising event is generated, another such event will not be generated until the
sampled value falls below this threshold and reaches the
alarmFallingThreshold.
Falling Threshold – A threshold for the sampled statistic. When the current
sampled value is less than or equal to this threshold, and the value at the last
sampling interval was greater than this threshold, a single event will be
generated. A single event will also be generated if the first sample after this
entry becomes valid is less than or equal to this threshold and the associated
alarmStartupAlarm is equal to fallingAlarm(2) or risingOrFallingAlarm(3). After a
falling event is generated, another such event will not be generated until the
sampled value rises above this threshold and reaches the
alarmRisingThreshold.
174
D-View 5.1 User’s Guide
♦
♦
♦
Rising Event – The index of the eventEntry that is used when a rising threshold
is crossed. The eventEntry identified by a particular value of this index is the
same as identified by the same value of the eventIndex object. If there is no
corresponding entry in the eventTable, then no association exists. In particular,
if this value is zero, no associated event will be generated, as zero is not a valid
event index.
Falling Event – The index of the eventEntry that is used when a falling
threshold is crossed. The eventEntry identified by a particular value of this
index is the same as identified by the same value of the eventIndex object. If
there is no corresponding entry in the eventTable, then no association exists. In
particular, if this value is zero, no associated event will be generated, as zero is
not a valid event index.
Status – The status of the alarm entry.
Figure 124
175
D-View 5.1 User’s Guide
Figure 125
Path: MIBs Æ RMON Æ Alarm/Event
RMON Alarm Table
Information
RMON Alarm :
Add/Modify Parameters
Index, Interval, Variable, SampleType, Value, StartupAlarm,
RisingThreshold, FallingThreshold, RisingEvent,
FallingEvent, Owner, Status
Index, Interval, Variable, Owner, StartUp Sampling,
Threshold Value: Rising/Falling,
Rising Event: Activate/Index/Description/Community/Type
Falling Event:
Activate/Index/Description/Community/Type
Table 13
176
D-View 5.1 User’s Guide
RMON Event
The Event Group controls the generation and notification of events. Each entry in the
Event Table describes the parameters of the event that can be triggered. Each event
entry is fired by an associated condition located elsewhere in the MIB – in the case of
this software utility, the Alarm Group.
Event Table Tab
The Event Table consists of a list of events to be generated when an event is fired. The
event information headings are described below:
♦ Owner – The entity that configured this entry and is therefore using the
resources assigned to it.
♦ Index – An index that uniquely identifies an entry in the event table. Each such
entry defines one event that is to be generated when the appropriate conditions
occur.
♦ Description – A comment describing the event entry.
♦ Type – The type of notification that the probe will make about the event. In the
case of log, an entry is made in the log table for each event. In the case of snmptrap, an SNMP trap is sent to one or more management stations.
♦ Community – If an SNMP trap is to be sent, it will be sent to the SNMP
community specified by this octet string.
♦ Last Time Sent – The value of sysUpTime at the time the event entry last
generated an event. If this entry has not generated any events, this value will be
zero.
♦ Status – The status of this event entry.
Log Table for Event Index
The Event Log Table is generated and maintained by an Event entry in the Event Table
and cannot be manipulated by any other entity. Log entries are described by the
following:
♦ Description – This contains a description of the event that activated this log
entry.
♦ Log Index – The event entry that generated this log entry.
♦
Log Time – The value of sysUpTime when this log entry was created.
177
D-View 5.1 User’s Guide
Figure 126
Path: MIBs Æ RMON Æ Alarm/Event
RMON Alarm Table
Information
RMON Alarm :
Add/Modify
Parameters
Index, Interval, Variable, SampleType, Value, StartupAlarm,
RisingThreshold, FallingThreshold, RisingEvent,
FallingEvent, Owner, Status
Index, Interval, Variable, Owner, StartUp Sampling,
Threshold Value: Rising/Falling,
Rising Event: Activate/Index/Description/Community/Type
Falling Event:
Activate/Index/Description/Community/Type
Table 13
The Event controls work in a similar fashion. Add or modify an Event control and
define its parameters by clicking the Add or Modify button, the Event Control pop-up
menu appears.
178
D-View 5.1 User’s Guide
Figure 126
Figure 127
Path: MIBs Æ RMON Æ Alarm/Event
RMON Alarm Event Table
Information
Index, Description, Type, Community, TimeSent,
Owner, Status
LogEventIndex, logIndex, logTime, logDescription
Table 14
179
D-View 5.1 User’s Guide
802.1P & 802.1Q
802.1P
Use the 802.1P side menus to view and set 802.1P port priority as well as GMRP and
GARP settings. The read-only Port Capability Form is accessed as a side menu.
802.1P/802.1Q (RFC 2674) MIBs
1pPriority Group
This group contains the objects for configuring and reporting status of priority-based
queuing mechanisms in a bridge. This includes per-port user priority treatment,
mapping of user priority in frames into internal traffic classes and outbound user
priority and access priority.
1pGarp Group
This group contains the objects for configuring and reporting on operation of the
Generic Attribute Registration Protocol (GARP).
1pGmrp Group
This group contains the objects for configuring and reporting on operation of the GARP
Multicast Registration Protocol (GMRP).
Dot1qBase Group
This mandatory group contains the objects, which are applicable to all bridges
implementing IEEE 802.1Q virtual LANs.
The dot1qTp Group
This group contains objects that control the operation and report the status of
transparent bridging. This includes management of the dynamic Filtering Databases for
both unicast and multicast forwarding. This group will be implemented by all bridges
that perform destination-address filtering.
The dot1qStatic Group
This group contains objects that control static configuration information for
transparent bridging. This includes management of the static entries in the Filtering
Databases for both unicast and multicast forwarding.
180
D-View 5.1 User’s Guide
The dot1qVlan Group
This group contains objects that control configuration and report status of the Virtual
LANs known to a bridge. This includes management of the statically configured VLANs
as well as reporting VLANs discovered by other means e.g. GVRP. It also controls
configuration and reports status of per-port objects relating to VLANs and reports
traffic statistics. It also provides for management of the VLAN Learning Constraints.
Table 15
802.1P Basic Configuration
Set the Traffic Class State (true, false) and GMRP Status.
Figure 128
181
D-View 5.1 User’s Guide
Path: MIBs Æ 802.1P Æ Basic Configuration
802.1P Basic
Configuration
Read-only
Set
Device Capabilties
Traffic Class Status, GMRP Status
Table 16
Priority Information Form
Choose the appropriate tab to view information listed by port number:
Figure 129
182
D-View 5.1 User’s Guide
Select the port number and type in the appropriate priority values; click Set to effect
the change.
Path: MIBs Æ 802.1P Æ Priority Information Form
Default User Priorities
of Each Port
Regenerated User
Priorities
User Priority To
Traffic Class
Port Outbound Access
Priority
Table
Information
Set
Table
Information
Set
Table
Information
Set
Table
Information
PortNumber, DefaultUserPriority,
PortNumTrafficClasses
SupportedTrafficClassesNum,
DefaultUserPriority
PortNumber, UserPriority,
RegeneratedUserPriority
UserPriority
PortNumber, TrafficClassPriority,
MappedTrafficClass
MappedTrafficClass
PortNumber, RegenerateUserPriority
Table 17
Port Capability
The Port Capability window (accessed as a side menu from 802.1P submenu) is readonly and lists Port Capabilities Entry Messages listed by port number.
183
D-View 5.1 User’s Guide
Figure 130
Path: MIBs Æ 802.1P Æ Ports Capability
Table Information
PortNumber, dot1dPortCapabilities
Table 18
GMRP
The GMRP Form allows you to enable GMRP for a selected port. To enable GMRP for a
given port, highlight to select, choose Enable from the pull-down menu and click Set.
184
D-View 5.1 User’s Guide
Path: MIBs Æ 802.1P Æ GMRP
GMRP Table Information
PortNumber, Status, GmrpFailed, GmrpLastPduOrign
Table 19
GARP
GARP settings are expressed in centi-seconds (hundredths of a second) for each port.
Figure 131
185
D-View 5.1 User’s Guide
Path: MIBs Æ 802.1P Æ GARP
GARP Table Information
PortNumber, GarpJoinTime, GarpLeaveTime,
GarpLeaveAllTime
Set
GarpJoinTime, GarpLeaveTime, GarpLeaveAllTime
Table 20
802.1Q
802.1Q Ports Information
Configure VLANs settings for the selected device in the VLAN Ports Information side
menu.
186
D-View 5.1 User’s Guide
Figure 132
Path: MIBs Æ 802.1Q Æ 802.1Q Bridge Æ Ports Information
Table Information
VLAN Ports
Information
Form
Set
PortNumber, PortVlanID,
AcceptableFrameTypes, IngressFiltering,
GvrpStatus, GvrpFailedRegistrations,
GvrpLastPduOrigin
PortVlanID, AcceptableFrameTypes,
IngressFiltering, GvrpStatus
Table 21
187
D-View 5.1 User’s Guide
802.1Q Learning Constraint Table
Set Default VLAN Constraint Value and Default Constraint Type.
To add a new listing to the Constraint Table or Modify and existing one, highlight it and
select Status and Type from the pull-down menus. Click the Add/Update button effect
the changes.
Path: MIBs Æ 802.1Q Æ 802.1Q Bridge Æ Learning Constraint Table
Learning
Constrain
t Table
Table Information
ConstraintVlanID, ConstraintSet, Type, Status
Set
DefaultVlanConstraintSet,
DefaultVlanConstraintType
Configure
ConstraintVlanID, Type, ConstraintSet, Status
Table 22
802.1Q VLAN
The Basic VLAN Configuration Form presents in two tables to display VLAN Static and
VLAN Current information.
188
D-View 5.1 User’s Guide
Figure 133
Path: MIBs Æ 802.1Q Æ 802.1Q VLAN
VLAN
Static
Table
Table Information
VLAN ID, VLAN Name, Egress Ports,
Forbidden Egress Ports
Set
VLAN Information, Egress Ports, Forbidden Ports,
Untagged Ports
VLAN
Curren
t Table
Table information
VLAN ID, VLAN Name, Egress Ports,
Forbidden Egress Ports, Untagged Ports, Status
Set
Egress Ports, Untagged Ports
Table 23
189
D-View 5.1 User’s Guide
802.1Q Forwarding/Filtering
Forwarding and Filtering information is presented in four separate menus. The menus
listed here appear as tabs in the Forwarding/Filtering Form.
Path: MIBs Æ 802.1Q Æ Forwarding/Filtering Form
Unicast
Forwarding
Info
Table Information
Fdb Id, FdbMacAddress, PortNumber, Status
Tp Group
Destination
Forwarded
Table Information
VLAN ID, GroupAddres, EgressPorts,
GMRPLearntPorts
Multcast
Forwarding
Info
Table information
Forward
Unregistere
d Info
Table Information
Configure
Configure
Configure
EgressPorts, GMRPLearntPorts
VLAN ID, AllPorts, StaticPorts, ForbiddenPorts
AllForwardedPorts, AllStaticPorts,
AllForbiddenPorts
VLAN ID, UnregisteredPorts,
Unregistered,StaticPorts
UnregisteredPorts, UnregisteredStaticPorts,
UnregisteredForbiddenPorts
Table 24
190
D-View 5.1 User’s Guide
Figure 134
191
D-View 5.1 User’s Guide
Path: MIBs Æ 802.1Q Æ Unicast/Multicast Static Filter Table
Table Information
Unicast
Info
Configure
VLAN
Current
Table
Table information
Configure
UnicastAddress, ReceivePort,
PortsUnicastAllowedToGoTo, Status
VID, MAC Address, Status,
Allow To Go To Ports (select ports)
MAC Address, Receive Port, Egress Port, Forbidden
Ports, Status
VID, MAC Address, Status,
Egress Ports, Forbidden Ports (select ports)
Table 25
Traffic Statistics
Port traffic statistics for selected devices are viewed by highlighting the chosen port and
clicking on the Statistics Info button. A new menu pops up displaying port statistics in
line graph form.
192
D-View 5.1 User’s Guide
Port VLAN Statistics
Figure 135
Layer 3 Utilities
To access Layer 3 utilities located under the MIBs proceed as follows: MIBs Æ 802.1Q
Æ Layer 3 Utilities.
193
D-View 5.1 User’s Guide
IP Forwarding
IP Forward (RFC 2096) MIB
The MIB consists of two tables and two global objects.
1. The object ipForwardNumber indicates the number of current routes. This is
primarily to avoid having to read the table in order to determine this number.
2. The ipForwardTable updates the RFC 1213 ipRouteTable to display multipath IP
Routes. This is in turn obsoleted by the ipCidrRouteTable.
3. The ipCidrRouteTable updates the RFC 1213 ipRouteTable to display multipath
IP Routes having the same network number but differing network masks.
Table 26
Figure 136
194
D-View 5.1 User’s Guide
Path: MIBs Æ Layer 3 utilities Æ IP Forwarding
Table
Information
CIDR Table
Configure
IP Forward
Table
Table
Information
Configure
CidrRouteNumber, CidrRouteDestlp, RouteMask,
RouteTypeOfService, CidrRouteNextHop,
CidrRouteIndex, RouteType, Protocol, Age, RouteInfo,
NextHopASNum, Metric 1, Metric 2, Metric 3, Metric
4, Metric 5, Status
CidrRouteNumber, CidrRouteDestlp, RouteMask,
RouteTypeOfService, CidrRouteNextHop,
CidrRouteIndex, RouteType, Protocol, Age, RouteInfo,
NextHopASNum, Metric 1, Metric 2, Metric 3, Metric
4, Metric 5, Status
IpForwardEntriesNumber, ipForwardMask,
ipForwardIndex, ipForwardNextHopAS,
ipForwardType, IpForwardInfo
IpForwardEntriesNumber, ipForwardMask,
ipForwardIndex, ipForwardNextHopAS,
ipForwardType, IpForwardInfo
Table 27
RIP 2
RIP2 (RFC 1724) MIB
The RIP-2 MIB contains global counters, useful for detecting the deleterious effects of
RIP incompatibilities; two "interfaces" tables, which contains interface-specific statistics
and configuration information; and an optional "peer" table, containing information
that may be helpful in debugging neighbor relationships. Like the protocol itself, this
MIB takes great care to preserve compatibility with RIP-1 systems and controls for
monitoring and controlling system interactions.
Global Counters
These counters are intended to facilitate debugging quickly changing routes or failing
neighbors.
195
D-View 5.1 User’s Guide
Implementation of this Group is Optional
This group provides information about active peer relationships intended to assist in
debugging. An active peer is a router from which a valid RIP updated has been heard
in the last 180 seconds.
Table 28
Path: MIBs Æ Layer 3 utilities Æ RIP 2
Subnet
Information
Read-only
Information
Set
Subnet
Configuration
Routing Peer
Information
Read-only
Information
Set
Table
Information
GlobalRouteChanges, GlobalQueriesResponse
SubnetIPAddress, NumOfTriggeredRIPStates,
Status
Subnet IP Address, Status
IP Address
AuthenticationType, AuthenticationKey,
InterfaceSends, AcceptedRIPVersion,
DefaultMetric, Status, InterfaceSourceAddress
SrcIpAddress, PeerDomainReceivedPackets,
sysUpTimeOfLastUpdate, VersionNumber,
RcvBadPackets, RcvBadRoutes
Table 29
196
D-View 5.1 User’s Guide
OSPF
OSPF (RFC 1850)
OSPF is a powerful routing protocol, equipped with features to handle virtually any
configuration requirement that might reasonably be found within an Autonomous
System. With this power comes a fair degree of complexity, which the sheer number of
objects in the MIB will attest to. Care has therefore been taken, in constructing this
MIB, to define default values for virtually every object, to minimize the amount of
parameterization required in the typical case. That default configuration is as follows:
Given the following assumptions:
♦ IP has already been configured
♦ The if Table has already been configured
♦ If Speed is estimated by the interface drivers
♦ The OSPF Process automatically discovers all IP
♦ Interfaces and creates corresponding OSPF Interfaces
♦ The TOS 0 metrics are autonomously derived from if Speed
♦ The OSPF Process automatically creates the Areas required for the Interfaces
The simplest configuration of an OSPF process requires that:
♦
♦
♦
The OSPF Process is enabled.
Area Data Structure and Area Stub Metric Table
The Area Data Structure describes the OSPF Areas that the router participates
in. The Area Stub Metric Table describes the metrics advertised into a stub area
by the default router(s).
Link State Database and External Link State Database
The Link State Database is provided primarily to provide detailed information for
network debugging.
Address Table and Host Tables
The Address Range Table and Host Table are provided to view configured Network
Summary and Host Route information.
Interface and Interface Metric Tables
197
D-View 5.1 User’s Guide
The Interface Table and the Interface Metric Table together describe the various IP
interfaces to OSPF. The metrics are placed in separate tables in order to simplify
dealing with multiple types of service, and to provide flexibility in the event that the IP
TOS definition is changed in the future. A Default Value specification is supplied for the
TOS 0 (default) metric.
Virtual Interface Table
Likewise, the Virtual Interface Table describes virtual links to the OSPF Process.
Neighbor and Virtual Neighbor Tables
The Neighbor Table and the Virtual Neighbor Table describe the neighbors to the OSPF
Process.
OSPF Traps
OSPF is an event driven routing protocol, where an event can be a change in an OSPF
interface's link-level status, the expiration of an OSPF timer or the reception of an
OSPF protocol packet. Many of the actions that OSPF takes as a result of these events
will result in a change of the routing topology. As routing topologies become large and
complex it is often difficult to locate the source of a topology change or unpredicted
routing path by polling a large number or routers. Another approach is to notify a
network manager of potentially critical OSPF events with SNMP traps.
Table 30
.
Figure 137
198
D-View 5.1 User’s Guide
Path: MIBs Æ Layer 3 utilities Æ OSPF Æ OSPF General
Read-only
NumOforiginatesLsas, OSPF VersionNum, RxNewLsas,
AreaBorderRouterStatus, ExternLsaCount, ExternLsaChecksum
Set
RouterId, Support Service Type, ASBorderRouterStatus, ExtLsdbLimit,
ASBorderRouterStatus, BitMaskOfMulticast, ExitOverflowInterval,
DemandRoutingSupport
Table 31
Path: MIBs Æ Layer 3 utilities Æ OSPF Æ OSPF Area Information
Area Table
Read-only
Information
Set
Stub Area Table
Area Aggregate
Table
Area Range
Table
GlobalRouteChanges, GlobalQueriesResponse
SubnetIPAddress, NumOfTriggeredRIPStates,
Status
AreaId, Type
Area Summary, Area Status, ImportASExternLsa
Read-only
Information
Stub Area, Type Of Service
Set
Metric, Metric Type, Status
Read-only
Information
AggreagateAreaID, AggregateNet, AggregateMask
Set
AggregateEffect, LsdbType, AggregateStatus
Set
AreaRangeAreaId, AreaRangeNet,
AreaRangeMask, AreaRangeEffect,
AreaRangeStatus
Table 32
199
D-View 5.1 User’s Guide
Path: MIBs Æ Layer 3 utilities Æ OSPF Æ OSPF Lsdb Form
Link State
Database
Table Information
LsdbAreaId, Type, LinkStatID, RouterID,
SequenceNum, Age, Checksum, Advertisement
Ext Link State
Database
Table Information
LsdbType, LinkStateID, RouterID,
SequenceNum, Age, Checksum, Advertisement
Table 33
OSPF Host Table
Path: MIBs Æ Layer 3 utilities Æ OSPF Æ OSPF Host Table Form
Table Information
Set
HostIpAddress, TypeOfService, Metric, Status, HostAreaID
HostIpAddress, TypeOfService, Metric, Status
Table 34
200
D-View 5.1 User’s Guide
Path: MIBs Æ Layer 3 utilities Æ OSPF Æ OSPF Interface
Table Read-only
Information
Interface
Table
Set
Interface
Metric
Table
Virtual
Interface
Table
Table/Read-only
Information
Set
Table Read-only
Information
Set
IfIpAddress, AddressLessInterface
Type, Priority, Status, AreaIdOfInterfaceConnected,
TransitDelay, AuthenticationKey, RetransInterval,
IfMulticastForwarding, HelpInterval,
Administrative Status, RouterDeadInterval,
IfDemand, PollInterval, Authentication Type
IpAddress, AddressLessInterface, TypeOfService
MetricValue, Status
AreaId, NeighborID
TransitDelay, Hellointerval, RetransInterval,
RtrDeadInterval
Table 35
201
D-View 5.1 User’s Guide
OSPF Neighbor Form
Figure 138
Path: MIBs Æ Layer 3 utilities Æ OSPF Æ OSPF Neighbor
Neighbo
r Table
Table/Read-only
Information
Set
Virtual
Neighbo
r Table
Table Information
IpAddress, AddressLessIndex
Priority, Status
TransitAreaID, NbrRouterId, VirtualNbrIpAddr,
Options, State, Events, RetransmissionQueueLen,
HelloSuppressed
Table 36
202
D-View 5.1 User’s Guide
Path: MIBs Æ Layer 3 utilities Æ OSPF Æ OSPF Trap Form
Table Information
OspfSetTrap, ConfigErrorType, PacketType, PacketSrc
OSPF Trap Events
Table 37
IP Mroute
IP MRoute (RFC 2932) MIB
This MIB module contains one scalar and five tables. The tables are:
1. The IP Multicast Route Table containing multicast routing information for IP
data grams sent by particular sources to the IP multicast groups known to a
router.
2. The IP Multicast Routing Next Hop Table containing information on the nexthops for the routing IP multicast data grams. Each entry is one of a list of nexthops on outgoing interfaces for particular sources sending to a particular
multicast group address.
3. The IP Multicast Routing Interface Table containing multicast routing
information specific to interfaces.
4. The IP Multicast Scope Boundary Table containing the boundaries configured
for multicast scopes.
5. The IP Multicast Scope Name Table containing human-readable names of
multicast scope.
Table 38
203
D-View 5.1 User’s Guide
Figure 139
204
D-View 5.1 User’s Guide
Path: MIBs Æ Layer 3 utilities Æ IP Mroute
IPMRoute
Table
Table Information
Set
Next Hop
Table
Interface Table
Table Information
Table Read-only
Information
Set
BoundaryEntr
y Table
Table Read-only
Information
Set
Group, Source, Source Mask, Upstream
Neighbor, ReceivedIpDatagramsSource,
UpTime, ExpiryTime, RoutePkts,
DiferentSourcePackets,
NumOfOctetsInIPDatagrams, RouterProtocol
MulticastRouteEnable
NextHopGroup, NextHopSource,
NextHopSoureMask, NextHopIndex,
NextHopAddress, State, UpTime, ExpiryTime,
ClosestMemeberHops, Protocol, ForwardPkts
Index
TTL Threshold, Interface Protocol
IfIndex, Address, AddressMask, Status
Status
Table 39
205
D-View 5.1 User’s Guide
DVMRP
DVMRP
DVMRP is an "interior gateway protocol"; suitable for use within an autonomous
system, but not between different autonomous systems. DVMRP is not currently
developed for use in routing non-multicast data grams, so a router that routes both
multicast and unicast data grams must run two separate routing processes. DVMRP is
designed to be easily extensible and could be extended to route unicast data grams.
DVMRP was developed to experiment with the algorithms in RIP was used as the
starting point for the development because an implementation was available and
distance vector algorithms are simple, as compared to link-state algorithms. In
addition, to allow experiments to traverse networks that do not support multicasting, a
mechanism called "tunneling" was developed.
The multicast-forwarding algorithm requires the building of trees based on routing
information. This tree building needs more state information than RIP is designed to
provide, so DVMRP is much more complicated in some places than RIP. A link-state
algorithm, which already maintains much of the state needed, might prove a better
basis for Internet multicasting routing and forwarding.
DVMRP differs from RIP in one very important way. RIP thinks in terms of routing and
forwarding data grams to a particular destination. The purpose of DVMRP is to keep
track of the return paths to the source of multicast data grams. To make explanation of
DVMRP more consistent with RIP, the word "destination" is used instead of the more
proper "source", but the reader must remember that data grams are not forwarded to
these destinations, but originate from them.
Table 40
206
D-View 5.1 User’s Guide
Figure 140
Path: MIBs Æ Layer 3 utilities Æ DVMRP
General
Info Table
Read-only Information
DVMRPVersion, DVMRPGenerationId,
NumberOfRoutes, ReachableRoutes
Table 41
207
D-View 5.1 User’s Guide
PIM
PIM MIB
This MIB module contains one scalar and eight tables.
The tables contained in this MIB are:
1. The PIM Interface Table contains one row for each of the router's PIM interfaces.
2. The PIM Neighbor Table contains one row for each of the router's PIM neighbors.
3. The PIM IP Multicast Route Table contains one row for each multicast routing
entry whose incoming interface is running PIM.
4. The PIM Next Hop Table contains one row for each outgoing interface list entry
in the multicast routing table whose interface is running PIM, and whose state
is pruned.
5. The (deprecated) PIM RP Table contains the PIM (version 1) information for IP
multicast groups which is common to all RPs of a group.
6. The PIM RP-Set Table contains the PIM (version 2) information for sets of
candidate Rendezvous Points (RPs) for IP multicast group addresses with
particular address prefixes.
7. The PIM Candidate-RP Table contains the IP multicast groups for which the
local router is to advertise itself as a Candidate-RP. If this table is empty, then
the local router advertises itself as a Candidate-RP for all groups.
8. The PIM Component Table contains one row for each of the PIM domains to
which the router is connected.
Table 42
208
D-View 5.1 User’s Guide
Figure 141
209
D-View 5.1 User’s Guide
Path: MIBs Æ Layer 3 utilities Æ PIM Æ PIM Info
RP Table
Table
Information
Set
RpSetTable
CandidateR
PEntryTable
RPGroupAddress, RPAddress, RPState, RPStateTimer,
RPLastChange
RPRowStatus
Table
Information
RPSetGorupAddress, RPSetGrouMask, RPSetAddress,
RPSetHoldTime, RPSetExpiryTime
Table
Information
CandidateRPGroupAddress, CandidateRPGroupMask
Set
RowStatus
Table 43
Path: MIBs Æ Layer 3 utilities Æ PIM Æ Rendezvous Points Info
PIM
Interface
Table
Neighbor
Table
PIM
Componen
t Info
Table/Read-only
Information
Set
Table Information
Table/Read-only
Information
Set
IPAddress, NetMask
PimJoinPruneInterval, IfIndex, JoinPruneInterval,
Candidate Bootstrap Router, HelloInterval, Mode,
Status
NeighborAddress, IfIndex, UpTime, ExpiryTime,
Mode
ComponentIndex
Status, CRPHoldTime
Table 44
210
D-View 5.1 User’s Guide
SNMPv3 Configuration
Use the SNMPv3 menu to configure SNMPv3 security settings and new user setup.
Choose SNMPv1, SNMPv2 or SNMPv3 as appropriate in the SNMP Version entry field.
Use buttons to access pop-up menus
Figure 142
211
D-View 5.1 User’s Guide
Path: MIBs Æ SNMPv3
Table/Read-only Information
User Defined Parameters
System Description, System Object ID, Sytem
Uptime, System Contact, System Name, System
Location
IP Address, Port Number, Security Name, Context
Engine ID, Auth Password, Priv Password, Auth
Protocol, Priv Protocol, Contact Name, Security
Level, Write Community String, Time-out, Retries
Table 45
212
D-View 5.1 User’s Guide
SNMP Protocol Settings Pop-up Menus
Note: SNMP protocol preferences pop-up menus are
accessed by clicking the buttons on the right side of the
SNMP Configuration menu. Use these menus exactly as
menus used in previous examples.
Figure 143
Path: MIBs Æ SNMPv3 (click MPD button)
MPD (RFC 2572) Table
SecurityModels, InvalidMsgs,
UnknownPDUHandlers
Table 46
213
D-View 5.1 User’s Guide
Path: MIBs Æ SNMPv3 (click Target button)
AddEntry_Table
ParamsEntry_Table
AddrName, AddrTDomain, AddrTAddress, AddrTimeout,
AddrRetryCount, AddrTagList, AddrParams, AddrStorageType,
AddrRowStatus
ParamsName, ParamsMPModel, ParamsSecurityModel,
ParamsSecurityName, ParamsSecurityLevel,
ParamsStorageType, ParamsRowStatus
Table 47
Path: MIBs Æ SNMPv3 (click USM button)
Stats_Table
UserEntry_Table
UnsupportedSecLevels, NotInTimeWindows,
UnknownUserNames, UnknownEngineIDs, WrongDigests,
DecryptionErrors
EngineID, Name, SecurityName, CloneForm, AuthProtocol,
AuthKeyChange, OwnAuthKeyChange, PrivChange,
PrivKeyChange, OwnPrivKeyChange, Public, StorageType,
Status
Table 48
Path: MIBs Æ SNMPv3 (click VACM button)
ContextEntry_Table
SecurityToGroupEntry_Table
Entry_Table
vacmContextEntryName
SecurityName, SecurityModel, GroupName,
SecurityToGroupStorageType,
SecurityToGroupStatus
ContextPrefix, SecurityLevel, SecurityModel,
ContextName, ReadViewName, WriteViewName,
NotifyViewName, StroageType, Status
Table 49
214
D-View 5.1 User’s Guide
5
I NTERNET TOOLS
This chapter explains items in the “Tools” drop-down menu in the order of the
descending menu items.
DIAP
D-View includes standard network management utilities such as TFTP and Ping Test
user convenience. D-View 5.1 also includes D-Link’s proprietary administration utility
DIAP. DIAP allows the user to have limited administrative access to D-Link broadband
devices such as ADSL and ISDN routers, ADSL modems and Wireless routers. This tool
can be used to assign IP settings to such devices. DIAP will automatically discover all
DIAP enabled devices and display IP settings and MAC information in a separate
window.
215
D-View 5.1 User’s Guide
Figure 144
TFTP
The Trivial File Transfer Protocol server can be activated under the Tools heading of the
Main Menu. The TFTP server is active upon launch and can transfer files located on the
host system to any SNMP device. File transfer information is displayed in the TFTP
Server window. This information includes the IP address of the file recipient, the type
and name of the file transferred and the status of the transfer. Error messages appear
in the bottom field display.
216
D-View 5.1 User’s Guide
The D-View network management system comes with a TFTP server function that
allows you to configure the management console as a TFTP server on the network. This
function implements the Trivial File Transfer Protocol (TFTP) to download image files
from the management console (acting as a TFTP server) to the devices. TFTP is the
second file transfer protocol under the TCP/IP suite that provides inexpensive,
unsophisticated service. It restricts operations to simple file transfers and does not
require authentication unlike the original File Transfer Protocol (FTP).
When operating as a TFTP server, all network devices that need to upgrade or rebuild
the software in their Flash memory send requests to the management console for
downloading of their respective image files. When a request is received from a device,
the server searches (using the MAC address of the device) its database for the image file
assigned to the requesting device, and then downloads the appropriate file to the
device. Software downloading is necessary when a new software version is released
from the device vendor, or when the software in the Flash memory of the device has
been corrupted. In addition to remote software downloading, you can also download
software locally via the diagnostic port of the device.
A network can have multiple TFTP servers; how they are assigned to specific devices
depend on the configuration specified in the BOOTP tables of the management
consoles. The BOOTP table allows you to assign a TFTP server for each device, and the
location of its respective image file in the server’s hard disk.
217
D-View 5.1 User’s Guide
Figure 145
BOOTP Server
Use the BOOTP server window to set up BOOTP service for BOOTP enabled devices.
This utility is similar to the TFTP server except it does not require that the host system
or D-View be running at the time of the transfer. D-View can assign other servers on
the network to act as BOOTP servers or it may use the host system as the server.
The D-View network management system comes with a BOOTP server function that
allows you to configure the management console as a BOOTP server on the network.
When operating as a BOOTP server, all network devices that need IP addresses send
BOOTP requests to the management console for retrieval of their respective addresses.
The IP address plays a vital role in network communication under the TCP/IP
218
D-View 5.1 User’s Guide
environment. Each network device attached to this environment must have a unique IP
address in order to send and receive data packets from other network devices. Some
network devices such as intelligent hubs and bridges come with EEPROMs for storing
configuration values including IP addresses; others such as diskless workstations are
incapable of storing such information, thus they depend on the BOOTP server for these
values.
When the management console (acting as a BOOTP server) receives a BOOTP request, it
checks the MAC address of the device that sent this request. The system then looks up
this MAC address on the BOOTP table; if such address exists, the system returns to the
requesting device the assigned IP address for that MAC address; if the address does not
exist, the system displays a message on the management console screen prompting the
network administrator to assign an IP address for this request. After assigning an IP
address, the entry is then added on the table for use on subsequent request from the
device. The BOOTP table is stored in the hard disk of the management console, and can
be updated any time by the network administrator. In addition to the IP address, each
entry in the BOOTP table can also furnish other information relevant to network
communication. These include the gateway address, the file server address, and the
subnet mask.
To enable the BOOTP server function of the management console, choose Bootp Server
from the Tools menu. The BOOTP Server dialog box appears on the screen signifying
that the management console is now operating as a BOOTP server. The management
console will start receiving BOOTP requests from the network; if it receives a request, it
checks the table for the required information and sends them to the requesting device;
if the entry does not exist, the program displays the Add/Modify BOOTP Table Item
dialog box on the screen:
219
D-View 5.1 User’s Guide
Figure 146
PING Test
The D-View network management system provides a test facility that verifies whether or
not the management console has good communication link with a particular device on
the network. This facility implements the Packet InterNet Groper (PING) program for
use on TCP/IP internets to test reachability of destinations. PING verifies connectivity
of a device by sending ICMP echo request packets to it and then waits for the ICMP
echo response packets from the device. For every request, PING expects a response;
otherwise, a problem exists in the connection. In addition to sending a series of ICMP
echo requests and capturing responses, PING also provides statistics for lost
datagrams. These values can be used to determine the reliability of the connection. If
you suspect a problem with a network device, you can run this utility to determine
whether or not the management console can communicate with the device.
220
D-View 5.1 User’s Guide
Figure 147
221
D-View 5.1 User’s Guide
6
A DVANCED M ANAGEMENT
This chapter explains how to use trap management functions found under the System
drop-down menu. It is organized in the order of the descending menu items. It explains
how to access the Trap Editor, how to edit a TRF file, how to control and view the trap
log, and how to change SMTP trap settings.
This chapter also explains how to add plug-in utilities.
The end of the chapter describes how to use the Account administration utilities to
monitor and analyze client devices, and maintain client records. It is organized in the
order of the descending menu items under the Account drop-down menu.
Trap Management
Traps
SNMP devices send traps over the network for reporting event occurrences and status
changes on their respective systems. These traps are classified into two groups: generic
and specific. Generic traps relate to events that are common to all SNMP devices such
as system reboots and system shutdowns; specific traps are those that relate to events
exclusive to a particular device such as intrusion violations for hubs and root bridge
changes for bridges. Generic traps are sent as broadcast packets over the network,
thus
all management consoles can receive these types of messages.
222
D-View 5.1 User’s Guide
Specific traps on the other hand are only sent to authorized management consoles
which can be selected locally from the device either through the device onboard console
program or the commands provided in its front panel graphics.
Trap Editor
Use the Trap Editor to modify MIB object names for modules and devices on the
network. Select the device/module from the list in the top panel. MIB objects are
indexed according to class. Click on the index number to view that object class group.
To change the alias name of a single object, double click it or highlight it and click on
the Modify icon just above the object list. Use the Change Alias Name pop up window to
modify the object alias name.
Figure 148
223
D-View 5.1 User’s Guide
Clear Trap Alerts
To clear the trap alerts from the scrolling message panel (Trap tab) at the bottom of the
main menu, under System go to Trap Management and left click on Clear.
Sort Trap Alerts
To change the order of presentation of the trap alerts, under System go to Trap
Management then to Sort By and left click on your choice of Time (default), Received
From or Trap Message (type).
Trap Type Properties
Trap alerts can be color coded by type to make them easier to distinguish in the list.
Open the Trap Type Properties pop-up window to edit the font and background color of
the most urgent trap types.
224
D-View 5.1 User’s Guide
Figure 149
Trap View Filter Settings
Use the Trap View Filter Setting pop up window to limit both the device from which trap
alerts are listed and the type of traps listed. Type the IP address of any device you want
to designate for trap viewing and click the Add button. Highlight a device in the list and
click Remove to remove that device from the trap list.
225
D-View 5.1 User’s Guide
The OIDs tab allows you to limit traps to specific OIDs. Specify OIDs to view by typing
in the OID and clicking Add. To remove an OID from the list, highlight it and click
Remove.
Figure 150
226
D-View 5.1 User’s Guide
How to Edit a TRF File
Figure 151
Note: Before editing a TRF file, you need to compile the primary module’s MIB files and view their
trap entires, type, and value to know how to edit the module’s TRF file.
<Install Directory>\5.1\Conf\Trap\ gives the path for a TRF file. TRF files that are .txt
files are composed with the following syntax and parameters:
1. TRAP_MODULE <Module Name>
At the beginning of the TRF file, define which device is associated with the file. The
<Module Name> parameter is the device name.
2. OBJECT_ID {<Module’s OID>}
Define this device’s OID number. <Module’s OID> parameter is this device’s OID
number.
227
D-View 5.1 User’s Guide
3. INSTANCE <Index>
Define the trap group index number of this device. <Index> is the trap group number of
this device.
4. OBJECT {<trap’s original name>,<trap type>,<trap’s alias name>,……}
Define trap entry’s name, trap data type and its alias name. <Trap’s original name> is
the trap entry name, <trap type> is this trap’s data type, and <trap’s alias name> is this
trap’s entry alias name.
5. SYNTAX {<option name>,<option value>………}
Define trap entry’s option value, if the trap has option value. <Option name> is this
trap entry’s option name; <option value> is the associated value.
6. DESCRIPTION {<description>}
<description> gives a definition of the MIB group.
Trap Log
To turn the trap log on or off, or to view the log, go to System Æ Trap Management Æ
Log select: Log On, Log Off or View Log.
228
D-View 5.1 User’s Guide
Figure 152
SMTP Setting Form
Use the SMTP Setting form to enable email alerts to be sent to the network
administrator. Type the SMTP server and domain name, and Port number used, choose
Simple Login and provide the account and password information if you prefer to use
authentication, otherwise select None. Mail Sender Name is the name that appears as
the sender in the email summary. Supply a sender and receiver address, and you can
option to send a CC to one other email account. Use the Mail Test button to test if all
information has been correctly entered and the system is functioning.
Use the Trap Mail Setting Form to specify the type of alert sent and how frequently mail
alerts should be sent.
229
D-View 5.1 User’s Guide
Figure 153
Trap Mail Settings Forms
Use the IP Address tab specify the device and alarm. The Alarm Level pull-down menu
has standard alarms to choose from. Type the message that accompanies the mail alert
in Alarm Message.
The OID tab is used for proprietary or other objects used to trigger the email alert. Add
and remove items for email alerts the same as with other menus.
230
D-View 5.1 User’s Guide
Figure 154
Alarm Mail Interval
Use the Alarm Mail Interval menu tab to specify the frequency with which email alarms
are sent. Alarm mail intervals may be specified using the Alarm Interval to specify the
number of minutes between emails, or use the Alarm Time to specify times when
emails are sent daily. Alarm mail intervals can be set up using both definitions if
desired. Alarm Time asks you to specify the hour (HH) and minute (MM) using 24-hour
military time.
231
D-View 5.1 User’s Guide
Figure 155
Example: Receiving alarm/trap messages by e-mail
Step 1: Set the SMTP settings.
232
D-View 5.1 User’s Guide
Figure 156
Step 2: After making the settings, you can use “Mail Test” to check whether
the settings are correct.
233
D-View 5.1 User’s Guide
Figure 157
234
D-View 5.1 User’s Guide
Step 3
Figure 158
Step 4: Set alarm time, alarm interval and conditions for sending trap mail.
235
D-View 5.1 User’s Guide
Figure 159
236
D-View 5.1 User’s Guide
Figure 160
237
D-View 5.1 User’s Guide
Figure 161
Adding Plug-In Utilities
You can develop execution files to plug into the D-View platform.
How to install self-developed device SNMP module
SNMP Module execution files must have four parameters:
/NdeviceModuleName
/IIPAddress /RreadCommunityString
/WwriteCommunity String
238
D-View 5.1 User’s Guide
“/N,” “/I,””/R,””/W” respectively stand for Module Name, IP Address, Write
Community String, and Read Community String.
Re-install Windows Registry and set up as follows:
Execute Regedit.
Figure 162
Under HKEY_LOCAL_MACHINEÆSOFTWAREÆD-LinkÆModules there are
four data folders. Enter data into these four data folders as below:
1. ExePath: Record SNMP Device Module execution file with Device OID
as Key. Select and then right-click with mouse on newly added words
value. At the value name input Device OID. Input execution file name.
Add /N before the execution file name.
239
D-View 5.1 User’s Guide
Figure 163
Figure 164
240
D-View 5.1 User’s Guide
2. HelpPath: Record Help file location using Device OID as Key. Select
and right click to added words value. At name value, input Device OID.
Under data value input Help file location and full path name.
Figure 165
241
D-View 5.1 User’s Guide
Figure 166
3. Icon Path: Record the position of icons used using the Device OID as
Key. Select and right click on mouse on newly added words value.
Under name value input Device OID. Under data value input Icon file
location and full path name.
Note: Please make sure you have both the .ico file and the .bmp file of the same
picture. For example, you must have dgs3208.ico and dgs3208.bmp.
242
D-View 5.1 User’s Guide
Figure 167
Figure 168
243
D-View 5.1 User’s Guide
4. Module Info: Record utility related information with OID of Device as
Key. Select and right-click on mouse for newly added words value.
Under name value input Device OID. Under data value there are four
values separated by commas: Device Role, Module Name, Home page,
and Company Name.
Figure 169
244
D-View 5.1 User’s Guide
Figure 170
Install common tools and plug-in to menu item
Step 1: Type /DLINK_INSTALL_PATH?Conf/Resources/NewMenu.ini. For
example, install DIAP2 pathway under Tools Menu.
Figure 171
245
D-View 5.1 User’s Guide
♦
Application Name – Execution file name
♦
Application Path – Execution file pathway
♦
Parameters – Execution file parameters
Step 2: Execution outcome.
.
Figure 172
246
D-View 5.1 User’s Guide
Account
Account is a simple account management system to keep track of the bills. It has the
following new features:
•
Each client is assigned an account with personal authorization IP Address.
Each IP Address will link to one Device Port. The system can verify and track
devices in this manner.
•
Setting statement schedule allows flexibility. Different groups of clients can
generate statements at difference schedules.
•
Detects abnormal usage for clients
•
Assigns custom taxes to service charges (weekly, monthly, every three months,
biannually, annually)
•
Credit adjust function allows you to insert credit records manually and give
credit for wrong or misdialed work.
•
Late fee assessment function allows you to assign late payment charges with
fixed charge or a percentage of late pay amount.
•
Real-time reporting, including current client summary, credit limit status
report, payment report, and the like.
247
D-View 5.1 User’s Guide
Figure 173
The Account system can bundle customer equipment just like the telephone system.
As with telephone numbers, you can manage customers by means of equipment
management.
The menus available are the following:
♦
Client Update
♦
Client Record Query
♦
Client Online Query
♦
Client Abnormal Situation
♦
Device Utilization
248
D-View 5.1 User’s Guide
♦
Pay Rate Configuration
Figure 174
In the previous figure, we established a new customer entry by setting up the basic
information. We charge users a service charge, place time limits on usage, and create
an IP Address that corresponds to a specific port in a device. Thus, customer data is
established.
Client Update
Use the client update menu to view basic client information including Name, Phone, IP
Address, Switch IP Address, Switch Port used, Status, Pay and E-Mail address. To add
a new client, click the Add button to bring up the Client Manager menu (see below).
Update or change existing client information by highlighting the client on the table and
clicking the Modify button. Use the Query button to locate client records form the
database.
249
D-View 5.1 User’s Guide
Figure 175
Use the Freeze Client and Unfreeze Client buttons to disable (Freeze) or enable
(Unfreeze) a frozen port linked to the selected client. The Pay Check button is used to
view the client’s payment status. The Port Check button is used to detect the port
number and status of the client and update the device records from the database. The
Client Status button is used to check a client’s expiration status or to change client
payment terms and expiration deadline.
Client Manager
The Client Manager “Add” is identical to the “Modify” menu.
250
D-View 5.1 User’s Guide
Figure 176
251
D-View 5.1 User’s Guide
How to Manage a Client
Figure 177
When we begin to manage a client we need to determine first whether the client has
paid for services or whether it is past due. If payment is past due we close the
connection (disable its link port) and prevent the client from being connected to the
network. We also need to decide whether the client is experiencing abnormal usage.
Depending on the situation, we may disable the client’s link port and notify the client
so as to not jeopardize other clients.
252
D-View 5.1 User’s Guide
Client Record Query
Locate and view client records using various search conditions including device IP
address, link port, client name and client pay status. Define the parameters and click
the Query button to view the record search results in the record table.
Figure 178
Client Online Query
View client users currently connected to a selected device.
253
D-View 5.1 User’s Guide
Figure 179
Client Abnormal Situation
Use this to check client usage and logs of abnormal situations for a chosen device.
254
D-View 5.1 User’s Guide
Figure 180
Device Utilization
Analyze network usage and query total number of ports and ports open for a device.
255
D-View 5.1 User’s Guide
Figure 181
Device Group Manager
Figure 182
256
D-View 5.1 User’s Guide
Use the Group Manager to group devices according to purpose, location, team etc.
Select devices from the tree and drag them to another group. Add or Delete groups and
teams with the buttons on the bottom of the menu.
Figure 183
Pay Rate Configuration
To Add, Modify or Delete pay rate categories, type or select information in the spaces
provided at the bottom of the menu.
257
D-View 5.1 User’s Guide
Figure 184
258
D-View 5.1 User’s Guide
A
T ROUBLESHOOTING
This appendix provides troubleshooting tips for common problems you may encounter
while using the D-View network management system. Before calling for help, try first
the solutions presented in this section.
♦
Problem – Can’t open D-View with database error.
♦
Solution – Please install Access 2000.
♦
Problem – Can’t find any SNMP devices in D-View.
♦
Solution – Please check the SNMP read community string.
Figure 185
♦
Problem – Can’t use MIB Utilities to manage the device in D-View.
♦
Solution – Please check the write community string and read community
string in the device and check if this device supports MIBs.
259
D-View 5.1 User’s Guide
Figure 186
♦
Problem – Can’t send trap mail.
♦
Solution – Check the Trap Mail SMTP Settings (SMTP Server, Port, Type,
etc.) and Trap Mail Interval Settings (IP Address, Alarm Level, Alarm
Message).
260
D-View 5.1 User’s Guide
Figure 187
261
D-View 5.1 User’s Guide
Figure 188
♦
Problem – Auto-discover can’t find the device you want.
♦
Solution – Use the Discover function (under System) to find the device you
want.
262
D-View 5.1 User’s Guide
Figure 189
♦
Problem – Can’t inset a device into the D-View 5.1 platform manually.
♦
Solution – To insert a device into D-View 5.1 manually, right-click on tree
view or list view in the D-View Platform with the mouse to bring up the popup menu. Select “Add Device” then shows the “new device form.” Input
parameters and click the ok button.
♦
Problem – Can’t import the new device module into D-View 5.1.
♦
Solution – You can install the device module from the D-View 5.1 CD-Rom.
If you want to upgrade the device module, you can download the latest
Module Setup file from the D-Link web site http://www.dlink.com.tw/.
263
D-View 5.1 User’s Guide
♦
Problem – Can’t find wireless AP module in D-View 5.1
♦
Solution – You can install the device module from the D-View 5.1 CD-ROM.
If you want to upgrade the device module, you can download the latest
Module Setup file from the D-Link Website http://www.dlink.com.tw/.
264
D-View 5.1 User’s Guide
B
M ENU /C OMMAND Q UICK R EFERENCE
System
Discover
View
Topology View
Basic Information
Tree View
Edit
Device
Properties
Copy
Delete
Repolling Configuration
Community String
Configuration
List View
Save to Database
MessagesTraps View
Trap Management
Trap Editor
Trap Mail SMTP
Settings
Background Color
Domain
New
SubDomain
New Device
Copy
Paste
Delete
New
Topology
Find Object
MIBs
SNMP Device Configuration
MIB II (read-only menus)
Information,
IF Table,
IF Counters,
IP Counters,
IP Routing,
IP Address Table, ICMP
Counters, UDP Counters,
SNMP Counters
Bridge 802.1d
Information,
Port Table
Spanning Tree
Information,
Port Table
Transparent Bridge
Forwarding Table, Static
Table,
Port Counters
RMON
Statistics, History,
Alarm/Event
802.1P
Basic Configuration, Priority
Information,
Port
Capability, GMRP, GARP
802.1Q
(802.1Q Bridge Æ) Basic
Configuration,
Ports Information, General
Information,
Learning
Constraint Information
802.1Q VLAN,
Forwarding/Filtering,
Unicast//Multicast, Static
Filtering
Traffic statistics
Port VLAN Statistics
Information, High Capacity
Port, VLAN Statistics
Information
Layer 3 Utilities
IP Forwarding, RIP 2, OSPF
Æ (OSPF pop-up menus)
IP mroute, DVMRP
SNMP V3
265
Tools
MIB tools
MIB Browser,
MIB Compiler
Account
Client Update
Window
Cascade
Client Record Query
Tile
DIAP
Client Online Query
Minimize
TFTP Server
Client Unusual
Situations
Device Utilization
BootP
Ping
Telnet
Device Group
(Tools Æ) Rate
Configuration,
Detect Device Ports
D-View 5.1 User’s Guide
I NDEX
A
E
abnormal usage ........................ 23, 245
Account .............................. 17, 22, 245
Alarm Level ..................................... 228
Alarm Mail Interval ......................... 229
Auto Discover ................................... 19
Entity Logical Table .........................138
Ethernet ............................................19
Event controls .................................176
F
Favorites group .................................25
B
G
background picture......................... 109
bitmap files ....................................... 90
GARP...............................................178
GMRP ..............................................178
GUI (Graphic User Interface)..............24
C
Client Abnormal Situation............... 252
Client manager ............................... 247
Client Online Query ........................ 251
Client Record Query........................ 251
Client Update.................................. 247
community string.............................. 30
company group ........................... 26, 33
connect/disconnect messages........... 26
counter tables................................. 158
credit adjust function........................ 23
Credit adjust function ..................... 245
L
Layer 2, Layer 3 functions ...............113
Layer 3 utilities .........................19, 191
line function ....................................110
list view .............................................19
M
MIB
MIB
MIB
MIB
MIB
MIB
D
device control.................................... 36
Device Group Manager.................... 255
Device Port...................................... 245
Device Utilization ............................ 253
Discover............................................ 41
(Management information Base) .74
Browser....................64, 65, 66, 67
Compiler ....................................74
II ..............................................117
utilities.....................................257
values ........................................80
N
New Device ........................................35
new device module ..........................261
266
D-View 5.1 User’s Guide
SNMPv3 .......................................... 209
STP port settings............................. 154
STP Port Table ................................ 154
subdomain........................................ 33
O
OID ...................................................74
OIDs tab..........................................224
P
T
Pay Rate Configuration....................255
ping...................................................42
Ping Test .........................................213
plug-in management module .............58
poll....................................................43
Poll Interval and Count ...................158
Port Capability ................................181
Port Capability Form .......................178
port number....................................181
port statistics ..................................190
Properties..........................................67
Table view ......................................... 75
telnet ................................................ 48
Tool pad............................................ 26
Tool tab............................................. 93
topology ............................................ 19
Traffic Class State ........................... 179
traffic graphs .................................. 158
trap................................................... 54
trap alerts ............................... 222, 223
trap management...................... 58, 220
tree view ........................................... 19
R
U
repolling ............................................30
repolling configuration menu.............30
RFC.................................................113
RMON Alarm ...................................170
unicast discovery .............................. 42
User Define pad ................................ 26
User Define Tab .............................. 102
V
S
view settings ..................................... 38
VLAN Configuration Form ............... 186
VLANs settings................................ 184
Set module color ...............................88
Set module font .................................87
Set table ............................................83
SNMP configuration...........................41
SNMP device................................24, 67
SNMP enabled device ........................75
W
wireless AP module ......................... 262
267
Offices
Australia
D-Link Australasia
1 Giffnock Avenue, North Ryde, NSW 2113, Sydney, Australia
TEL: 61-2-8899-1800 FAX: 61-2-8899-1868 TOLL FREE (Australia): 1800-177100
TOLL FREE (New Zealand): 0800-900900
URL: www.dlink.com.au E-MAIL: [email protected] & [email protected]
Level 1, 434 St. Kilda Road, Melbourne, Victoria 3004 Australia
TEL: 61-3-9281-3232 FAX: 61-3-9281-3229 MOBILE: 0412-660-064
Canada
D-Link Canada
2180 Winston Park Drive, Oakville, Ontario, L6H 5W1 Canada
TEL: 1-905-829-5033 FAX: 1-905-829-5095 BBS: 1-965-279-8732
TOLL FREE: 1-800-354-6522 URL: www.dlink.ca
FTP: ftp.dlinknet.com E-MAIL: [email protected]
Chile
D-Link South America
Isidora Goyenechea 2934 Of. 702, Las Condes Fono, 2323185, Santiago, Chile, S. A.
TEL: 56-2-232-3185 FAX: 56-2-232-0923 URL: www.dlink.cl
E-MAIL: [email protected] & [email protected]
China
D-Link China
15th Floor, Science & Technology Tower, No.11, Baishiqiao Road, Haidan District, 100081
Beijing, China
TEL: 86-10-68467106 FAX: 86-10-68467110 URL: www.dlink.com.cn
E-MAIL: [email protected]
Denmark
D-Link Denmark
Naverland 2, DK-2600 Glostrup, Copenhagen, Denmark
TEL: 45-43-969040 FAX:45-43-424347 URL: www.dlink.dk E-MAIL: [email protected]
Egypt
D-Link Middle East
7 Assem Ebn Sabet Street, Heliopolis, Cairo, Egypt
TEL: 20-2-635-6176 FAX: 20-2-635-6192 URL: www.dlink-me.com
E-MAIL: [email protected] & [email protected]
Finland
D-Link Finland
Pakkalankuja 7A, FIN– 0150 VANTAA, Finland
TEL: 358-9-2707-5080 FAX: 358-9-2702-5081 URL: www.dlink-fi.com
France
D-Link France
Le Florilege, No. 2, Allea de la Fresnerie, 78330 Fontenay Le Fleury, France
TEL: 33-1-3023-8688 FAX: 33-1-3023-8689 URL: www.dlink-france.fr
E-MAIL: [email protected]
Germany
D-Link Central Europe/D-Link Deutschland GmbH
Schwalbacher Strasse 74, D-65760 Eschborn, Germany
TEL: 49-6196-77990 FAX: 49-6196-7799300 URL: www.dlink.de
BBS: 49-(0) 6192-971199 (analog) BBS: 49-(0) 6192-971198 (ISDN)
INFO: 00800-7250-0000 (toll free) HELP: 00800-7250-4000 (toll free)
REPAIR: 00800-7250-8000 E-MAIL: [email protected]
India
D-Link India
Plot No.5, Bandra-Kurla Complex Rd., Off Cst Rd., Santacruz (East),
Mumbai, 400 098 India
TEL: 91-022-652-6696/6578/6623 FAX: 91-022-652-8914/8476
URL: www.dlink-india.com, www.dlink.co.in & [email protected]
E-MAIL: [email protected]
Italy
D-Link Mediterraneo Srl/D-Link Italia
Via Nino Bonnet n. 6/B, 20154, Milano, Italy
TEL: 39-02-2900-0676 FAX: 39-02-2900-1723 URL: www.dlink.it E-MAIL: [email protected]
Japan
D-Link Japan
10F, 8-8-15 Nishigotahda, Shinagawa, Tokyo 141, Japan
TEL: 81-3-5434-9678 FAX: 81-3-5434-9868 URL: www.d-link.co.jp
E-MAIL: [email protected]
Netherlands
D-Link Benelux
Fellenoord 1305611 ZB, Eindhoven, the Netherlands
TEL: 31-40-2668713 FAX: 31-40-2668666 URL: www.d-link-benelux.nl
Norway
D-Link Norway
Waldemar Thranesgate 77, 0175 Oslo, Norway
TEL: 47-22-991890 FAX: 47-22-207039 URL: www.dlink.no
Russia
D-Link Russia
Michurinski Prospekt 49, 117607 Moscow, Russia
TEL: 7-095-737-3389 & 7-095-737-3492 FAX: 7-095-737-3390 URL: www.dlink.ru
E-MAIL: [email protected]
Singapore
D-Link International
1 International Business Park, #03-12 The Synergy, Singapore 609917
TEL: 65-774-6233 FAX: 65-774-6322 E-MAIL: [email protected]
URL: www.dlink-intl.com
South Africa
D-Link South Africa
Unit 2, Parkside, 86 Oak Avenue, Highveld Technopark,
Centurion, Gauteng, South Africa
TEL: 27 (0) 12-665-2165 FAX: 27 (0) 12-665-2186 URL: www.d-link.co.za
E-MAIL: [email protected]
Spain
D-Link Iberia
C/Sabino De Arana, 56 Bajos, 08028 Barcelona, Spain
TEL: 34 93 4090770 FAX: 34 93 4910795 URL: www.dlinkiberia.es
E-MAIL: [email protected]
Sweden
D-Link Sweden
P. O. Box 15036, S-167 15 Bromma, Sweden
TEL: 46-(0) 8-564-61900 FAX: 46-(0) 8-564-61901 E-MAIL: [email protected]
URL: www.dlink.se
Taiwan
D-Link Taiwan
2F, No. 233-2 Pao-chiao Rd, Hsin-tien, Taipei, Taiwan
TEL: 886-2-2916-1600 FAX: 886-2-2914-6299 URL: www.dlink.com.tw
E-MAIL: [email protected]
Turkey
D-Link Middle East
Deniz Bilgisayar, Buyukdere Cad. Naci Kasim Sk., No. 5 Mecidiyekoy, Istanbul, Turkey
TEL: 90-212-213-3400 FAX: 90-212-213-3420 E-MAIL: [email protected]
U.A.E.
D-Link Middle East
CHS Aptec (Dubai), P.O. Box 33550 Dubai U.A.E.
TEL: 971-4-366-885 FAX: 971-4-355-941 E-MAIL: [email protected]
U.K.
D-Link Europe
4th Floor, Merit House, Edgware Road, Colindale, London NW9 5AB United Kingdom
TEL: 44 (0) 20-8731-5555 FAX: 44 (0) 20-8731-5511 BBS: 44 (0) 181-235-5511
URL: www.dlink.co.uk E-MAIL: [email protected]
U.S.A.
D-Link U.S.A.
53 Discovery Drive, Irvine, CA 92618, USA
TEL: 1-949-788-0805 FAX: 1-949-753-7033 BBS: 1-949-455-1779 & 1-949-455-9616
INFO: 1-800-326-1688 URL: www.dlink.com
E-MAIL: [email protected] & [email protected]
Registration Card
Print, type or use block letters.
Your name: Mr./Ms_____________________________________________________________________________
Organization: ________________________________________________ Dept. ____________________________
Your title at organization: ________________________________________________________________________
Telephone: _______________________________________ Fax:________________________________________
Organization's full address: ______________________________________________________________________
____________________________________________________________________________________________
Country: _____________________________________________________________________________________
Date of purchase (Month/Day/Year): _______________________________________________________________
Product Model
Product Serial
No.
* Product installed in type of
computer (e.g., Compaq 486)
* Product installed in
computer serial No.
(* Applies to adapters only)
Product was purchased from:
Reseller's name: ______________________________________________________________________________
Telephone: _______________________________________ Fax:________________________________________
Reseller's full address: _________________________________________________________________________
_________________________________________________________________________
_________________________________________________________________________
Answers to the following questions help us to support your product:
1. Where and how will the product primarily be used?
Home Office Travel Company Business Home Business Personal Use
2. How many employees work at installation site?
1 employee 2-9 10-49 50-99 100-499 500-999 1000 or more
3. What network protocol(s) does your organization use ?
XNS/IPX TCP/IP DECnet Others_____________________________
4. What network operating system(s) does your organization use ?
D-Link LANsmart Novell NetWare NetWare Lite SCO Unix/Xenix PC NFS 3Com 3+Open
Banyan Vines DECnet Pathwork Windows NT Windows NTAS Windows '95
Others__________________________________________
5. What network management program does your organization use ?
D-View HP OpenView/Windows HP OpenView/Unix SunNet Manager Novell NMS
NetView 6000 Others________________________________________
6. What network medium/media does your organization use ?
Fiber-optics Thick coax Ethernet Thin coax Ethernet 10BASE-T UTP/STP
100BASE-TX 100BASE-T4 100VGAnyLAN Others_________________
7. What applications are used on your network?
Desktop publishing Spreadsheet Word processing CAD/CAM
Database management Accounting Others_____________________
8. What category best describes your company?
Aerospace Engineering Education Finance Hospital Legal Insurance/Real Estate Manufacturing
Retail/Chainstore/Wholesale Government Transportation/Utilities/Communication VAR
System house/company Other________________________________
9. Would you recommend your D-Link product to a friend?
Yes No Don't know yet
10.Your comments on this product?
__________________________________________________________________________________________