1
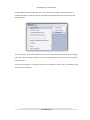
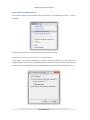
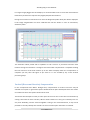
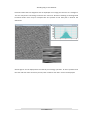
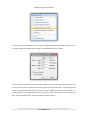
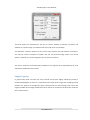
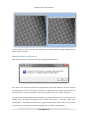
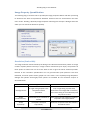
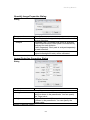
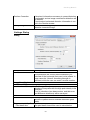
Nov. 2015
Jitterbug
for DigitalMicrograph
Scan-noise and Drift Compensation Plug-in
Jitterbug Manual 2.3
HREM Research Inc
JitterbugPlug-inUserManual
Preface
This user manual describes how to install and operate the Jitterbug scan-noise and drift
compensationplug-in(version2.x)forDigitalMicrograph.
Thesoftwareisbasedonthefull-lengthmanuscriptbyDrLewysJonesandProfPeterD.Nellst:
LewysJonesandPeterD.Nellist.“IdentifyingandCorrectingScanNoiseandDriftintheScanning
TransmissionElectronMicroscope”.MicroscopyandMicroanalysis(2013)19,p.1050-1060.
As this tool applies post-processing steps to experimental data, users should state explicitly
whensuchstepshavebeenappliedbycitingtheabovepapersuchas:
“imagescan-noiseanddriftwascompensatedusingtheJitterbugsoftwaredescribedin[1]”.
Contact
Enquiriesregardingsales,licensing,installationandoperationoftheplug-inshouldbedirected
toDrKazuoIshizukaat:
[email protected]
Forquestionsabouttheacademicmanuscriptreferencedabove,pleasecontactDrLewysJones
at:
[email protected]
CopyrightStatements
©Copyright2015HREMResearchInc.
All rights reserved. This manual is protected by international copyright laws and treaties.
Unauthorized reproduction and distribution of this manual, or any portion of it, will be
prosecutedtothemaximumextentpossibleandmayresultinseverecivilandcriminalpenalties.
DigitalMicrographisatrademarkofGatanInc.
2
JitterbugPlug-inUserManual
Contents
WhentousethisPlug-in.................................................................................................................4
Installation......................................................................................................................................5
SoftwareRequirements..............................................................................................................5
SoftwareInstallation...................................................................................................................5
TypicalWorkflow............................................................................................................................6
Plug-inMenu...................................................................................................................................7
SupportedFileTypes.......................................................................................................................7
PeakFinding....................................................................................................................................8
Scan-noiseCompensation.............................................................................................................12
Horizontal(Fast-scanDirection)Compensation.......................................................................12
Vertical(Slow-scanDirection)Compensation...........................................................................13
FastModeforSparseImages....................................................................................................14
ImageDriftCorrection..................................................................................................................17
SettingofBaseVectors.............................................................................................................17
DescriptionofExpectedGeometry...........................................................................................19
ImageCropping.........................................................................................................................21
MagnificationRe-calibration.....................................................................................................22
ImagePropertyQuantification......................................................................................................23
Resolution(Peakwidth)............................................................................................................23
Signal-noiseRatio&Signal-backgroundRatio(SNR/SBR).........................................................24
Scan-noiseSpectralAnalysis.........................................................................................................26
ProcessingTime-seriesData.........................................................................................................28
AdvancedOptions(theSettingsMenu)........................................................................................29
Fast-scanLineSmoothnessParameter.....................................................................................29
ImageQuantificationOptions...................................................................................................29
BrightFieldOption....................................................................................................................29
3
JitterbugPlug-inUserManual
WhentousethisPlug-in
The Jitterbug plug-in for Digital Micrograph is designed to correct some of the most common
image distortions encountered during atomic-resolution imaging in the scanning transmission
electronmicroscope(STEM)includingscan-noiseandimagedrift.
Scan-noise will often appear in images as ‘sliced’ or ‘torn’ atomic features and is also often
observed in Fourier transforms as white vertical bands streaking from low order spots (see
below).Alternatively,imagedriftcanbeobservedasadeviationofknownlatticeplaneangles
(expectedtobe90°intheexamplebelow)ordistortionofknownlatticeplanespacings.
Ifyourdataincludesthesetypesofdistortionthenitmaybepossibletorecoversomeorallof
thelostperformancecausedbyscan-noise.Ofcourseiftheimageisveryheavilydegradeditwill
notbepossibletocompensatethisentirely.Equallythisplug-incannotcreateresolutionthatdid
not exist prior to the incorporation of scan-noise. For further information and some related
readingpleaseseethereferencegivenonpage2.
4
JitterbugPlug-inUserManual
Installation
SoftwareRequirements
ThefollowingisalistofthesoftwarerequirementsnecessarytoruntheJitterbugplug-in:
•
•
•
•
•
DigitalMicrograph(GATANTM)
USBKeyDriver
HREMMouseToolPlug-in(Free-waredownloadablefromwww.hremresearch.com)
IPUPlug-in(Free-waredownloadablefromwww.hremresearch.com)
MatlabMCR(MatlabCompilerRuntime)
SoftwareInstallation
InstallingUSBKeyDriver
The user key driver should be installed by following the instructions given by the key driver
installer.Thekeydriverinstallercanbefoundonourwebsite.
InstallingJitterbugPlug-in
The plug-in can be installed by drag-and-drop copy to the folder “PlugIns” (The PlugIns folder
shouldexistunderanormalinstallationoftheDigitalMicrograph.)
When the DigitalMicrograph is launched after placing the plug-ins into the PlugIns folder,
Jitterbugmenucommandswillappearunder“Jitterbug”menu.
InstallingMouseTools
All the files relating Mouse tool plug-in can be installed by drag-and-drop copy to the folder
“PlugIns.”(ThePlugInsfoldershouldexistunderanormalinstallationoftheDigitalMicrograph.)
When the DigitalMicrograph is launched after placing the plug-ins into the PlugIns folder, the
Mousetoolwillappearasanadditiontothestandardtools.
InstallingIPUPlug-in
JitterbugusessomefunctionsbasedontheIntel’MKL(MathKernelLibrary)providedbytheIPU
plug-in. All the files relating the IPU plug-in can be installed by drag-and-drop copy. Please
consulttheReadMefilethatcomeswiththeIPUplug-in.
InstallingMatlabMCR
The Matlab MCR should be installed by following the instructions given by the installer. The
MatlabMCRthatiscompatiblewiththeJitterbugcanbefoundonourwebsite.
5
JitterbugPlug-inUserManual
TypicalWorkflow
Manyofthetoolsincludedinthisplug-incanbeusedindependentlyasrequired.Wheretools
depend upon using one or more features together this will be described in the sections that
follow.Atypicaluserworkflowforthecorrectionofimagescan-noiseanddriftisshownbelow:
•
Imagepeak-finding
Scannoisecompensationfirstrequiresthecoordinatesof
features in the STEM image to be identified. Typically a
featurewillcorrespondtoaresolvedatomiccolumn.
•
Peak-finding
refinement
Should the automated peak-finding miss some peaks or
find extra peaks the user may add / remove these
manuallyusingthecursor.
•
Scan-nosie
compensaoon
Scan-noise compensation is performed in the horizontal
(fast-scan)directionandoptionallythevertical(slow-scan)
direction
•
Lapcebasevector
definioon
For drift measurement and compensation (optional) the
lattice base vectors must be identified. These directions
willalsobeusedforandimageline-profilesused.
•
Driqmeasurement
andcompensaoon
The user enters the expected (drift free) lattice
parameters and angles and the image drift is calculated
andrestored.
•
Imagemagnificaoon
re-calibraoon
If drift-correction has been used, the true image
magnification can now be calibrated using the
diffractogram.
•
Imageproperty
quanoficaoon
After the corrections are complete image resolution and
signal-noise/signal-backgroundratioscanbequantified.
Thefollowingexampleswillusethesuppliedexampleimagetodemonstratethevarioussteps.
6
JitterbugPlug-inUserManual
Plug-inMenu
ThefigurebelowshowsthedefaultmenufortheJitterbugplug-in:
Inthemenu,itemswhicharecurrentlyunavailableareshowningrey.Asyoumovethroughthe
workflow,furtheroptionsbecomeavailableasneeded.
SupportedFileTypes
Tobegin,theusershouldhavethefileopenwithintheDigitalMicrographworkspace.Toopena
fileeitheropenitfromyourcomputerorfromwithinDMbygoingtoFile>Open.
Theplug-insupportsallimageformatssupportedbyDM,however,itisessentialthattheimages
to be processed have received no image compression (such as JPEGs) and have had no pixel
resampling(eitherup-samplingordown-sampling).
7
JitterbugPlug-inUserManual
PeakFinding
Scan-noisecompensationrequiresthepeakpositionsoffeaturestohavebeenidentified.Thisis
doneusingthemenu:Jitterbug>IdentifyPeaks:
Two options are presented for the peak-finding, manual target-separation or automatic. If the
approximateseparationbetweenatomicfeaturesisknown(inunitsofpixels)thenthiscanbe
inputinthedialogueboxandthesoftwarewillsearchforfeaturesapproximatelythisseparation
fromoneanother.Thereisnorequirementforthefeaturestobeinaregulararraynorforany
templatetobespecified.Iftime-seriesdataisselected,thenpeak-findingwillbeperformedon
thestack-average.
For the example image supplied the separation of features is approximately 19 pixels.
Alternatively the option of “Search full range” can be used. In this mode all possible targetseparationswillbeevaluatedandtheplug-inwilltrytoautomaticallyselectthebestvalue.This
8
JitterbugPlug-inUserManual
optionisslowerandshouldgenerallybeavoidedforimageslargerthan512x512px.(Thenext
releasewillgiveapossibilitytoselectasearcharea,iftheimagesizeislargerthan512x512px.)
If‘Searchfullrange’isselected,thenduringthepeak-distanceoptimizationstageanadditional
dataoutputwillbedisplayed:
These figures show (top) the absolute number of possible candidate peaks found for different
searchsettings,and(bottom)thefittingusedtodeterminethebestplateauinthepeak-number
data. This point indicates the most robust size parameter and hence is the best choice for the
automatedoptimizationstep.Thevaluefromtheoptimizationisthentakenfortheautomated
peak-finding.
Ifforsomereasontheautomatedoptimizationisnotabletoproduceanacceptableresult(such
asverynoisydata)thentheusermayusethesefigurestochooseareasonablemanualestimate.
9
JitterbugPlug-inUserManual
Afterthepeakfindingiscompleteanewimagewillopenwiththeresultsindicatedbyreddots:
Here all features have been identified successfully, however the user can also add or remove
pointsmanually.AddingorremovingpointsisdoneusingtheHREMMousecursor:
SelectionTool 10
HREMMouseTool
JitterbugPlug-inUserManual
Toaddadditionalpeakssimplyclickoneormorepointsontheimage.Thesewillappearas
numberedsquaresaroundthepointclicked.Whenfinishedaddthepeakmanuallyusingthe
Jitterbugmenu:
Toremovepeaks,usethesameMousetoolandclicknearbythefeature(s)toberemoved.Again
selectthe“RemovePeaks”optionfromthemenuandthefeatureclosesttothepositionclicked
willberemoved.
The process of adding or removing peaks can be repeated as many times as needed until the
desiredresultisachieved.
11
JitterbugPlug-inUserManual
Scan-noiseCompensation
Once feature positions are identified the menu option to “Compensate Scan Noise…” will be
available:
Thedialogueboxforscan-noisecompensationoptionswillthenopen.
Horizontal(Fast-scanDirection)Compensation
In this plug-in scan-noise compensation is achieved through comparison of image data with
neighboringrows.Ofcourseintheoriginaldatatheserowstoomaybethemselvesdistortedand
sotherestorationisperformediteratively.Bydefaulthorizontalscan-noisecompensationison.
12
JitterbugPlug-inUserManual
Forlargerimages(biggerthan512x512px)itisrecommendedtousenomorethanfiveiterations.
Restorationperformanceimprovesonlyslightlybeyondtwoiterations.
Duringthecorrectionofhorizontalscannoisethediagnosedprobeoffsetplotwillbedisplayed.
If the image magnification has been calibrated this will be shown in units of nanometers,
otherwisepixels.
This distortion offset profile will be updated as each scan-line is processed and with each
iterationduringtherestoration.Thefigurewillremainaftercompensationiscompleteshowing
the final scan-line of the final iteration (5 in the above example). After the compensation is
complete you may close this figure if you wish as it is not needed by any of the onward
processingsteps.
Vertical(Slow-scanDirection)Compensation
In the “Compensate Scan Noise” dialogue box, compensation of vertical scan-noise may be
selectedasanoption.Ingeneralthisoptionshouldbelefton(boxchecked)buttherearecertain
circumstanceswherethisoptionshouldnotbeused.
Thisfeaturewillattempttolocallyre-orderpartsofthescanlinesintheslow-scandirectionby
sorting rows based on their intensity. Where atomic features are only just resolved (such as a
veryclosedumbells),andthenearestneighborisalonganearverticaldirection,itmaynotbe
possibletocorrectlyidentifythisverticalscan-noiseandtheoptionshouldbeun-checked.
13
JitterbugPlug-inUserManual
FastModeforSparseImages
Forimageswherethefieldofviewisnotfilledwithsample(suchasnano-particlesorsamples
with an edge) it may not be necessary to scan-noise compensate the whole image. In regions
whichdonotcontainatomicresolutioninformation(andhencearenotidentifiedbythepeakfinding)nobenefitwillbeobserveduponthiscorrection.Inthissituationa‘fastmode’maybe
usedwhichwillaimtoreducethenumberofcalculationsmadewherepossibletospeedupthe
restoration.Tousethismodeselecttheoption“Peakregionsonly”.
Afterscan-compensationiscompletetherestoredimagewillbereturnedinanewwindowwith
atitlethatreflectsthisresult.
CompensateScanNoise–DisplayOptions
Thesecondtabofthe‘CompensateScanNoise’dialoguegivesusersthechoicetogenerateextra
diagnostic data about the applied corrections. By default these are not needed but may be
usefulforpowerusersordebugging.
14
JitterbugPlug-inUserManual
Horizontalshiftsthatarediagnosedcanbedisplayedasanimageplotandalsoasahistogram.
The user may find it interesting to observe the ‘fast-scan’ direction streaking of the diagnosed
horizontal shifts. Users may for example take line profiles of this shift plot to observe the
distortions.
Similarfigurescanbedisplayedforthevertical(row-sorting)operation.Asthisisperformedat
thestartandendofthecorrectionprocess,botha‘before’and‘after’versionaredisplayed.
15
JitterbugPlug-inUserManual
16
JitterbugPlug-inUserManual
ImageDriftCorrection
Inpracticeimage/stage/sampledriftmaybepresent.Thesedriftsappearasasingleoverall
drift vector and may be present in any arbitrary direction; because of this no specific scanrotationneedbeprescribedwhenrecordingimagedatatousewiththisplug-in.
SettingofBaseVectors
Todiagnoseanyvariationfromtheexpectedcrystalstructureapairofbasevectorsmustfirstbe
defined. This is done using the HREM Mouse tool. The process for this is to first click on an
atomiccolumnthatistobeusedastheoriginandthentoclicktwopointsthatdefinetheends
ofthetwobasisvectors.
17
JitterbugPlug-inUserManual
Thepointswillbeindicatedbyredsquaresandlabeled1,2and3.Ifyoumakeanerrorand/or
wishtochangetheselection,simplyremovethepoints(usingCntr+A/Cmnd+Aandbackspace/
delete)andidentifynewones.Afteryouarehappywiththedesignationthenselect“SetBase
Vectors”fromtheJitterbugmenu.
This will generate an array of points (see below) to highlight repeat units of the identified
crystallography.Againtheusershouldverifytheresulthereisacceptableandifnotrepeatthe
selectionofthebasevectors.
18
JitterbugPlug-inUserManual
Ingeneralselectingbasevectorsthatarelagerwillleadtoamoreprecisemeasurementofthe
propertiesofthisrepeatunit.
Iftheimageusedcontainsmorethanonecrystal(e.g.agrainboundary)theneitherregionmay
be used and should yield the same result. If the sample contains a defect or some irregular
structurethentheaboveprocessshouldbeperformedonthebulkregionintheimage.
DescriptionofExpectedGeometry
Afterthebasevectorshavebeendefinedasabovetheusermaynowcorrectfortheimagedrift.
ThisisdonefromtheJitterbugmenuselecting“ImageDistortionCorrection”:
19
JitterbugPlug-inUserManual
Thiswillopenthe“ImageDistortionCorrection”dialogwindowwhichwillshowboththecurrent
andtargetlengthsandanglesoftherepeatunitidentifiedbythebasevectors:
Inthisexampledata(strontiumtitanate[100]projection)therepeatunitshouldbesquare,that
is the two base vectors should be identical lengths and separated by 90°. The dialog window
showsthelengthstobedifferentbyaround7%andtheanglebetweenthemtobeonly83°.To
correct this you may modify either the first or second vector’s properties or some mixture of
both.Forthisexamplevector1willbemodifiedtomatchvector2:
20
JitterbugPlug-inUserManual
Two final options are presented for the user to choose: whether to perform correction and
whethertocroptheimage.Thedefaultmodeisforbothtobeon(checked).
The distortion correction feature can be used to only measure the drift without correcting it.
This may be used for example to compare the raw and restored image results. The second
optioniswhethertocroptheimageafterthecorrectiontransform.
Thevectorsusedherecouldhavebeenidentifiedintheoppositesense(separatedby97°)and
wouldhaveyieldedthesameresults.
ImageCropping
In general after drift correction the true scanned area will be slightly off-square (usually a
rotatedparallelogram).Iftheuserisinterestedintheshapeofthisimagethencroppingmaybe
disabled. For general use though this option should be left on and the plug-in will return the
largestpossiblesquareimagesuitableforfurtheranalysis.Acomparisonofthesetworesultsfor
thisisshownbelow:
21
JitterbugPlug-inUserManual
Inbothimagesthesamecorrectionwasappliedbutasexpectedwithcroppingaslightlysmaller
fieldofviewisreturned.
MagnificationRe-calibration
Afterdriftcorrectionanimportantwarningmessagewillbedisplayed:
Asaresultofthepreviouslyasymmetricmagnification(around7%differenceinvectorlengths)
themagnificationofthenewimagemustnowbere-calibrated.Ifthisstageisignoredthenany
measurementsorscale-barsappliedtothedatamayyieldanerrorofasimilarmagnitude.
Tocalibratetheimagemagnificationthespacingofafamilyoflatticeplanesmustbeknownand
applied using the Digital Micrograph menu option “Microscope > Calibrate Image From
Diffractogram”.Thedifferencebetweentheoriginaldistorteddataandthedriftcorrectedresult
canbeseeniftheimagetagsareinspected(rightclickonimage>ImageDisplay…).
22
JitterbugPlug-inUserManual
ImagePropertyQuantification
TheJitterbugplug-incontainstoolstoquantifytheimagepropertiesbeforeandafterprocessing
to determine the level of improvement delivered. All these tools are accessed from the main
menuunder:Jitterbug>QuantifyImageProperties.Selectingthiswillopenadialogueboxfrom
whichyoucanchoosethedetailstoquantify:
Resolution(Peakwidth)
Theimageresolutionisdeterminedbythefittingofone-dimensionalGaussianprofilestoalarge
numberofpeaks(atomic-columns)inalargenumberofdirections(0.5°steps).Thepositionsof
these peaks are taken from all across the field of view to give the fairest estimate possible.
Because of this resolution quantification can only proceed after peak positions have been
identified,ifnotthisoptionwillbe‘greyedout’inthemenu.Inthe‘QuantifyImageProperties’
dialogue box (shown above-right) three options are available for the resolution analysis as
describedbelow:
Method
Approach
“AveragedPeak”
Asingleaveragedpeakisfirst
computedandthen
quantified.
“Peaks
Simultaneously”
Allpeaksareanalysed
simultaneouslyasafunctionof
azimuth.
Mostusefulgeneralsettingforstandard
computersandimagequalities.
“Peaks
Separately”
Eachpeakisanalysed
sequentially.
Usefulforcomputerswithlittlememory
butwillbeslower.
23
Usefulfor…
Usefulwhenafastestimateisneeded(as
onlyasinglefittingisperformed).
UsefulwhentheimageSNRisextremely
lowandthefittingofeachindividualpeak
maynotbetrusted
JitterbugPlug-inUserManual
The results of the second and third methods should be the same. A typical output is shown
below:
If the image has its magnification calibrated then this display will be in units of nanometers,
otherwisepixels.Inadditiontothisoutputthenumericalresultswillbeprintedtothe“Output
Window”:
Signal-noiseRatio&Signal-backgroundRatio(SNR/SBR)
TheimageSNR/SBRiscalculatedusingmany1Dlineprofilesthroughthedataasdescribedinthe
academic manuscript. The positions and directions of these line profiles are defined based on
the based vectors set in the image (see above section on drift correction). If appropriate base
vectors are not set then the option to quantify SNR/SBR will be ‘greyed out’ in the “Quantify
ImageProperties”dialoguebox.Thedirectionsusedwillbealongbothofthesetbasevectors
24
JitterbugPlug-inUserManual
and also along directions bisecting these two (a total of four directions). The number of line
profilesineachdirectionissetinthesettingsdialogue(seebelow).
Duringtheanalysisagreenlinerunningthroughthespecifieddirectionswillindicatewherethe
line-profilesarebeingtakenfrom.Witheachline-profileafigurewillshowtheanalysis:
TheunitshererepresentimagecountsandallnumericalratiosforSNRandSBRareexpressed
withoutunits.AgainthesearealsoprintedtotheOutputWindow.
25
JitterbugPlug-inUserManual
Scan-noiseSpectralAnalysis
The Jitterbug plug-in can also be used to
estimate the dominant distortions present in
theEMsuite.
NOTE: this data should be used as a guide to
EMsuitediagnosisonlyanddoesnotreplacea
fullsuiteanalysisconsolation.
To use this function the image must already
haveitspeakfeaturesidentified,otherwisethis
option will be ‘greyed out’. From the main
Jitterbug menu, select “Diagnose Instability
Frequencies”(right).
Once running two windows will be displayed; the first represents the ‘distortion oscilloscope’
and shows the analysis being performed in real-time. The second window shows the average
distortionspectrumcalculatedsofar.Thiswillimproveastheimagerowsareanalysedandthe
spectrum built up. An example is shown below where the dominant distortions are visible
aroundthe2kHzrangetypicalofmanysampleholderresonantfrequencies.
26
JitterbugPlug-inUserManual
Theunitsonthedistortionspectrumarerelativeandarenotintendedtoindicateanabsolute
measurement.Thefrequencyscalewillbeaccuratelycalibratedifthepixeldwell-timehasbeen
correctly specified in the settings dialogue (see below). This can often be found in the image
‘tags’(rightclickonimage,select“ImageDisplay”).
27
JitterbugPlug-inUserManual
ProcessingTime-seriesData
Processingoftime-series(multi-frame)dataisnowsupportedinJitterbugversion2.0.Thereare
someextraoptionsandsettingsforthisandtheyaredescribedinthissection.
Firsttherawdatamustberealignedbeforeprocessingtoremoveoffsetsfromstagedrift.,
Ifthefrontimageisatimeseries,theaveragethroughthestackisautomaticallycreatesand
usedtogiveprecisepeak-positionsduringpeak-finding.
Whencorrectingverticalorhorizontalscan-noise,thisisdonewithineachsliceofthedata,using
themeanofthedataasthereference.Bydefaulttheaverageimagewillbeshownafterscannoise correction. The corrected individual frames can be shown by selecting “Show corrected
stackedimage”inthe‘CorrectScan-noiseoptions:
Thetimeneededforthisscaleslinearlywiththenumberofimagesandmaytakeseveral
minutes.Tomonitortheprogressanadditionalwindowwilldisplaywhenprocessingmultiframedata:
28
JitterbugPlug-inUserManual
AdvancedOptions(theSettingsMenu)
SeveralofthefeaturesabovecanbetailoredbyadjustingtheoptionsintheJitterbugsettings
menu:Jitterbug>Settings.Optionsaresavedwhenthemenuisclosed.
Fast-scanLineSmoothnessParameter
New in Jitterbug version 2.0, the user has more choice over the smoothing used on the
measured scan-noise offsets. Weak smoothing will only remove the most extreme outlier
measurements, while stringer smoothing reduces these further and should be used for the
lowest SNR raw data. The user can also enter a custom number; in most cases the ‘Normal’
smoothingstrengthissufficient.
ImageQuantificationOptions
Here options relating the image quantification can be set includingthe number of repeat lineprofilesperdirection,aswellasthetotalnumberoffeaturestouseinresolutionanalysis.The
pixel-dwelltimeshouldbeinputheretocalibrateanydistortionspectrumanalysisaswellasthe
numberofscan-noisecorrectioniterationstomakebeforeoutputtingthefrequencyspectrum.
BrightFieldOption
Herebright-fieldmodecanbeselectedand‘peaks’willbedefinedasdarkfeaturesratherthan
bright.
29
Jitterbug Manual
Quick Reference Guide
The Main Menu
Jitterbug is controlled from a single
main menu within DigitalMicrograph.
The commands in the Jitterbug menu are described below.
Command
Identify Peaks
(see sub menus)
Description
Identifies image intensity peaks (atomic columns)
automatically, and then allows Remove/Add peaks
manually using the HREM mouse.
Set Base Vectors
It allows defining manually the base vectors on an
image.
Compensate Scan Noise…
Runs horizontal/vertical scan noise restoration
Quantify Image Properties…
Image properties (resolution, SNR and SBR) will be
evaluated.
Image Distortion Correction…
Runs Drift Restoration using the Base vector
information
Diagnose Instability Frequencies
Shows noise frequency profile.
Settings…
Some parameters will be altered here.
-30-
Jitterbug Manual
Identify Peaks SubMenu
Component
Find Peaks…
Remove Peaks
Add Peaks
Description
Identifies image intensity peaks (atomic columns)
automatically
Removes peaks manually selected by using the
HREM mouse. (Launch this command after placing
the mouse selections.)
Adds peaks manually selected by using the HREM
mouse. (Launch this command after placing the
mouse selections.)
Identify Peaks Dialog
The components of the dialog are described below.
Dialog
Component
Peak size
Description
There are two options: a fixed peak size or a range of
values is tested. If there is a Rectangular ROI, its size
will be shown in the box as a fixed peak size.
-31-
Jitterbug Manual
Compensate Scan Noise Dialog
Control Tab
For a normal 2D image
For a Time Series (3D image)
Component
Description
Horizontal (fast-scan direction) compensation
If checked, restoration along horizontal direction will
be done.
Number of iterations
Specifies a number of iterations of horizontal
restoration.
Peak regions only
Switches between whole pixels (area) or the pixels
within each peak area.
-32-
Jitterbug Manual
Vertical (slow-scan direction) compensation
If checked, restoration along vertical direction will be
done.
Time Series: Show corrected stacked image
If checked, a corrected individual frames will be
shown as a stacked image, as well as the averaged
image after scan noise correction.
Display Tab
Component
Horizontal shift
2D
Description
If checked, a 2D map of horizontal shift at each pixel
will be displayed in a separate window.
Histogram
If checked, a histogram of horizontal shifts will be
displayed in a separate window.
Vertical shift (Before Horizontal)
2D
If checked, a 2D map of vertical shift (before
horizontal compensation) at each pixel will be
displayed in a separate window.
Histogram
If checked, a histogram of vertical shifts (before
horizontal compensation) will be displayed in a
separate window.
Vertical shift (After Horizontal)
2D
If checked, a 2D map of vertical shift (after horizontal
compensation) at each pixel will be displayed in a
separate window.
Histogram
If checked, a histogram of vertical shifts (after
horizontal compensation) will be displayed in a
separate window.
-33-
Jitterbug Manual
Quantify Image Properties Dialog
Dialog
Component
Resolution
Analyze
SNR/SBR
Description
If checked, resolution (peak size) will be estimated for
various directions.
Averaged Peak: Averaged peak profile is analyzed.
Peaks Simultaneously: Each peak is simultaneously
analyzed for each direction.
Peaks Separately: Each peak is analyzed separately
for each direction.
If checked, SNR (signal-to-noise ratio) and SBR
(signal-to-background ratio) will be estimated.
Image Distortion Correction Dialog
Dialog
Component
Vector 1
Length
Description
Length of the vector 1. Measured value (current
value) is shown in the parenthesis. You can specify
the Target value.
Angle
Angle of the vector 1. Measured value (current value)
is shown in the parenthesis. You can specify the
Target value.
Vector 2: same as Vector 1
-34-
Jitterbug Manual
Perform Correction
Crop Image
If checked, information necessary to correct distortion
is estimated, and an image corrected for distortion will
be created.
If not checked, estimated distortion information is out
put in the Results window.
If checked, a rectangular part is extracted from the
distortion corrected image.
Settings Dialog
Dialog
Component
Description
Fast-scan Line Smoothness Parameter
This parameter will control the smoothness of an
estimate of the horizontal (fast-scan) noise offsets. In
most cases the ‘Normal’ smoothing strength is
sufficient, while the user can enter a custom number.
Image Quantification
SNR and SBR:
Number of Survey Line Profiles per Direction:
Number of line profile with the high peak density to be
analyzed.
Four (4) directions (two base-vectors, and their sum
and difference directions) will be surveyed.
Resolution:
Number of Survey Features (Peaks)
Number of peaks used to estimate resolution (peak
width)
Diagnose Instability Frequencies
Pixel dwell time
The pixel dwell time will be used to calculate the
-35-
Jitterbug Manual
Number of iterations
Bright field
highest frequency.
Instability frequencies will be estimated after the
specified cycles of horizontal restoration.
If checked, a bright field image can be analyzed.
-36-