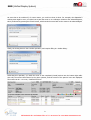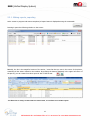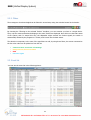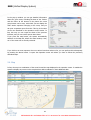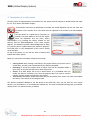
1
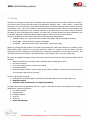
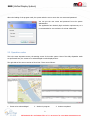
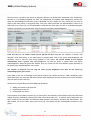
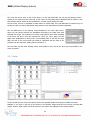
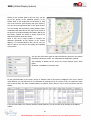
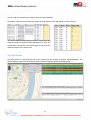
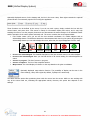
EMR (Unified Display System)
EMR Monitoring System
Project documentation
Introduction
The EMR (Unified Display System) is based upon the VISION X9 framework, which is a universal, vector
graphic, variable-oriented display system (SCADA), where the tasks communicate with each other via variables.
VISION is an extremely well-equipped, freely programmable display system, which is able to create Web
applications, perform any kind of complicated database operations, serving cloud database, display maps, 3D
maps, draw and display 3D figures and many more. The display itself is outstandingly quick.
The system can be programmed in its own, its programming language is XSDL (Extensible Structure Declaration
Language), which provides all the services of the high-level, object-oriented programming languages (multidimensional array, nested structures, types, sets, objects, processes, functions, properties, methods,
inheritances, etc.).
The EMR program also contains the development system itself, that is, all the graphic editor and translator
programs that the application itself was made – of course, it is only for users having the appropriate
authorization. There is no need for external programming tools or other programs to modify the system, to
redraw the pictures, to initiate new pictures and functions, or to scale the system.
The EMR application was also created in this scripting language. The system is open, all the source files are
available in the client itself. The source language consists of text files with totally unified syntax both with
respect to the programs, the images and the system configuration.
One of the world’s fastest cloud database management systems is built into the program, whose performance is
at least a hundred times better than the traditional SQL database management systems. This fact can be seen
at several places in the application itself.
The number of clients in the system is not limited, it is only restricted by the server capacity.
1
EMR (Unified Display System)
Contents
Introduction ....................................................................................................................................................... 1
1. Tracking ......................................................................................................................................................... 3
2. How to use the program ............................................................................................................................. 4
2.1. How to start the program ........................................................................................................................ 4
2.2. Operation center ....................................................................................................................................... 5
2.2.1. Making reports, exporting .................................................................................................................. 13
2.2.2. Filters..................................................................................................................................................... 14
2.3. Event list .................................................................................................................................................. 14
2.3.1. Filters..................................................................................................................................................... 15
2.4. Map ........................................................................................................................................................... 18
2.5. Tracker ..................................................................................................................................................... 19
2.6. Main Screen ............................................................................................................................................. 21
3. Settings ........................................................................................................................................................ 23
3.1. Tracker ..................................................................................................................................................... 24
3.2. Clients ....................................................................................................................................................... 25
3.3. Master data .............................................................................................................................................. 25
3.4. Users ......................................................................................................................................................... 26
3.5. User groups ............................................................................................................................................. 27
3.6. Other parameters ................................................................................................................................... 28
4. Description of a real process ................................................................................................................... 29
5. Configuration requirements ..................................................................................................................... 30
Appendix .......................................................................................................................................................... 31
2
EMR (Unified Display System)
1. Tracking
At present, the program is based upon the WMP300 type emergency device, hereinafter referred to as Tracker.
The device is able to keep connection with the geostationary satellites, which – among others – provide GPS
positioning, on the other hand, by using GPRS communication, it transmits information about itself to the server
or dispatcher center. This is how tracking is performed during emergency calls. With the current settings, the
device sends the coordinates at only 10 minute intervals, so no exact route can be drawn, instead, the device
can rather be used for positioning the incident. Of course, the 10-minute interval coordinate transmission can
be modified, although it significantly affects battery usage as well as the costs of communication.
Currently, the EMR server can communicate with the following three map providers:
• TopMap Hungary only - (street and house number level display, with closest address function)
• Google Maps - (street and house number level display)
• CloudMade - (street and house number level display - Open Source Map)
Apart from sending the GPS positions, the Tracker also provides two further basic functions. It contains a panic
button (SOS button), which has to be kept pressed for about 2-3 seconds so that the device send the
emergency call (the acceptance of the SOS button is shown by the vibration of the Tracker to its user). The
other basic function is the internal 3-axis accelerometer, which signals if the user of the Tracker falls.
Of course, the WMP300 emergency device has many more functions than the above-mentioned SOS and fall
detection.
• When the SOS button is pressed, a call is initiated towards the dispatcher center
• Geo-Fence functions
• Up to 20 pre-defined phone numbers to be called
• Detecting immobility
• Patrol surveillance function (when arriving at the location, pushing a certain button sends the patrol’s
current position and the time of arrival)
To sum up all the basic functions:
1. Sending GPS coordinates together with further information (battery status, charge status, etc.)
2. SOS panic button
3. Internal 3-axis accelerometer for detecting accidents
In reality, more events are generated than this – partly on the basis of logics, and according to the operation
requirements. These are as follows:
4. Low battery voltage
5. Charging starts
6. Charging complete
7. Power on
8. Power off
9. Power off sabotage
3
EMR (Unified Display System)
The latter signal is generated when the device is switched off without previously connecting it to the charger.
This precaution helps prevent the device from getting into offline status. Since the switched off device is unable
to send information about itself, it is not allowed to be switched off unless it was previously placed onto the
charger.
The system also alerts if:
10. There is no GPS connection
11. GPS connection is restored
12. Communication stop
In theory, the Tracker cannot get into a state when GPRS communication ceases to exist without any
antecedents. This may only happen under extreme conditions (e.g.: the battery is removed, or the device is
damaged), therefore the cessation of communication means serious incidents. However, GPS communication
may stop if the user stays for about 30 minutes in enclosed space.
Above we highlighted the events in bold that generate events to be acknowledged. These have to be managed
by the dispatcher in the operation center.
2. How to use the program
2.1. How to start the program
The EMR has its independent client program that has to be installed in advance on client PCs running Microsoft
Windows operating system.
After installation, the program can be started from the program list or with the icon displayed on the screen.
The loading process is entirely automatic, the program loads in approximately 3 seconds (there is no need to
choose anything from the EMR start menu):
The potential download of the
program modifications, that is, the
program update is also performed
in this phase. This is shown by a
green progress bar in the picture.
4
EMR (Unified Display System)
When the loading of the program ends, the system asks the user to enter the user name and password:
You can get the user name and password from the system
administrator.
The application has relatively high resolution requirements, so it
is recommended to use resolution of at least 1680x1050.
2.2. Operation center
This is the most important screen, the starting screen of the entire system. Most of the daily dispatcher tasks
are performed here, the events to be acknowledged are also displayed here.
The right side of the screen consists of three lists. These are as follows:
1. Events to be acknowledged
2. Actions in progress
5
3. Actions completed
EMR (Unified Display System)
The color codes are important, because the colors are connected to the priority level of the events.
The color of the foreground and background change according to whether the event has been
acknowledged.
For example, the color of the SOS event is red (this is the highest priority event). Up until the event is
acknowledged, the background stays red, and the text on it is white. After acknowledgement, it is displayed the
other way round: red text against white background. Thus the events can be identified easily and quickly both
with regard to their priority level and acknowledgement.
The table below explains the matching of the color codes and priorities:
Event to be acknowledged Priority Color
Explanation
SOS
4
red
Panic button was pressed on the Tracker
Fall detected
3
blue
Acceleration detection in the Tracker
Time for action ran out
1
yellow If within a configured period not start the action
Power off sabotage
2
green
The device was switched off without previously placing it
onto the charger
Communication stopped
2
green
There has been no connection with the device
for more than 20 minutes
Low battery voltage
2
green Status before flat battery, the Tracker sends it
This is the whole list of events to be acknowledged, although the dispatcher does not necessarily sees all of
them, because it can be set by dispatcher groups which events to display as a default (primary events serving
group). However, even in this case, events assigned to other groups may also be displayed if the event
escalated (has not been served, action was not taken in time), and the management target group of the
escalated event was connected to the given dispatcher group (as secondary events serving group). We will get
back to the description of this process later, now please, go on reviewing the elements of the image in terms of
the workflow.
The workflow consists of acknowledgment of the event (1), taking actions (2), and closing down (3).
This is how the event “travels” from top to bottom: from the list of unacknowledged events to the middle, the
actions in progress, then to the bottom list of completed actions.
If you do not select anything (and this is the
basic status of the screen when you switch to it),
the following legend is displayed:
Therefore, first you have to select the event by simply clicking on the row of the event. The data related to the
event are displayed in the middle-left section of the screen. Here you can see all the other related information
as well (client address, round number, contact(s), the data of the Tracker, etc.):
6
EMR (Unified Display System)
At the bottom of this image section, a table can be seen, whose function is related to the group
acknowledgment. Acknowledgment of the events can be set in two ways: individually or in groups. Real-life
experience shows that in terms of system management the latter is more practical.
In case of group acknowledgment, the system collects the unacknowledged events coming from a certain
Tracker on the basis of time – this is shown in the table. The time range itself can also be set here under the
checkbox allowing group acknowledgment (-20 minutes + 5 minutes). The essence of this is that during an
incident several events are expected to come from the given Tracker in a relatively short time. The sequence of
events might be initiated by a “Fall detected” event, which is followed by several SOS button presses and a
“Switch off tamper”. These are basically the same incident, the events are interconnected. This is why we
perform group acknowledgment, lest we have to perform later several separate tasks that are in fact related to
the very same problem.
Acknowledgment is performed by pressing the Acknowledge button:
During acknowledgment, you have to provide two pieces of
information: the type of action (1) and a comment (2),
where any text can be entered up to 250 characters. The
latter is optional, but the type of action is a compulsory
field. Finally, you have to press the Acknowledge button.
7
EMR (Unified Display System)
Thus, the event is moved to the actions in progress, and as it has already been mentioned in the introduction,
this time it is not displayed against red, blue, etc. background, but against white background, because the
event was acknowledged. Each event group is identified only by a single row here, namely the row that we
chose as the main priority, or triggering event. This is the same event that you acknowledged. If there is an
SOS event in the event row, it is recommended to select that one. And when you click on it (already among the
activities in progress), you get the same event list that you saw before acknowledgment:
From this time on, all further events will be placed into this very list. For example, if another “Fall
detected” event takes place, or the SOS button is pressed again. This is why group acknowledgment was
necessary, since in fact the same thing happens in both cases: the events related to the incident
automatically form a group. After acknowledgment, up until the action is closed down, and before
acknowledgment, within the given time interval. Thus, the events will not form different groups according to
the speed of the acknowledgment of the event!
The actions in progress list can only be seen by the dispatcher who took on the action by
acknowledging the given event!
In the table, in the row of the trigger event and the column of the action the Action… label is displayed, which
shows here and in the event list, and informs all the other dispatchers that the servicing of the event has begun
(they can also see the event list).
The action in progress allows for three additional operations:
1. Adding new action to the event list
2. Unlocking the event list
3. Closing down the action
In the majority of the cases one action (e.g. a phone call) is not sufficient, several actions have to be performed
(calling the police, ambulance, informing the client, other phone calls, etc.). To perform these, simply enter the
action carried out into the Action and Comment fields (shown in the picture), and press the Action button. This
adds another row to the event group (and event log). The actions are also automatically connected to the
group.
8
EMR (Unified Display System)
An event has to be unlocked if, for some reason, you could not close it down. For example, the dispatcher’s
working time might be over, so he/she has to pass the event on to a colleague. Similar to the acknowledgment,
this is performed by pressing the Unlock button, which sends the event back to the events to be acknowledged:
Finally, the closing down is also a similar operation, and requires filling in a similar dialog:
Performing this operation, you send the event to the completed (closed) actions into the bottom-right table.
Here only the events closed down by the given operator, and the events of the past 24 hours are displayed.
The events can be – so to say – Deleted from here.
9
EMR (Unified Display System)
In fact, the Delete does not delete the event, only removes it from the list of the completed actions (which
takes place automatically after 24 hours anyway).
Even among the completed actions, the program maintains the possibility of collecting and querying the event
group. Just like you could see in the case of the actions in progress, when the operator clicks on the row of the
event, all the events and closed actions related to the event group are displayed in the table.
The list of completed actions is very important. It might happen (and this will probably be the case in the
majority of the events) that a certain incident is not fully closed down by the completion. The dispatchers might
be approached by the police or the ambulance service for further information. These reactions are facilitated by
the possibility that the dispatchers can see all the actions closed down by themselves in the past 24 hours, and
the details of these actions can be queried with a single movement, and they can create and forward a report in
Excel format.
The information and table selected for the unacknowledged, the in-progress and the completed event rows
have different functions, although their structure is very similar. These data are displayed against different
background colors (pay attention to these!) lest the dispatchers get deceived by them by chance; it should be
obvious for them whether they are handling a closed event list (grey), actions in progress (blue), or
unacknowledged actions (yellow). Of course, these are also written in the header.
The control over the unlocked events can be taken over by the next shift or dispatcher by (re)acknowledgment.
In this case, it is not the time interval that counts, but the inside event ID used for collecting the group. It
means that all the previous events are automatically taken over irrespective of their full duration. The selection
of the unlocked events contains a slight, but important difference as well:
As you can see, the name of the operator who actually unlocked the event is displayed. This (also) shows which
are the primary and which are the unlocked events.
10
EMR (Unified Display System)
In case of the unacknowledged events, the priority and type of the event is shown by icons:
Fall
detected
SOS
Power off
sabotage,
Low battery
Delayed
action,
Event
escalated
The bottom/middle-left section of the operation center displays the event on the map:
On the left hand side you can see the list of antecedents or GPS coordinates, depending on which tap you click
on, in the period before the given event, whose length can be modified in the picture (time before the event:
15 minutes).
The structure of the two tables differs (since one shows the coordinates, the other the events in relation to the
given Tracker), although their handling is identical:
11
EMR (Unified Display System)
When clicking on the rows, the program displays the position of the event / coordinates on the map, and draws
the route as well. The reference point of the GPS coordinates is signaled by a marker (blue pinpoint), the
middle points by red circle. You can click on each for further information.
However, even more detailed information can be queried from the map provider:
The information and the new position do not immediately appear in the picture when you click on the
event or one of the middle points / coordinates, only about 2 seconds later, so the marker and the route
is shown with a slight delay. This is because some time is needed for querying and displaying data from the
map server. When you click serially, due to this delay, the queries are not slowed down by the update of the
map itself, since it only starts to move after you finished or suspended the selection. Therefore, the more
important list query is fast, the map query, which is slow anyway, uses the residual time.
If the coordinate is zero, the map positions to the next detail (in such cases, there is no marker and route):
The same happens when you click on an event for
acknowledgment or later for tracking the action process that
does not have a GPS coordinate. Such events are, for example,
the Delayed action or the Switch off tamper.
The map can be moved by pressing and holding down the left
mouse button, zoom-in/zoom-out can be performed by the
mouse scroll wheel or +/- buttons. The marker and the inner
reference points automatically position in the center of the map.
12
EMR (Unified Display System)
2.2.1. Making reports, exporting
At the events in progress and events completed, a Report button is displayed among the commands:
Pressing it opens the following window on the screen:
Basically, the list is the magnified version of the action / event list that you saw in the center of the picture,
containing all the actions related to the incident. By pressing the buttons displayed in the upper left corner of
the picture, you can create from this a report in XLS or PDF format:
The Excel file is always created with the same name, so use Save as to make copies!
13
EMR (Unified Display System)
2.2.2. Filters
The messages to be acknowledged can be filtered in several ways using the switches located in the header:
By choosing the “Filtering to the selected Tracker” checkbox, you can constrict your lists to a single device.
Thus, only the events and actions belonging to the same Tracker are displayed. Since this is not the basic status
of the system, and if it stayed this way, the dispatcher might overlook the further signals, the switch is
automatically deleted by the program in 1 minute, and is reset into the basic status.
The selection is temporary in the case of the type filters as well; by using these filters, the events connected to
the four color codes can be picked out from the list:
•
•
•
•
Communication and Power off sabotage
Delayed action, Event escalated
SOS
Fell over signal
2.3. Event list
You can see the event list in the following picture:
14
EMR (Unified Display System)
The rows of the event list are colored in the same way as in the operation center, however, here you can see all
events, not only the ones to be acknowledged. More exactly, every event that we defined by the filtering
criteria. In detail, the following information is displayed:
Time of the event
Tracker ID
Event
Additional data
Action
Comment
Event ID
Site ID
Client address
Phone number 1
Round
IMEI
Operator
Priority
Action
Date and time
5-digit unique identification
Text of the event
GPS coordinates or other information related to the given event
Type of action (can be selected from a list)
Textual field added to the action
The internal identification of the events, which is used – among others –
when creating event groups (the events belonging to the same group have
identical code)
Short identification of the client
Detailed address
Phone number of the primary contact person
Round number, to which the Tracker was assigned
The unique identification of the Tracker
Name of the operator who generated or managed (e.g. acknowledged) the event
The events are grouped into priority groups ranging from 0 to 8
Its status is “Yes” at events that have/had to be acknowledged
2.3.1. Filters
Because of the huge amount of data, you can use different filtering functions. The browsed time range can be
designated by the time filter.
You can select views of shift, daily (default), weekly, monthly,
quarterly, yearly or any time range.
15
EMR (Unified Display System)
On the right side of the picture, you can also find the event filter, which offers the following options:
•
•
•
•
•
•
•
Event (type)
o SOS
o SOS event acknowledged
o SOS event closed
o SOS event unlocked
o Fall detected
o Fall event acknowledged
o Fall event closed
o Fall event unlocked
o Switched off
o Switched on
o Low battery
o Charging finished
o GPS reception stopped
o GPS reception restored
o Switch off tamper
o Time for action ran out
o Communication stopped
IMEI number: Filtering to IMEI number works with word fractions as well, which means that after the
asterisk (*) we type any number of the last IMEI digits. E.g.: In the case of *561 the program offers all
the Trackers ending in 561 (probably only one)
Tracker ID
Site ID
Route nr
Action required
o Yes
o No
Operator: here the names of the operators added to the system can be cited.
The easiest way to delete the different filtering criteria is to use the specific buttons.
By pressing the given button, all the set criteria are zeroed (reset to *).
A filtering criterion is deleted if we write * or empty string into the filtering criterion.
The different sorting possibilities are of great importance. You can choose between either of two methods:
• Arrangement in time
• Arrangement according to event group
The first one is the natural view of the event log. In the second case we use the internal event ID of the
system, and we arrange the events in time within that. With this latter arrangement, you can automatically
assign the actions and the related events to one another.
16
EMR (Unified Display System)
In the operation center section we have already elaborated on the creation of event groups. You could see that
the events belonging to the given incident automatically form a group so that you can retrieve all the events
and actions of the incident from the data base with a single movement. This is done by providing the event
series belonging together with an identical event ID. Thus, when we filter to the event ID, the events are still
arranged in quasi chronological order, because the event ID is an ever increasing counter. However, the action
group is displayed together.
Just like in the operation center, there is a possibility to export in the event list as well. You can choose
between Excel (XLS) or PDF formats. Unfortunately, neither of these is particularly fast – the Excel export is
especially slow, but this is caused by the Microsoft Office itself. The program uses OLE (Object Linking and
Embedding) function to fill in the table, writing each and every cell individually.
In the picture below, you the result and time data of an export of 5.600 records can be seen in seconds. These
two numbers mean that on the server side the data was created in 3 seconds, but on the client side almost 1
minute were required to write these data into Excel. This is the amount of time the Microsoft OLE server:
In the following figure you can see that events arranged in time are registered among the group events:
Here the 4491 ID belongs to the event group, the
4488, the 4493 and the 4485 identify other
events or event groups. These two or three
sequences are mixed in time.
If we arranged this list according to event
groups, the two sequences would completely
separate from one another – thus the action
sequences can be easily and conveniently read
from the event list.
Another way to identify the action sequence is
the information window, which can be displayed
by double-clicking on the image:
17
EMR (Unified Display System)
In the pop-up window you can get detailed information
about the given event, including the data of the Tracker
and the Client. At the bottom of the picture the event
group button can be seen, with which you can display the
entire action sequence belonging to the event, and you
can print a separate report from this. This log is the same
as the one described in the operation center section. In
fact, this way you can regain the data of the previous
incidents, and you can create reports about these.
If you press the map button, the system automatically
switches to the Map tab, where the exact location, route,
etc. of the event can be visually reviewed.
If you click on an event sequence where no actions have been taken so far, you can perform this subsequently
by pressing the Action button. It opens the Operation center tab where you have to follow the previously
described steps.
2.4. Map
In fact, the map is a combination of the event list and the map displayed in the operation center. It enables the
system to display any events on the map that have GPS coordinates in their additional data.
18
EMR (Unified Display System)
The event list can be seen on top of the picture; on the right hand side you can see the filtering criteria –
exactly as you could see at the event log. In the center the usual map field is displayed with the marker, route
and reference points, which can be requested for a certain minute before the event.
On this screen, there is no possibility to take actions or modify data. The usual data base is located on top of
the picture. Each row has its appropriate map position, Event antecedents and GPS coordinates.
The only difference is in the filtering criteria displayed in the lower right corner,
where you can choose between the possibilities according to the Map event time
and Map time range. This enables you to search map positions and routes according
to the event, but also in any time intervals set up by you. Here, again, you can
apply some simplification so that you do not necessarily have to toil with two time
data: the end of the time interval can easily be calculated with the help of the
program from the start time, adding the Plus minute to it.
The time filter and the other filtering criteria work parallel to this, and in the same way as described in the
event log section.
2.5. Tracker
The Tracker tab provides the operator with detailed information on the tracking devices.
On the left side the tree view of the device can be seen logically divided according to the different clients.
Naturally, if you click on the top of the structure, the symbolic images and the most recently received data
(status, number, IMEI number) of all the devices in the system are displayed in the central window.
19
EMR (Unified Display System)
Clicking on the relevant parts of the tree view, you can
get to the groups of the individual devices, or the
Tracker itself. If you double-click on the device or each
row of the event list (thus opening the given Tracker),
you get the most important data of the given device.
You can visually view its location, status, battery status,
coordinates and client data on the map. In the center of
the picture, the program displays the battery status, the
last status, whether the device is online, and all the
related information about the clients.
Since in this view a large number of Trackers are
displayed (practically all the devices in the country
appear), it is recommended to filter the list, lest you
have to wait for too long for the loading and updating
of the picture.
You can also select other types of maps and filter the devices in the system
according to different criteria. The map selection displayed is optional.
The possibility of display can be seen in the menu Settings, Users, Extra
rights.
By default, CloudMade is the active map.
On the right hand side of the screen, the list of trackers used in the system is displayed. This view is mainly
useful because you can acquire a lot of information by arranging it by its columns. First, you shade the active
rows of the list blue. The other Trackers (black) are inactive, that is they are not in online connection with the
system.
If you are interested in the Trackers with the lowest batteries, you can sort the list by clicking on the Battery
column:
20
EMR (Unified Display System)
You can read in a moment which Trackers have the lowest batteries.
The battery usage column provides information on which batteries work with higher or lower efficiency:
The value of battery usage is given in %/hour, which shows how
many percentages a Tracker’s battery decreases in an hour. The
normal value is around 5%. This method gives us the list of the
weakest Trackers with a single touch.
2.6. Main Screen
The Main Screen is a special quick-view of the system with the purpose of training and presentation. This
window displays clearly how the different actions performed with the Tracker generate events.
21
EMR (Unified Display System)
Optionally displayed screen. On the Settings tab, the list in the menu Users, Extra rights contains the optional
points that are not necessarily required for running the application.
These functions van be defined by the users; if you do not need a point, simply uncheck the box with the
mouse button, and press Save. This screen is mainly for information display and review, and it may help
teaching the users to use the program, because it can demonstrate the status changes of an individual Tracker
and the operation of the entire system extremely well. The screen contains the most important data:
• Last Tracker status. Here you can see the last received coordinates of a GPRS endpoint and an
Acknowledge button. The different statuses are demonstrated with icons by the system. By pressing the
Acknowledge button you can acknowledge the event; after that, the signal disappears from the map.
Fell over
•
•
•
•
•
SOS
Charged
Charging
Low
Power off
Power on
Event to be acknowledged: The detailed description of the last received event to be acknowledged.
Events to be acknowledged: Here you can find the list of all events waiting for acknowledgement or
action.
Actions in progress: The list of actions in progress.
Actions completed: The list of the completed actions.
Map window: The visual display of a device on the map based on the given coordinates.
Optionally displayed map selection function. The possibility of display can be seen in the
menu Settings, Users, Extra rights. By default, TopMap is the active map.
The tables become active after positioning them with the mouse into the screen. While we are working with
one, all the others fade out, indicating the appropriate activity. However, this option also depends on the
settings:
22
EMR (Unified Display System)
The arrow rotating in the header, within the operation
center icon shows that there is a signal waiting for
action. This is displayed in all pictures, because it is an
important piece of information.
3. Settings
On the Settings tab, you can set up the Devices, Clients, Rounds, Master data, Users and Other parameters
belonging to the system.
23
EMR (Unified Display System)
3.1. Tracker
Uploading, reviewing and correcting databases for users authorized for this purpose.
The process is as follows:
The screen becomes empty, and you can start filling in the empty rows.
The Add button adds the new Tracker entered by you to the database.
If you would rather not have a new Tracker.
Saving the selected and modified Tracker data.
Deleting the selected Tracker data.
On this tab, the Tracker parameters may be set up as well. For example, you can set up fall sensitivity, and you
can disable or enable this function.
The command can be sent out in three ways:
1. To the selected Tracker
2. To all the Trackers belonging to a given client
3. To all the Trackers
You can see these options on the buttons.
Please be advised, however, that sending does not happen immediately, it is only realized when the given
Tracker logs in. This is the moment it receives the command. We would also like to draw your attention to the
fact that only 1 command can be operative at a time. This restriction means that you have to wait until the end
of the cycle time before giving a new command, otherwise not all Trackers will receive the command.
24
EMR (Unified Display System)
3.2. Clients
Uploading, reviewing and correcting databases for users authorized for this purpose. In case of taking up a new
client, you have to follow the previous steps.
3.3. Master data
25
EMR (Unified Display System)
The master data define the action types during acknowledgement, closing down and unlocking (handover).
3.4. Users
Uploading, reviewing and correcting user databases for users authorized for this purpose. In case of taking up a
new client, you have to follow the previous steps.
It is also here that you have to set up the Extra rights belonging to a given user.
Users can have the following authorizations:
Administrator: All editing and data modification operations are permitted
Operator:
Normal dispatcher authorization (acknowledgement, taking actions)
Operator2:
Normal dispatcher authorization (acknowledgement, taking actions), but the Settings tab is
invisible
Viewer:
Prohibited:
The user can only watch the program, without modifying or acknowledging anything
The prohibited user temporarily does not have access to the
26
EMR (Unified Display System)
3.5. User groups
The users are arranged into groups within the system. The group
determines what events the users belonging to a certain group can see. This
is carried out by the SOS, Fall detected, Action time is over, etc. rows in the
configuration:
The group, however, plays another role as well. The groups can be
interlaced in order to hand over the unserviced events to other user groups.
For example, if the SOS event has not been serviced (in any group where
this event is permitted), you hand over the event – after the escalation time
– to another group. This is determined by the Delegated group drop-down
menu. Two pieces of information are required to set up this function: the escalation time and the delegated
group. If the escalation time is zero, the handover is not carried out, so it can be disabled by zeroing this field.
Getting the groups circulated is an important and useful setting.
For example, you can add the group ‘Operator1’ to the group ‘MainOperator’, and vice versa. Thus we can
ensure that the unserviced event is circulating between these two event groups, and produces audio alerts and
events all over again. Attention should be paid, however, to the fact that this cannot be too short. With a value
of 1 minute, unmanageably many events can be generated even within half an hour!
27
EMR (Unified Display System)
3.6. Other parameters
The other parameters allows for the setup of the timings, the modes of display and the sounds of the system.
Sound alerts are produced when a new event to be acknowledged takes place. The event is also shown by a
jumping clock in the header, and if you click on it, both the sound alert and the picture disappear. However, the
sound alert is continuously repeated by the system. You can also set up the repetition frequency on this screen.
If you leave the Audio file field blank, no sound alert is generated, you can only see the jumping icon.
The path of the map server.
Browsing audio files from the system.
28
EMR (Unified Display System)
4. Description of a real process
Currently, there are approximately 10.000 trackers in the system, and the majority is already active and ready
for use. They will be used within Hungary.
If somewhere in this area an SOS button is pressed, the central dispatcher can see the event and
its location on the monitor of PC. The alarm event is registered in the ‘Events to be acknowledged’
table.
The SOS button is a signal that is compulsory to
manage. The same applies to the ‘Fell over’ signal.
When the dispatcher sees the event, he/she
acknowledges it by pressing the button created for this
purpose, and the ‘Acknowledgement of the event’ window
appears. The dispatcher performs Acknowledgement by filling
it in properly, then it is placed among the ‘Actions in progress’.
From that point on, the management of this event is carried
out in this table.
On top of the picture you can see the series of buttons that
indicate the further options.
Below you can see the information related to their usage:
•
•
•
•
Closing down: After pressing it and filling in the popup window, the process can be
closed down, and the event is placed among the ‘Actions completed’.
Unlocking: It should be pressed when an action could not be completed within a
given shift, so the next shift will have to finish this process.
Action: In its basic status, this is not an active button. It is (re)enabled when you
modify the Action or Comment rows. Then the program asks if you wish to save the
changes, and the system overwrites the two entries.
Your events: Informative window that shows the time and status of the event. The other rows indicate
the history of the actions in chronological order.
The ‘Actions completed’ database is the last phase of the action link. Here you can view the ‘Your events’
window, you can analyze it, or even delete the selected row. The usual conformation dialog pops up, and after
clicking on the ‘Yes’ option the entry is deleted.
29
EMR (Unified Display System)
5. Configuration requirements
Considering that the system receives data from a large number of external devices (10.000+), and receives
them quite frequently (at least a hundred times a second), the server requirements are high:
Minimum server capacity requirements:
CPU capacity: 2.4 GHz (Xeon v. i7)
Number of cores: 4
Memory: 4 Gbyte
Operating system: MS-Windows Server (2008 R2, 2012)
SQL server: MS-SQL (Oracle, PostreSQL, MySQL)
The system is scalable to the server both on the front-end and the back-end. For input-side scaling, a load
balancer has to be installed before the system, although the system can perform client-side scaling on its own.
Any number back-end services can be connected to a single front-end service, so – in theory – a system of any
size can be created on EMR Cloud basis.
Minimum client-side capacity requirements:
CPU and capacity: 2 GHz i5, i7; 2.4 GHz i3; 2.66 GHz Dual Duo
Number of cores: 2
Memory: 2 Gbyte
Operating system: any type of MS-Windows, preferably Windows 7
Minimum resolution: 1680x1050
During communication with the server, the clients use only one layer: the Web. Only the IP address has to be
set up, and by using the Internet you can exploit all the functions in the usual way.
The map details, map information, online data, the tables of the server database and their queries (result sets)
come through the same web interface. In addition, the client performs the database operations via the very
same interface.
30
EMR (Unified Display System)
Appendix
The main features of the VISION X9 framework:
• Vector graphic, extremely fast graphic display, several design and vision graphics components
• Powerful SQL event management module (lists, events calendar, time and event filters,
• interactive searches, information window with camera image, exporting, Excel, PDF, HTML, etc.)
• Integrated event management: the events of the access control, monitoring and security systems are
displayed in common event lists (log, unacknowledged events, status list), archive camera image from
event lists
• Server-client services, hierarchical networks, Web
• Inbuilt user management (which can be handed down even from the access control system)
• Inbuilt, powerful scheduler to perform the time management of cyclic and individual tasks
• Pre-fabricated templates
• Arbitrary camera arrangements
• Live and archive video display by setting up the usual parameters individually or in groups (quality,
picture size, playing speed, proportional or pasted display, full image, etc.)
• Archive image query in optional time interval and resolution, archive map
• Popup video monitoring
• Multi-screen display
• Multi-language (English, German, Hungarian, Spanish, Russian)
• Several conveniences (frame, picture information, video menu)
• Video animation and visual graphics (spectacular picture switching techniques, object fading,
metamorphosis)
• Programmable in its own (XSDL) and external programming languages (Delphi, Visual Basic, C++, C#)
• Audit Trail (data tracking services), international standards (21 CFR, Part 11)
31