1
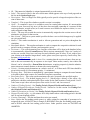
POWERWEB
User’s Manual
Version 2.7
September 12, 2001
© 1996-2001 Power Systems Engineering Research Center (PSERC)
School of Electrical Engineering, Cornell University, Ithaca, NY 14853
Acknowledgments
The initial concept of POWERWEB was an idea of Bob Thomas’ which took on reality with the help of
Ray Zimmerman and Eric Sakk in December 1995. Since then many have contributed to its development, most notably a loosely knit group of engineers and economists at Cornell, referred to as the
EMPIRE group, especially:
John Bernard
Simon Ede
Bob Ethier
Deqiang Gan
Tim Mount
Carlos Murillo-Sánchez
Dick Schuler
Bill Schulze
Bob Thomas
Ray Zimmerman
The P OWERW EB project is especially indebted to Bill Schulze and his Lab for Experimental Economics and Decision Research for financial support and an ideal environment for conducting
POWERWEB based experiments.
POWERW EB continues to evolve and develop with the help of many people. We have tried to acknowledge contributions on the About POWERW EB… page accessible from the POWERWEB home
page ( http://www.pserc.cornell.edu/powerweb/ ).
Ray Zimmerman has done virtually all of the implementation of POWERWEB and is the author of this
User’s Manual. His name appears on the bottom of each POWERWEB page as the contact person for
problems or feedback. Please report any errors or omissions in this manual to him at:
Ray Zimmerman
428-B Phillips Hall
Cornell University
Ithaca, NY 14853
(607) 255-9645 (phone)
(607) 255-8871 (FAX)
[email protected]
© 1996-2001 Power Systems Engineering Research Center (PSERC)
School of Electrical Engineering, Cornell University, Ithaca, NY 14853
2
Table of Contents
Acknowledgments ............................................................................................................................. 2
Table of Contents .............................................................................................................................. 3
1 Introduction to POWERWEB ......................................................................................................... 4
2 Getting Started ............................................................................................................................. 4
2.1
2.2
2.3
2.4
2.5
2.6
2.7
System Requirements .................................................................................................................. 5
Access and Registration............................................................................................................... 5
Creating a Session ....................................................................................................................... 7
Running the Auction.................................................................................................................... 8
Reviewing the Data ................................................................................................................... 10
Deleting the Session .................................................................................................................. 10
Logging out of POWERWEB........................................................................................................ 10
3 Using POWERWEB ....................................................................................................................... 11
3.1
3.2
3.3
3.4
3.5
3.6
Users and Groups ...................................................................................................................... 11
Sessions and Resources ............................................................................................................. 11
Markets ..................................................................................................................................... 16
Agents ....................................................................................................................................... 18
System Information ................................................................................................................... 19
Session Results .......................................................................................................................... 24
Appendix A: POWERWEB Architecture and Implementation ...................................................... 25
Appendix B: Sample Experiment Instructions ............................................................................. 27
Appendix C: POWERWEB Change History.................................................................................... 32
3
1 Introduction to POWERWEB
POWERW EB is an Internet-based simulation environment for experimentally testing various power
exchange auction markets using human decision makers. It is interactive, distributed and web-based
and is designed to host simulations of competitive electric energy markets in the context of a restructured electric power industry.
Since POWERWEB is based on the Internet, it is not necessary for participants to be in the same physical location in order to conduct an experiment. The web-based architecture, detailed in Appendix A,
enables a participant to access P OWERW EB from anywhere Internet access is available. The only
software necessary is a modern web browser, such as Netscape Navigator™, which runs on nearly all
computing platforms in common use today.
The POWERWEB environment is meant to be flexible so as to accommodate markets with a variety of
“rules of the game”. As is the case with most existing and proposed electric power markets,
POWERWEB assumes the presence of a central agent acting as an independent system operator (ISO)
to assure the reliable operation of the physical power system. The POWERW EB environment is designed to run unit commitment and optimal power flow routines against load forecasts in order to provide generation schedules such as those that might be assigned by a Power Exchange (PX).
In the current implementation of POWERW EB, the ISO/PX receives offers to sell power from independently owned generation facilities. Based on a forecasted load profile and the offers submitted by
the generators, the ISO computes the amount of power to be produced by each generator and the corresponding price, such that the demand is met while satisfying all of the system’s operational constraints. The method used to solicit offers and the mechanism which determines prices are dependent
on the market model being examined.
As a web-based tool, P OWERW EB may be used in several capacities. It can be utilized in a tightly
controlled setting where a well-defined group of subjects are used for a very specific set of market experiments. It can also be used in a more open environment in which anyone on the web can log in and
“play” as a generator competing against other generators, which may be controlled by other humans or
by computer algorithms (automatons). Given appropriate system and market scenarios, POWERWEB
could also be used for training purposes.
The design of POWERWEB includes the ability to handle markets with multiple time periods that are
interconnected through generator startup and shutdown costs, ramp rate limits, and minimum up and
down time constraints. This version implements startup and shutdown costs, but does not yet include
inter-temporal constraints such as ramp rates and minimum up and down times.
Please note that while POWERWEB is a flexible platform designed to host many different types of market simulations, not all of the design features are implemented in the current version. The scope of this
manual is limited to the features implemented and available to users in this version.
2 Getting Started
This section is intended to be a step-by-step tutorial which should help you get started using
POWERWEB as quickly as possible.
4
2.1 System Requirements
Since POWERWEB is a web-based application, you will need a computer with a web browser and access to the Internet. No additional installation of software is needed. The web browser required by version 2.1 of POWERWEB must correctly implement a web technology known as “server-push”, as well
as other modern browser technologies such as JavaScript, Java, frames, and cookies1. The only browsers which have been verified to work correctly are versions 3 and 4 of Netscape’s Navigator and
Communicator2. Please note that Microsoft Internet Explorer does not work with POWERWEB 2.1.3
2.2 Access and Registration
The POWERWEB home page, shown in Figure 1, can be found at:
http://www.pserc.cornell.edu/powerweb/
Figure 1 POWERWEB Home Page
1
Some of these features can be disabled in the browser’s preference setup. It is important that they be enabled for
POWERWEB to function.
2
Netscape 4.x is required for viewing system one-line diagrams since it requires Java™ 1.1, but all other features work
with Netscape 3.x.
3
MSIE does not correctly implement server push. Plans are to support MSIE in a future version of POWERWEB.
5
The first time you visit POWERWEB you will need to register for a username and password which you
will use to identify yourself each time you access POWERWEB4. Click on the Registration link in the
navigation bar on the left side of the home page and follow the link to register. This will take you to
the form shown in Figure 2. You may choose whatever you like for a username and password. When
you have registered successfully, please write down your username and password and keep them in a
safe place. You will need them each time you visit POWERWEB.
The information you enter is only to give us (PSERC) an idea of who is using POWERWEB. It will remain confidential with the following exception. Your name and e-mail address will be visible, on the
Session Info and other pages, to (1) those who are eligible to join a session you own, (2) the owner of
any session you join. See Section 3.2 for a description of sessions.
Figure 2 Registration Page
4
Due to major changes to the database, if you have registered for a version of POWERW EB prior to 2.0, you will need to
register again. This should not be necessary for future versions.
6
2.3 Creating a Session
After registering, select the Login link and enter your username and password. You will be presented
with a list of sessions as shown in Figure 3. At the top will be listed any existing sessions that you are
eligible to log in to5. The list at the bottom will contain templates from which you can create a new
session.
Figure 3 Session/Template Selection Page
Select one of the templates and hit the Continue button. The session creation page shown in Figure 4
will appear. Type in a label by which to identify this session and modify the description with any
notes that you might find helpful later. If all trading periods defined by the template are identical, you
will be able to specify the number of trading periods you would like for the session you are creating.
Ignore the remaining options for the moment and click on the Create Session from Template button.
5
This list may be empty if you have not created a session and no other user has granted you access to one of their sessions.
7
Figure 4 Session Creation Page
POWERWEB will create the session, assigning you to a random generator in the system and assigning
the remaining generators to be played by computer bidding agents. When POWERWEB has finished
computing the competitive solution for each period it will display a welcome message indicating
which generator you will be representing. Hit the Begin Auction link in the navigation bar on the left
to continue.
2.4 Running the Auction
The first table on the Offer Submission page, shown in Figure 5, shows the breakdown of the capacity of your generator in column two. The 60 MW capacity is partitioned into three blocks in the example shown in the figure. The third column lists the production costs in dollars per megawatt-hour for
each block of capacity. The fields in the fourth column are for you to enter your offer prices, the price
at which you are willing to sell energy from your generator. A separate offer price must be submitted
for each block of power. The only restriction is that the prices must be non-decreasing.
8
The second table displays the reservation price (offers above this price are discarded), total demand
and total generation capacity for the system. If applicable this table will also display startup and shutdown costs for the generator. The period number is shown in the upper right corner of the page (see
Trading Periods, Dispatch Periods and Iterations on page 11 for more details).
Figure 5 Offer Submission Page
When you have finished entering in your price offers hit the Submit Offer button. At this point
POWERW EB will take the offers you submitted, along with those submitted by the computer agents
representing the other generators, and use them to compute the amount of power to be produced by
each generator and the corresponding prices. This computation is performed according to the definition of the auction mechanism specified (by the session template chosen).
When the results of the auction are available, they are displayed in a table as shown in Figure 6. Columns 2 through 4 show the capacity, marginal cost and offer price for each block directly from the
Offer Submission page. The next two columns list, for each block, the amount sold and the selling
price. Revenue is computed in dollars as (amount sold) x (selling price) x (duration of dispatch period), operating cost is computed as (amount sold) x (marginal cost) x (duration of dispatch period),
and the final column, earnings, is the difference between revenue and operating costs. At the bottom
of the table is a row with totals. Any applicable startup or shutdown costs are subtracted from the
earnings to give the total earnings for your generator for the period.
9
Figure 6 Results Page
When you have finished reviewing the auction results, hit the Continue link on the left to proceed to
the next trading period. Each subsequent Offer Submission and Auction Results page also contains a
table with the history of the last several periods. When you have finished submitting offers and reviewing your results for all rounds, you can download a data file containing all of the data for the session.
2.5 Reviewing the Data
To download a tab-delimited text file containing all of the results from the session, you will need to
sign in as the session owner. Click on the Select… button next to the “Representing:” label at the top
of the screen. On the next screen, select Session Owner and hit the Continue button. This takes you
to the Admin Main Menu. Click on the Session Results link on the left then on the Download Session Data link. This will display the data file in your browser window. To save the file to your local
disk, select Save As… from the File menu and save it as a source or HTML file (as opposed to plain
text).
2.6 Deleting the Session
Once you have downloaded the data and have finished viewing all of the on-line results, you can delete the session from POWERWEB’s database by going to the Admin Main Menu page and selecting
Delete Session… on the left. You will be asked to confirm the deletion.
2.7 Logging out of POWERWEB
Click the Logout button by your name at the top of the page to log out. Quitting your web browser
will also automatically log you out.
10
3 Using POWERWEB
This section goes into more detail about the structure and concepts used by POWERWEB, and the features available to the user.
3.1 Users and Groups
POWERWEB is a web-based platform which can be accessed simultaneously by many different users.
In order to distinguish one user from another, a username and password are assigned to each through a
registration process. After logging in with your username and password, all subsequent accesses to
POWERWEB include information identifying the user. The POWERWEB design also includes the ability to define groups of users which may be granted specific privileges. Currently, this facility is used
to define a POWERWEB administrator’s group.
3.2 Sessions and Resources
POWERW EB uses the concept of sessions to accommodate and coordinate what could potentially be
the simulations of many simultaneous markets. A POWERW EB session contains information specifying the selection of the power system, the market mechanism, the mapping of participants to system
resources (e.g. generators), the number of trading periods, and other parameters.
The first step after logging in with your username and password is to select an existing session or create a new one. The next step is to specify the resource you will represent in the session. This version
of P OWERW EB defines only two types of resources: (1) generators, and (2) administrators. When
logged in representing a generator you will be able to submit offers to sell power and review the dispatch and price schedules determined by the market. When logged in as session owner, which is a session-specific administrator, you can view session parameters and status, power system data (e.g. oneline diagrams, load flow data), and session results.
The name of the current user, session and resource are always displayed at the top of each page, along
with three Select… buttons which allow you to log in as a different user, into a different session, or
representing a different resource, respectively.
In POWERW EB there are three different types of sessions: (1) templates, (2) normal sessions, and
(3) experiment sessions. Templates are sessions whose parameters are duplicated to create normal sessions.6 You cannot log in to a template. You can only use it to create another session. Normal sessions
are ones in which a market simulation is actually run. Experiment sessions are identical to normal sessions except they have a special login sequence that combines a shortened registration process with
automatic generator assignments. These special sessions are used for controlled experiment contexts
and can only be created by the POWERWEB administrators.
Trading Periods, Dispatch Periods and Iterations
Each session is structured into a sequence of trading periods. Each trading period consists of one or
more dispatch periods, during which the system demand and grid conditions are assumed to be con6
Templates are currently created manually. Future versions may include the capability for some users to create new templates or sessions from scratch.
11
stant. In a “day-ahead” market, for example, a trading period might consist of the 24 one-hour dispatch periods based on tomorrow’s hourly load forecasts. When a given trading period opens, offers
are submitted and generation is allocated and priced by the market for each of the 24 dispatch periods.
These 24 dispatch periods could be handled simultaneously or sequentially. The markets may even be
set up as a sequence of iterations where sellers are permitted to revise offers and see updated dispatch
and price schedules. When the trading period closes, an allocation and price schedule will have been
determined for each of the 24 dispatch periods. The next trading period would refer to the next day’s
market.
The period number displayed in the upper right corner of each page is the relevant trading period and
dispatch period. For example, period 3-2 is the second dispatch period of the third trading period. If
each trading period has only a single dispatch period (as was the case with all sessions in version 2.0
of POWERWEB) the dispatch period is not displayed.
System Profiles
Each session has a base case power system model and a system profile associated with it. The system
profile specifies the set of parameter modifications, such as load changes, outages, or topological
changes to be applied to the base case model for each period of the session. POWERWEB uses a flexible mechanism to specify which changes apply to which periods. A given set of parameter changes
can be applied to (1) all periods, (2) all dispatch periods for a given trading period, (3) a given dispatch period for all trading periods, or (4) a specific trading period and dispatch period.
Session Parameters
The Session Login page, which appears immediately after entering your username and password, has
an info link to the left of each session and template listed. This link leads to the Session Information
page,7 shown in Figure 7, listing all of the corresponding session parameters currently used by
POWERW EB, including the resource ownership and system profile information. Following is a description of each parameter:
7
The Session Info link on the Admin Main Menu page will also display this page.
12
Figure 7 Session Information Page
13
•
•
•
•
•
•
•
•
•
•
•
•
•
•
•
•
•
•
•
•
•
ID – This numerical identifier is assigned automatically to each session.
Label – The session’s label is the user-visible name which appears at the top of each page and on
the list on the Session Login page.
Description – This is a longer text field typically used to provide a longer description of the session or other notes.
Template? – This is specifies whether or not this session is a template.
Open? – If a template is open, it is available to users for creating other sessions. If a non-template
session is open, users may log in to it if they have been assigned ownership of a resource in that
session (generator, session owner) or if some resources are available for anyone to claim (i.e. ownership assigned to Any User).
Owner – The user who created the session is automatically assigned as the session owner with administrative privileges for that session.
Base System – This power system model specifies the base case to which changes may be applied
on a per-period basis.
Market – This market mechanism is used to allocate generation and set prices throughout the
simulation.
Benchmark Market – This market mechanism is used to compute the competitive solution for each
period in order to compute efficiency and competitive prices.
Persistence – This value determines how long the session data will be kept in the database before
it is automatically deleted. POWERWEB may delete sessions automatically 5 days (or 2 weeks) after they are created if they have not been accessed within the past 24 hours. If you wish to leave
your session in the database longer than 2 weeks, please send your request by e-mail to Ray Zimmerman [email protected].
Mode – The default session mode is Auto-User, meaning that the session advances from one period to the next automatically in response to user input. Other modes, namely Auto-Admin and
Manual, can be selected by a POWERWEB administrator, requiring respectively that the administrator run an auto-control monitor or advance the session manually.
Priority – Session priority determines on a relative scale of 1 to 10 how much CPU time should be
given to this session (10 is maximum priority, 1 is minimum).
Exchange Rate – This factor is multiplied by a participants earnings to compute the actual amount
to be paid to them in the context of a controlled economics experiment.
Reservation Price – This value sets the maximum offer price accepted in the specified market.
Log Detail Level – The default logging level is 3, which keeps a history of the offers, dispatch/price schedules, and optimal power flow results for the final iteration of each period. Level 2
is the same except it does not store power flow results. Levels 1 and 4 are not used.
Number of Trading Periods – See Trading Periods, Dispatch Periods and Iterations above.
Number of Dispatch Periods per Trading Period – Limited to 1 in this version. See Trading Periods, Dispatch Periods and Iterations above.
Number of Iterations per Period - See Trading Periods, Dispatch Periods and Iterations above.
Dispatch Period Length – e.g. 60 minutes for a daily market where each trading period is divided
into 24 one hour dispatch periods.
Creation Timestamp – The date and time the session was created.
State – Before the first trading period opens (e.g. while waiting for ownership of generators to be
assigned) the state is READY, then it changes to RUNNING when the first trading period opens,
and to DONE when the last trading period closes. Other possible states are PAUSED and
ABORTED.
14
•
•
•
Current TP, DP, IT – The currently open trading period, dispatch period and iteration. If the current dispatch period is zero it means that all dispatch periods for the current trading period are
open simultaneously.
Number of Logins/Accesses – The number of times there has been a login or access to this session.
Last Login/Access – The date and time of the last login or access to this session.
The other two tables in Figure 7 display the ownership of each generator and the details of the system
profile for the session. See Reserve Generation on page 18 for an explanation of generators 7, 8,
and 9.
Session Creation
The session creation process is described briefly in Section 2.3 above. This section will attempt to describe in more detail the options provided on the Session Creation page shown in Figure 4. In addition to providing a label and description of the session you are creating, you can set the number of
trading periods to simulate in your session. The maximum number of allowable trading periods is currently set to 250. The exchange rate and reservation price can also be modified. Care must be taken
not to set the reservation price so low that it forces valid offers to be below cost for some units.
As described above, the persistence setting determines how long the session data will be kept in the
database before it is automatically deleted. POWERWEB may delete sessions automatically 5 days (or
2 weeks) after they are created if they have not been accessed within the past 24 hours. If you wish to
leave your session in the database longer than 2 weeks, please send your request by e-mail to Ray
Zimmerman [email protected].
The lower section of the page contains the options for assigning ownership of the generators in the
system. The first pop-up menu allows you to choose which, if any, generator is assigned to you. This
setting takes precedence over the settings below for assigning the ownership of individual generators.
The second pop-up menu specifies the default rule for assigning the ownership of the remaining generators. The pop-up menu for a specific generator can then be set to override this default if desired.
Setting the ownership to Any User leaves the generator unclaimed. This means that anyone can log in
to your session and claim ownership of that generator. This is the standard way to set up a session for
a group of participants. Note: Be considerate. Don’t log in to someone else’s session and claim a generator unless you have the approval of the session owner.
The ownership of a generator can also be assigned to a computer agent which will submit offers
automatically according to a preprogrammed strategy. See Section 0 below for more details on the
available agents. You can even have POWERW EB pick an agent at random from the list of available
agents to assign to a generator. Please note that you are not permitted to assign all generators to
agents. At least one must be a human participant.
A group (see Section 3.1 above) can also be assigned the ownership of a generator. In this case, any
user who is a member of the specified group can represent the generator and submit offers on its behalf.8
When you have completed specifying the parameters you would like for the session, hit the Create
Session from Template button. This will create the session and automatically compute the competi8
Currently, groups must be defined manually by the administrators.
15
tive solution9 for each trading period and dispatch period. This competitive solution is used to compute market efficiency and to compare prices.
3.3 Markets
POWERW EB is designed as a flexible environment for testing various types of auction markets. The
current version implements several single-sided auction markets in which the buyer’s demand is a
fixed amount based on a load forecast. Each seller has a single generator with a minimum and maximum operating capacity whose operating cost is defined by a piece-wise linear function consisting of
three segments with the corresponding marginal cost structure is a series of three blocks, as shown in
the example in Figure 8. For a given trading period and dispatch period, each seller submits a price
offer for each of the three blocks of capacity available from their generator. The auction mechanism
specified for the session then determines allocation and pricing of generation necessary to meet the
forecasted demand. This section describes the modified uniform price auctions employed in the available session templates.
Figure 8 Generator Cost
Uniform Price Auctions
In a uniform price auction, ignoring the effects of the transmission network for the moment, all sellers
receive the same market clearing price for any electricity sold in the auction. Units are chosen so as to
satisfy demand with the lowest priced units available, according to the following procedure. All of the
offers are rank ordered from lowest to highest offer price. Units are included for sale, starting from the
lowest priced unit and moving toward the highest priced unit, until the total buyer’s demand is satisfied. The remaining, higher priced, units are excluded from sale. A single uniform market clearing
price, also called the reigning price, is paid for all units sold.
In the last accepted offer (LAO) auction, the reigning price is set to the offer price of the last (most
expensive) unit chosen for inclusion in the sale. In the first rejected offer (FRO) auction, the reigning
price is set to the offer price of the first (least expensive) unit excluded from the sale.
9
The competitive solution is determined by running the benchmark market on a set of true cost offers from each generator.
16
Locational Adjustments
A uniform price auction is only applicable in an environment where transportation or transmission
costs are negligible. In an electric power system, the generators and the loads are connected by a
transmission network which must be operated at all times in a manner consistent with the laws of
physics governing the flow of electricity. The operation of the network is also constrained by the
physical limitations of the equipment used to generate and transmit the power. This results in two
phenomena which may affect the auction.
A small percentage of the energy produced by the generators is dissipated by the transmission lines.
The amount of power lost depends on the flow in the line and the length of the line, among other
things. Transmission loss implies that the total amount of power the buyer must purchase is slightly
greater than the total demand at the loads and the exact amount is dependent on where the power is
produced.
There are limits on the amount of electric power that can be transmitted from any given location to
any other location. Some of the limits are simple line capacity limits, while others are related to voltage limits, stability limits, or reliability constraints. Congestion occurs when one or more of these
network limits is reached. Congestion implies that some inexpensive generation may be unusable due
to its location, making it necessary to utilize a more expensive unit in a different location.
Adjusted Uniform Price Auctions10
The effects of losses and transmission system constraints are handled by adjusting all offers and prices
by a location specific transmission charge which represents the cost of transporting the electricity
from the respective generating station to some arbitrary reference location. There is a two part transmission charge associated with each line which is divided up between the various generators based on
their individual contributions to the flow in the line. The per-line transmission charges can be explained as follows. The value of the power dissipated by a transmission line is the loss component of
the transmission charge for that line. The congestion component of the transmission charge is precisely the charge necessary to discourage overuse of the line. If there is no congestion, this component
is zero. It is important to note that the transmission charges are dependent on the flow in each transmission line as well as each generator’s contribution to that flow and therefore cannot be computed
before performing the auction. In an adjusted uniform price auction, each generator receives a price
which is specific to its location.
Units are chosen so as to satisfy demand in the least expensive manner while satisfying the operational
constraints of the transmission system. This is done by an optimal power flow (OPF) program which
computes generation allocation as well as the appropriate transmission charges for each generator. The
units selected by the OPF are roughly those given by the following procedure. The appropriate transmission charge is added to the price of each offer, and the offers are ordered from lowest to highest
adjusted offer price. Units are included for sale, starting from the low priced units and moving toward
the higher priced units, until the supply reaches the total buyer’s demand plus transmission losses. The
remaining, higher priced, units are excluded from sale. The reigning price is set to the adjusted price
10
The adjusted uniform price auctions implemented in this version of POWERWEB are listed as EMPIRE 1, last accepted
and EMPIRE 1, 1st rejected. The naming comes from the fact that the offer and price adjustment scheme was first worked
out by Cornell’s EMPIRE research group.
17
of the last accepted or first rejected offer, depending on the auction selected. The price paid for each
unit produced by a given generator is the reigning price minus the corresponding transmission charge.
Reserve Generation
In order to make the ISO’s auction computations more robust, we assume that the ISO can buy power
at just above the reservation price at certain pre-specified points in the network if it runs into a problem trying to serve the load using only the generation offered into the market. Remember, generators
may voluntarily withhold generation by offering it above reservation price. These pre-specified points
in the network can be thought of as interconnections with systems outside the ISO’s region of operation. In practice, it is actually implemented as a set of reserve generators which are normally turned
off. If the ISO cannot find a feasible operating point given the set of generation offers, it will turn on
the reserve generators, which offer power at the reservation price + $5/MWh. Note the three reserve
generators (7, 8, and 9) which are owned by a “Reservation Price” agent shown in Figure 7.
3.4 Agents
The current version of P OWERW EB implements several agents for use with the markets described
above. An agent is a computer algorithm that will automatically submit offers on behalf of a generator
assigned to it. The four agents included in this version of POWERWEB are very simplistic. More intelligent agents are planned for future versions.
Marginal Cost Offer
This agent submits marginal cost offer prices for all available blocks of capacity. The offer is not dependent in any way on offers or earnings from previous periods.
Reservation Price
This agent submits offer prices equal to the reservation price for all available blocks of capacity. The
offer is not dependent in any way on offers or earnings from previous periods. This agent is typically
used to handle reserve generation for the system (see above).
Normally Marginal Cost Offer
The offers submitted by this agent for all available blocks of capacity are chosen randomly with a
normal distribution around the marginal cost values. The variance of the distribution is equal to (x/2)2,
where x is the minimum of: (1) the cost of the 1st block and (2) the reservation price minus the cost of
the last block. The resulting offer is then forced to be non-decreasing and in the range between zero
and the reservation price. The offer is not dependent in any way on offers or earnings from previous
periods.
Random Offer
This agent submits random offers between zero and the reservation price. First the offer price, pj, of
the middle block is chosen from U[0, pres], a uniform distribution between zero and the reservation
18
price. Then for i < j, pi is chosen from U[0, pi+1], and for i > j, pi is chosen from U[pi-1, pres]. The offer
is not dependent in any way on offers or earnings from previous periods.
Greedy Search
This agent starts with a marginal cost offer for each block for the first period. In the subsequent periods, it determines which block was the marginal block. In the second period, it increases the offer on
the marginal block by a small factor. In the remaining periods, if earnings increased from the previous
period, it multiplies the marginal unit by the same factor. If earnings decreased, it multiplies by the
inverse of the factor. Simply put, this agent increases or decreases the offer price of the marginal unit
from the previous period’s offer by some small factor. If earnings increase it continues in the same
direction, otherwise it switches directions. As of version 2.3 of POWERW EB , the size of the step is
randomized.
No Offer
This agent submits zero quantity offers for all available blocks of capacity, effectively withholding all
capacity from the auction. This agent is typically used to handle generators which are out of service.
3.5 System Information
Session owners can select System Info from the Admin Main Menu page to display system one-line
diagrams, network parameters, and power flow data for actual as well as competitive operating points
for each period. The System Info link leads to the System Info Main Menu page, such as the one
shown in Figure 9.
19
Figure 9 System Info Main Menu
Links on this page lead to the System Summary Information page and the One-Line Diagram display, shown in Figure 10 and Figure 11, respectively, for the base system and each period. Power
Flow Summary pages such as the one shown in Figure 12, are also available for the competitive solution for each period and for the actual operating point for all periods that have been completed.
20
Figure 10 System Summary Information Page
The System Summary Information page displays the number buses, loads, generators, transmission
lines, areas, transformers, shunt capacitors, and area inter-ties in the system and the total generation
capacity. At the bottom it lists the changes that have been applied to the base case model for this period. If some changes are applied for all periods, they are included in the base case display. In addition, the system summary information for a solved system includes a summary of the power flow data,
listing some totals and extremes for the system.
21
Figure 11 One-Line Diagram
The One-Line Diagram is a Java™ applet11 which displays a live graphical representation of the
power system network. The display can be zoomed and panned. Pointing to a bus, branch, load, or
generator with the cursor will display the index of the object. For example, in Figure 11, the status box
at the bottom of the applet indicates that the arrow is pointing to generator 5. Double-clicking on a
bus, branch, load, or generator will take you to a Bus Info, Branch Info, Load Info, or Generator
Info page, respectively, with a detailed listing of the parameters for that component, links to all connected components, and, if it is a solved case, any relevant power flow data. Normal on-line generators are shown in green, while reserve generators are displayed in red.
11
Requires a browser with support for Java™ 1.1, such as Netscape 4.x.
22
Figure 12 Power Flow Summary Page
On the Power Flow Summary page, components which are out of service (including unused reserve
generators) are displayed with a gray background and those with parameters which are against their
lower or upper bounds are displayed with a yellow or pink background, respectively. All of the bus,
branch, generator, load, and capacitor indices on this page are links to their respective info pages with
the detailed parameter lists, links to connected components, and specific power flow data.
23
3.6 Session Results
A link on the Admin Main Menu page gives session owners and administrators access to the Session
Results. This page displays a table with competitive and actual system costs, market efficiencies, and
statistics on the deviations from the competitive price for each period.
The Download Session Data link on the left generates a tab-delimited text file which you can save
and import into your favorite spreadsheet or data analysis program. The Receipts link is for printing
out receipts to be signed by participants in experiments with paid subjects. Future versions may offer
more on-line display of session data.
24
Appendix A: POWERWEB Architecture and Implementation
This appendix contains a brief summary description of the architecture and implementation of
POWERWEB. A more complete description can be found in the paper “An Internet-Based Platform for
Testing Generation Scheduling Auctions”, published in the Proceedings of the Hawaii International
Conference On System Sciences, January 6-9, 1998, Kona, Hawaii. This paper is available in PDF
format from the POWERWEB Documentation page. Some additional information and links to relevant
web sites are included on the About POWERWEB… page.
POWERW EB employs a distributed architecture on several different levels. First, it is a client server
architecture, in that all user interaction with POWERWEB is via a web client (a browser, or applet running within a browser) communicating with the POWERWEB server. Second, the POWERWEB server
also has a distributed architecture consisting of several independent processes, such as the web server,
the database server, and the computational server, each of which can be running on different computers. Even the computational server has several parts which need not reside on a single machine.
client machine #1
PowerWeb Server
web browser
main server machine
Java
applet
web server
HTML
document
I
N
T
E
R
N
E
T
client machine #2
web browser
Java
applet
real-time
update server
request
handler
database
server
computational
server
server machine #2
server machine #3
client machine #3
web browser
Java
applet
Key
computer (hardware)
program (software)
Figure 13 POWERWEB Communications Architecture
Figure 13 illustrates the various components of the POWERWEB communications architecture. Currently, the entire POWERWEB server is running on a Sun Ultra 2200, with dual 200 MHz processors.
The web server is an Apache server (see http://www.apache.org/ ) and the database server is mySQL
(see http://www.tcx.se/ ).
25
When a request for a specific URL is transmitted from one of the web clients to the web server, the
server determines whether the URL refers to a static HTML document or to one which must be generated on the fly. In the first case, the web server retrieves the file from the disk and returns it to the client. In the second case, the web server passes the request on to what is referred to here generically as a
“request handler”. This could be a separate program invoked via a CGI or FastCGI protocol, or it
could simply be a server module which runs to produce the document to be returned.
The vast majority of accesses to POWERW EB are processed by a “request handler” which, in turn,
makes requests to the database server. In the current implementation, the “request handler” is a CGI
program written in Perl. All accesses subsequent to login are accompanied by a cookie containing
authentication data which is compared with information provided by the database. The protocol for
communication with the database server is a specialized protocol defined by the developers of mySQL
which uses UNIX sockets for local communication and TCP/IP sockets for remote communication.
The computational server also receives requests from the “request handler” via the HTTP protocol.
Based on the parameters sent with the request, it retrieves the necessary data from the database, runs
the requested computation, and returns the output to the “request handler”. The computational engine
is implemented as a web server with a CGI program that makes database queries and invokes Matlab
programs through a UNIX pipe.
The real-time update server, which is not currently implemented, is needed in order to contact a client
when it needs to be made aware of new information. The standard web protocols facilitate only the
following sequence: a client connects to the server with a request, the server responds and closes connection. The HTTP protocol is a state-less protocol which does not provide the ability for the server to
initiate a communication with a client. One way to overcome this limitation is for the server to keep a
“live” connection to a Java applet running at each active client. This “live” connection must be handled via another server process. A typical use of the update server would be if the user acting as ISO
triggers a recomputation of the dispatch and price schedules, when the computation is completed, the
server would pass a message to the update server to notify the clients to retrieve the new information.
26
Appendix B: Sample Experiment Instructions
PowerWeb Experiment Instructions
Sealed Bid - Last Accepted Offer Auction
Six Sellers
Single Buyer
Introduction
This is an experiment in the economics of decision making. Throughout the experiment, the decisions you make will determine your earnings in dollars and cents. Any money you earn will be yours to keep. Try to make as much money as you
can. Please do not communicate with any of the other participants during the experiment.
The Experiment
In this experiment, you will be one of six sellers of electricity in an auction market in which there is a single buyer with
a fixed demand. You will be matched with the same people throughout the experiment, but you will not know who those
people are. You will each control an electric power generating plant with a maximum output capacity of 60 MW (megawatts). This capacity is divided into three blocks with low, medium, and high costs of production, respectively. The costs
of the generators controlled by your competitors are similar to your costs. The buyer and sellers of electricity are all connected to one another by a transmission network. Each seller is located at a single specific position in the transmission
network. The demand, on the other hand, is dispersed at various locations throughout the network.
The experiment is organized as a sequence of trading periods. In each trading period, you must decide on an offer price
for each of the blocks of your generator's capacity. Offers are submitted by each of the sellers. Then an auction is performed, based on the offers submitted, to determine which units are sold and the market price of electricity at each location
in the network. Units that are sold are paid the market price at their location. You will never receive less than the price
offer you submit.
Submitting an Offer
In each trading period, you will see the Offer Submission page shown in Figure 1. The total system demand and total
system generating capacity are shown in the table at the top of the page. In this experiment, the total demand in each
trading period will be 200 MW, slightly more than half the total generating capacity. In the second table, you will see the
capacity and cost of each block of power available from your generator. All capacities and costs will remain constant
throughout the experiment. Next to the cost for each block is a field for you to enter your offer price. Your offer price is
the minimum price at which you are willing to sell the block. In making your decision, keep in mind that the cost is only
charged to you for those units accepted for sale in the auction. The offer prices must be in increasing order. Any offer at a
price greater than the buyer's reservation price will be automatically excluded from the auction. The reservation price in
this experiment is set to $120/MW-hr. The price you receive for any block which is sold is guaranteed to be no less than
the corresponding offer price.
The size of the first block (the low cost block) determines the minimum operating capacity of your generator. Due to
physical limitations on the generator, it is not possible to operate the generator at less than this output level without shutting it down completely. Therefore, in the auction, the first block from each generator is always completely accepted for
sale or completely excluded from sale. With the remaining blocks it is possible for only part of the block to be sold.
After you have filled in your price offers, hit the Submit Offer button to submit your offer into the auction. Be sure to
double-check your offer before submitting since you will not be able to make changes to your offer after hitting the Submit
Offer button!
27
Figure 1 Offer Submission page
Reviewing the Auction Results
After submitting your offer, please wait until all others have finished submitting their offers and the auction results have
been computed. The results will appear automatically when they are available. The Auction Results page, shown in Figure 2, displays a table with the capacity, the amount sold, the marginal cost, the offer and selling prices, and the earnings
for each block as well as the total amount sold and total earnings for that trading period. The earnings for a given block are
computed as:
earnings = (amount sold) x (selling price - marginal cost of production)
When you have finished reviewing the auction results for a given trading period, hit the Continue link on the left to move
on to the next trading period.
Figure 2 Auction Results page
28
The Auction
When offers have been received from all sellers, a last accepted offer auction is performed to determine which units will
be sold to meet the buyer's demand and at what price. This auction is described, first in a simplified context without the
effects of the transmission network, then as it is implemented in this experiment with the network included.
Simplified Auction (no network)
In a simplified context where the buyer and all of the sellers are at the same location, where there are no network effects,
all sellers receive the same market clearing price for any electricity sold in the auction.
How are units chosen?
Units are chosen so as to satisfy demand with the lowest priced units available, according to the following procedure.
All of the offers are rank ordered from lowest to highest offer price. Units are included for sale, starting from the
lowest priced unit and moving toward the highest priced unit, until the total buyer's demand is satisfied. The
remaining, higher priced, units are excluded from sale.
How is price determined?
A single uniform market clearing price, also called the reigning price, is paid for all units sold. The reigning price is
set to the offer price of the last (most expensive) unit chosen for inclusion in the sale, hence the name last accepted
offer auction.
Complete Auction (with network)
In this experiment, the sellers and the buyer's demands are connected by a transmission network which must be operated at
all times in a manner consistent with the laws of physics governing the flow of electricity. The operation of the network is
also constrained by the physical limitations of the equipment used to generate and transmit the power. This results in two
phenomena which may affect the auction.
Transmission Losses
A small percentage of the energy produced by the generators is dissipated by the transmission lines. The amount of
power lost depends on the flow in the line and the length of the line, among other things. Transmission loss implies
that the total amount of power the buyer must purchase is slightly greater than the total demand and the exact
amount is dependent on where the power is produced.
Congestion
There are limits on the amount of electric power that can be transmitted from any given location to any other location.
Some of the limits are simple line capacity limits and others are more subtle system limits with complex engineering
explanations. Congestion occurs when one or more of these network limits is reached. Congestion implies that some
inexpensive generation may be unusable due to its location, making it necessary to utilize a more expensive unit
in a different location.
The effects of losses and transmission system constraints are handled by adjusting all offers and prices by a location specific transmission charge which represents the cost of transporting the electricity from the respective generating station to
some arbitrary reference location. There is a two part transmission charge associated with each line which is divided up
between the various generators based on their individual contributions to the flow in the line. The per-line transmission
charges can be explained as follows. The value of the power dissipated by a transmission line is the loss component of the
transmission charge for that line. The congestion component of the transmission charge is precisely the charge necessary to
discourage overuse of the line. If there is no congestion, this component is zero. It is important to note that the transmission
charges are dependent on the flow in each transmission line as well as each generator's contribution to that flow and therefore cannot be computed before performing the auction. In this experiment, each generator receives a price which is specific to its location.
29
How are units chosen?
Units are chosen so as to satisfy demand in the least expensive manner while satisfying the operational constraints of
the transmission system. This is done by a complex non-linear optimization program which computes the appropriate
transmission charges for each generating station. The units selected by the optimization program are roughly those
given by the following procedure. The appropriate transmission charge is added to the price of each offer, and the
offers are ordered from lowest to highest adjusted offer price. Units are included for sale, starting from the low priced
units and moving toward the higher priced units, until the supply reaches the total buyer's demand plus transmission
losses. The remaining, higher priced, units are excluded from sale.
How is price determined?
The reigning price is set to the adjusted offer price of the last (most expensive) unit chosen. The price paid for each
unit produced by a given generator is the reigning price minus the corresponding transmission charge.
30
Summary of Important Data
Figure 3 Transmission Network One-Line Diagram
Your Location
Your generator number is displayed at the top of your screen. Please note the position of your generator in Figure 3.
It is very important that you take note of transmission constraints. Constraints may give rise to congestion and could
have a significant impact on the allocation and pricing of units sold in the market.
Your Generation Capacity
The total generation capacity of your generator is 60 MW. This capacity is divided into three blocks of 12, 24, and 24
MW, respectively. Your generator is capable of operating at any output level between 12 MW and 60 MW, or it can
be completely shut down, in which case it incurs no costs. It cannot output between 0 and 12 MW.
Your Generation Costs
The generation capacity of your generator is divided into three blocks, each of which has a different cost of
production. These costs remain constant throughout the experiment and are displayed on the Offer Submission page
(see example in Figure 1).
Your Competitors
There are a total of six sellers in this experiment. Your five competitors have capacities and costs which are similar
to yours. Please note their positions in the diagram in Figure 3.
Total Demand
The total system demand for electric power is a constant 200 MW throughout the experiment and is displayed on the
Offer Submission page. (see example in Figure 1)
Reservation Price
All offers above $120 / MW-hr will be ignored by the buyer.
Exchange Rate
The exchange rate will be announced before the experiment begins. Your cumulative earnings, before and after the
exchange rate, are displayed with the results throughout the experiment.
Number of Trading Periods
Following a few initial practice rounds, the experiment run for 75 trading periods.
31
Appendix C: POWERWEB Change History
Primary Changes Since Version 2.6
•
•
Added timed periods.
Added market share column and moved some columns in some of the history pages.
Primary Changes Since Version 2.5
•
•
•
Moved to a new IBM Netfinity 5100 server running Linux.
Moved from mysql 3.22.x to mysql 3.23.x.
Centralized many configuration options for enhanced portability.
Primary Changes Since Version 2.4
•
•
•
•
•
•
•
•
•
•
•
•
Many of these changes will only be noticed by those with admin privileges.
Added double-sided auctions without networks (last accepted, first rejected and double).
Added support for min down time constraints.
Added markets with standby costs.
Changed required capacity margin from 10% to 5%, made reserve generators kick in at $5 above
reservation price.
Added ability to pre-define gen/load ownership in a session template.
Updated database names/queries for compatibility with mysql-3.23.x.
Modified GreedySearch2x agents to use random step size proportional to avg cost (mean 5%).
Added 3 alternate means of handling supply shortfall.
Added discriminatory auction.
Made it more difficult to accidentally submit an offer of all zero's.
Added hybrid uniform price/discriminatory auction.
Primary Changes Since Version 2.3
•
•
•
•
Adds a two stage market, similar to PJMs proposed market. Only available to PowerWeb administrators at the moment.
Fixed some bugs related to the timing of offer submissions.
Added a Greedy Search 2 agent with many variations.
Added a Market Power agent.
Primary Changes Since Version 2.2
•
•
•
Updated the computational server to use the latest development version of M ATPOWER, which
includes a DC OPF and a much improved MINOS-based solver for the default AC OPF algorithm.
Added some randomness to the step size for the greedy search agent.
Increased the maximum allowable trading periods from 250 to 1000.
32
Primary Changes Since Version 2.1
•
•
Added individual exchange rates in an attempt to equalize payouts in certain experiments. This
feature is available to POWERWEB administrators only.
Upgraded from Matlab 4.2 to Matlab 5.3 for the computational server.
33
Primary Changes Since Version 2.0
•
•
•
•
•
•
Added reserve generation to increase robustness in cases where OPF doesn’t converge.
Implemented multiple dispatch periods (must be bid sequentially) per trading period.
Implemented startup and shutdown costs for generators.
Made changes to the layout of some tables to include startup and shutdown costs. Earnings are
now reported in dollars as opposed to dollars per hour.
Added some navigation links to the System Info pages.
Modified underlying code to allow for multiple generators per node in a future release.
34