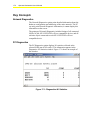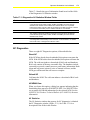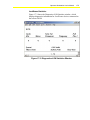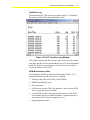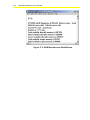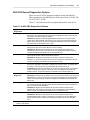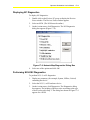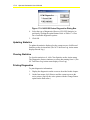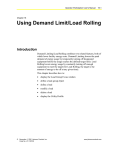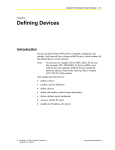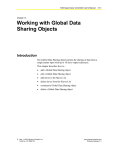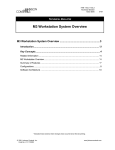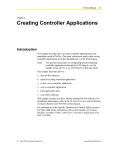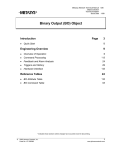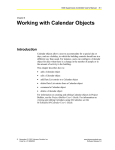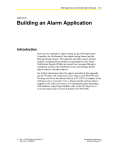
1
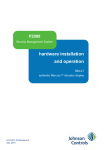
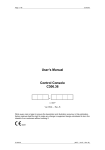
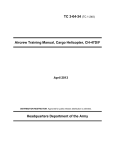
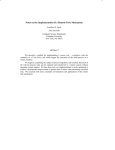
Operator Workstation User’s Manual 17-1 Chapter 17 Using Diagnostics Introduction Use Metasys Diagnostics to troubleshoot the hardware components of the BAS and to check how efficiently the devices are communicating. Perform diagnostics on the network, on an N1 device (OWS or NCM), or on an N2, L2, S2, N2E, or LONWORKS compatible device (that is, DCM, XRL, DSC8500, or FPU). Activate Diagnostics from any OWS (PC or portable) remotely or directly connected to an online Network Control Module (NCM). This chapter describes how to: • print network diagnostics • display PC diagnostics • display NC diagnostics • perform N2/L2/S2 diagnostics • update statistics • clear statistics • print diagnostics © November 1, 2001 Johnson Controls, Inc. Code No. LIT-120159 www.johnsoncontrols.com 17-2 Operator Workstation User’s Manual Key Concepts Network Diagnostics The Network Diagnostics option prints detailed information about the hardware configuration and addressing of the entire network. The PC can only print Network Diagnostic information; it cannot display this information on the screen. The printout of Network Diagnostics includes listings of all connected OWSs, NCMs, N2/L2/S2/N2E/LONWORKS compatible devices, and all software objects connected to each N2/L2/S2/N2E/LONWORKS compatible device. PC Diagnostics The PC Diagnostics option displays N1 statistics collected at the selected OWS (not all N1 traffic). This information appears in the Diagnostics-N1 Statistics window. Figure 17-1 shows an example of this window. Figure 17-1: Diagnostics-N1 Statistics Operator Workstation User’s Manual 17-3 Table 17-1 details the type of information found in each of the fields of the Diagnostics-N1 Statistics window. Table 17-1: Diagnostics-N1 Statistics Window Fields Field Description XMIT The number of communications transmitted over the N1 Direct and RS-232 communication ports (COM1, COM2, COM3, and COM4) since the last time statistics were cleared. These statistics are collected when a PC or portable terminal uses these ports for a dial-up connection to an NCM. If a printer or mouse is connected to the COM1 port, the COM1 transmits are not included. RECV The number of communications received since the last time statistics were cleared ERRORS The number of abnormal conditions received over the N1 Direct and RS-232 communication ports (COM1, COM2, COM3, and COM4) since the last time statistics were cleared. RECONS The total number of reconfigurations since the last time the statistics were cleared. A reconfiguration automatically occurs whenever a node is added to or deleted from the N1 LAN, or changes from offline to online. NC Diagnostics There are eight NC Diagnostics options, all described below. Reset NC If the NCM has already been downloaded, this option warm starts the NCM. If the NCM has not been downloaded, this option cold starts the NCM. The cold start induces a download of BAS code and databases. BAS code consists of Metasys executable files. The databases include system\object records, control processes, and feature information. Both warm and cold resets activate a series of internal self-tests, and the NCM goes offline until the self-tests are complete. Reload NC Cold starts the NCM. The cold start induces a download of BAS code and databases. NOVRAM View When you choose this option, a dialog box appears indicating that the function has been moved to WNCSETUP.EXE. Use WNCSETUP to see or modify NOVRAM information for the selected NCM. See the NCSETUP for Windows Technical Bulletin (LIT-6360251d) for more information. N1 Statistics The N1 Statistics window that appears for NC diagnostics is identical the PC Diagnostics window (Figure 17-1). See Table 17-1 for a description of the fields in this window. 17-4 Operator Workstation User’s Manual N2/L2/S2 Statistics If more than one trunk is defined, NC/L2/S2 Statistics displays a second dialog box for selecting N2/L2/S2 Trunk 1, Trunk 2, or both. Select a trunk and click OK. The N2 Statistics window appears (Figure 17-2). Figure 17-2: N2/L2/S2 Statistics Window Table 17-2 describes the information presented in the N2 Statistics window fields. The first line displays trunk totals rather than data specific to one device. For example, the Polls column in the first line displays the total number of polls from the NCM to all devices on the trunk. Table 17-2: N2 Statistics Window Fields Field Description System\ Object Name System\object name of the device connected to the trunk. For the trunk totals line (the first line), this field is blank N2 Address Address of the device on the trunk. For the trunk totals line, only the trunk number appears Clear Date Date and time that N2 statistics were last cleared for the device Polls Number of polls from the NCM to the hardware device since the last time statistics were cleared Commands Number of requests from the NCM to the device since the last time statistics were cleared Off Polls Total number of offline polls from the NCM to the hardware device since the last time statistics were cleared Retries Total number of times the NCM retried communications since the last time statistics were cleared Err Response Total number of errors received Operator Workstation User’s Manual 17-5 LONWORKS Statistics Figure 17-3 shows the Diagnostics-LON Statistics window, which displays diagnostics information for LONWORKS devices connected to the selected NCM. Figure 17-3: Diagnostics-LON Statistics Window 17-6 Operator Workstation User’s Manual Table 17-3 describes the fields in the Diagnostics-LON Statistics window. Table 17-3: LON Statistics Window Fields Field Name Description System\ Object Name System\object name of the device LON Addr, Subnet:Node Address of the device on the trunk. For the trunk totals line, only the trunk number appears. Clear Date Date and time that LONW ORKS statistics were last cleared for the device Polls Number of polls from the NCM to the hardware device since the last time statistics were cleared Cmds Number of requests from the NCM to the device since the last time statistics were cleared Offl. Polls Total number of offline polls from the NCM to the hardware device since the last time statistics were cleared Prog. ID 8 bytes of information identifying the device’s firmware version. May be either an ASCII string or a special format containing manufacturer and device information as defined by the LONMARK interoperability guidelines Neuron ID Unique 48-bit address embedded in the device’s Neuron chip Cache Hits Number of times the NCM has found a Network Variable (NV) value in the poll image cache Cache Misses Number of times the NCM has polled a device to find an NV value Netw. Var. Permanent Number of permanent NVs (mapped BI or MSI software objects, or AI objects with Alarm limits) in the poll image Netw. Var. Temporary Number of temporary NVs in the poll image (AI’s without Alarm limits defined). These are deleted when their time-to-live is up. See the NCSetup for Windows Technical Bulletin (LIT-6360251d) for details on how to define the time-to-live. Poll Cycle Time (*50 ms) Prio 1, 2, and 3 Amount of time it took to poll the NVs of each priority. Multiply the displayed value by 50 milliseconds. Operator Workstation User’s Manual 17-7 Task/Error Log The Diagnostics-NC Task Error Log window (Figure 17-4) contains the contents of the NCM’s detected runtime errors. Figure 17-4: NC Task Error Log Window This window displays the date and time of the error, the error number, error data, and the text associated with the error. For more information on the NC Task Error Log window, see the Troubleshooting Guide Technical Bulletin (LIT-636328). NCM Miscellaneous Data The Diagnostics-NCM Miscellaneous Data window (Figure 17-5) displays information for the selected NC, including: • NCM type and NIM (if the NCM is an NCM200) • EPROM and DRAM release • NC current state • NCM runtime in days (This is the number of days since the NCM was first powered up, not reloaded.) • current NCM allocable and acquired memory usage. (The NCM uses allocable memory to hold the database. Acquired memory is the memory that the features temporarily use.) • startup diagnostic results 17-8 Operator Workstation User’s Manual Figure 17-5: NCM Miscellaneous Data Window Operator Workstation User’s Manual 17-9 N2/L2/S2 Device Diagnostics Options There are two N2/L2/S2 diagnostics options: Reset and Statistics. These options function differently for each type of device: DCM, XM, LC (ILC), FPU, or DSC. Table 17-4 describes how the two options function for each device. Table 17-4: N2/L2/S2 Diagnostics Options Type of Diagnostics Description DCM Diagnostics Reset: If the NCM reads a changed version number from the DCM, the DCM is downloaded. The DCM sanity test is performed. The DCM goes offline during the test, but returns online after the test is complete. N2 Statistics: Displays the following N2 Statistics window for the trunk and device number of the selected DCM. This summary is the same as the N2/L2/S2 Diagnostic window shown previously, except that it displays N2 statistics for the selected DCM only (rather than for all devices on the trunk).* XM Diagnostics Reset: No download occurs. The XM sanity test is performed. The XM goes offline during the test, but returns online when the test is complete. N2 Statistics: Displays the N2 statistics for the trunk and device number of the selected XM. This summary is the same as the one displayed N2 Statistics window, except that it displays N2 statistics for the selected XM only.* ILC Diagnostics Reset: The ILC goes offline, comes back online, and is downloaded. The current status of the outputs is frozen until the download is complete. N2 Statistics: Displays the N2 statistics for the trunk and device number of the selected ILC. This summary is the same as the one displayed in N2 Statistics window, except that it displays N2 statistics for the selected ILC only.* DSC Diagnostics Reset: The C210A or C260A goes offline and returns online after a few seconds. The CS forces a download to the C210A or C260A when it returns online. The adjust value for Priority 2 and override value are downloaded. No internal test occurs. L2 Statistics: Displays the L2 statistics for the trunk and device number of the selected C210A or C260A. This summary is the same as the one displayed in the N2/L2/S2 Statistics window, except that it displays L2 statistics for the selected DSC only.* DSC8500 and FPU Diagnostics Reset: DSC8500 and FPU devices do not have reset capabilities. S2 Statistics: Displays the S2 statistics for the trunk and device number of the selected DSC8500 or FPU. This summary is the same as the one displayed in the N2 Statistics window on the previous page, except that it displays S2 statistics for the selected S2 device only.* ASC Diagnostics Reset: The AHU, UNT, or VAV goes offline, comes back online, and is downloaded. The current status of the outputs is frozen until the download is complete. DC/DR and LCPs do not have reset capabilities. N2 Statistics: Displays the N2 statistics for the trunk and device number of the selected ASC. This summary is the same as the one displayed in the N2 Statistics window, except that it displays N2 statistics for the selected ASC only.* D600 Diagnostics Reset: D600 devices have no reset capabilities. N2 Statistics: Displays the N2 statistics for the trunk and device number of the selected D600 Access Controller. This summary is the same as the one displayed in the N2 Statistics window, except that it displays N2 statistics for the selected D600 only.* * For a description of the fields in the Statistics window, see Diagnostics- N1 Statistics Window Fields earlier in this chapter. 17-10 Operator Workstation User’s Manual Detailed Procedures Printing Network Diagnostics To print network diagnostics: 1. Select the name of the network on the map. 2. On the Action menu, click Diagnostic. The Network Diagnostics dialog box appears (Figure 17-6). Figure 17-6: Network Diagnostics Dialog Box 3. Click OK to send the diagnostics to the currently active printer. (Specify the active printer with the Change Printer option on the Item menu.) Displaying PC Diagnostics To display PC diagnostics: 1. From the Network Map, select an OWS to use to perform diagnostics. 2. On the Action menu, select Diagnostic. The following PC Diagnostics dialog box appears (Figure 17-7). Figure 17-7: PC Diagnostics Dialog Box 3. Click OK. The Diagnostics-N1 Statistics window appears. Operator Workstation User’s Manual 17-11 Displaying NC Diagnostics To display NC diagnostics: 1. Double-click on the Devices PC group to display the Devices Focus window. The Devices Focus window appears. 2. Select an NCM. (The NCM must be online.) 3. On the Action menu, click Diagnostics. The NC Diagnostics dialog box appears (Figure 17-8). Figure 17-8: Network Map-Diagnostics Dialog Box 4. Select one of the options and click OK. Performing N2/L2/S2 Diagnostics To perform N2, L2, or S2 diagnostics: 1. Display any summary (for example, System, Offline, Critical) containing the device. 2. Select the N2, L2, or S2 hardware device. 3. On the Action menu, click Diagnostics. The Diagnostics dialog box appears. The heading of the box varies according to the type of device selected in Step 2. The dialog box shown in Figure 17-9 appears for a DCM. 17-12 Operator Workstation User’s Manual Figure 17-9: N2/L2/S2 Device Diagnostics Dialog Box 4. Select the type of diagnostics (Reset or N2/L2/S2 Statistics) to perform by clicking the option button. Refer to Table 17-4 for a list of available diagnostics options. 5. Click OK. Updating Statistics To update the statistics displayed on the current screen, click Reread Statistics on the Action menu. (The NC Task/Error Log Action menu displays Reread Log.) Clearing Statistics To clear the statistics to 0, click Clear Statistics on the Action menu. The Diagnostics feature continues to collect data starting from 0. (The NC Task/Error Log Action menu displays Clear Log.) Printing Diagnostics To print diagnostics information: 1. Display the diagnostics on the screen as described in this chapter. 2. On the Item menu, click Print to send the current screen to the active printer. (Specify the active printer with the Change Printer option on the Item menu.)