1
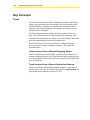
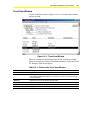
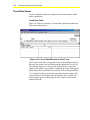
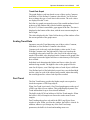
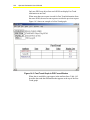
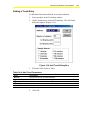
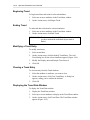
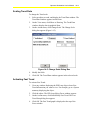
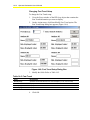
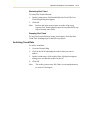
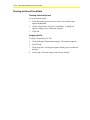
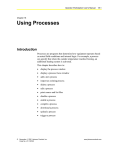
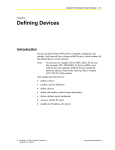
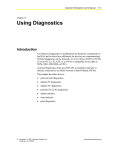
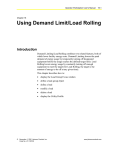
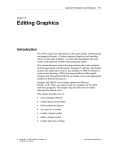
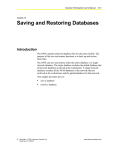
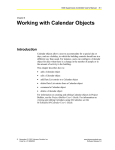
Operator Workstation User’s Manual
14-1
Chapter 14
Using Trend
Introduction
The trend data is collected by the NCM and displayed in a graph or
table at the OWS. This chapter describes how to:
•
display the trend item window
•
add a trend entry
•
begin trend
•
end trend
•
modify a trend entry
•
clear a trend entry
•
display a trend data window
•
scale trend data
•
refresh trend data
•
activate fast trend
•
archive trend data
•
clear archived trend data
© August 1, 2001 Johnson Controls, Inc.
Code No. LIT-120178
www.johnsoncontrols.com
14-2
Operator Workstation User’s Manual
Key Concepts
Trend
The Trend feature differs from the Point History feature in that Point
History data collection has a fixed attribute list, fixed sample period,
and fixed number of samples. In contrast, the Trend feature allows
operators to specify the attributes to be trended, the sample interval,
and the number of samples.
The Trend feature monitors changes in object attribute values over
time. The Trend feature answers questions like the following: How
constant is the temperature in a certain area of the building? How often
does the temperature get close to the warning limit?
The Trend feature can be accessed from any window displaying
objects or from a Reports Destination summary. The options are
described below.
Trend Accessed from a Window Displaying Objects
When accessed from a Network Map, an Object Focus window, or a
summary displaying objects, the Trend feature displays online data for
up to seven objects. The trend data is collected by the NCM and stored
in an NCM buffer.
Trend Accessed from a Reports Destination Summary
When accessed from a Reports Destination summary (a summary of
reports sent to a PC file), the Trend feature displays archived data for
objects that have trend data sent to the PC file.
Operator Workstation User’s Manual
14-3
Trend Item Window
Use the Trend Item window (Figure 14-1) to access the Data window
and set up trend.
Figure 14-1: Trend Item Window
Table 14-1 details the information found in the Trend Item window.
When accessed from a Reports Destination summary, Status and Total
NC Samples fields do not appear.
Table 14-1: Fields in the Trend Item Window
Field
Description
Status
Displays the status of trend collection for the attribute: No Trend, Began, End
Item
Displays the name of the object whose attributes are being trended. If accessed
from a Reports Destination summary, the network, PC group, and system names
are also indicated
Attribute
Displays the name of the attribute being trended
Display Units
Displays the display units for the attribute being trended
Sample Interval
Displays the interval at which the data is sampled
Total NC Samples
Displays the number of trend samples is collected at the NCM
14-4
Operator Workstation User’s Manual
Trend Data Scales
Use the Trend Data window to display the actual trend data in either
table or graph form.
Trend Data Table
Figure 14-2 shows an example of Trend Data organized in table form.
This is the default format.
Figure 14-2: Trend Data Window in Table Form
Each column in the table corresponds to one of the attributes listed at
the top of the window and is labeled with the appropriate ID (A to G).
The columns display the values for the attribute at the various time
samples. When data is unavailable at sampling, the value field appears
blank. When data is unreliable (for example, if the NCM goes offline),
????? appears. Each row in the table represents one time sample. The
column on the far left displays the time and date of the sample. The
trend samples appear in chronological order, with the most current
samples at the top.
Operator Workstation User’s Manual
14-5
Trend Data Graph
The graph displays each item based on one of three scales: Common,
Individual, or User Defined. Common is the default. You’ll find out
how to change the type of scale later in this section. The scale values
are displayed on the Y-axis.
Each line in a graph corresponds to one of the trended attributes listed
at the top of the window and is labeled with the appropriate
ID (A to G). If data is unavailable, gaps appear in the line. The time is
displayed at the bottom of the chart, with the most current samples on
the far right.
The values displayed in the Value field at the top of the window reflect
the current position of the graph cursor.
Scaling Trend Data
Operators can scale Trend data using one of three scales: Common,
Individual, or User Defined. Common is the default.
Common scale is the only scale that displays values on the Y-axis.
With the Common scale, the high and low values are based on the
overall high value and overall low value for all of the objects being
trended. The middle value displayed on the Common scale graph is the
mid range between the highest and lowest value that any of the objects
have reached.
Individual scale determines the highest and lowest values for each
attribute being trended. The highest value on the graph will be the
same for all objects, even if the high values of each object is different.
User Defined scale is like Individual except it has a user-defined high
and low value for each of the objects being trended, rather than using
the actual high and low values each object has reached.
Fast Trend
The Fast Trend feature provides the higher sample rate required to
check the response of PID Loop objects.
When Fast Trend is activated, a Fast Trend graph appears at the top of
a PID Loop Object Focus window. This graph displays dynamic Fast
Trend information for up to four selected attributes.
The buffer in the NCM can hold up to 180 Fast Trend samples. When
the buffer is full, old samples are removed to make room for new
samples.
Fast Trending takes place only while the PID Loop Object Focus
window is open. When you close the window, the buffer is cleared. In
addition, whenever you change any of the Fast Trend setup
parameters, the buffer is cleared and trending starts over.
14-6
Operator Workstation User’s Manual
Only one PID Loop object from each DCM can display Fast Trend
information at one time.
When more than one request is made for Fast Trend information from
the same DCM, the most recent request overrides the previous request.
Figure 14-3 shows an example of a Fast Trend graph.
Figure 14-3: Fast Trend Graph in PID Focus Window
When data is unreliable, gaps appear in the attribute lines. Table 14-2
describes the trend data information that appears at the top of the Fast
Trend graph.
Operator Workstation User’s Manual
14-7
Table 14-2: Fast Trend Graph Fields
Field
Description
Attribute
Displays the name of the attribute being trended
Date and Time
Displays the date and time of the sample
Value
Displays the value of the attribute at the time sample indicated by the current graph
cursor position. When you move the graph cursor to another time sample position,
the value in this field updates.
If the graph cursor is moved to a time sample when the data is unreliable, this field
displays ?????.
Display Low
Displays the minimum displayed value. Lesser values appear as the minimum
value.
Display High
Displays the maximum displayed value. Greater values appear as the maximum
value.
Default Fast Trend Settings
When operators first activate a Fast Trend graph, it uses a default
setup. The default period length is six seconds, meaning that the
attributes are sampled every six seconds. Table 14-3 shows the default
Fast Trend setup.
Table 14-3: Default Fast Trend Attributes
Attribute
Display Low
Setpoint
Display High
30.0
80.0
Output
0.0
100.0
Feedback
30.0
80.0
Archiving Trend Data
Operators can archive any current trend data for all of the objects on
an NC. This prevents any data not yet archived from being lost during
an NCM download.
When you initiate the archive, both trend and totalization data for the
NC are archived.
Clearing archived trend data deletes it from the Reports Destination
summary (PC file). This option is only available in a Trend Item
window accessed from a Reports Destination summary.
14-8
Operator Workstation User’s Manual
Detailed Procedures
Displaying the Trend Item Window
Displaying the Trend Item Window from the Network Map
To display the Trend Item window from the Network Map:
1.
Click a system on the map.
2.
On the Go To menu, click Trend. The Trend Item window appears
(Figure 14-1).
Displaying the Trend Item Window from a Window
Displaying Objects
To display the Trend Item Window from a window displaying objects:
1.
Display the summary or Focus window.
Note:
If you are using an Object Focus window, skip step 2.
2.
Select the system name in the stair-step directory or select an
object.
3.
On the Go To menu, click Trend. The Trend Item window
appears (Figure 14-1).
Displaying the Trend Item Window from a Reports
Destination Summary
To display the Trend Item window from a Reports Destination
summary:
1.
Click the PC file that contains the desired Trend report. The
Reports Destination summary for the selected PC file appears.
2.
Click Trend. The Trend Item window appears (Figure 14-1).
Operator Workstation User’s Manual
Adding a Trend Entry
To add and define trend collection for an object\attribute:
1.
Select an object in the Trend Item window.
2.
On the Action menu, click Add Trend Entry. The Add Trend
dialog box appears (Figure 14-4).
Figure 14-4: Add Trend Dialog Box
3.
Fill in the fields. Refer to Table
Table 14-4: Add Trend Parameters
Field
Description
Attribute
Displays the name of the selected attribute
Number of Samples
Displays the number of samples selected for the attribute
st
1 Display Units
2
nd
Display Units
Sample Interval
st
Displays the number of units for the 1 display attribute
Displays the number of units for the 2
nd
display attribute
Displays the time between the sample interval
4.
Click OK.
14-9
14-10
Operator Workstation User’s Manual
Beginning Trend
To begin trend data collection for selected attributes:
1.
Select one or more attributes in the Trend Item window.
2.
On the Action menu, click Begin Trend.
Ending Trend
To end trend data collection for selected attributes:
1.
Select one or more attributes in the Trend Item window.
2.
On the Action menu, click End Trend.
IMPORTANT: Trends restart when the NCM is downloaded, even if
you have marked the individual object trend as
Ended.
Modifying a Trend Entry
To modify trend entry:
1.
Select an attribute.
2.
On the Action menu, click the Modify Trend Entry. The Add
Trend dialog box for the selected attribute appears (Figure 14-4).
3.
Modify the Display units and Sample Time Interval.
4.
Click OK.
Clearing a Trend Entry
To clear an entry from the Trend database:
1.
Select the attribute or attributes you want to clear.
2.
On the Action menu, click Clear Trend Entry. A dialog box
appears, asking you to confirm the deletion.
3.
Click OK.
Displaying the Trend Data Window
To display the Trend Data window:
1.
Display the Trend Item window.
2.
Select up to seven attributes to display in the Trend Data window.
3.
On the Action menu, click Trend Data. The Trend Data window
appears (Figure 14-2).
Operator Workstation User’s Manual 14-11
Scaling Trend Data
To change the Trend scale:
1.
Select an object to trend, and display the Trend Data window. The
Trend Data window appears in table form.
2.
On the View menu, click Show as Drawing. The Trend Data
windows display data in graphical form.
3.
On the Action menu, click Change Scale. The Change Scale
dialog box appears (Figure 14-5).
Figure 14-5: Change Scale Dialog Box
4.
Modify the fields.
5.
Click OK. The Trend Data window appears in the selected scale.
Activating Fast Trend
To activate Fast Trend:
1.
Go to any window displaying the PID Loop object whose Fast
Trend information you want to view. For example, go to a System
summary displaying the object.
2.
Click the object. The PID Loop Object Focus window appears.
3.
On the Action menu, click Start/Modify Fast Trend. The Fast
Trend Setup dialog box appears.
4.
Click OK. The Fast Trend graph is displayed at the top of the
Focus window.
14-12
Operator Workstation User’s Manual
Changing Fast Trend Setup
To change the Fast Trend setup:
1.
Go to the Focus window of the PID Loop object that contains the
Fast Trend information you want to display.
2.
On the Action menu, click Start/Modify Fast Trend option. The
Fast Trend Setup dialog box appears (Figure 14-6).
Figure 14-6: Fast Trend Setup Dialog Box
3.
Modify the fields. Refer to Table 14-5.
Table 14-5: Fast Trend
Field
Description
Period (secs)
Specifies the interval between Fast Trend samples (1 to 32, 767 seconds)
Name
Displays the name of the attribute
Min. displayed value
Displays the minimum value for the attribute
Max. displayed value
Displays the maximum value for the attribute
4.
Click OK.
Operator Workstation User’s Manual 14-13
Restarting Fast Trend
To restart Fast Trend collection:
1.
On the Action menu, click Start/Modify Fast Trend. The Fast
Trend Setup dialog box appears.
2.
Click OK.
Note:
Because the most recent request overrides all previous
requests, Fast Trend collection stops for any other PID Loop
object from the same DCM.
Stopping Fast Trend
To stop Fast Trend collection, on the Action menu, click Stop Fast
Trend. Fast Trending stops for the PID Loop object.
Archiving Trend Data
To archive trend data:
1.
Go to the Network Map.
2.
Click on the NCM containing the archive data you want to
archive.
3.
On the Action menu, click Archive Data. A dialog box appears
asking you to confirm the archive for the NC.
4.
Click OK.
Note:
The archive process may fail if there is not enough memory
to create a Trend report.
14-14
Operator Workstation User’s Manual
Clearing Archived Trend Data
Clearing Selected Reports
To clear selected reports:
1.
Select the trend report you want to clear. The selected report
appears highlighted.
2.
On the Action menu, click Clear Trend Entry. A dialog box
appears, asking you to confirm the deletion.
3.
Click OK.
Purging the File
To purge all data from a PC file:
1.
Click the Reports Destination summary. The summary appears.
2.
Select Trend.
3.
Click Purge File. A dialog box appears asking you to confirm the
deletion.
4.
Click Purge. All of the reports in the file are deleted.